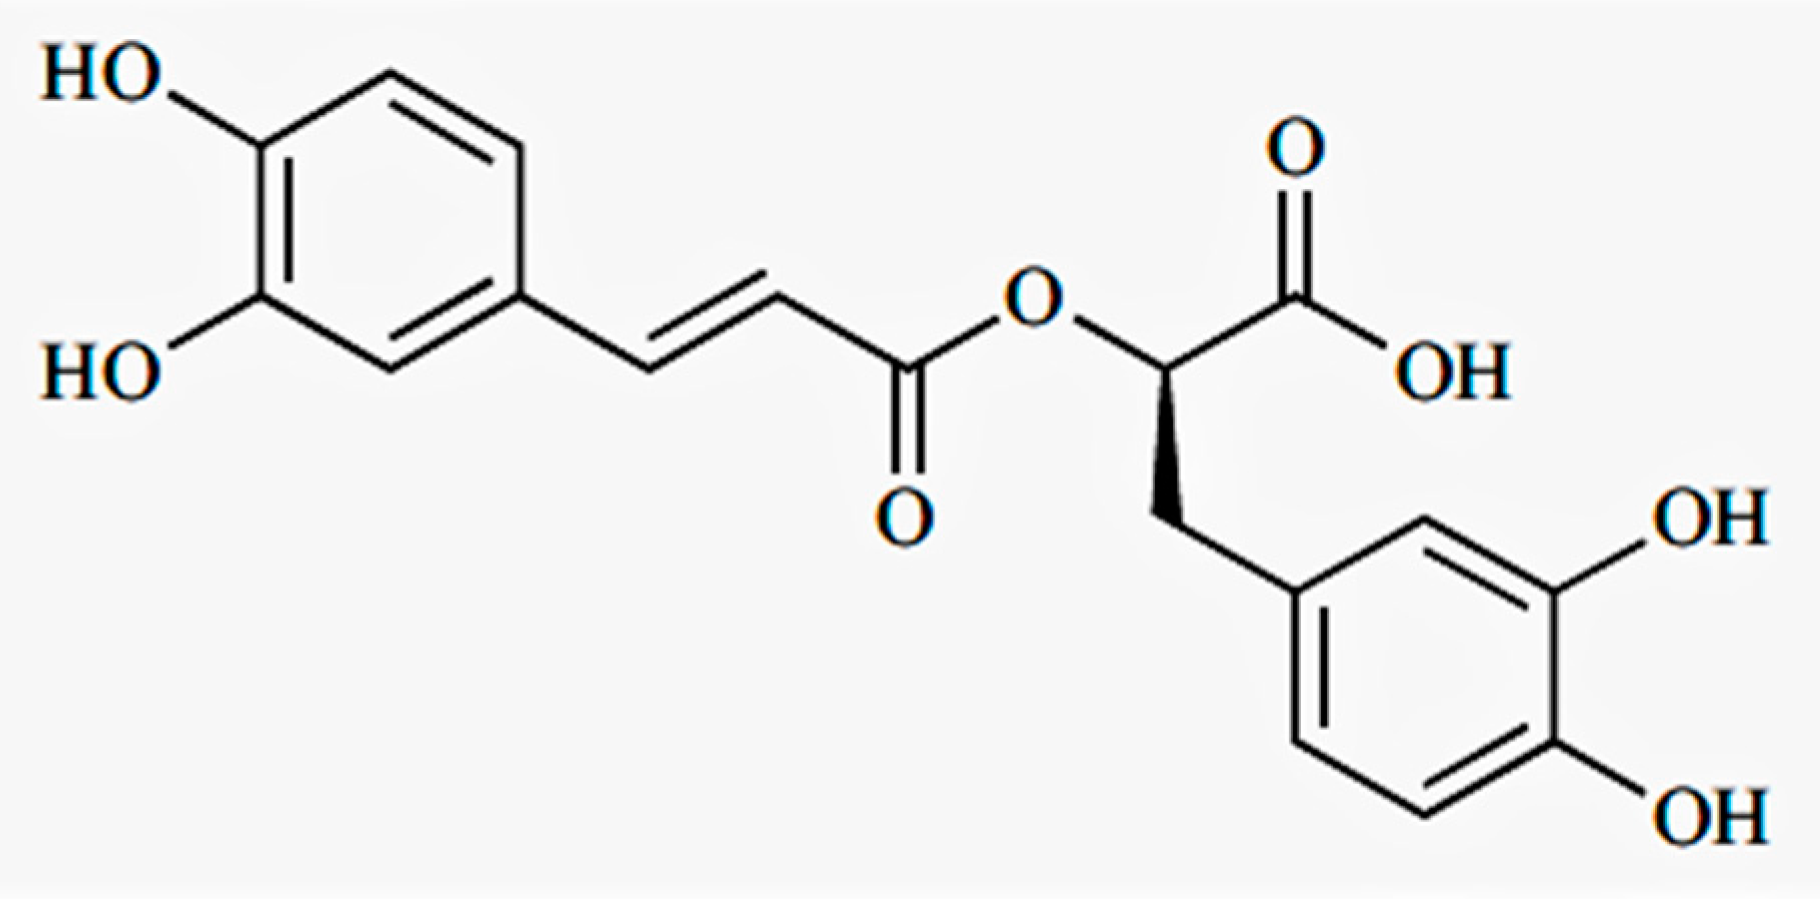
Pharmacokinetic and Pharmacodynamic Properties of Rosmarinic Acid in Rat Cholestatic Liver Injury

 ,
,
Abstract
1. Introduction
2. Results
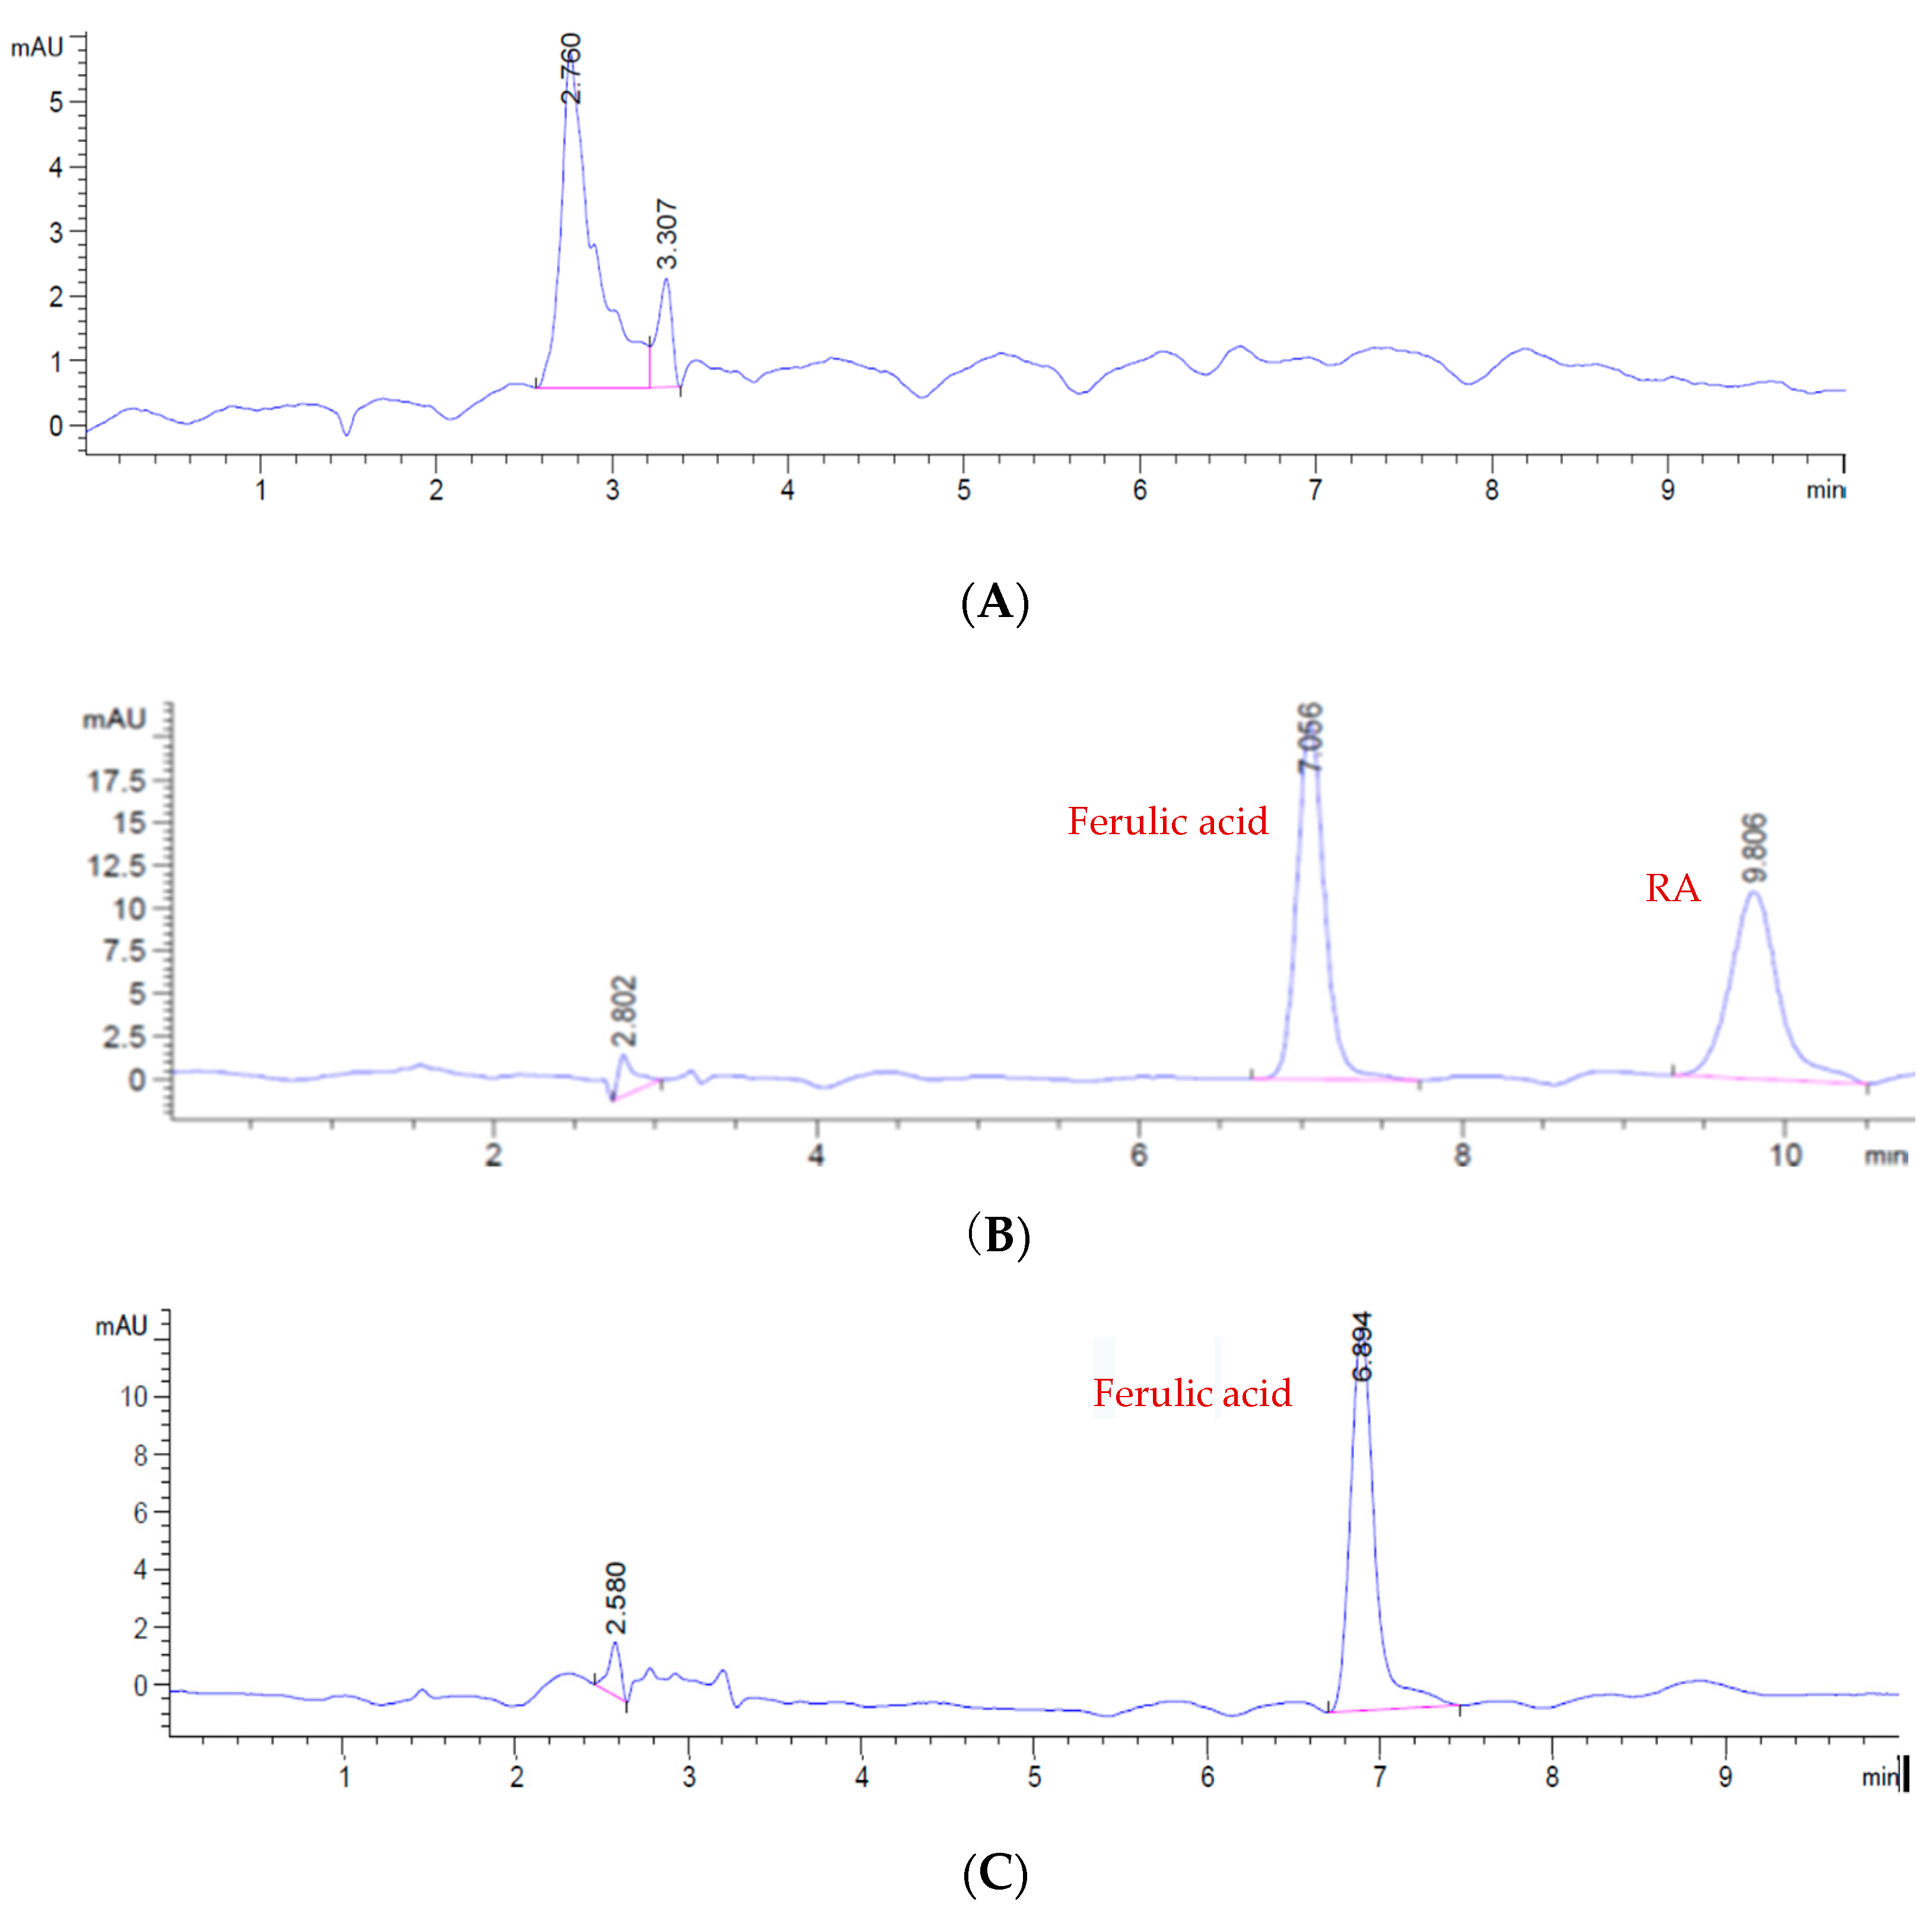
2.1. HPLC Analysis
2.1.1. HPLC Method Validation
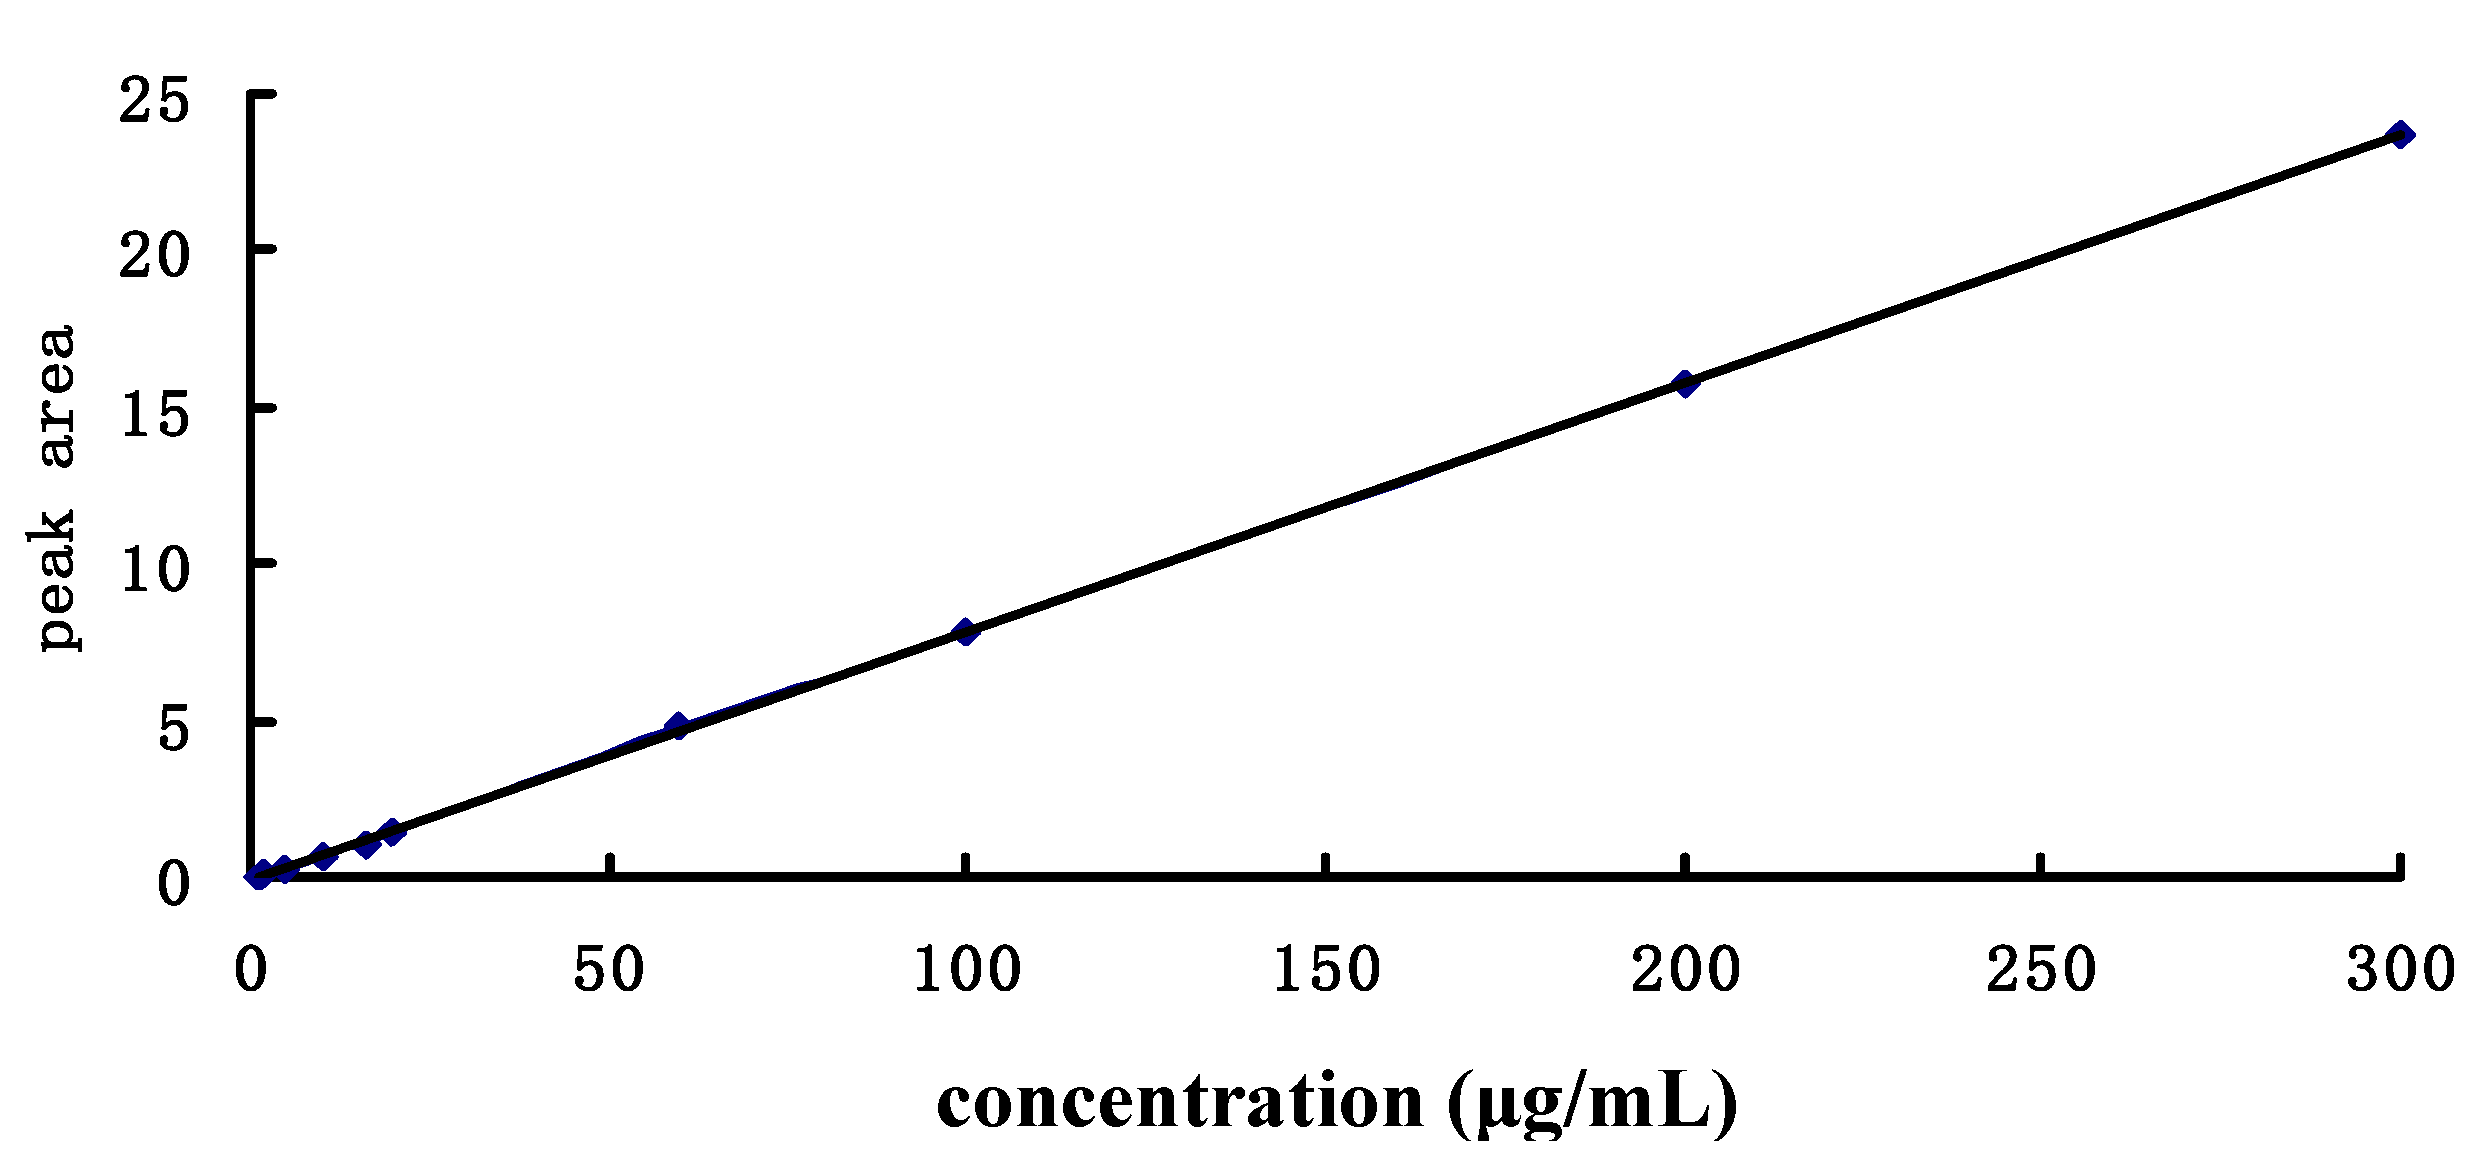
2.1.2. Standard Curve
2.1.3. Precision and Accuracy
2.1.4. Stability
2.1.5. Extraction Recovery
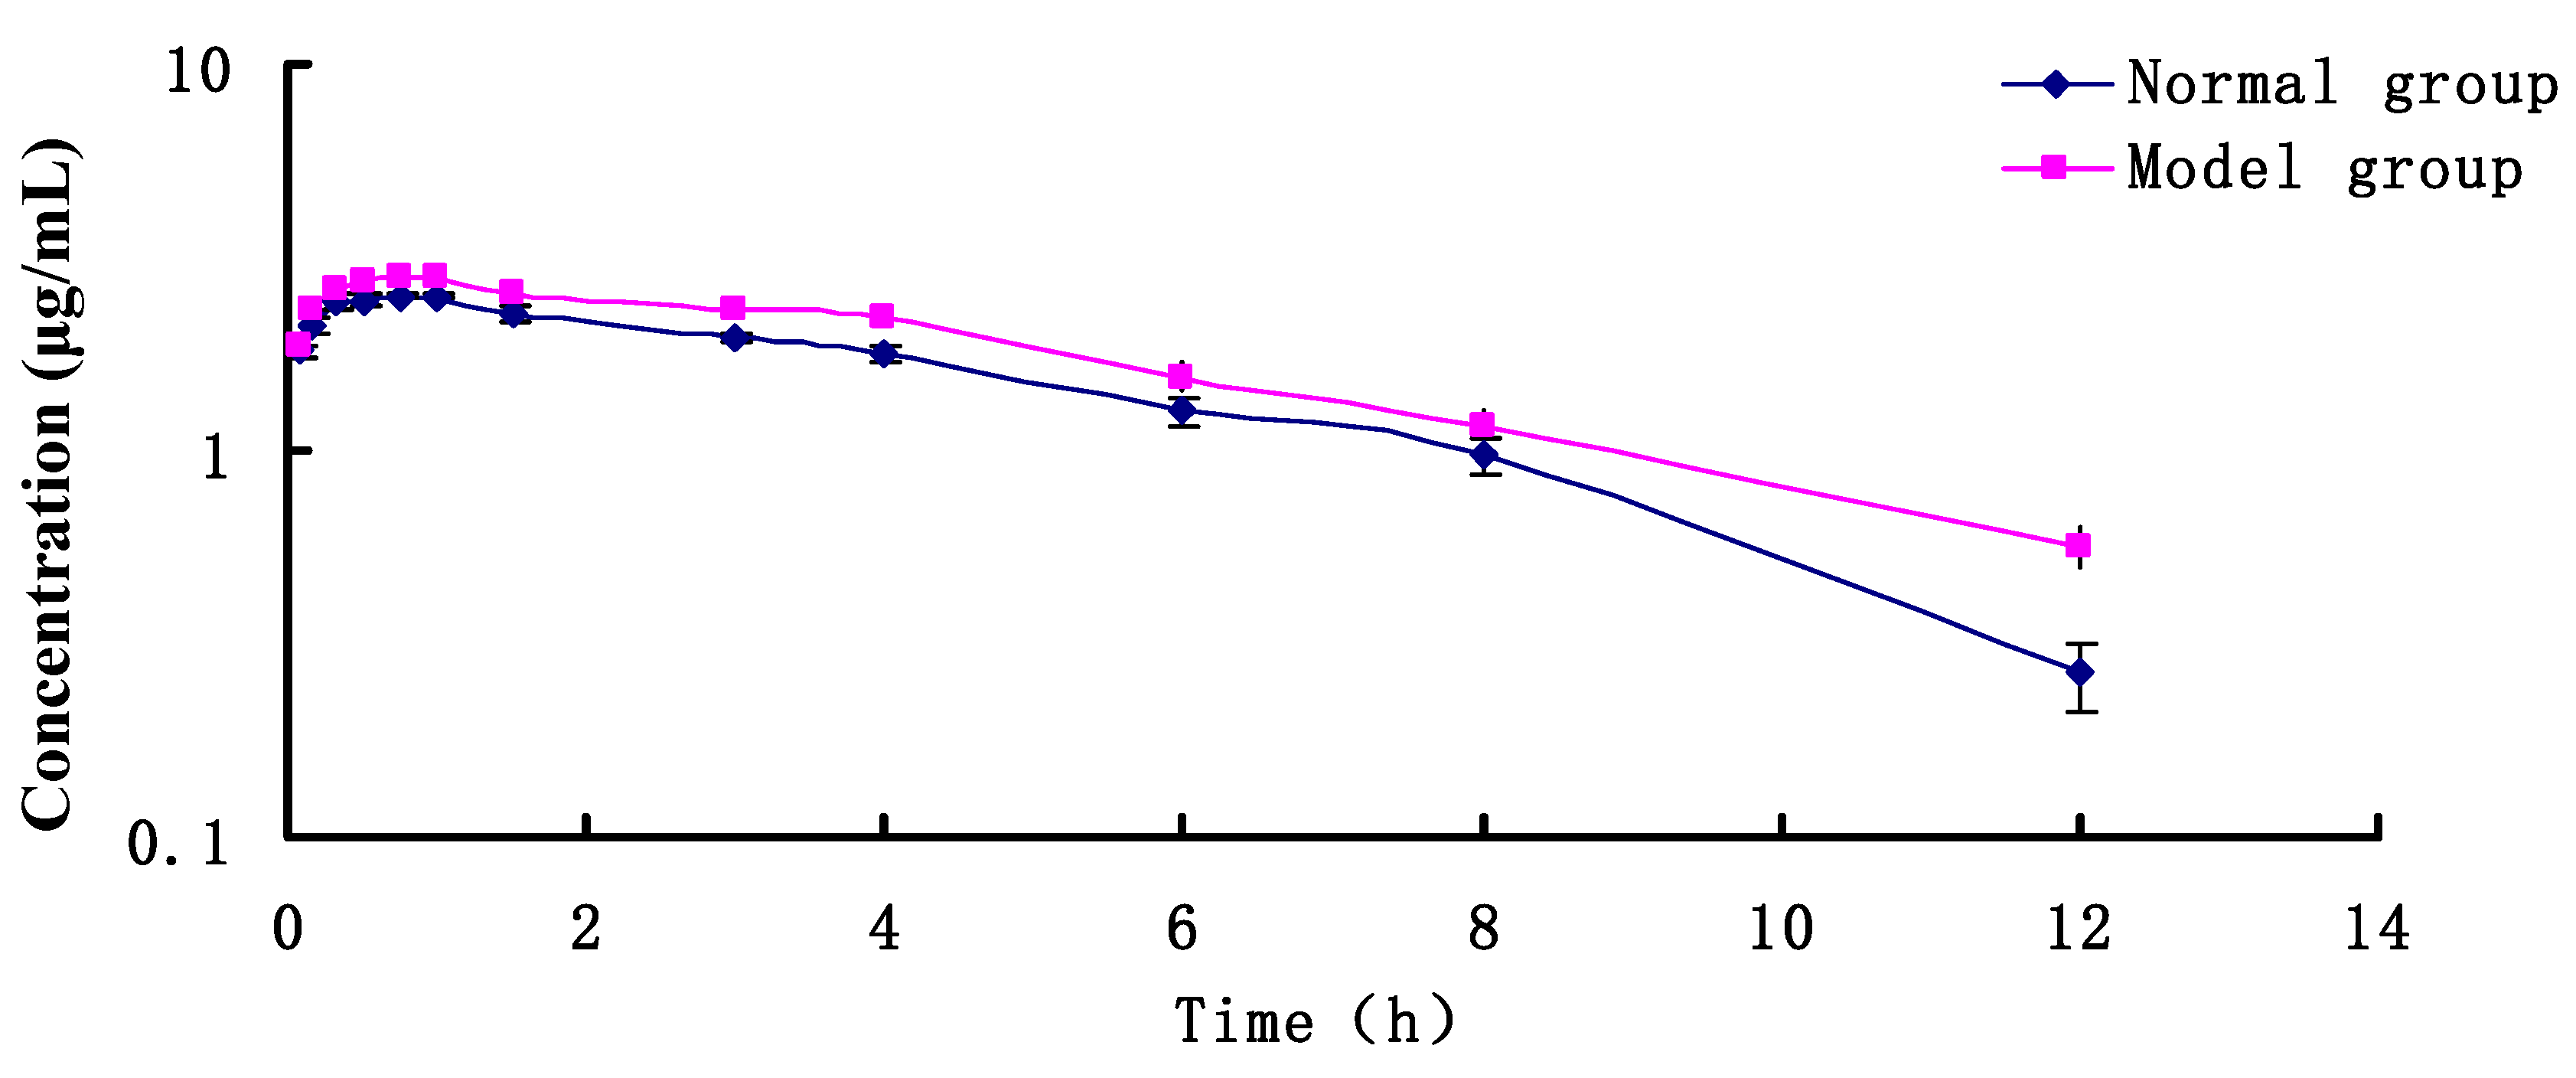
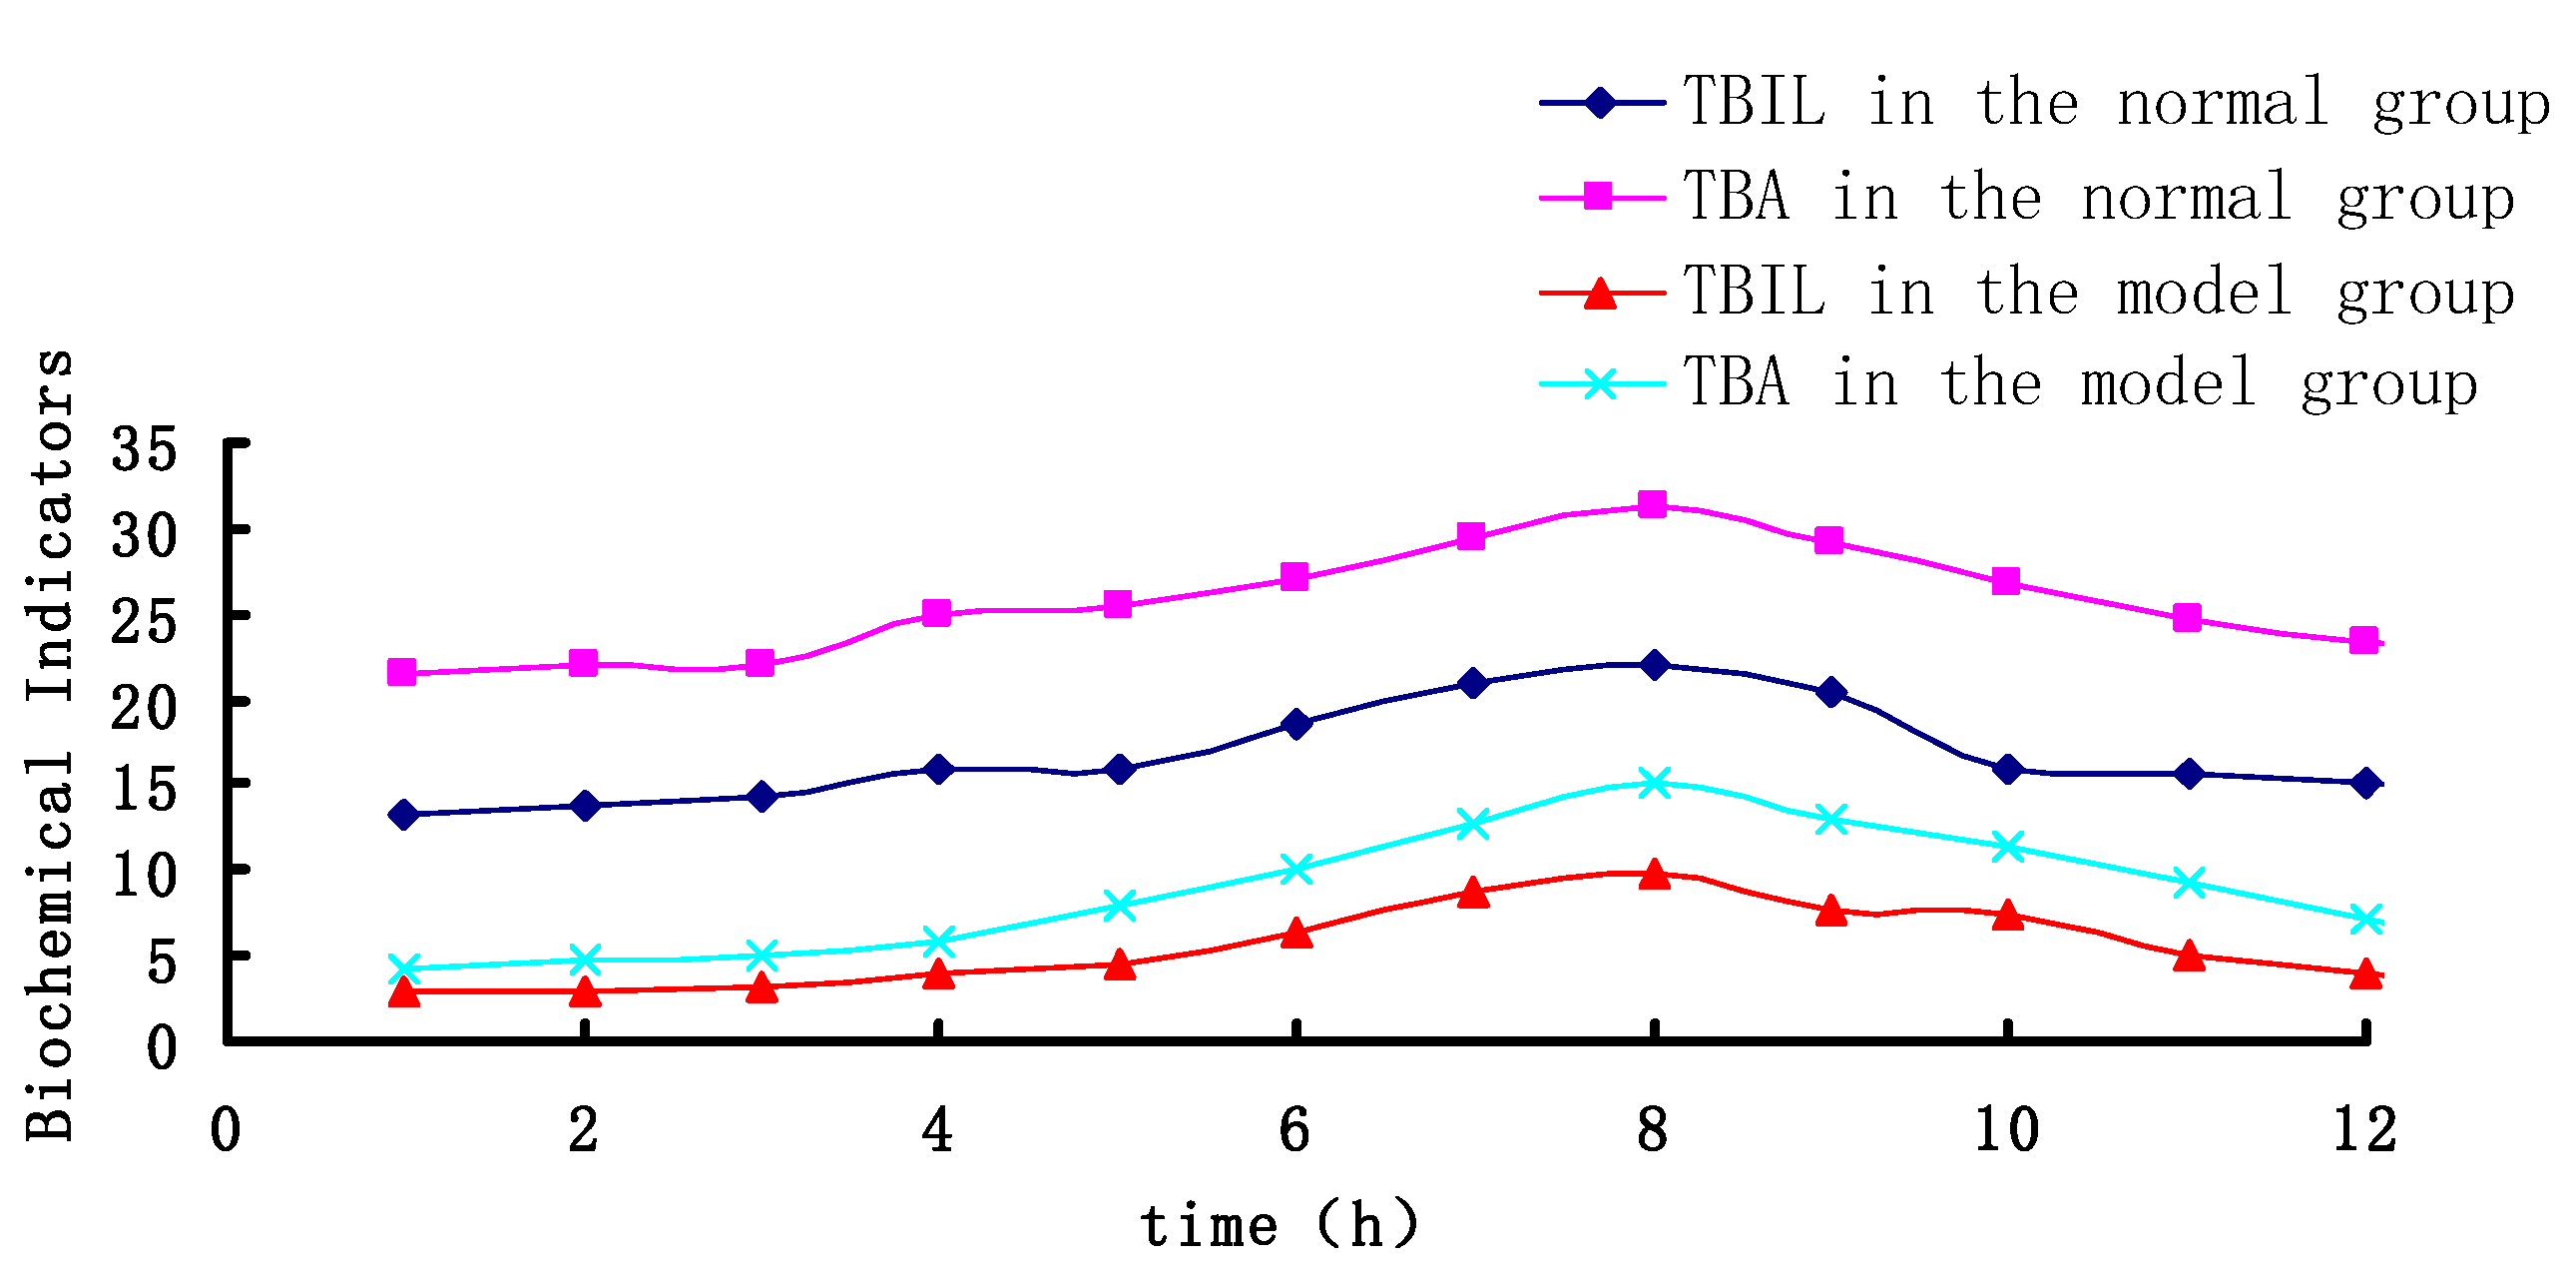
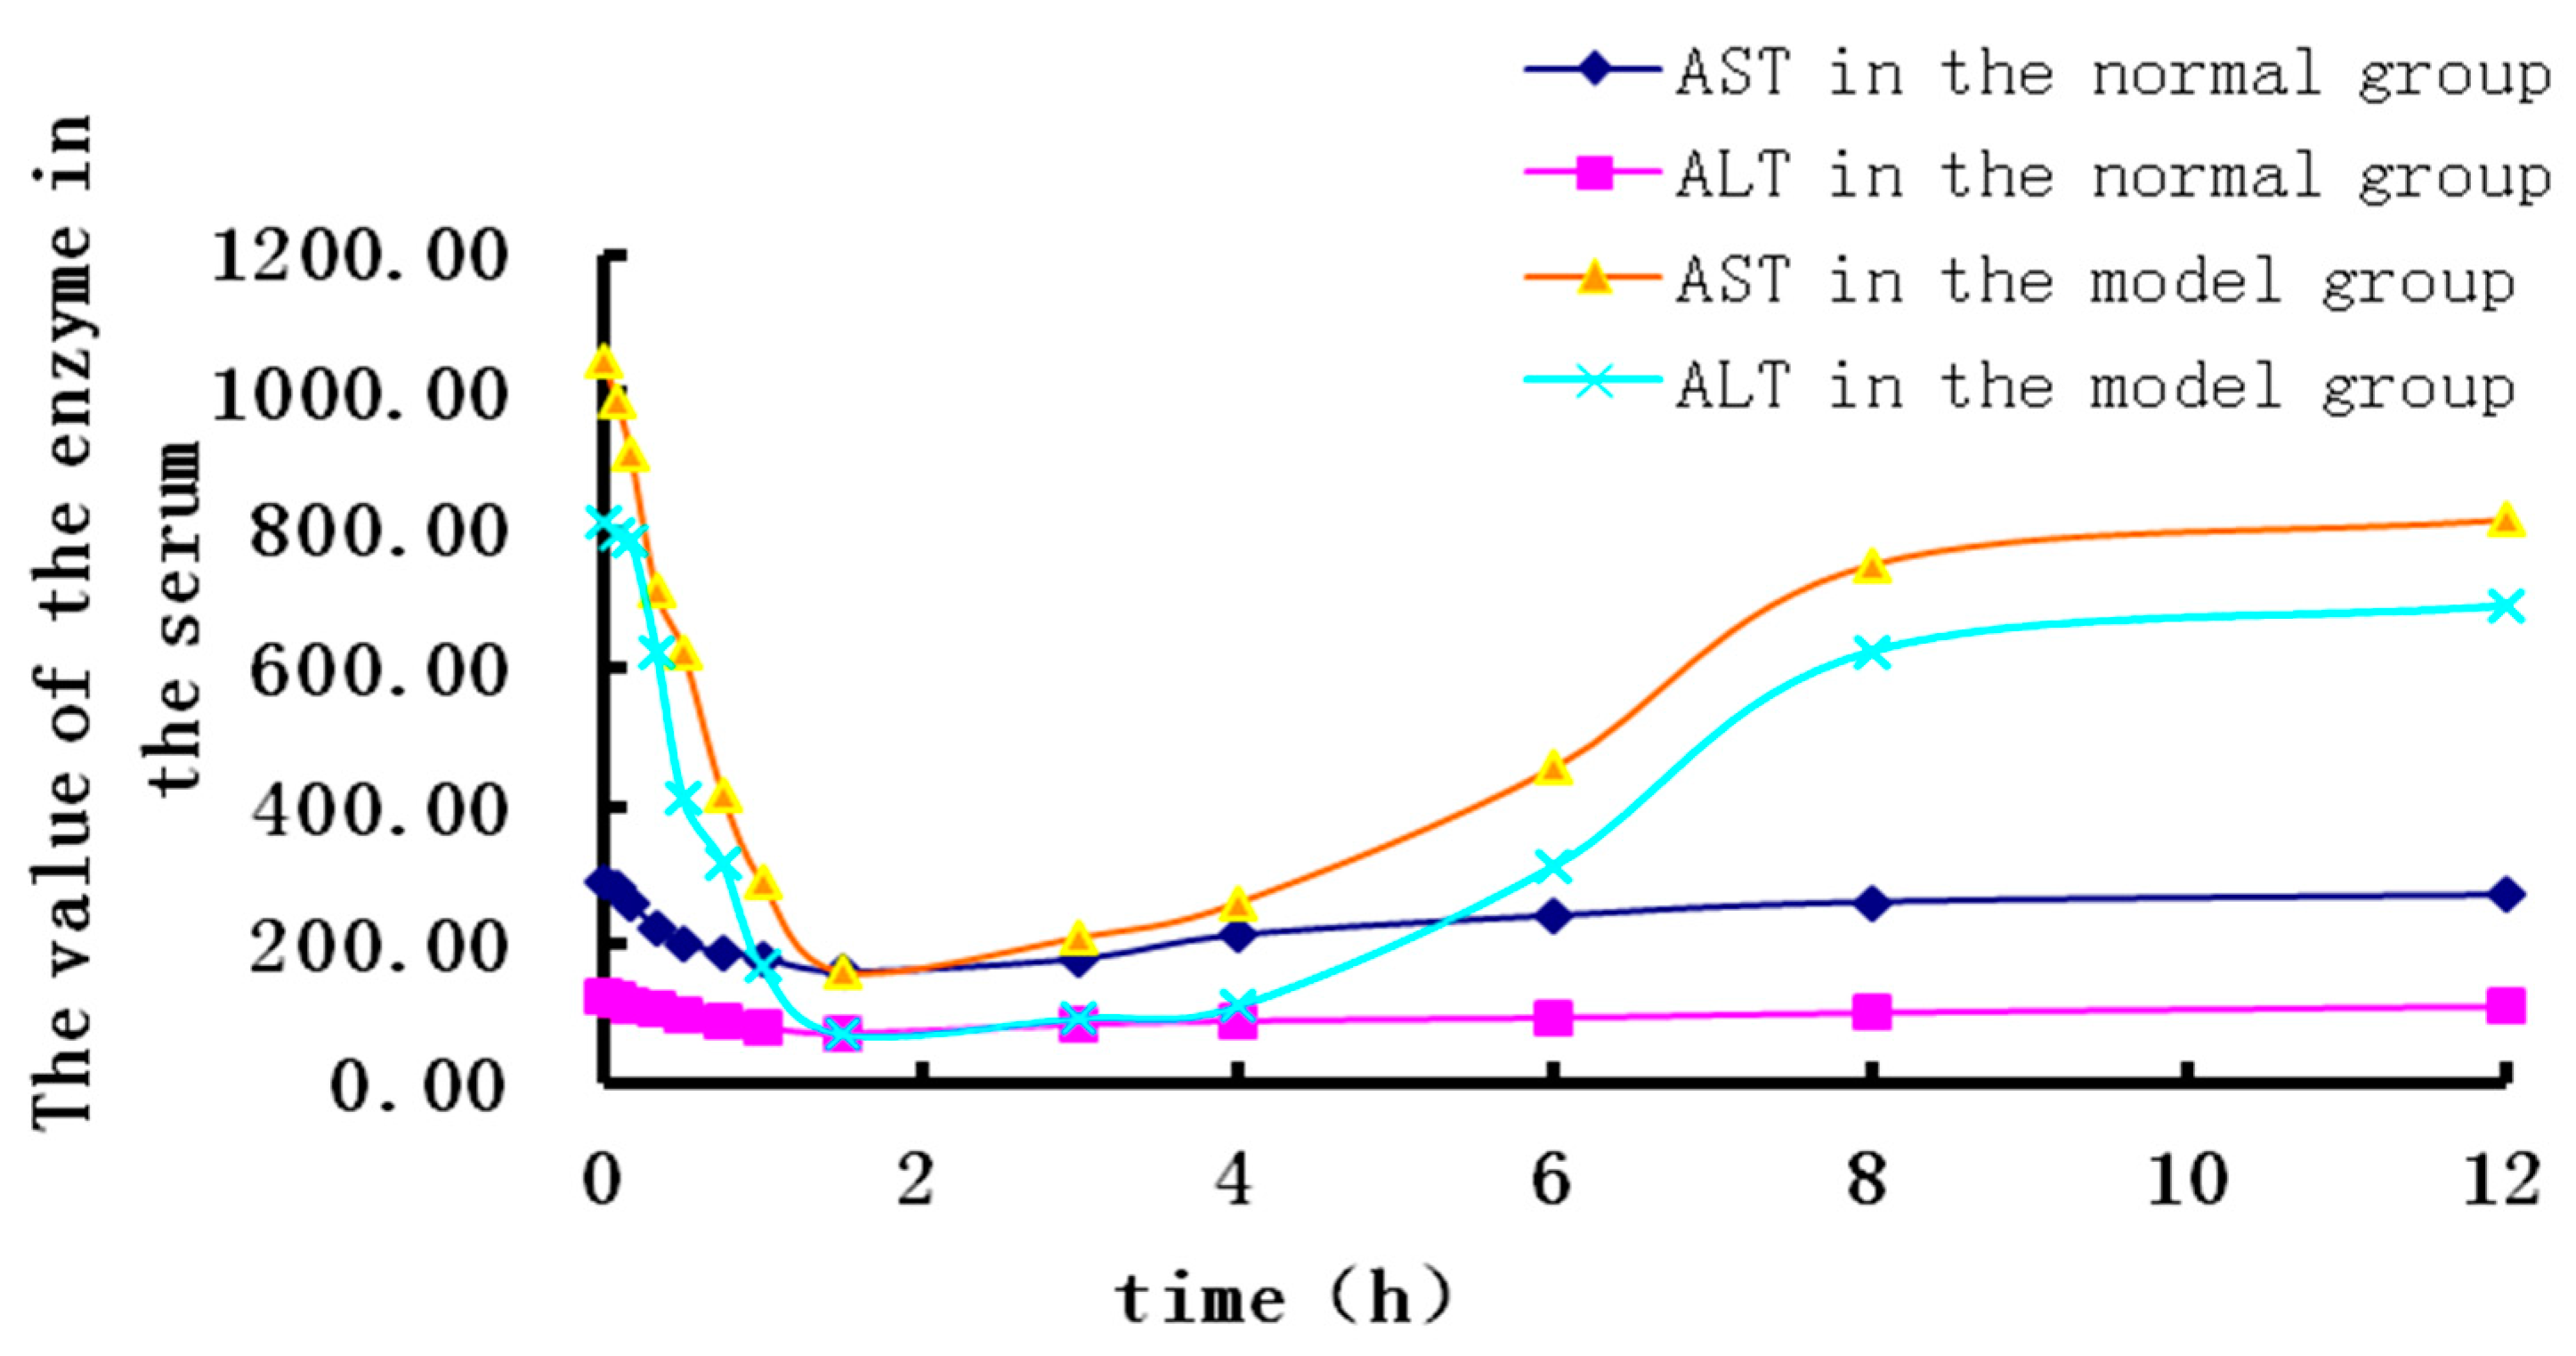
2.2. PK Research
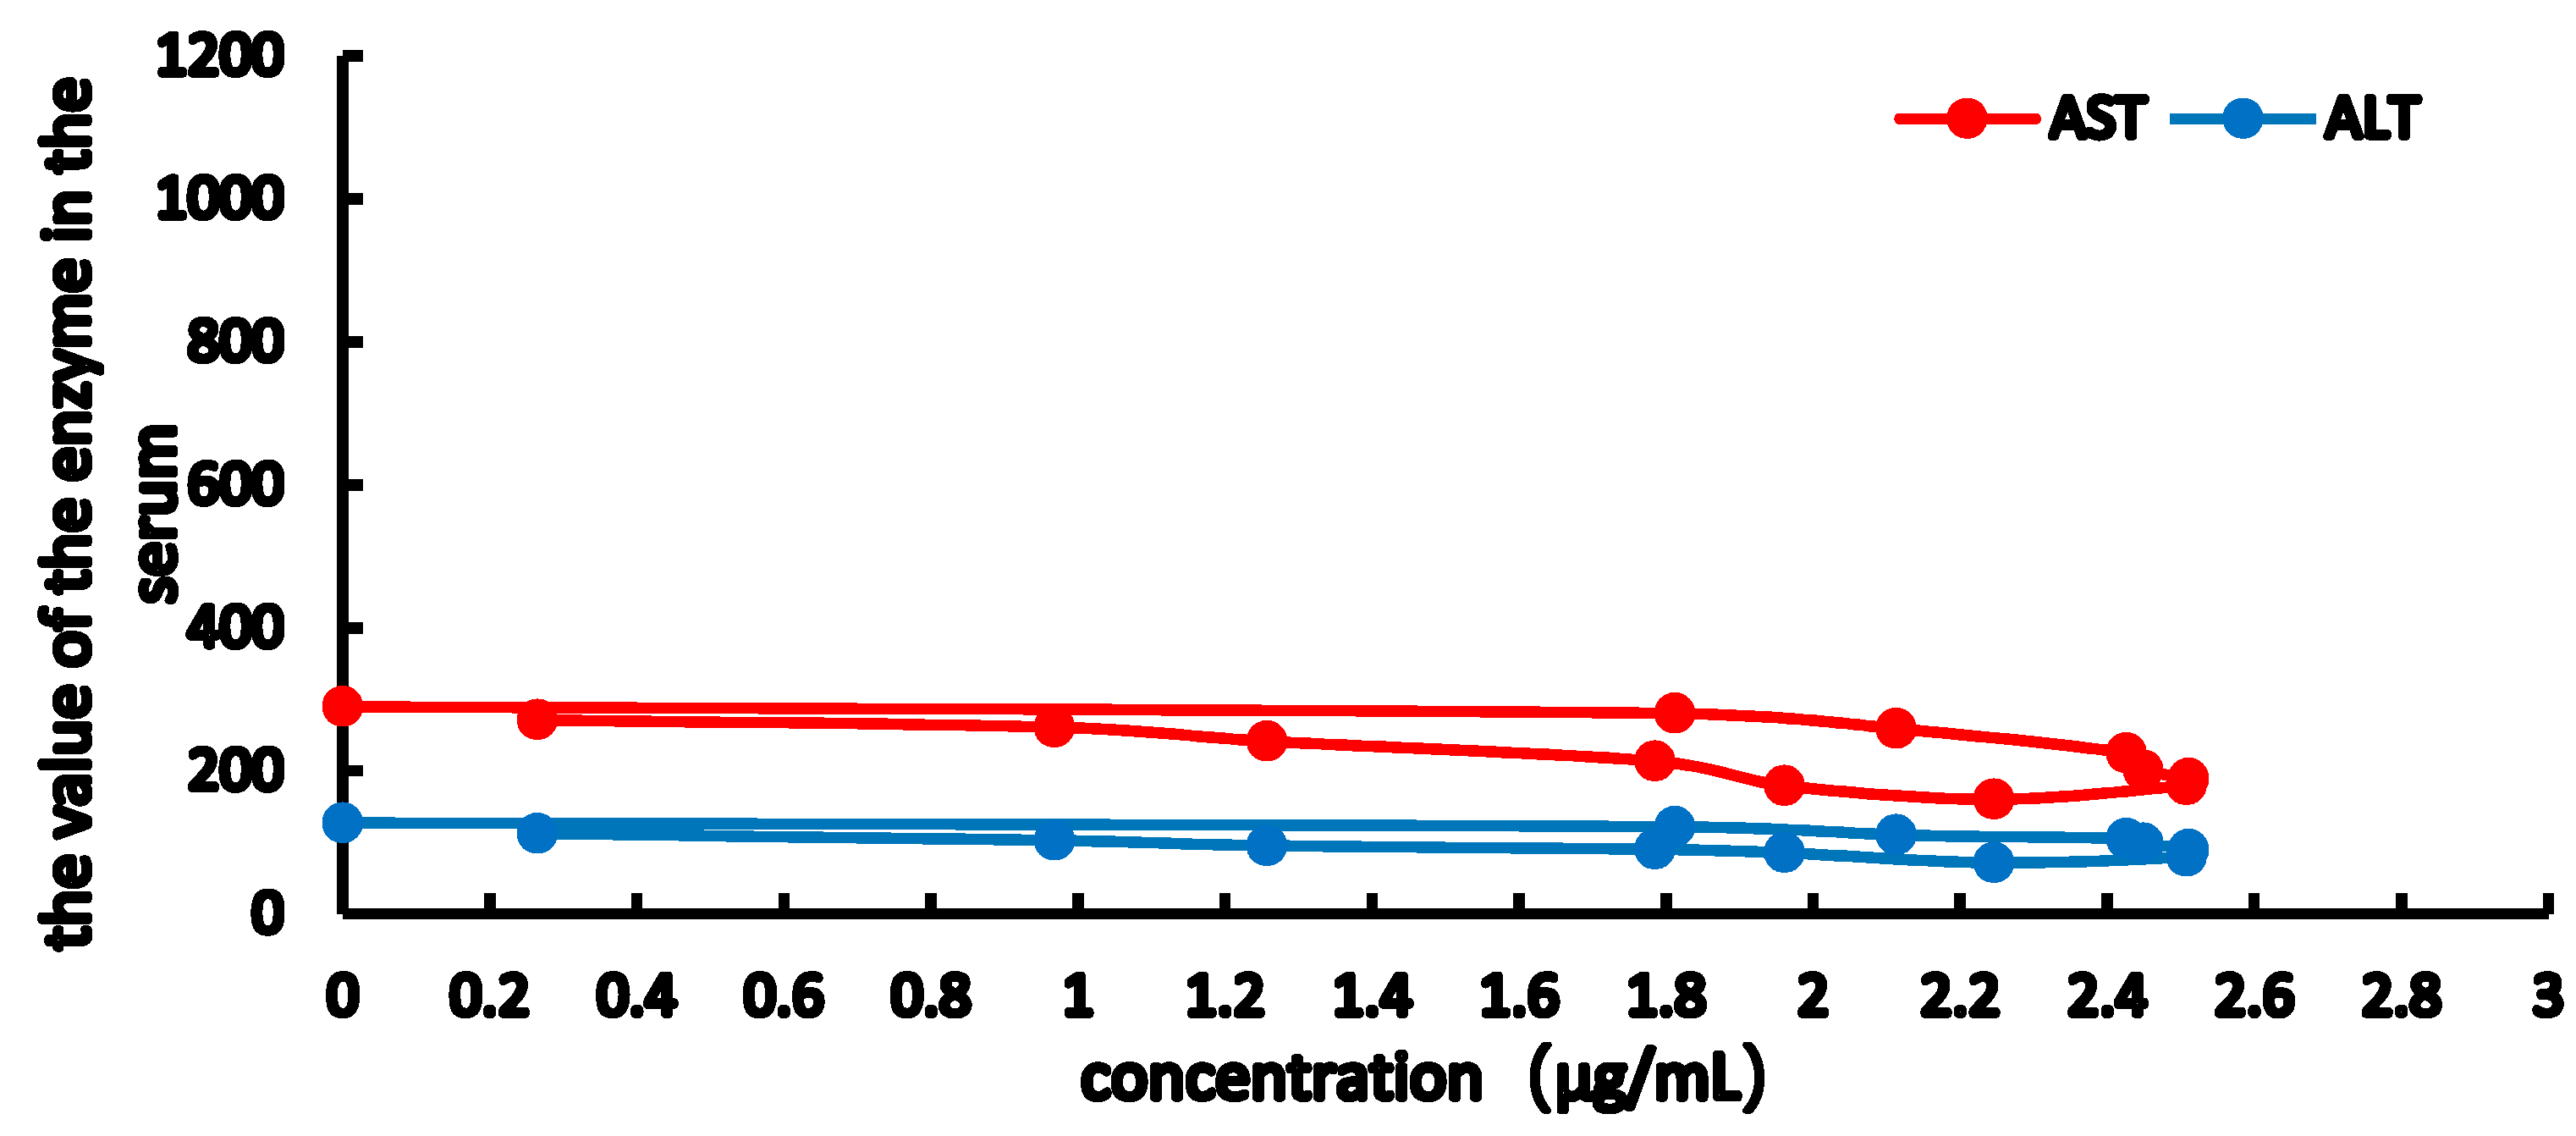
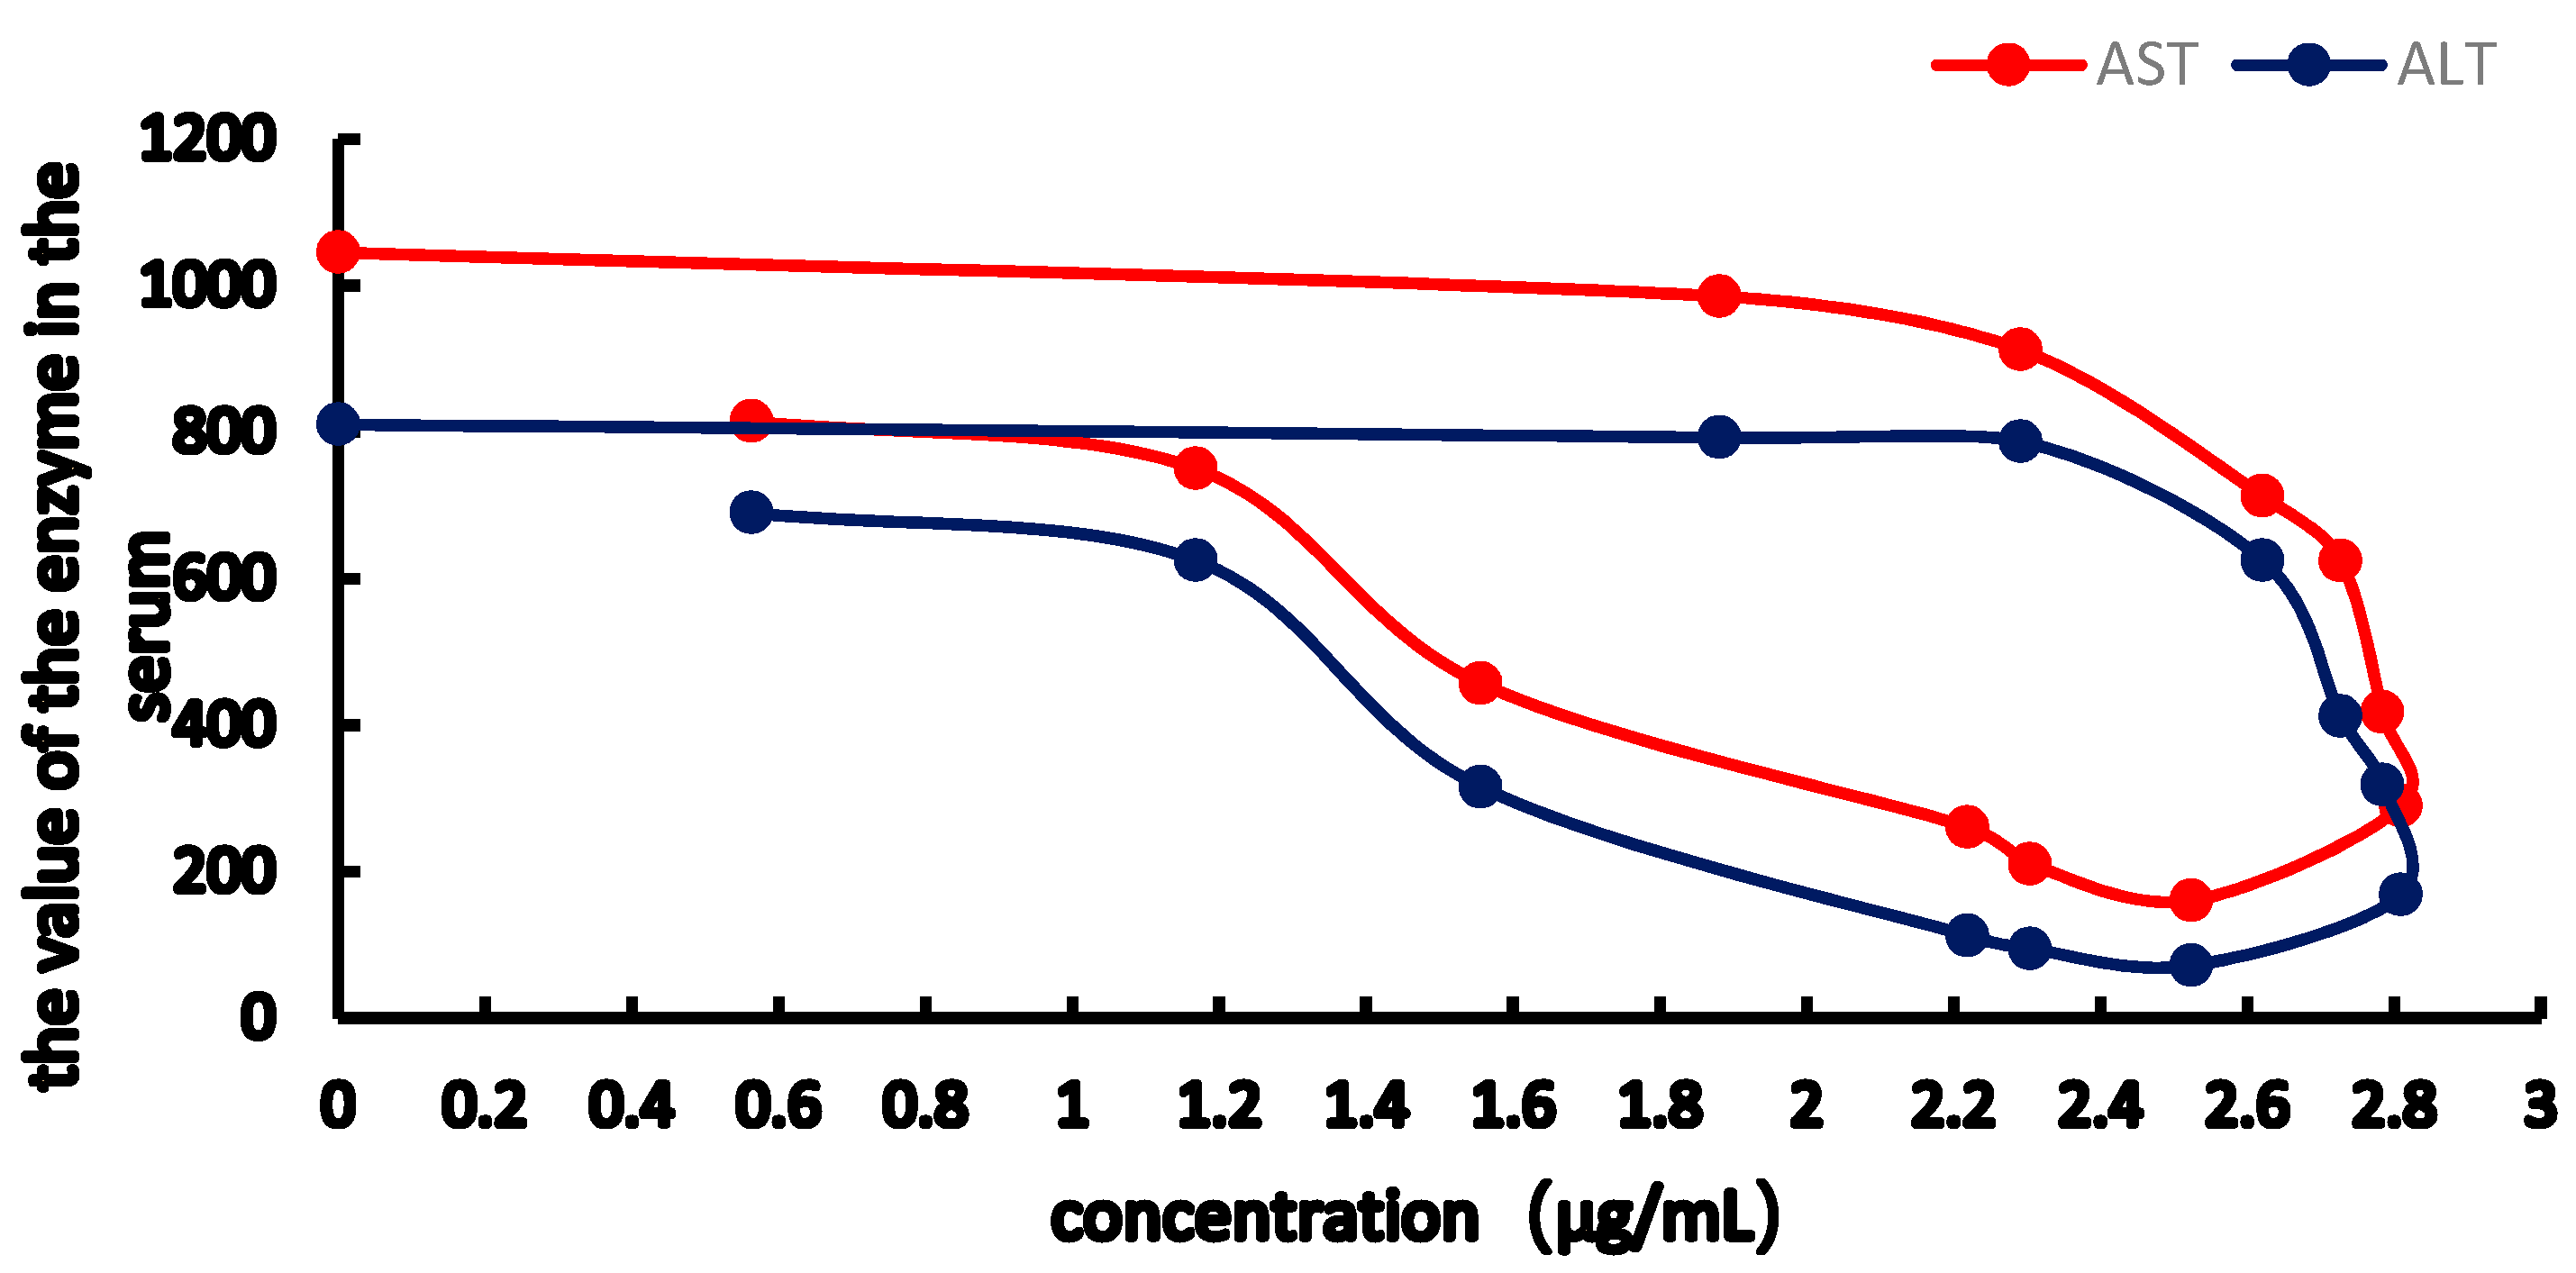
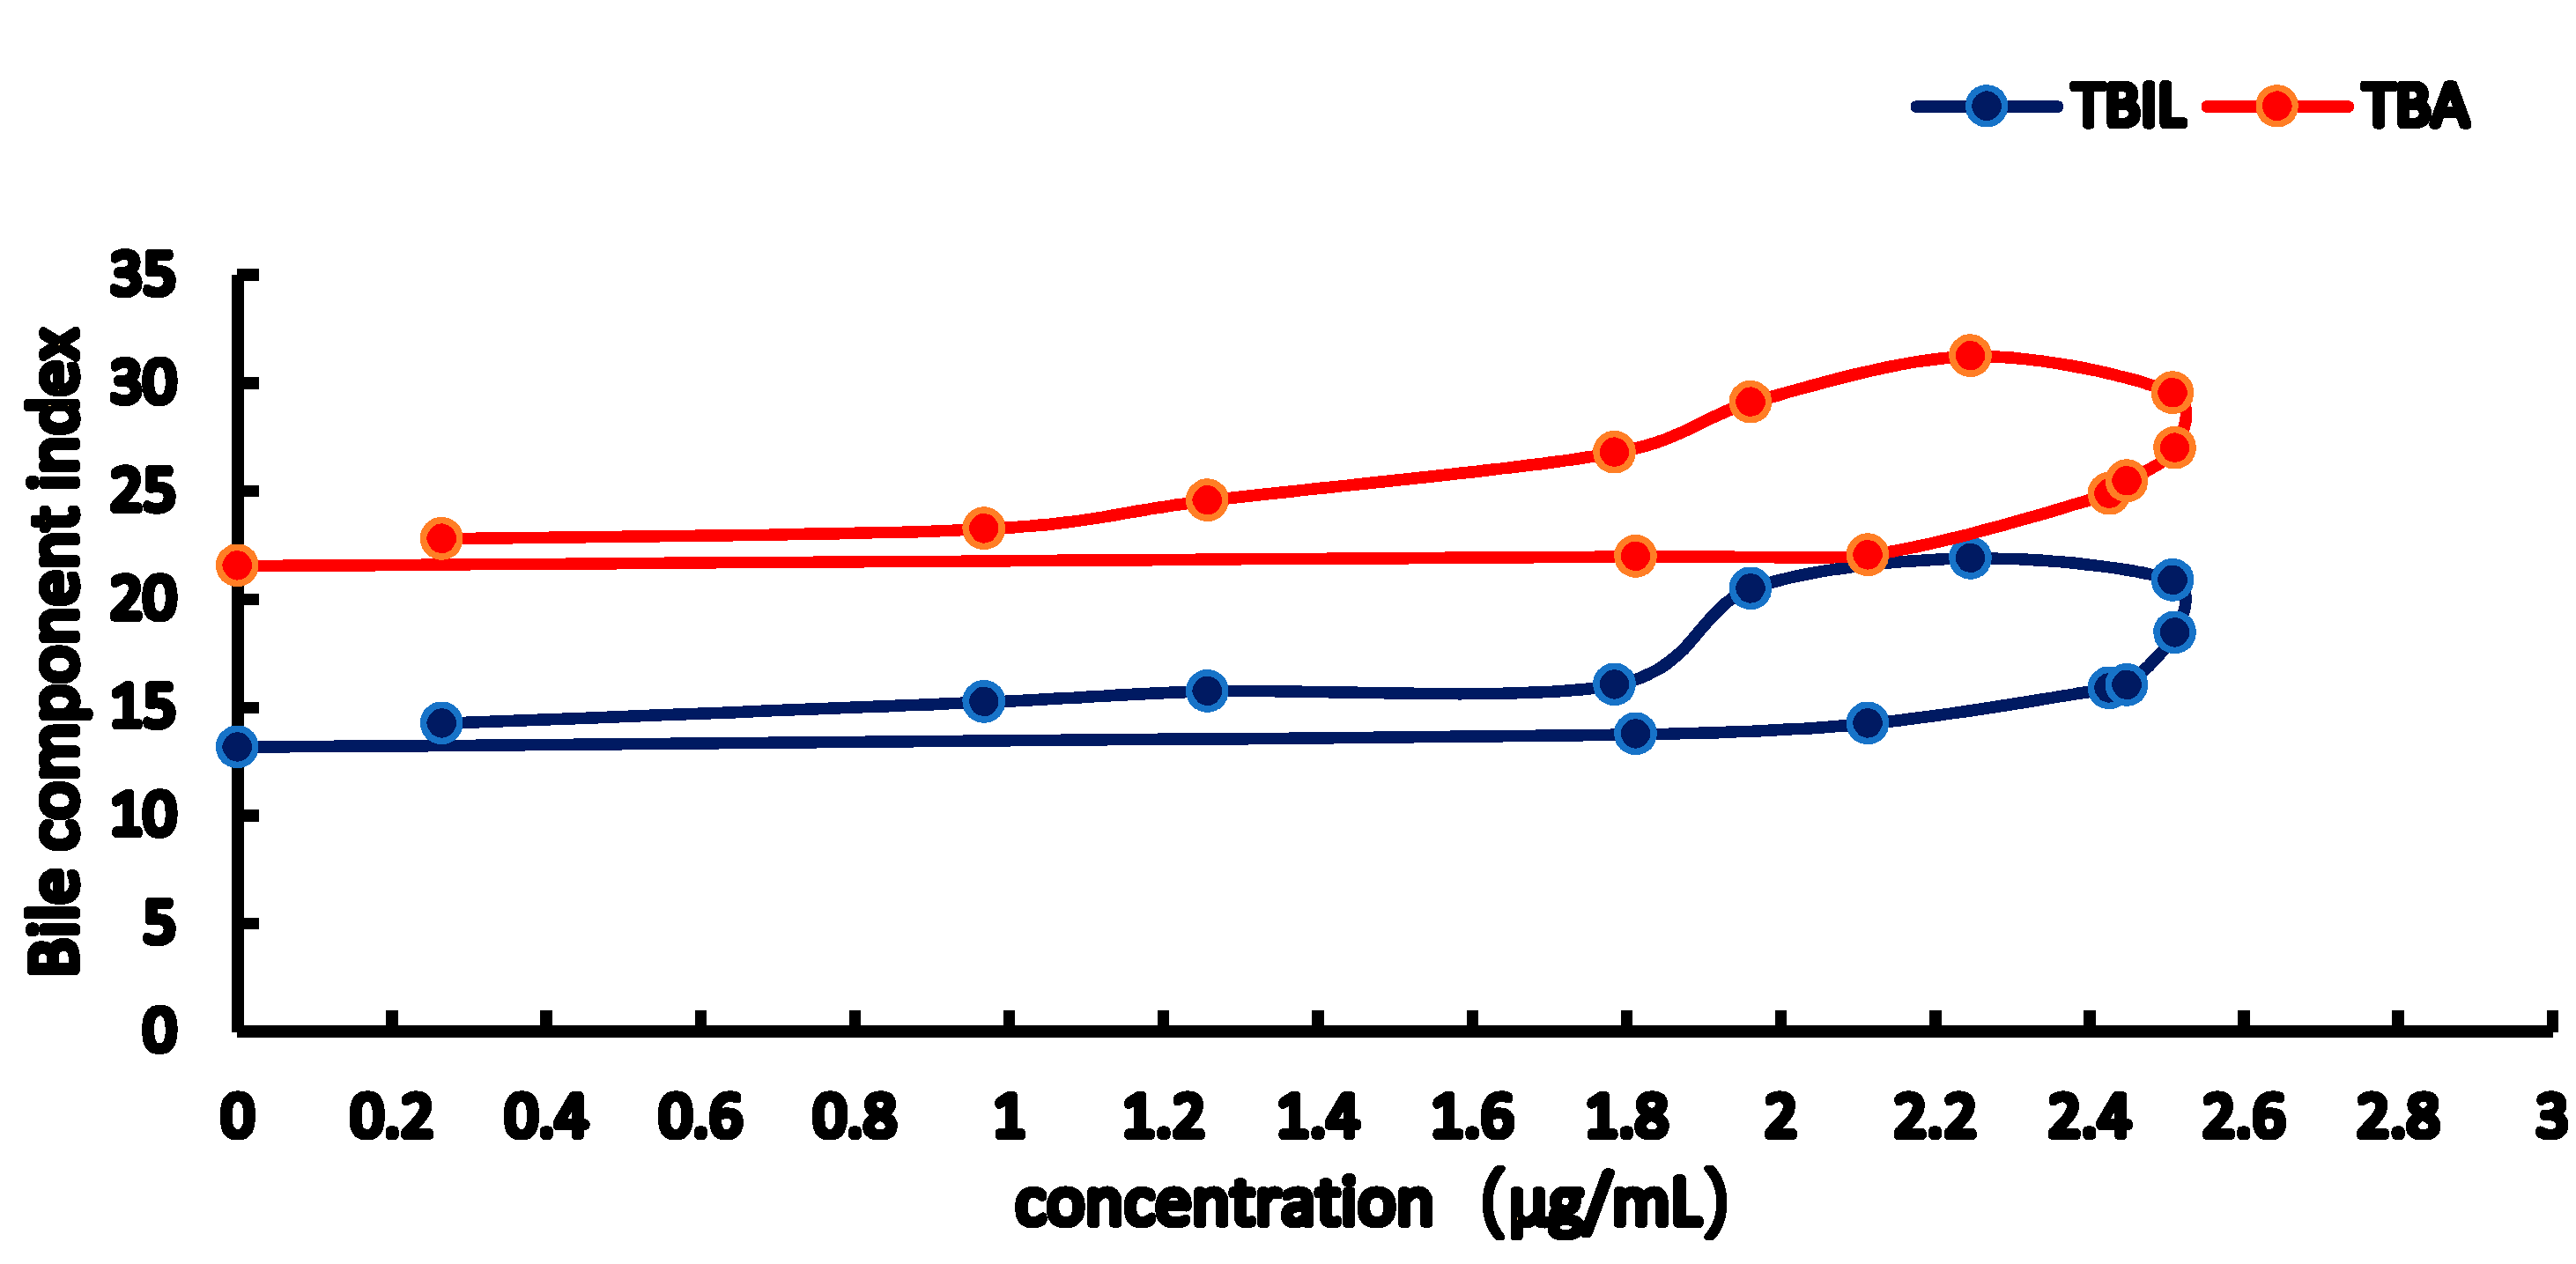
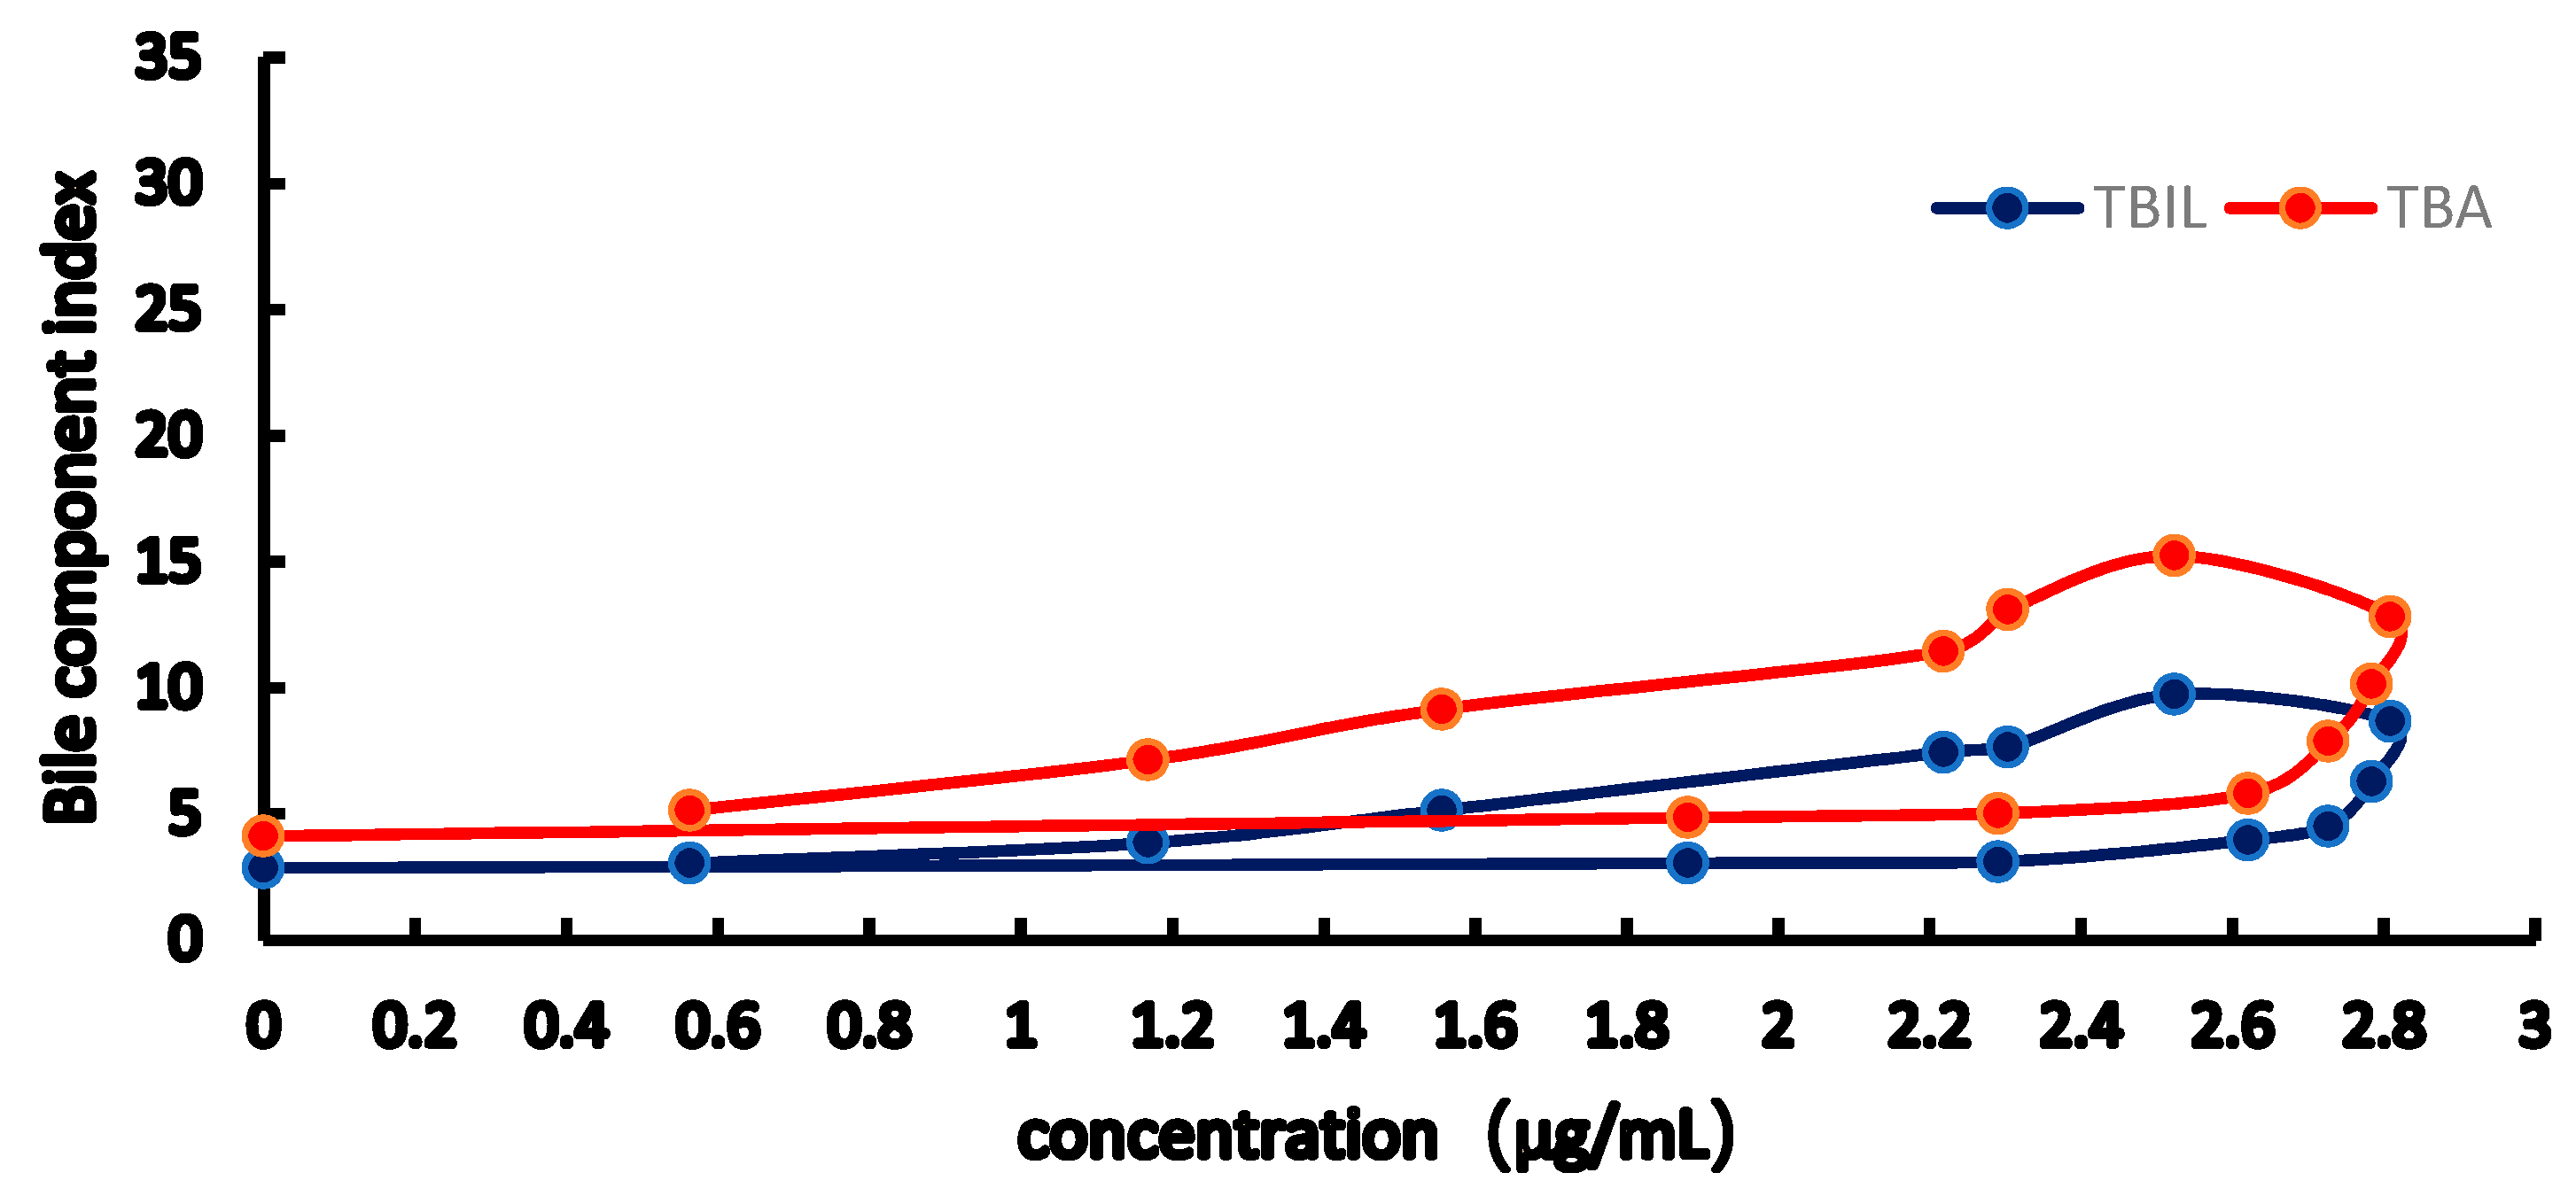
2.3. PK-PD Modelling
3. Discussion
4. Conclusions
5. Materials and Methods
5.1. Drugs and Reagents
5.2. Animals
5.3. Instruments
5.4. Liquid Chromatography
5.5. Standard Solution and Sample Preparation
5.6. PK and PD Research
5.7. Blood Biochemical Determinations
5.8. Analysis
Author Contributions
Funding
Acknowledgments
Conflicts of Interest
References
- Schmitt, M.; Kubitz, R.; Wettstein, M.; vom Dahl, S.; Häussinger, D. Retrieval of the mrp2 gene encoded conjugate export pump from the canalicular membrane contributes to cholestasis induced by tert-butyl hydroperoxide and chloro-dinitrobenzene. Biol. Chem. 2000, 381, 487–495. [Google Scholar] [CrossRef] [PubMed]
- Cuperus, F.J.; Claudel, T.; Gautherot, J.; Halilbasic, E.; Trauner, M. The role of canalicular ABC transporters in cholestasis. Drug. Metab. Dispos. 2014, 42, 546–560. [Google Scholar] [CrossRef] [PubMed]
- Anshu, S. Progressive familial intrahepatic cholestasis. J. Clin. Exp. Hepatol. 2014, 4, 25–36. [Google Scholar]
- Chai, J.; Feng, X.; Zhang, L.; Chen, S.; Cheng, Y.; He, X.; Yang, Y.; He, Y.; Wang, H.; Wang, R.; Chen, W. Hepatic expression of detoxification enzymes is decreased in human obstructive cholestasis due to gallstone biliary obstruction. PLoS ONE 2015, 10, E0120055. [Google Scholar] [CrossRef] [PubMed]
- Yuan, X.L.; Yan, L.H.; Zhang, Q.W.; Wang, Z.M. Simultaneous determination of rosmarinic acid, oridonin and chrysoplenetin in Isodon rubescens by HPLC. Zhongguo Zhong Yao Za Zhi 2013, 38, 2343–2347. [Google Scholar] [PubMed]
- Amoah, S.K.; Sandjo, L.P.; Kratz, J.M.; Biavatti, M.W. Rosmarinic Acid--Pharmaceutical and Clinical Aspects. Planta. Med. 2016, 82, 388–406. [Google Scholar] [CrossRef] [PubMed]
- Nunes, S.; Madureira, A.R.; Campos, D.; Sarmento, B.; Gomes, A.M.; Pintado, M.; Reis, F. Therapeutic and nutraceutical potential of rosmarinic acid-Cytoprotective properties and pharmacokinetic profile. Crit. Rev. Food Sci. Nutr. 2017, 57, 1799–1806. [Google Scholar] [CrossRef] [PubMed]
- Sun, X.; Wang, J.; Li, H.; Du, J.; Guo, D. The antibiosis research of rosmarinia acid. J. Qingdao Tech. Univ. 2005, 4, 41–45. [Google Scholar]
- Swarup, V.; Ghosh, J.; Ghosh, S.; Saxena, A.; Basu, A. Antiviral and anti-inflammatory effects of rosmarinic acid in an experimental murine model of Japanese encephalitis. Antimicrob. Agents Ch. 2007, 51, 3367–3370. [Google Scholar] [CrossRef] [PubMed]
- Anusuya, C.; Manoharan, S. Antitumor initiating potential of rosmarinic acid in 7, 12-dimethylbenz (a) anthracene-induced hamster buccal pouch carcinogenesis. J. Environ. Pathol. Toxicol. Oncol. 2011, 30, 199–211. [Google Scholar] [CrossRef] [PubMed]
- Majid, T.; Hasan, A. Effect of rosmarinic acid on inhibition of gentamicin induced nephrotoxicity in rats. Tissue Cell 2011, 43, 392–397. [Google Scholar]
- Pietsch, K.; Saul, N.; Chakrabarti, S.; Stürzenbaum, S.R.; Menzel, R.; Steinberg, C.E. Hormetins, antioxidants and prooxidants: Defining quercetin-, caffeic acid- and rosmarinic acid-mediated life extension in C. elegans. Biogerontology 2011, 12, 329–347. [Google Scholar] [CrossRef] [PubMed]
- Domitrović, R.; Skoda, M.; Vasiljev, M.V.; Cvijanović, O.; Pernjak, P.E.; Stefan, M.B. Rosmarinic acid ameliorates acute liver damage and fibrogenesis in carbon tetrachloride-intoxicated mice. Food Chem. Toxicol. 2013, 51, 370–378. [Google Scholar] [CrossRef] [PubMed]
- Wu, C.F.; Kariotib, A.; Rohra, D.; Bilia, A.R.; Efferth, T. Production of rosmarinic acid and salvianolic acid B from callus culture of Salvia miltiorrhiza with cytotoxicity towards acute lymphoblastic leukemia cells. Food Chem. 2016, 15, 192–297. [Google Scholar] [CrossRef] [PubMed]
- Nabavi, S.F.; Tenore, G.C.; Daglia, M.; Tundis, R.; Loizzo, M.R.; Nabavi, S.M. The cellular protective effects of rosmarinic acid: From bench to bedside. Curr. Neurovasc. Res. 2015, 12, 98–105. [Google Scholar] [CrossRef] [PubMed]
- Baba, S.; Osakabe, N.; Natsume, M.; Terao, J. Orally administered rosmarinic acid is present as the conjugated and/or methylated forms in plasma, and is degraded and metabolized to conjugated forms of caffeic acid, ferulic acid and m-coumaric acid. Life Sci. 2004, 5, 165–178. [Google Scholar] [CrossRef] [PubMed]
- Toutain, P.L.; Lees, P. Integration and modelling of pharmacokinetic and pharmacodynamic data to optimize dosage regimens in veterinary medicine. J. Vet. Pharmacol. Ther. 2004, 27, 467–477. [Google Scholar] [CrossRef] [PubMed]
- Haritova, A.M.; Rusenova, N.V.; Parvanov, P.R.; Lashev, L.D.; Fink-Gremmels, J. Integration of pharmacokinetic and pharmacodynamic indices of Marbofloxacin in turkeys. Antimicrob. Agents Chemother. 2006, 50, 3779–3785. [Google Scholar] [CrossRef] [PubMed]
- Cao, G.; Zhang, J.; Wu, X.; Yu, J.; Chen, Y.; Ye, X.; Zhu, D.; Zhang, Y.; Guo, B.; Shi, Y. Pharmacokinetics and pharmacodynamics of levofloxacin injection in healthy Chinese volunteers and dosing regimen optimization. J. Clin. Pharm. Ther. 2013, 38, 394–400. [Google Scholar] [CrossRef] [PubMed]
- Zhang, Z.; Qin, L.; Peng, L.; Zhang, Q.; Wang, Q.; Lu, Z.; Song, Y.; Gao, X. Pharmacokinetic-Pharmacodynamic Modeling to Study the Antipyretic Effect of Qingkailing Injection on Pyrexia Model Rats. Molecules 2016, 21, 317. [Google Scholar] [CrossRef] [PubMed]
- Yu, Y.; Zhou, Y.F.; Chen, M.R.; Li, X.; Qiao, G.L.; Sun, J.; Liao, X.P.; Liu, Y.H. In Vivo Pharmacokinetics/Pharmacodynamics of Cefquinome in an Experimental Mouse Model of Staphylococcus Aureus Mastitis following Intramammary Infusion. PLoS ONE 2016, 11, e0156273. [Google Scholar] [CrossRef] [PubMed]
- Movin-Osswald, G.; Hammarlund-Udenaes, M. Prolactin release after remoxipride by an integrated pharmacokineticpharmacodynamic model with intra- and interindividual aspects. J. Pharmacol. Exp. Ther. 1995, 274, 921–927. [Google Scholar] [PubMed]
- Stevens, J.; Ploeger, B.A; Hammarlund-Udenaes, M.; Osswald, G.; van der Graaf, P.H.; Danhof, M.; de Lange, E.C. Mechanism-based PK-PD model for the prolactin biological system response following an acute dopamine inhibition challenge: Quantitative extrapolation to humans. J. Pharmacokinet. Pharmacodyn. 2012, 39, 463–477. [Google Scholar] [CrossRef] [PubMed]
- Lv, J.; Fu, S.; Guo, J.; Liu, Y.; Yuan, H.; Xiao, X. Primary research on daily administration times of rhubarb used to treat experimental jaundice in rats. Zhongguo Zhong Yao Za Zhi 2011, 36, 3506–3510. [Google Scholar] [PubMed]
- MIN, J.B.; CHEN, H.; SHI, S.; LIU, F.L.; ZHAO, W.; MI, S.Q.; ZHU, C.C. Intervention Effect of Herba Rabdosiae Serriae Aqueous Extract on Experimental Rat Model of Intrahepatic Cholestasis Induced by ANIT. Trad. Chin. Drug Res. & Clin. Pharmacol. 2015, 26, 635–639. [Google Scholar]
- Cipriani, S.; Renga, B.; D’Amore, C.; Simonetti, M.; De Tursi, A.A.; Carino, A.; Monti, M.C.; Sepe, V.; Zampella, A.; Fiorucci, S. Impaired Itching Perception in Murine Models of Cholestasis Is Supported by Dysregulation of GPBAR1 Signaling. PLoS ONE 2015, 10, e0129866. [Google Scholar] [CrossRef] [PubMed]
- Hirschfield, G.M.; Chapman, R.W.; Karlsen, T.H.; Lammert, F.; Lazaridis, K.N.; Mason, A.L. The genetics of complex cholestatic disorders. Gastroenterology 2013, 144, 1357–1374. [Google Scholar] [CrossRef] [PubMed]
- Tabibian, J.H.; Lindor, K.D. Primary sclerosing cholangitis: A review and update on therapeutic developments. Expert Rev. Gastroent. 2013, 7, 103–114. [Google Scholar] [CrossRef] [PubMed]
- Eaton, J.E.; Talwalkar, J.A.; Lazaridis, K.N.; Gores, G.J.; Lindor, K.D. Pathogenesis of primary sclerosing cholangitis and advances in diagnosis and management. Gastroenterology 2013, 145, 521–536. [Google Scholar] [CrossRef] [PubMed]
- James, L.B. Bile formation and secretion. Compr. Physiol. 2013, 3, 1035–1078. [Google Scholar]
- Ang, H.; Ramani, K.; Xia, M.; Ko, K.S.; Li, T.W.; Oh, P.; Li, J.; Lu, S.C. Dysregulation of glutathione synthesis during cholestasis in mice: Molecular mechanisms and therapeutic implications. Hepatology 2009, 49, 1982–1991. [Google Scholar] [CrossRef] [PubMed]
- Alrefai, W.A.; Gill, R.K. Bile acid transporters: Structure; function; regulation and pathophysiological implications. Pharm. Res. 2007, 24, 1803–1823. [Google Scholar] [CrossRef] [PubMed]
- Mencarelli, A.; Renga, B.; D’Amore, C.; Santorelli, C.; Graziosi, L.; Bruno, A.; Monti, M.C.; Distrutti, E.; Cipriani, S.; Donini, A.; et al. Dissociation of intestinal and hepatic activities of FXR and LXRα supports metabolic effects of terminal ileum interposition in rodents. Diabetes 2005, 62, 3384–3393. [Google Scholar] [CrossRef] [PubMed]
Sample Availability: Samples of the compound (RA) is available from the authors. |


| Concentration/µg·mL−1 | RSD (%) | ||
|---|---|---|---|
| Inter-Day Precision | Intra-Day Precision | Accuracy | |
| 35 | 1.44 | 3.84 | 2.89 |
| 48 | 2.34 | 4.65 | 2.58 |
| 70 | 1.44 | 3.85 | 1.37 |
| Concentration/µg·mL−1 | RSD% | ||
|---|---|---|---|
| 6 h at 25 °C | 6 h at 4 °C | 7 d at −80 °C | |
| 35 | 1.44 | 2.05 | 5.72 |
| 48 | 2.34 | 2.86 | 5.98 |
| 70 | 1.44 | 2.32 | 5.31 |
| Concentration/μg·mL−1 | The Recovery | RSD/% | The Absolute Recovery | RSD/% |
|---|---|---|---|---|
| 35 | 96.7 ± 3.72 | 3.84 | 91.48 ± 1.00 | 1.09 |
| 48 | 94.54 ± 1.61 | 1.71 | 95.82 ± 1.71 | 1.78 |
| 70 | 89.98 ± 1.92 | 2.14 | 88.97 ± 2.80 | 3.15 |
| Pharmacokinetic Parameters | Unit | Normal Group | Model Group |
|---|---|---|---|
| AUC | mg·h/mL | 20.500 ± 1.199 ** | 23.984 ± 0.678 |
| K01_HL | h | 0.181 ± 0.061 ** | 0.303 ± 0.092 |
| K10_HL | h | 4.930 ± 0.419 | 4.799 ± 0.264 |
| CL_F | L/h/kg | 4.876 ± 0.285 ** | 4.169 ± 0.118 |
| Tmax | h | 0.704 ± 0.120 | 0.988 ± 0.153 |
| Cmax | mg/mL | 2.542 ± 0.054 ** | 2.876 ± 0.082 |
| V_F | L/kg | 34.683 ± 1.433 | 28.867 ± 1.438 |
| K01 | h−1 | 3.827 ± 1.283 | 2.291 ± 0.698 |
| K10 | h−1 | 0.141 ± 0.012 | 0.144 ± 0.008 |
| Parameter | Model Group | Blank Group | ||
|---|---|---|---|---|
| AST | ALT | AST | ALT | |
| Imax | 6765.54 | 3660.634 | 855.64 | 338.667 |
| IC50 | 14.369 | 7.460 | 12.640 | 12.702 |
| E0 | 1175.756 | 978.187 | 309.569 | 129.138 |
| Ke0 | 1.476 | 1.346 | 2.538 | 1.662 |
| Parameter | Model Group | Blank Group | ||
|---|---|---|---|---|
| TBIL | TBA | TBIL | TBA | |
| Emax | 20.279 | 46.028 | 84.572 | 96.36 |
| EC50 | 3.410 | 4.589 | 4.769 | 6.235 |
| E0 | 2.855 | 4.183 | 13.935 | 21.85 |
| Gamma | 2.895 | 2.122 | 3.1445 | 2.283 |
| Ke0 | 1.780 | 1.535 | 2.067 | 1.918 |
© 2018 by the authors. Licensee MDPI, Basel, Switzerland. This article is an open access article distributed under the terms and conditions of the Creative Commons Attribution (CC BY) license (http://creativecommons.org/licenses/by/4.0/).
Share and Cite
Min, J.; Chen, H.; Gong, Z.; Liu, X.; Wu, T.; Li, W.; Fang, J.; Huang, T.; Zhang, Y.; Zhao, W.; et al. Pharmacokinetic and Pharmacodynamic Properties of Rosmarinic Acid in Rat Cholestatic Liver Injury. Molecules 2018, 23, 2287. https://doi.org/10.3390/molecules23092287
Min J, Chen H, Gong Z, Liu X, Wu T, Li W, Fang J, Huang T, Zhang Y, Zhao W, et al. Pharmacokinetic and Pharmacodynamic Properties of Rosmarinic Acid in Rat Cholestatic Liver Injury. Molecules. 2018; 23(9):2287. https://doi.org/10.3390/molecules23092287
Chicago/Turabian StyleMin, Jianbin, Hao Chen, Zipeng Gong, Xian Liu, Tian Wu, Weirong Li, Jiansong Fang, Tianlai Huang, Yingfeng Zhang, Wei Zhao, and et al. 2018. "Pharmacokinetic and Pharmacodynamic Properties of Rosmarinic Acid in Rat Cholestatic Liver Injury" Molecules 23, no. 9: 2287. https://doi.org/10.3390/molecules23092287
APA StyleMin, J., Chen, H., Gong, Z., Liu, X., Wu, T., Li, W., Fang, J., Huang, T., Zhang, Y., Zhao, W., Zhu, C., Wang, Q., Mi, S., & Wang, N. (2018). Pharmacokinetic and Pharmacodynamic Properties of Rosmarinic Acid in Rat Cholestatic Liver Injury. Molecules, 23(9), 2287. https://doi.org/10.3390/molecules23092287