
Molecular Recognition of Parallel G-quadruplex [d-(TTGGGGT)]4 Containing Tetrahymena Telomeric DNA Sequence by Anticancer Drug Daunomycin: NMR-Based Structure and Thermal Stability

Abstract
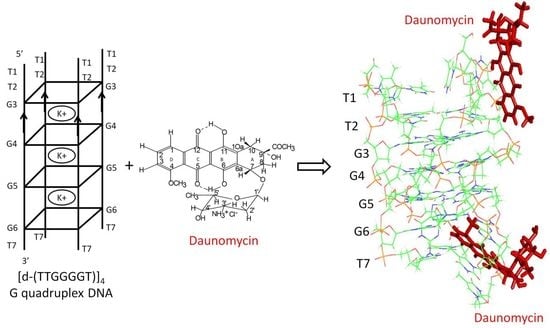
1. Introduction
2. Results and Discussion
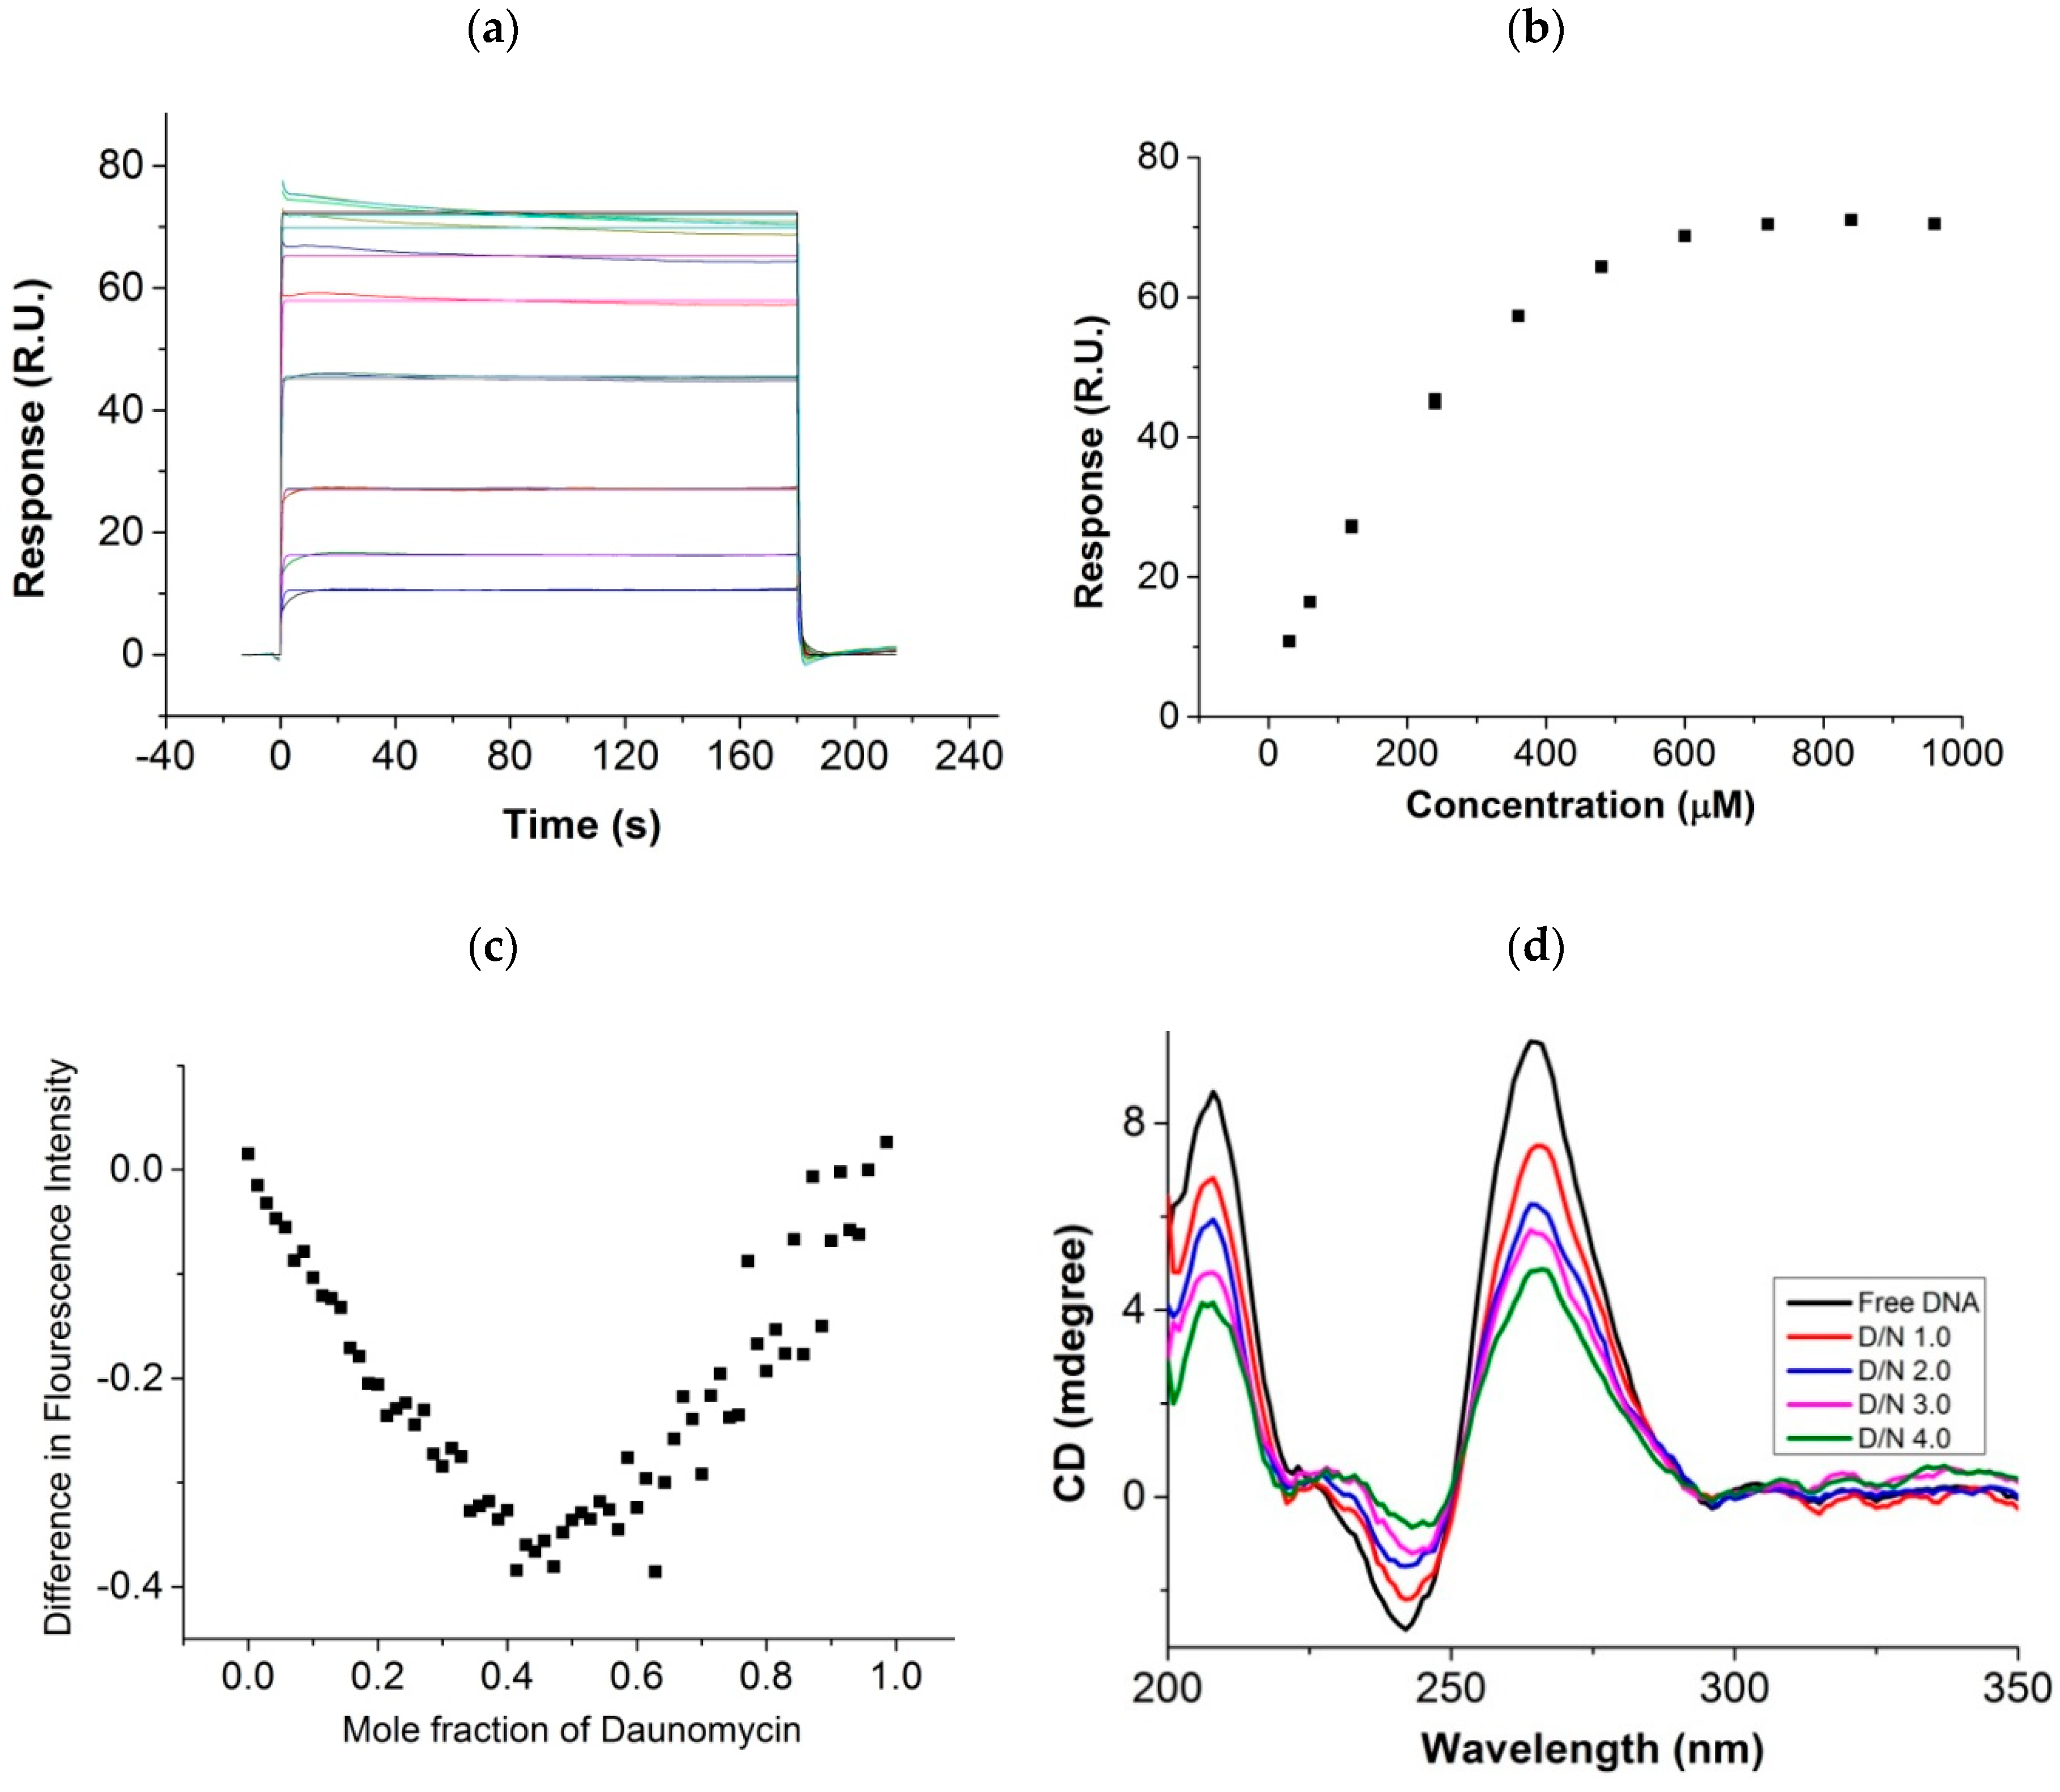
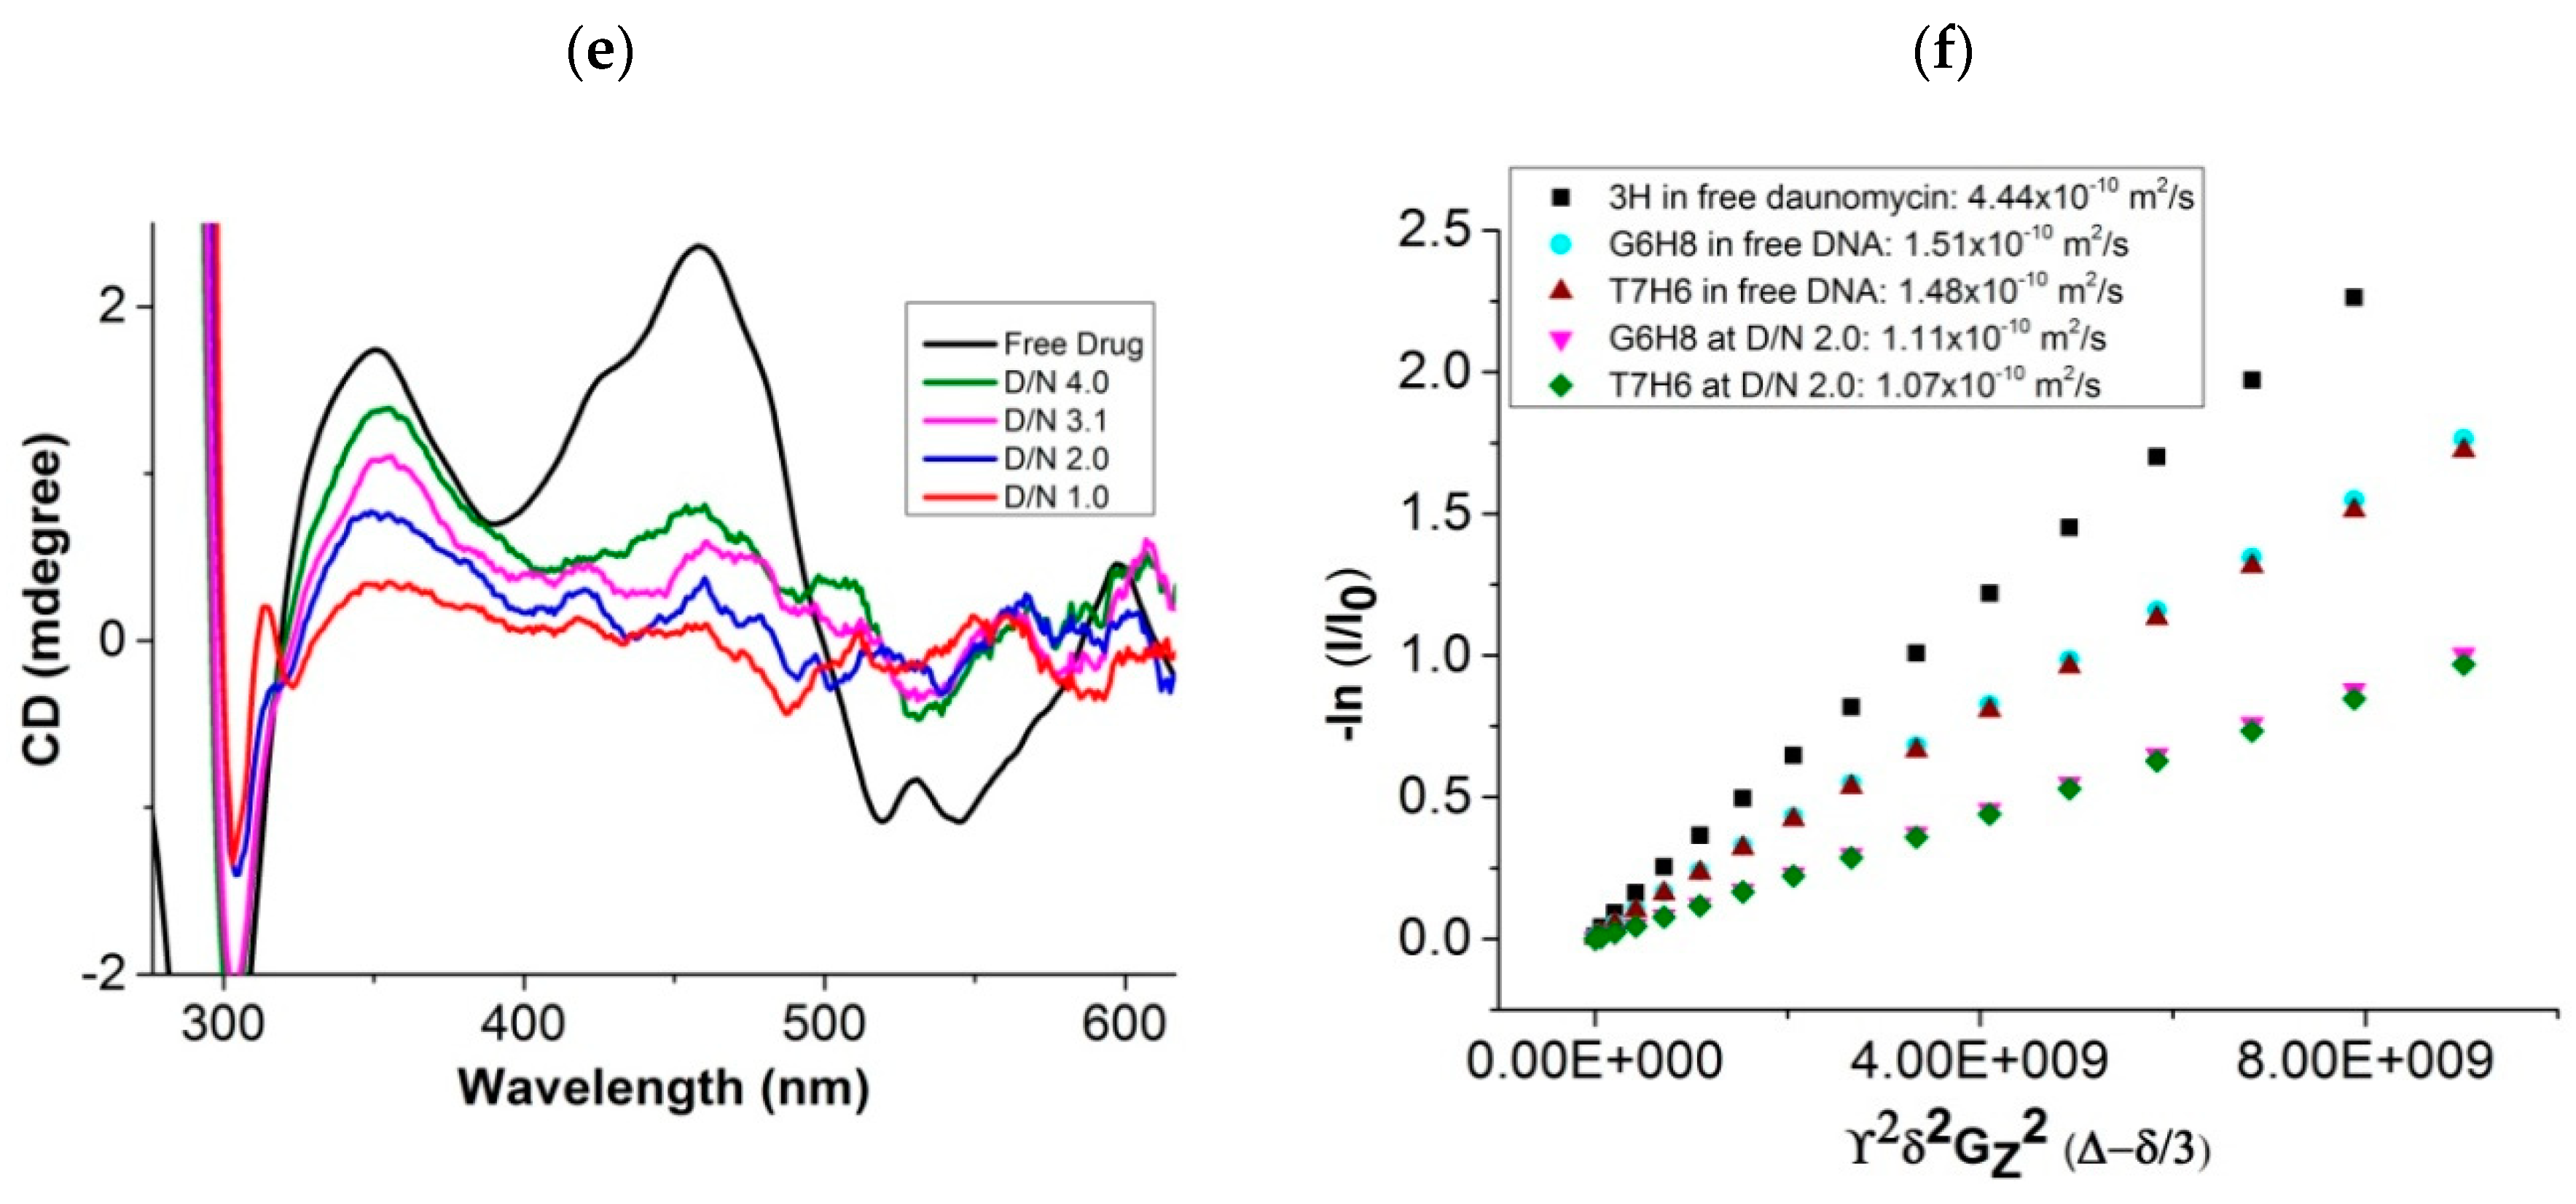
2.1. Surface Plasmon Resonance, Job Plot, Circular Dichroism, and Diffusion Ordered Spectroscopy
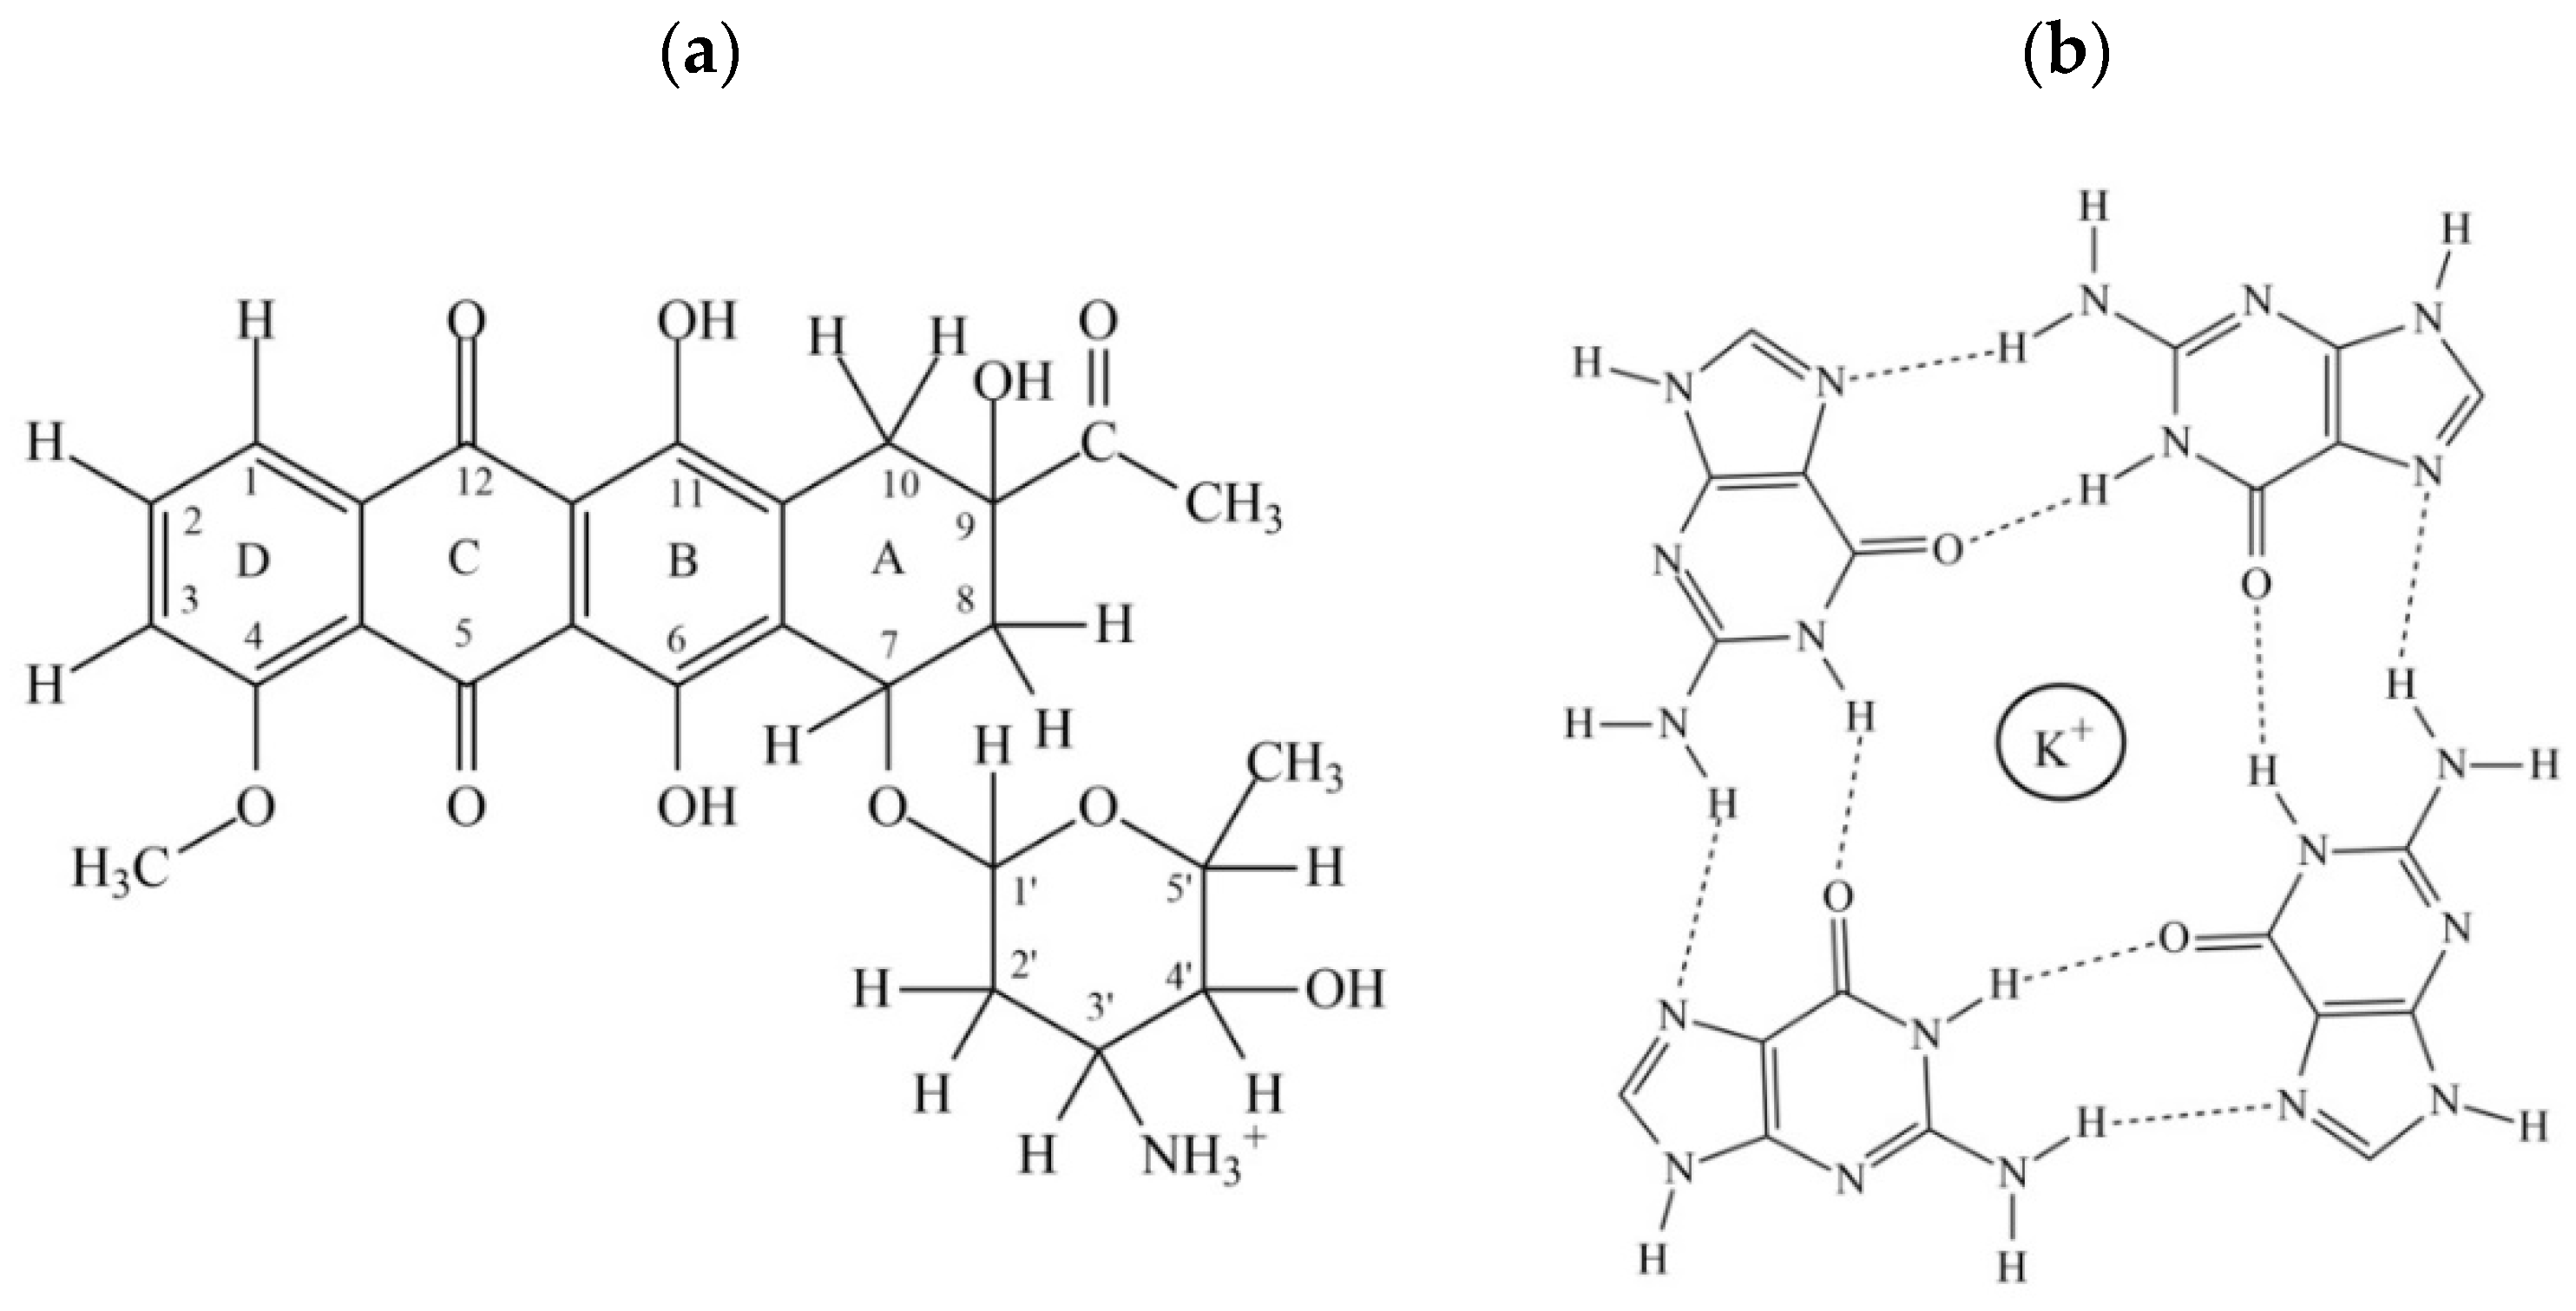
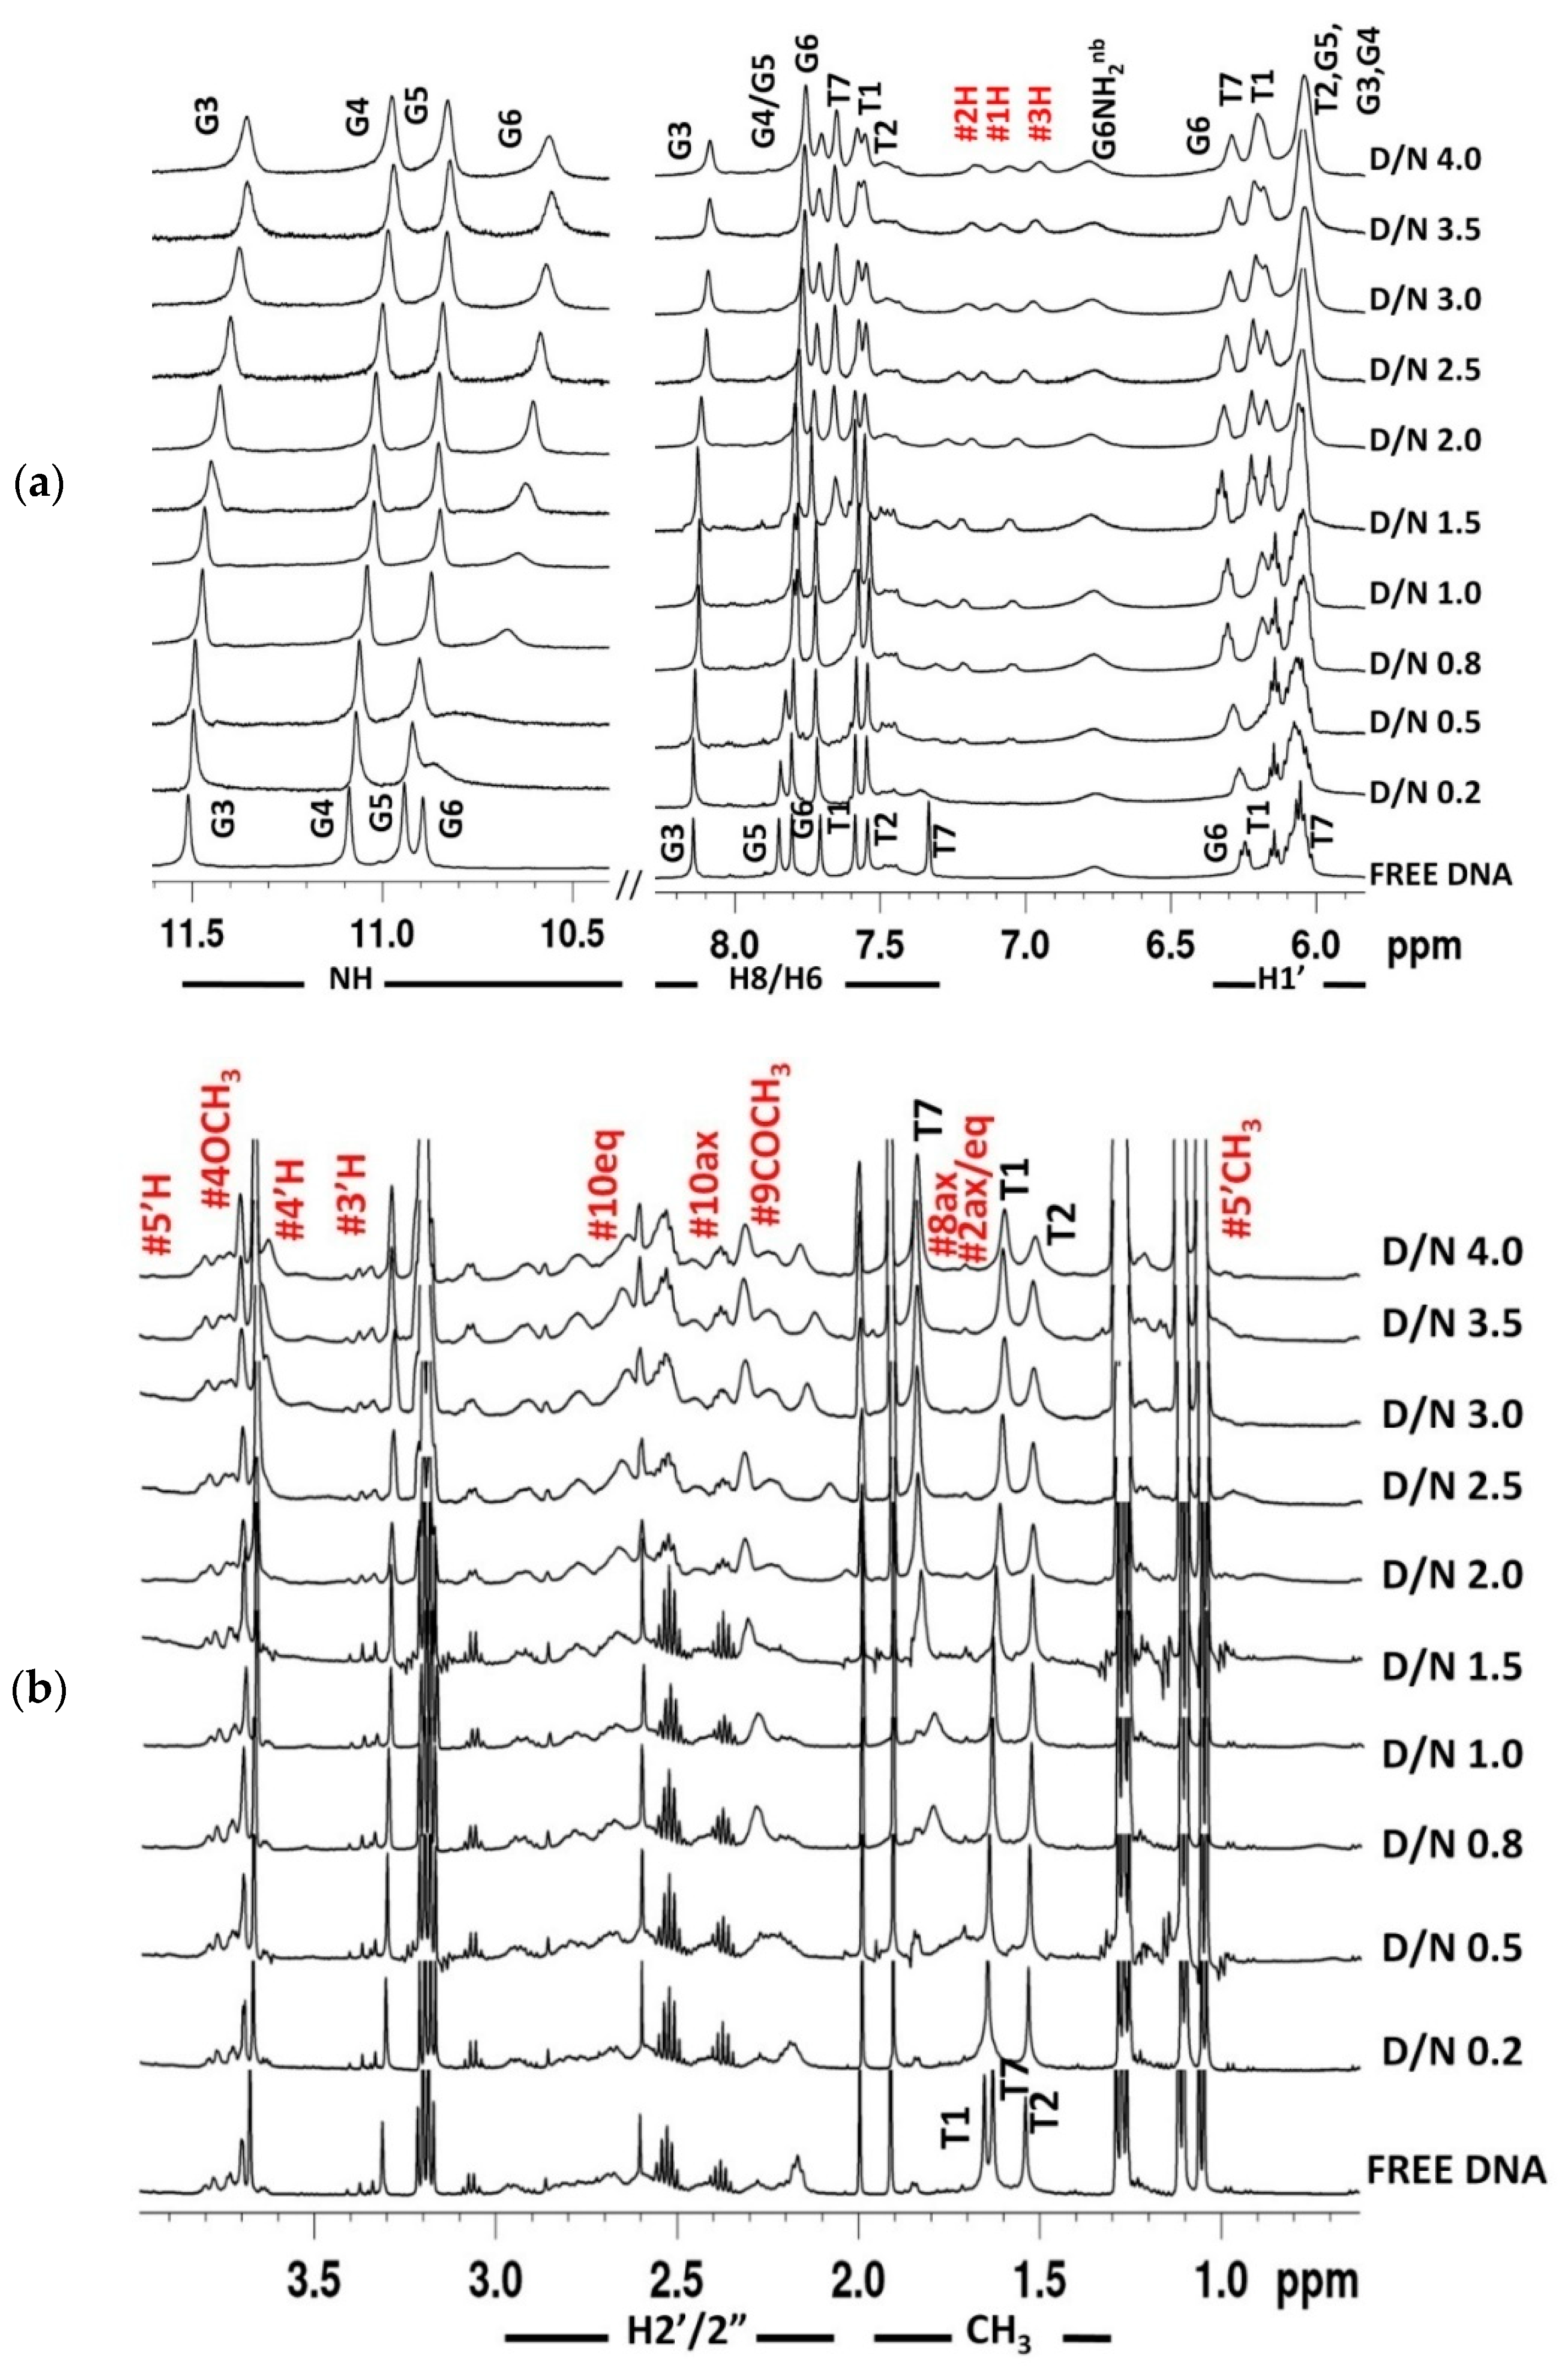
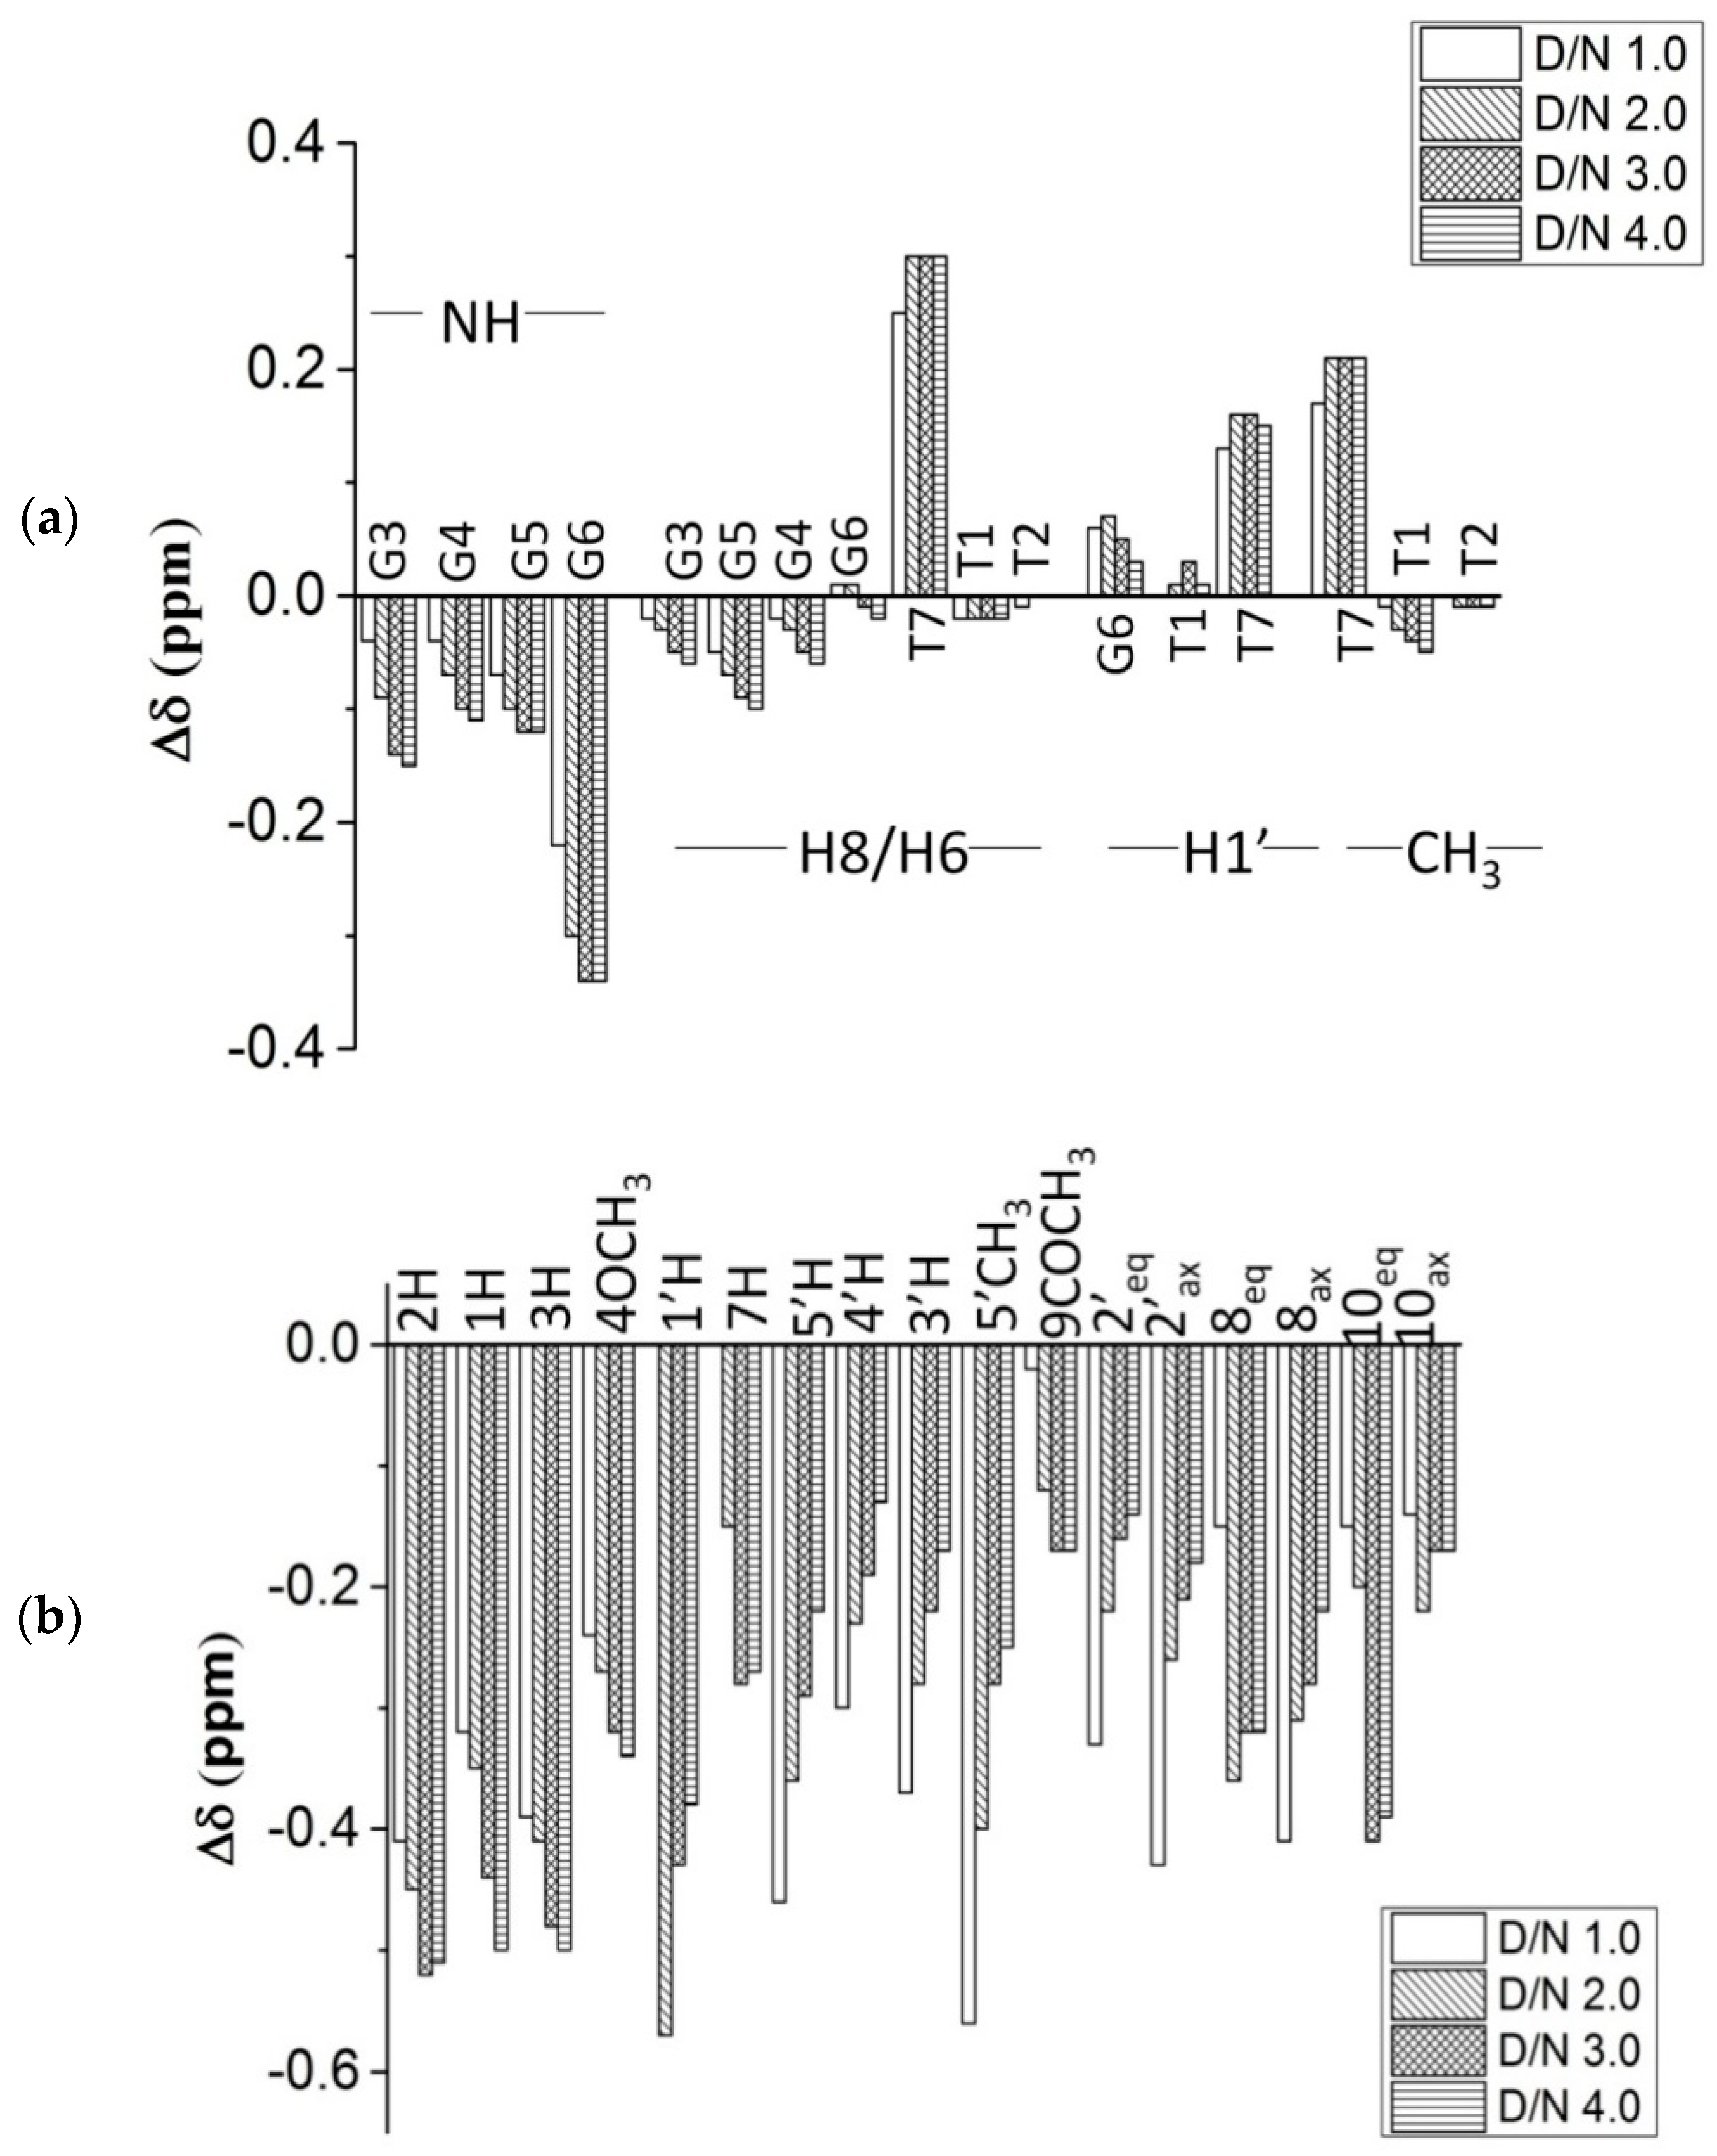
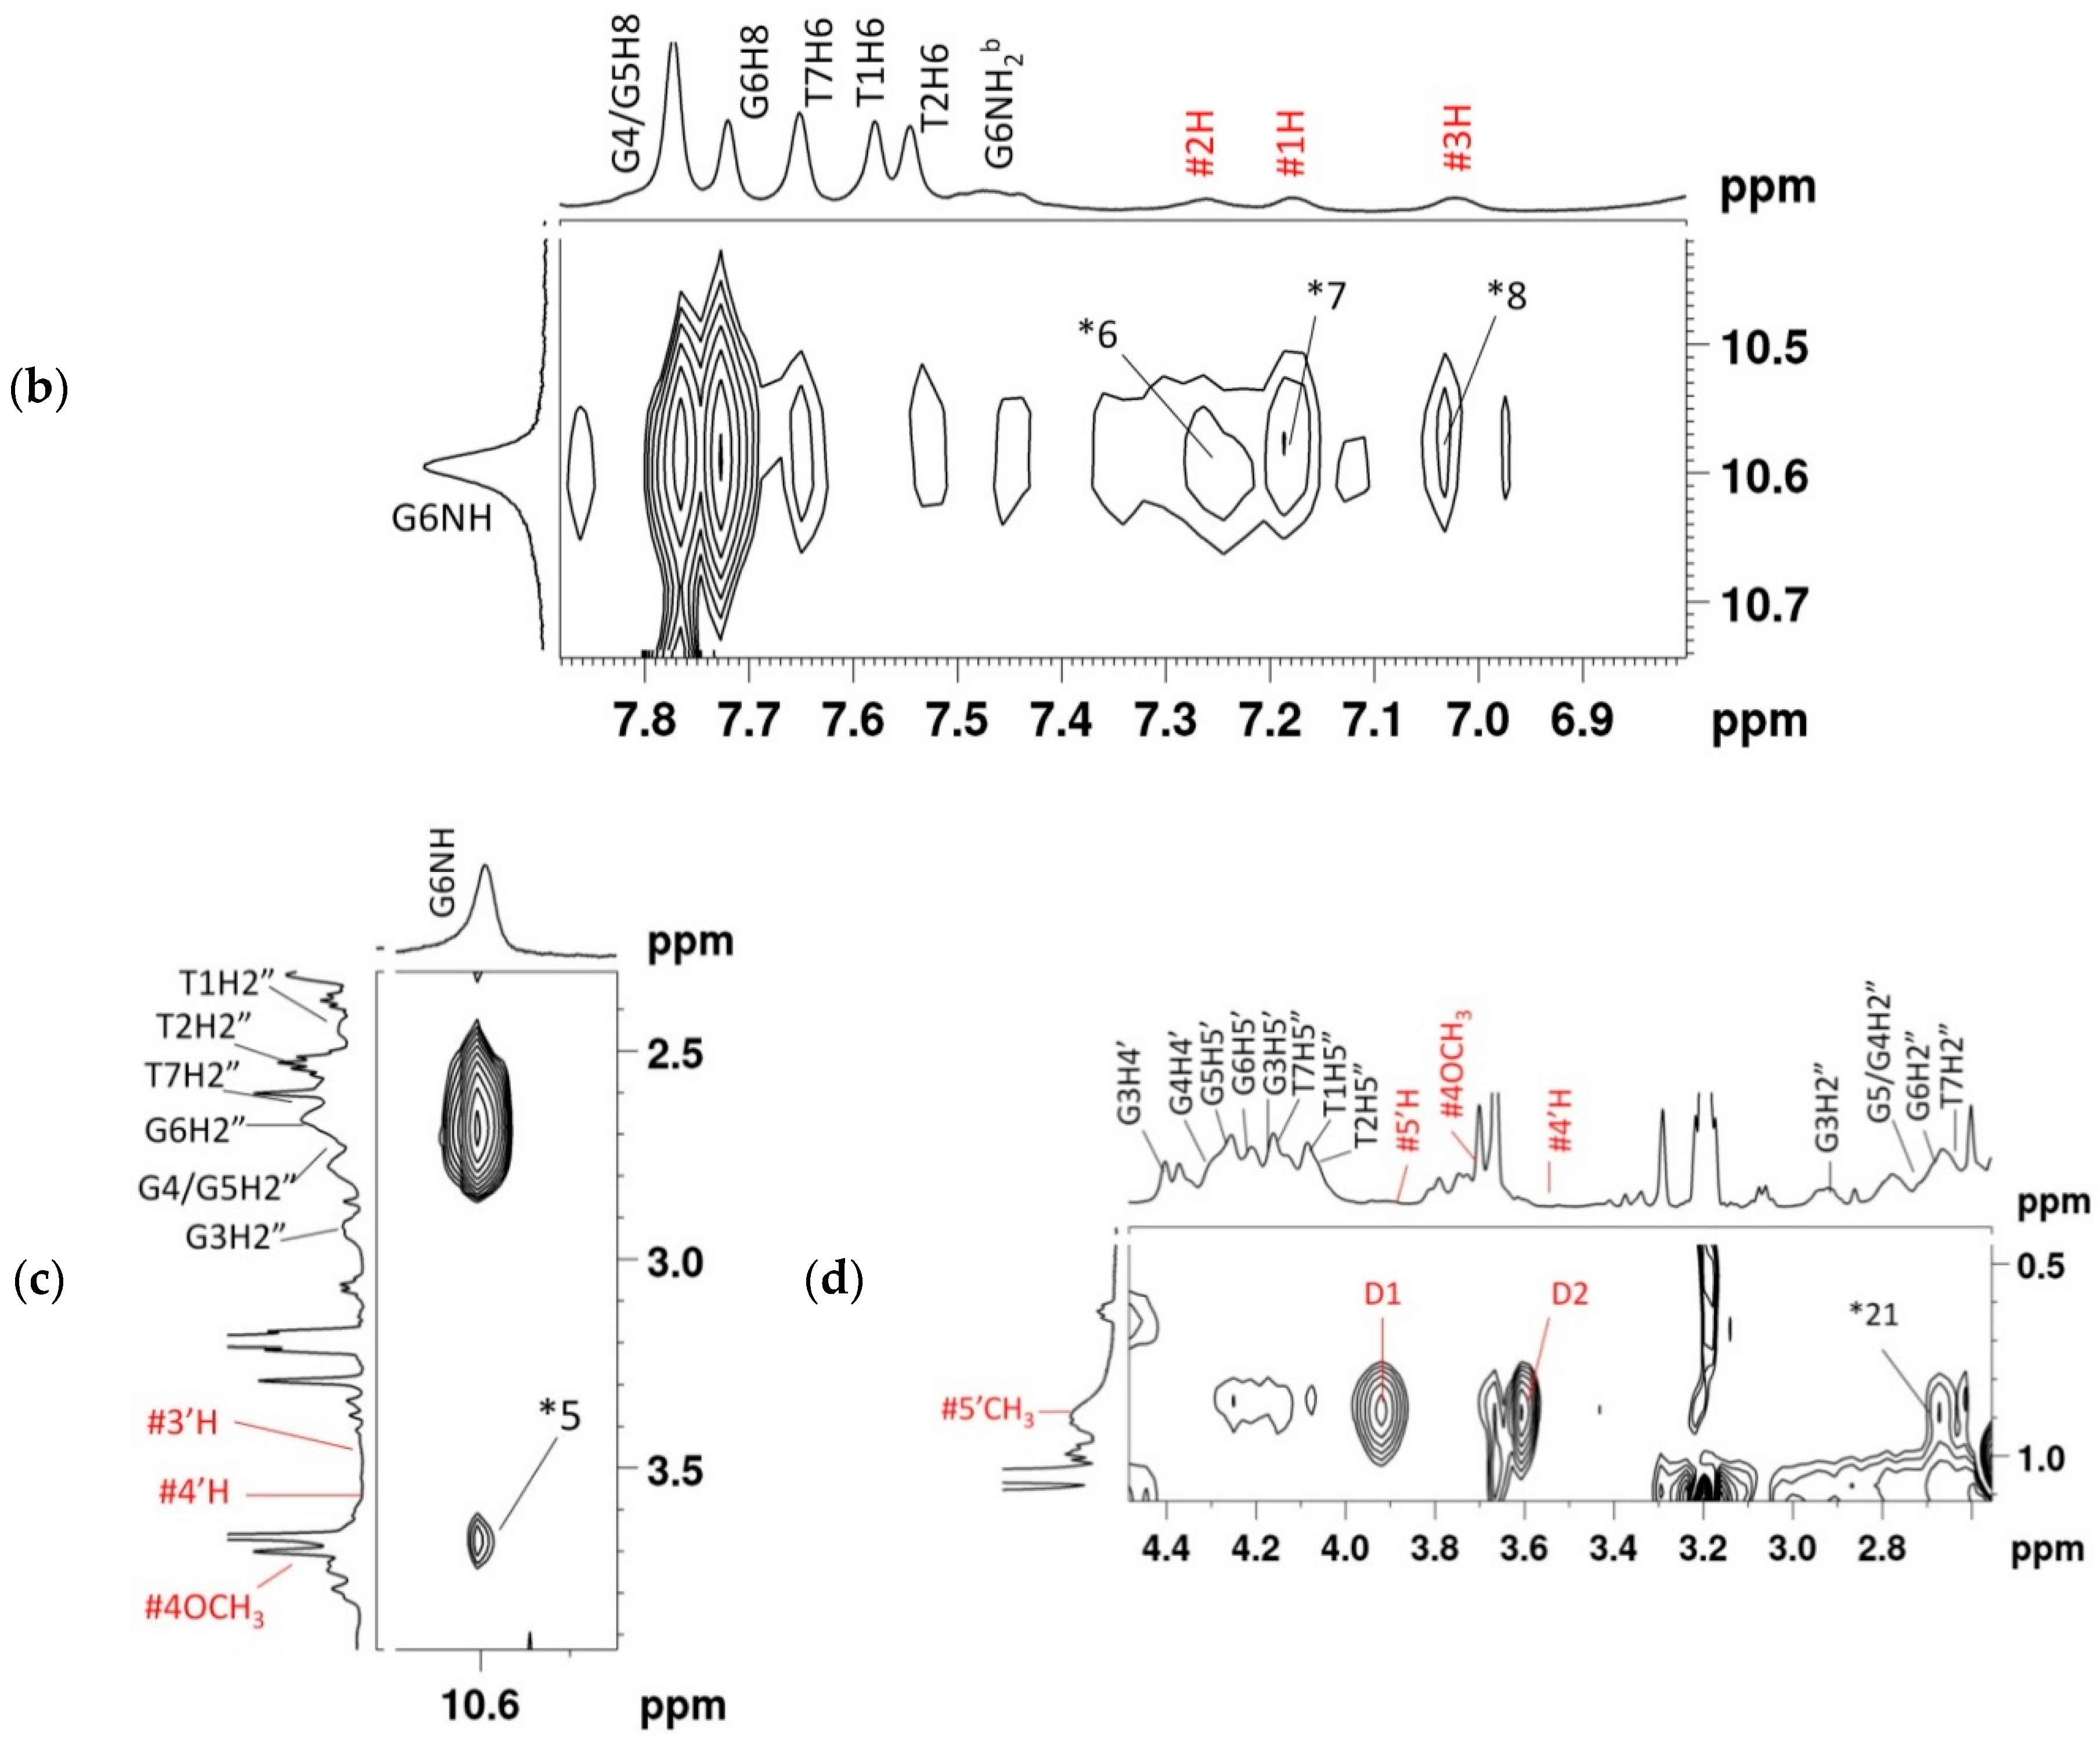
2.2. Proton Nuclear Magnetic Resonance
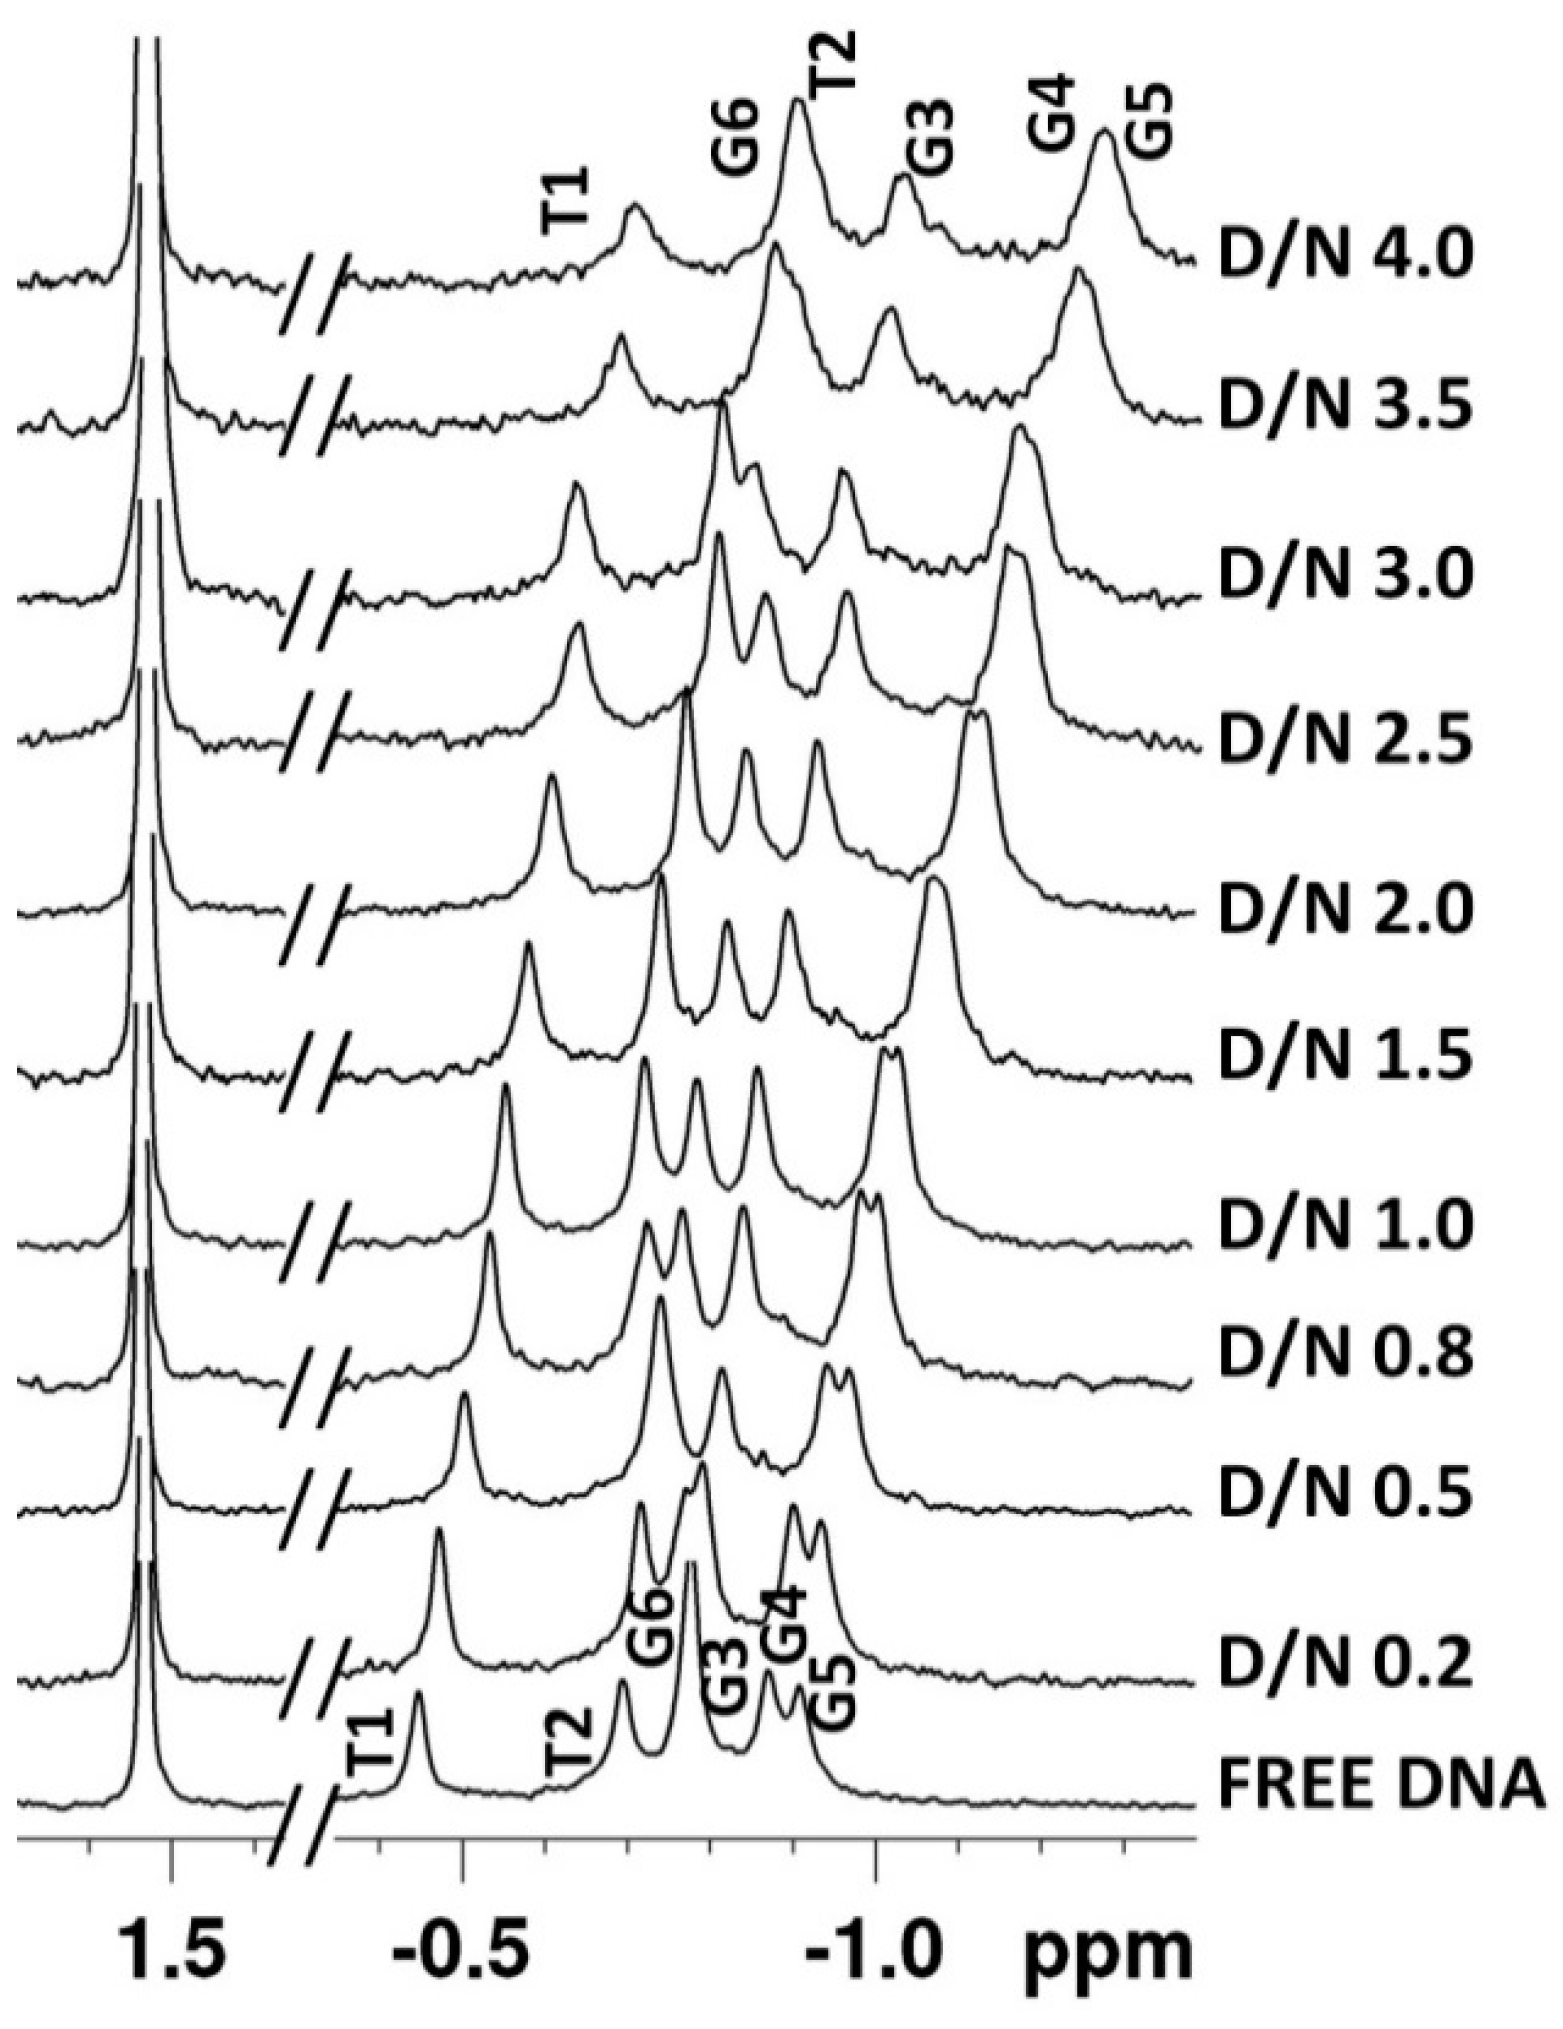
2.3. Phosphorus-31 Nuclear Magnetic Resonance
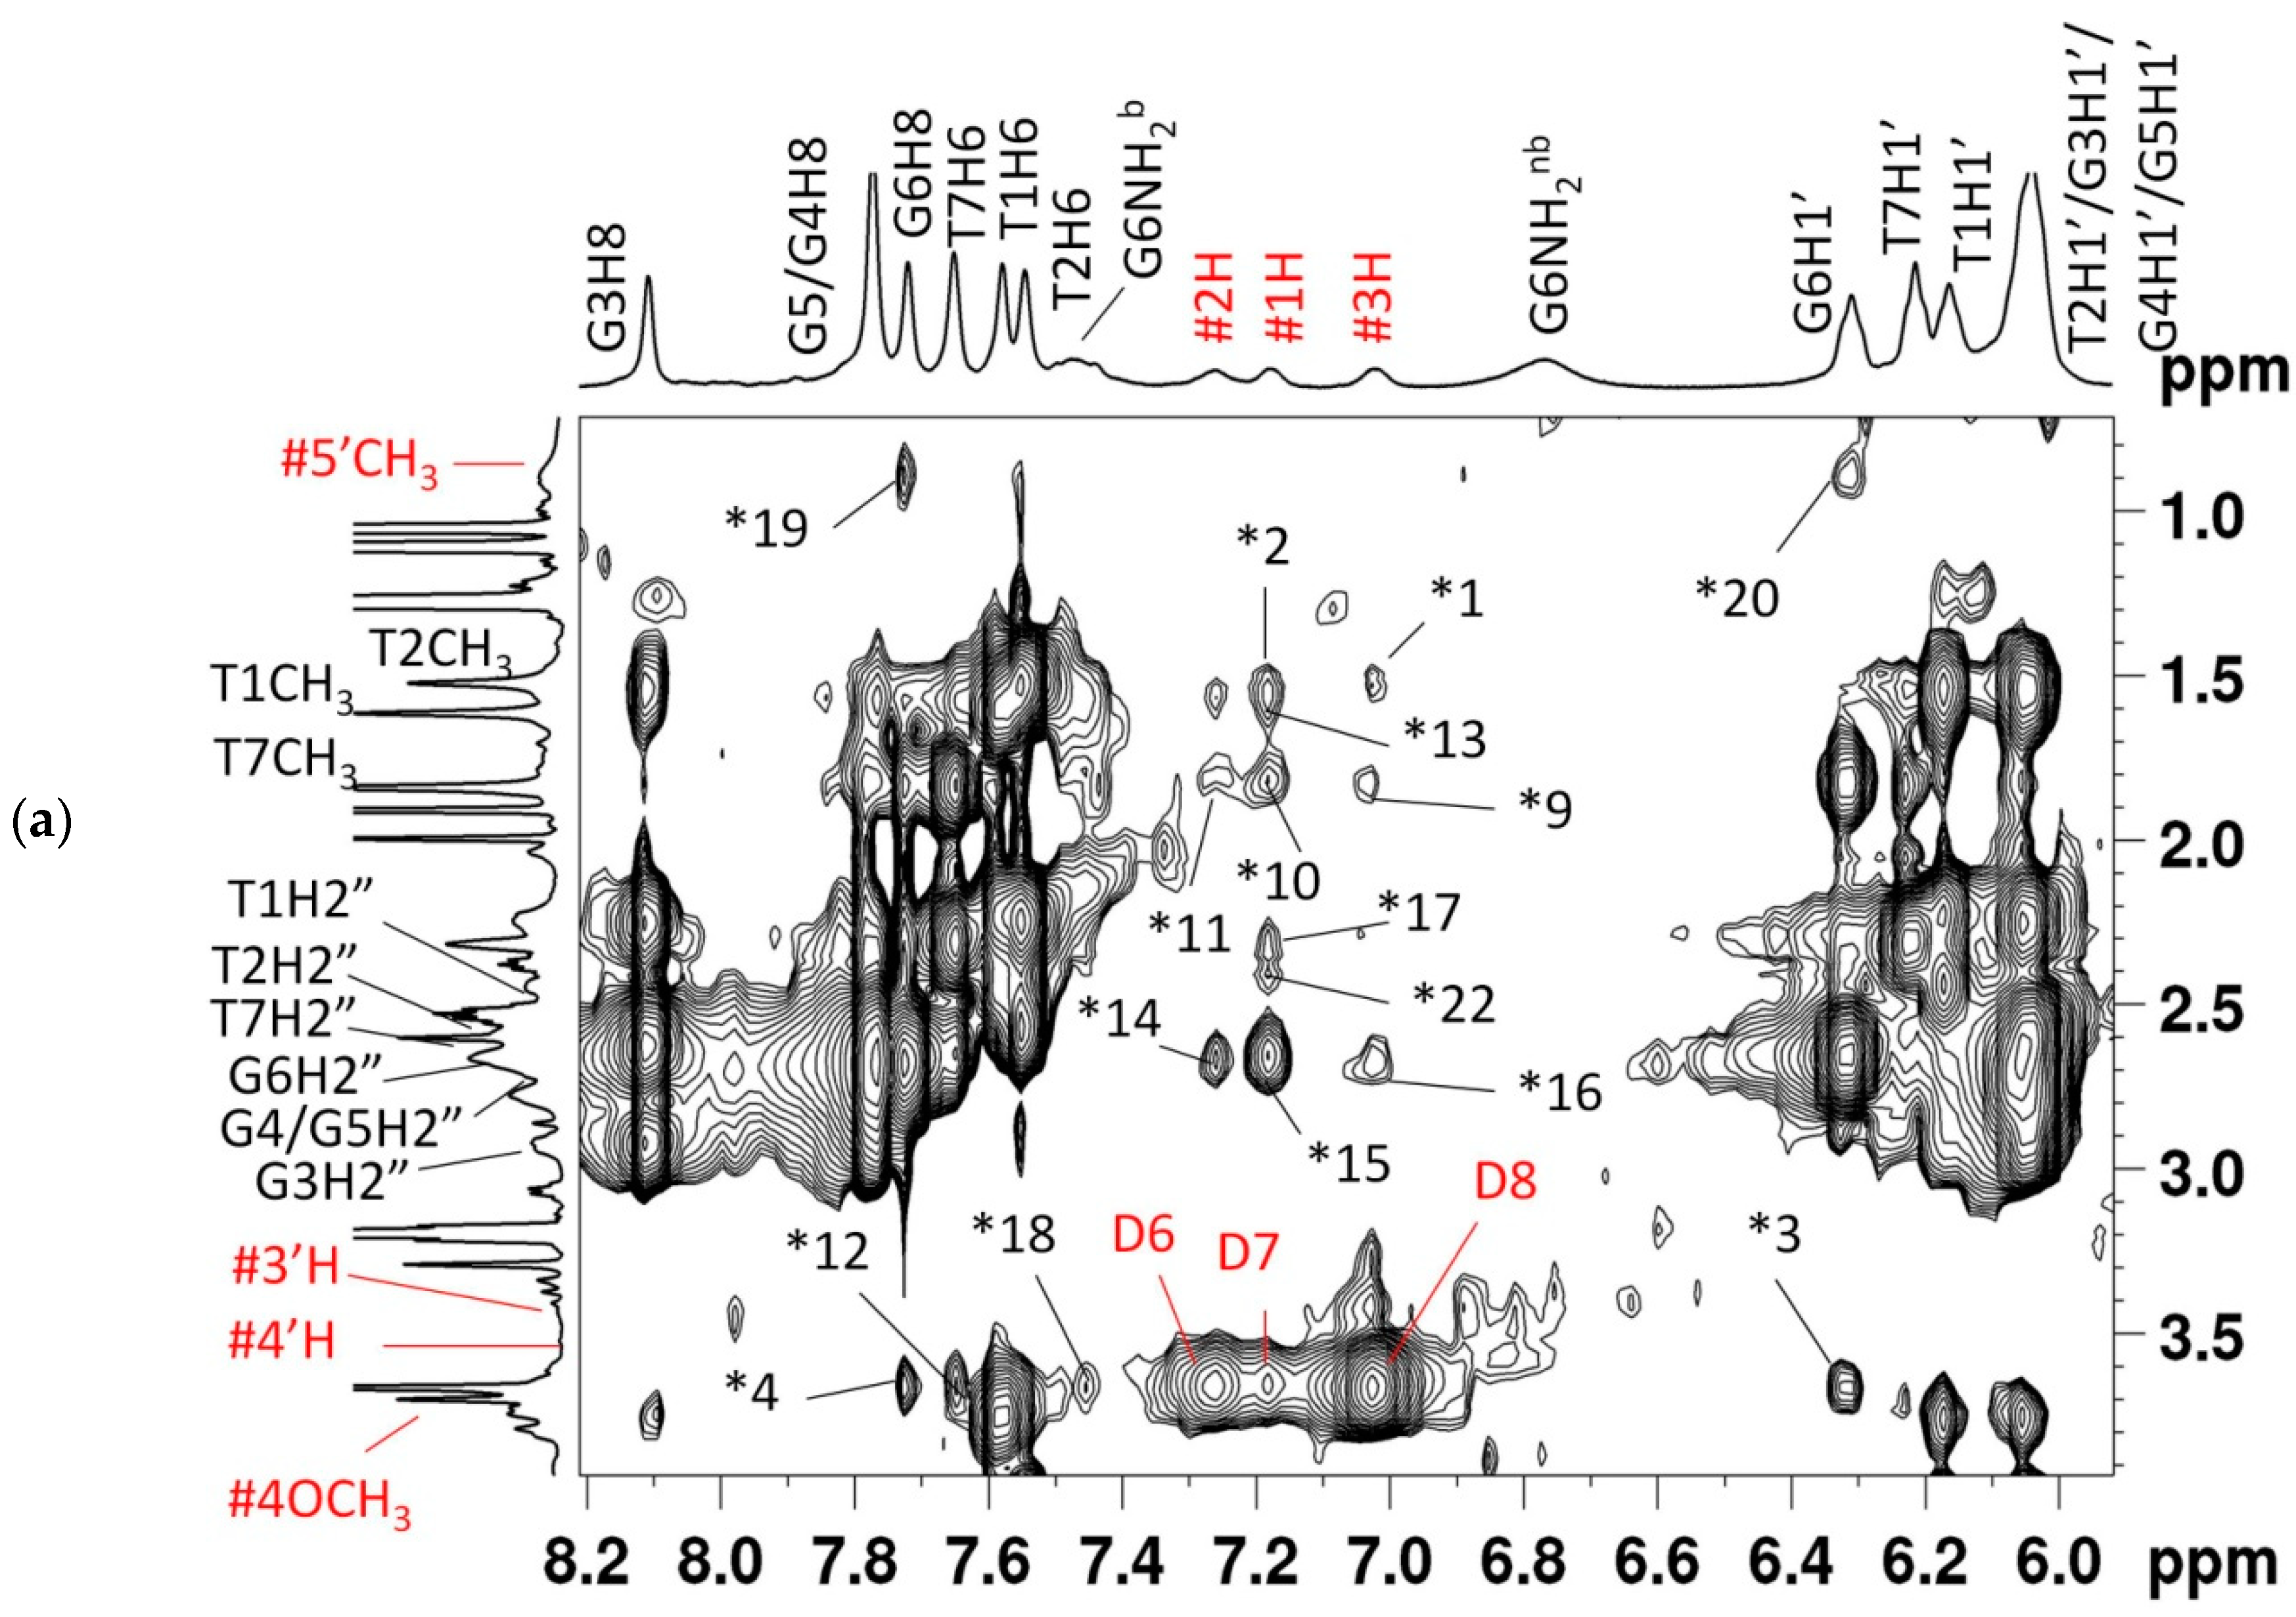
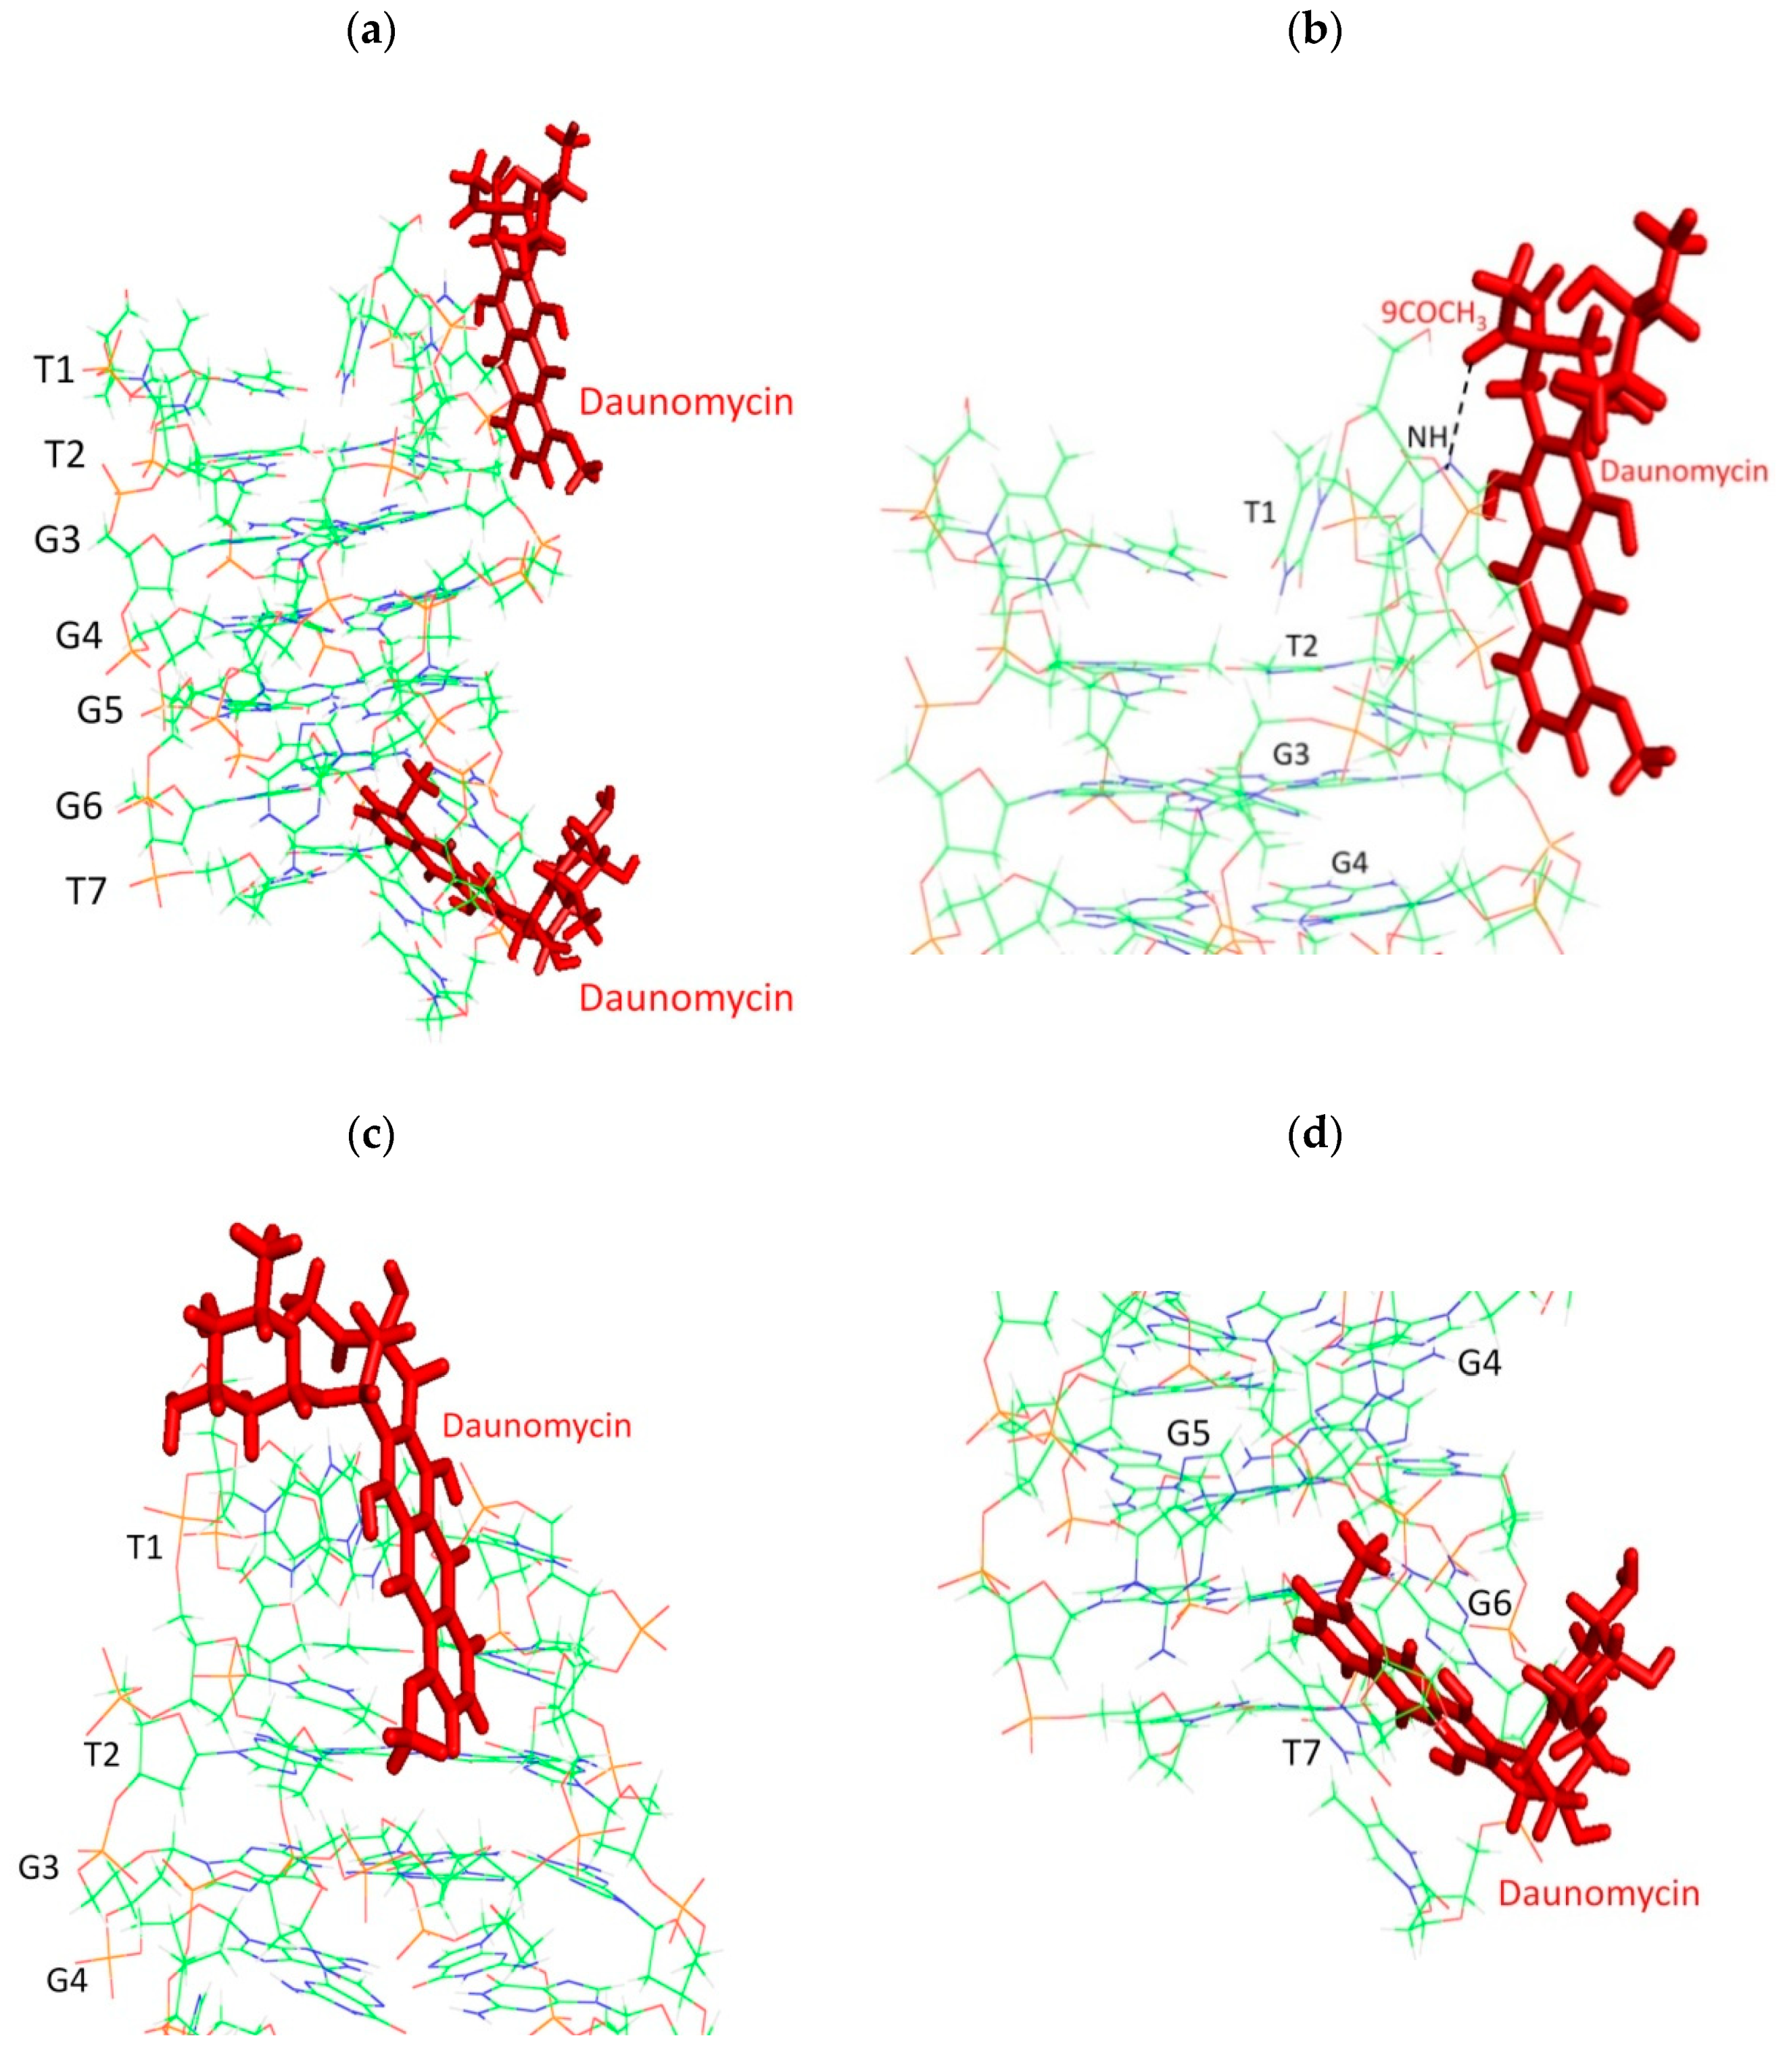
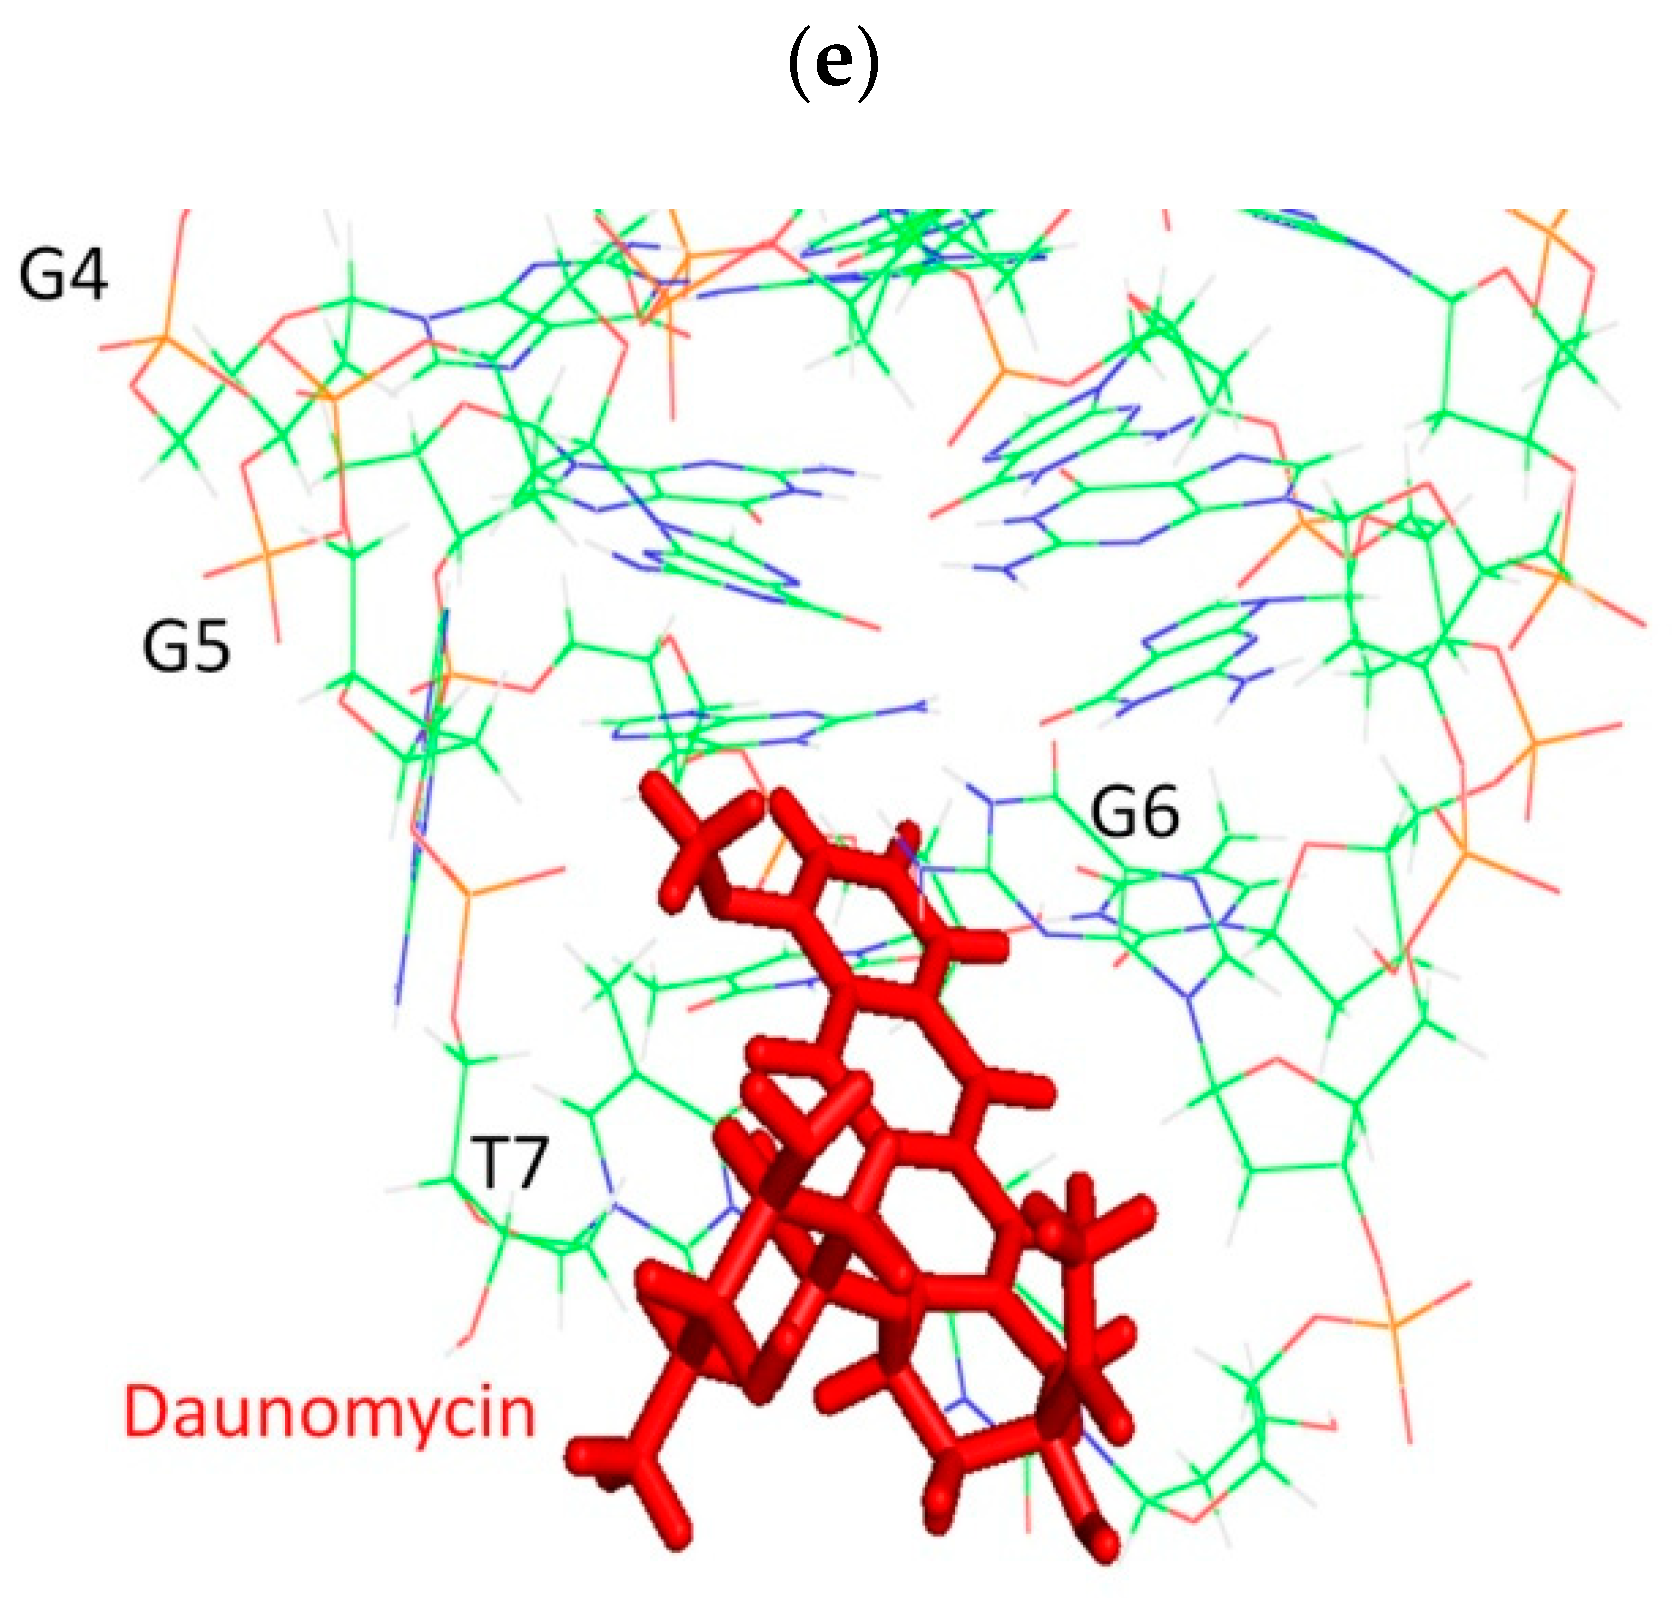
2.4. NOE Correlations and Conformation of Complex
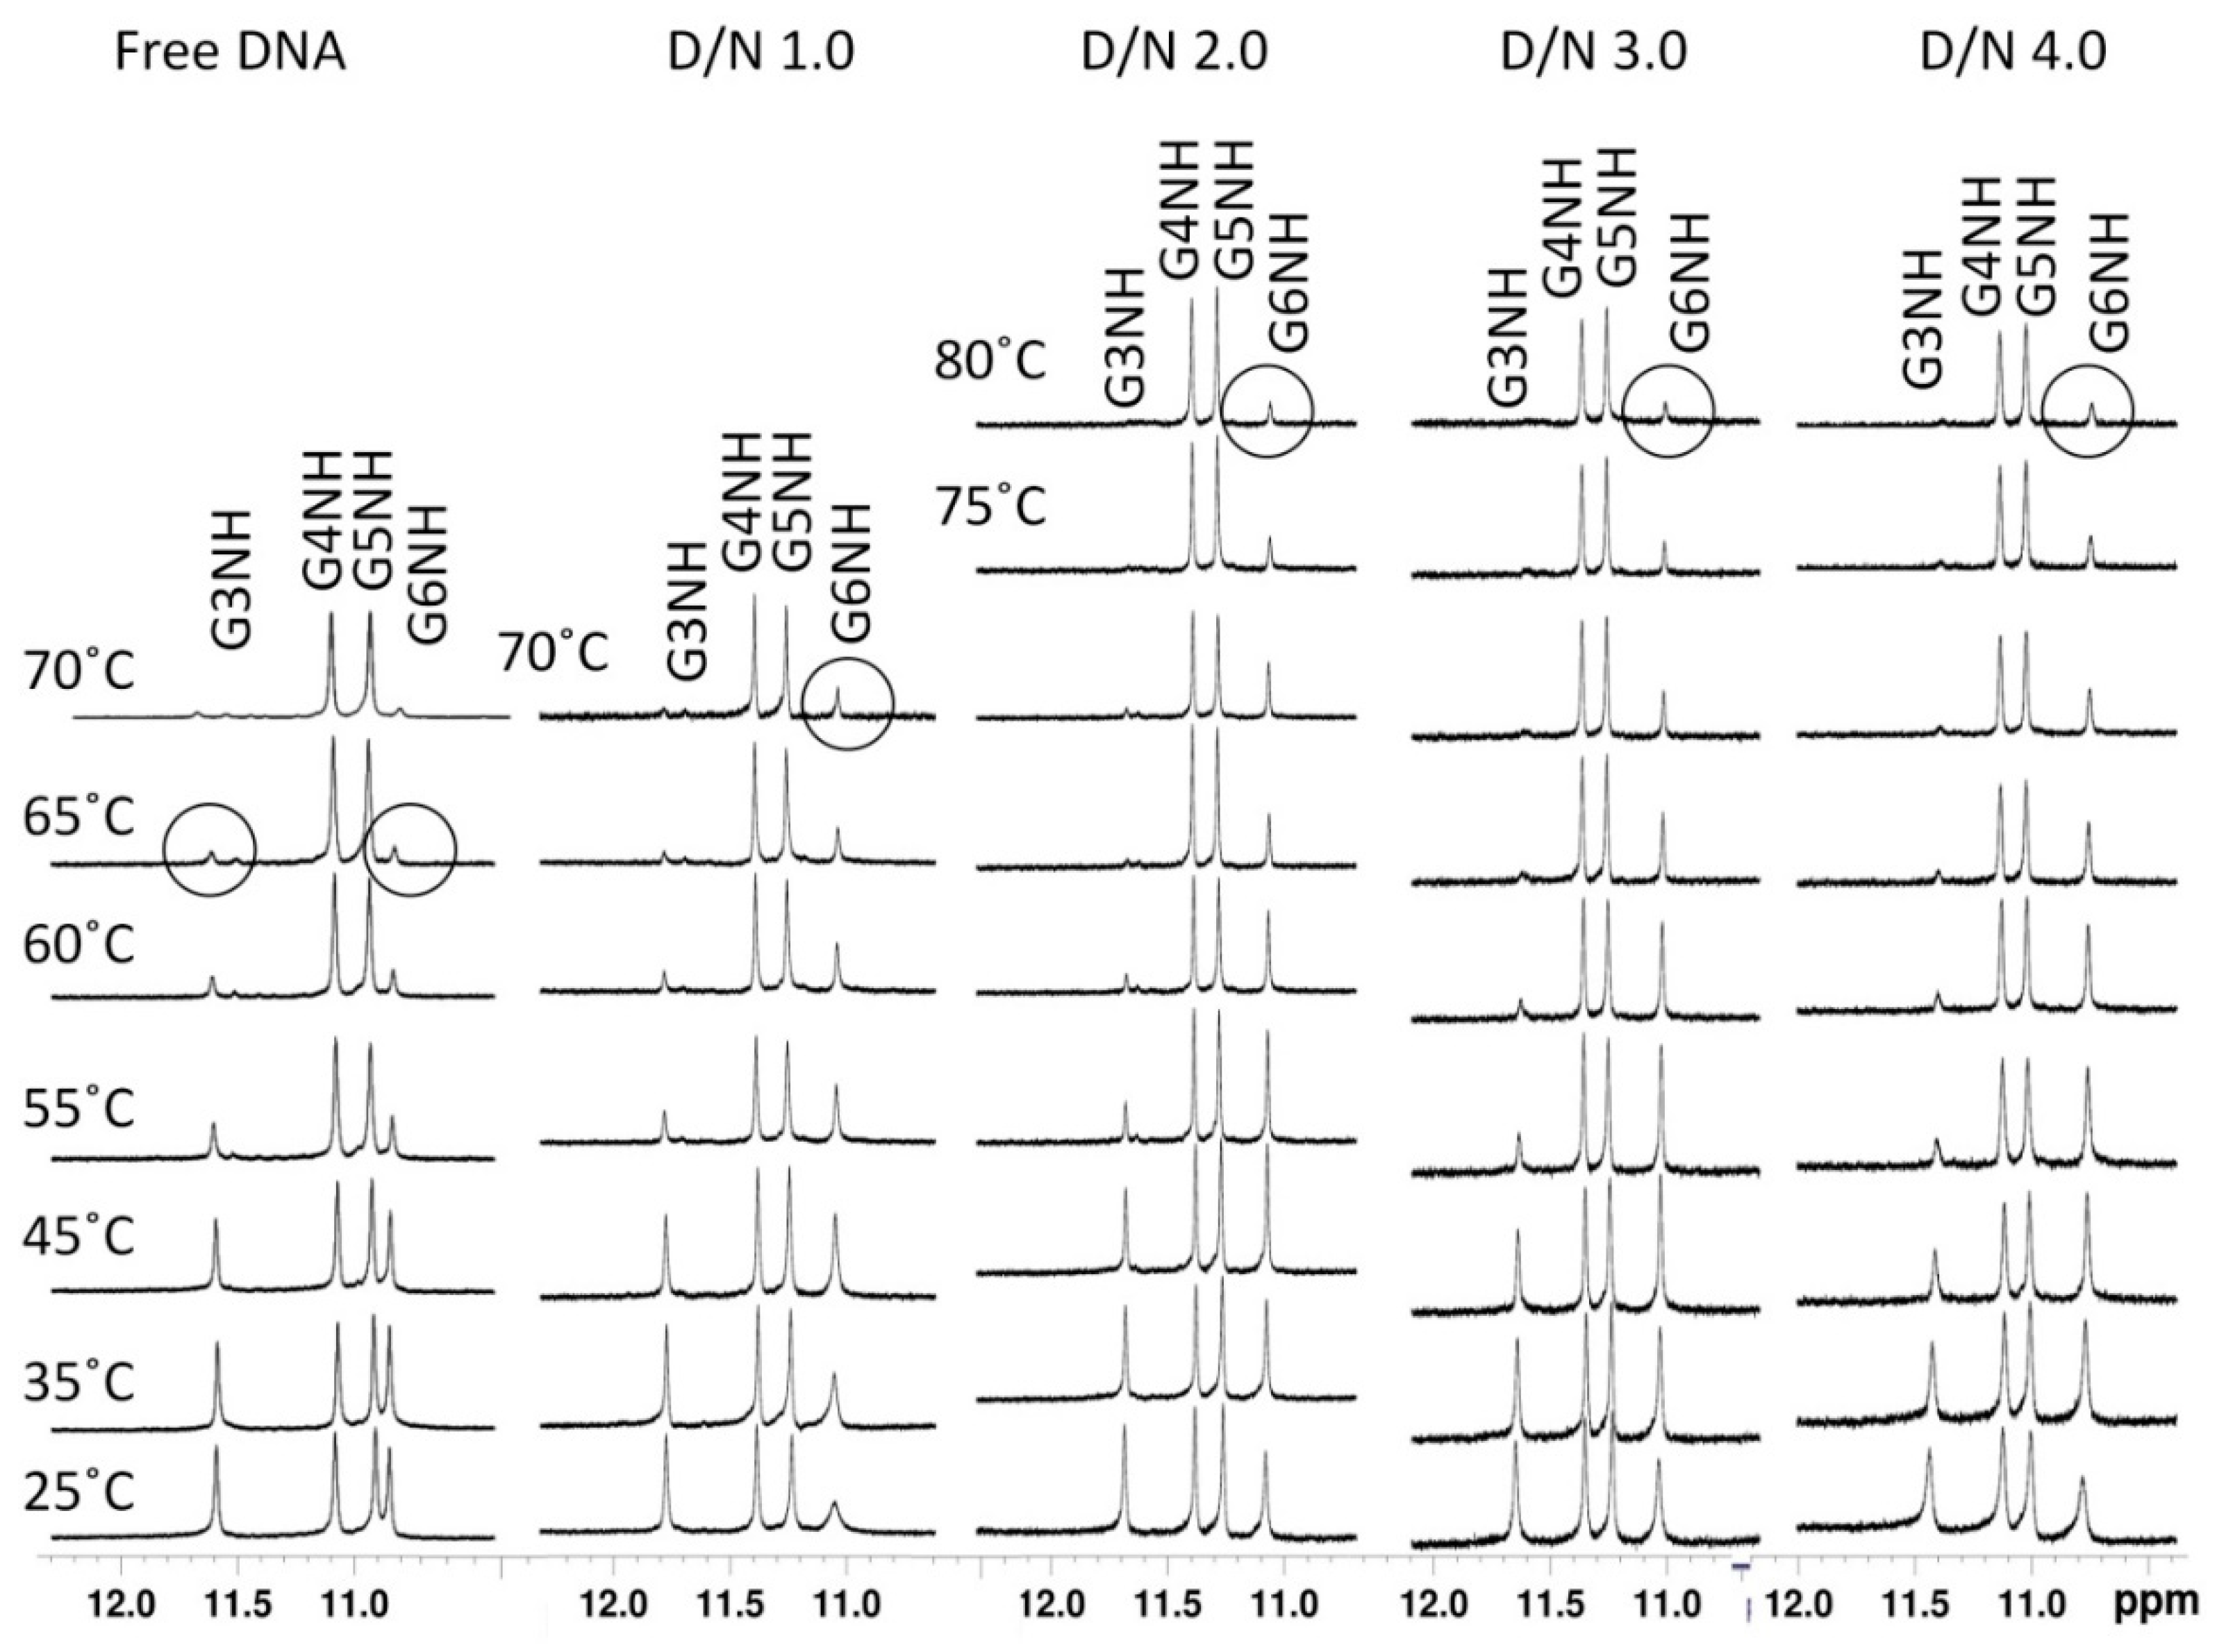
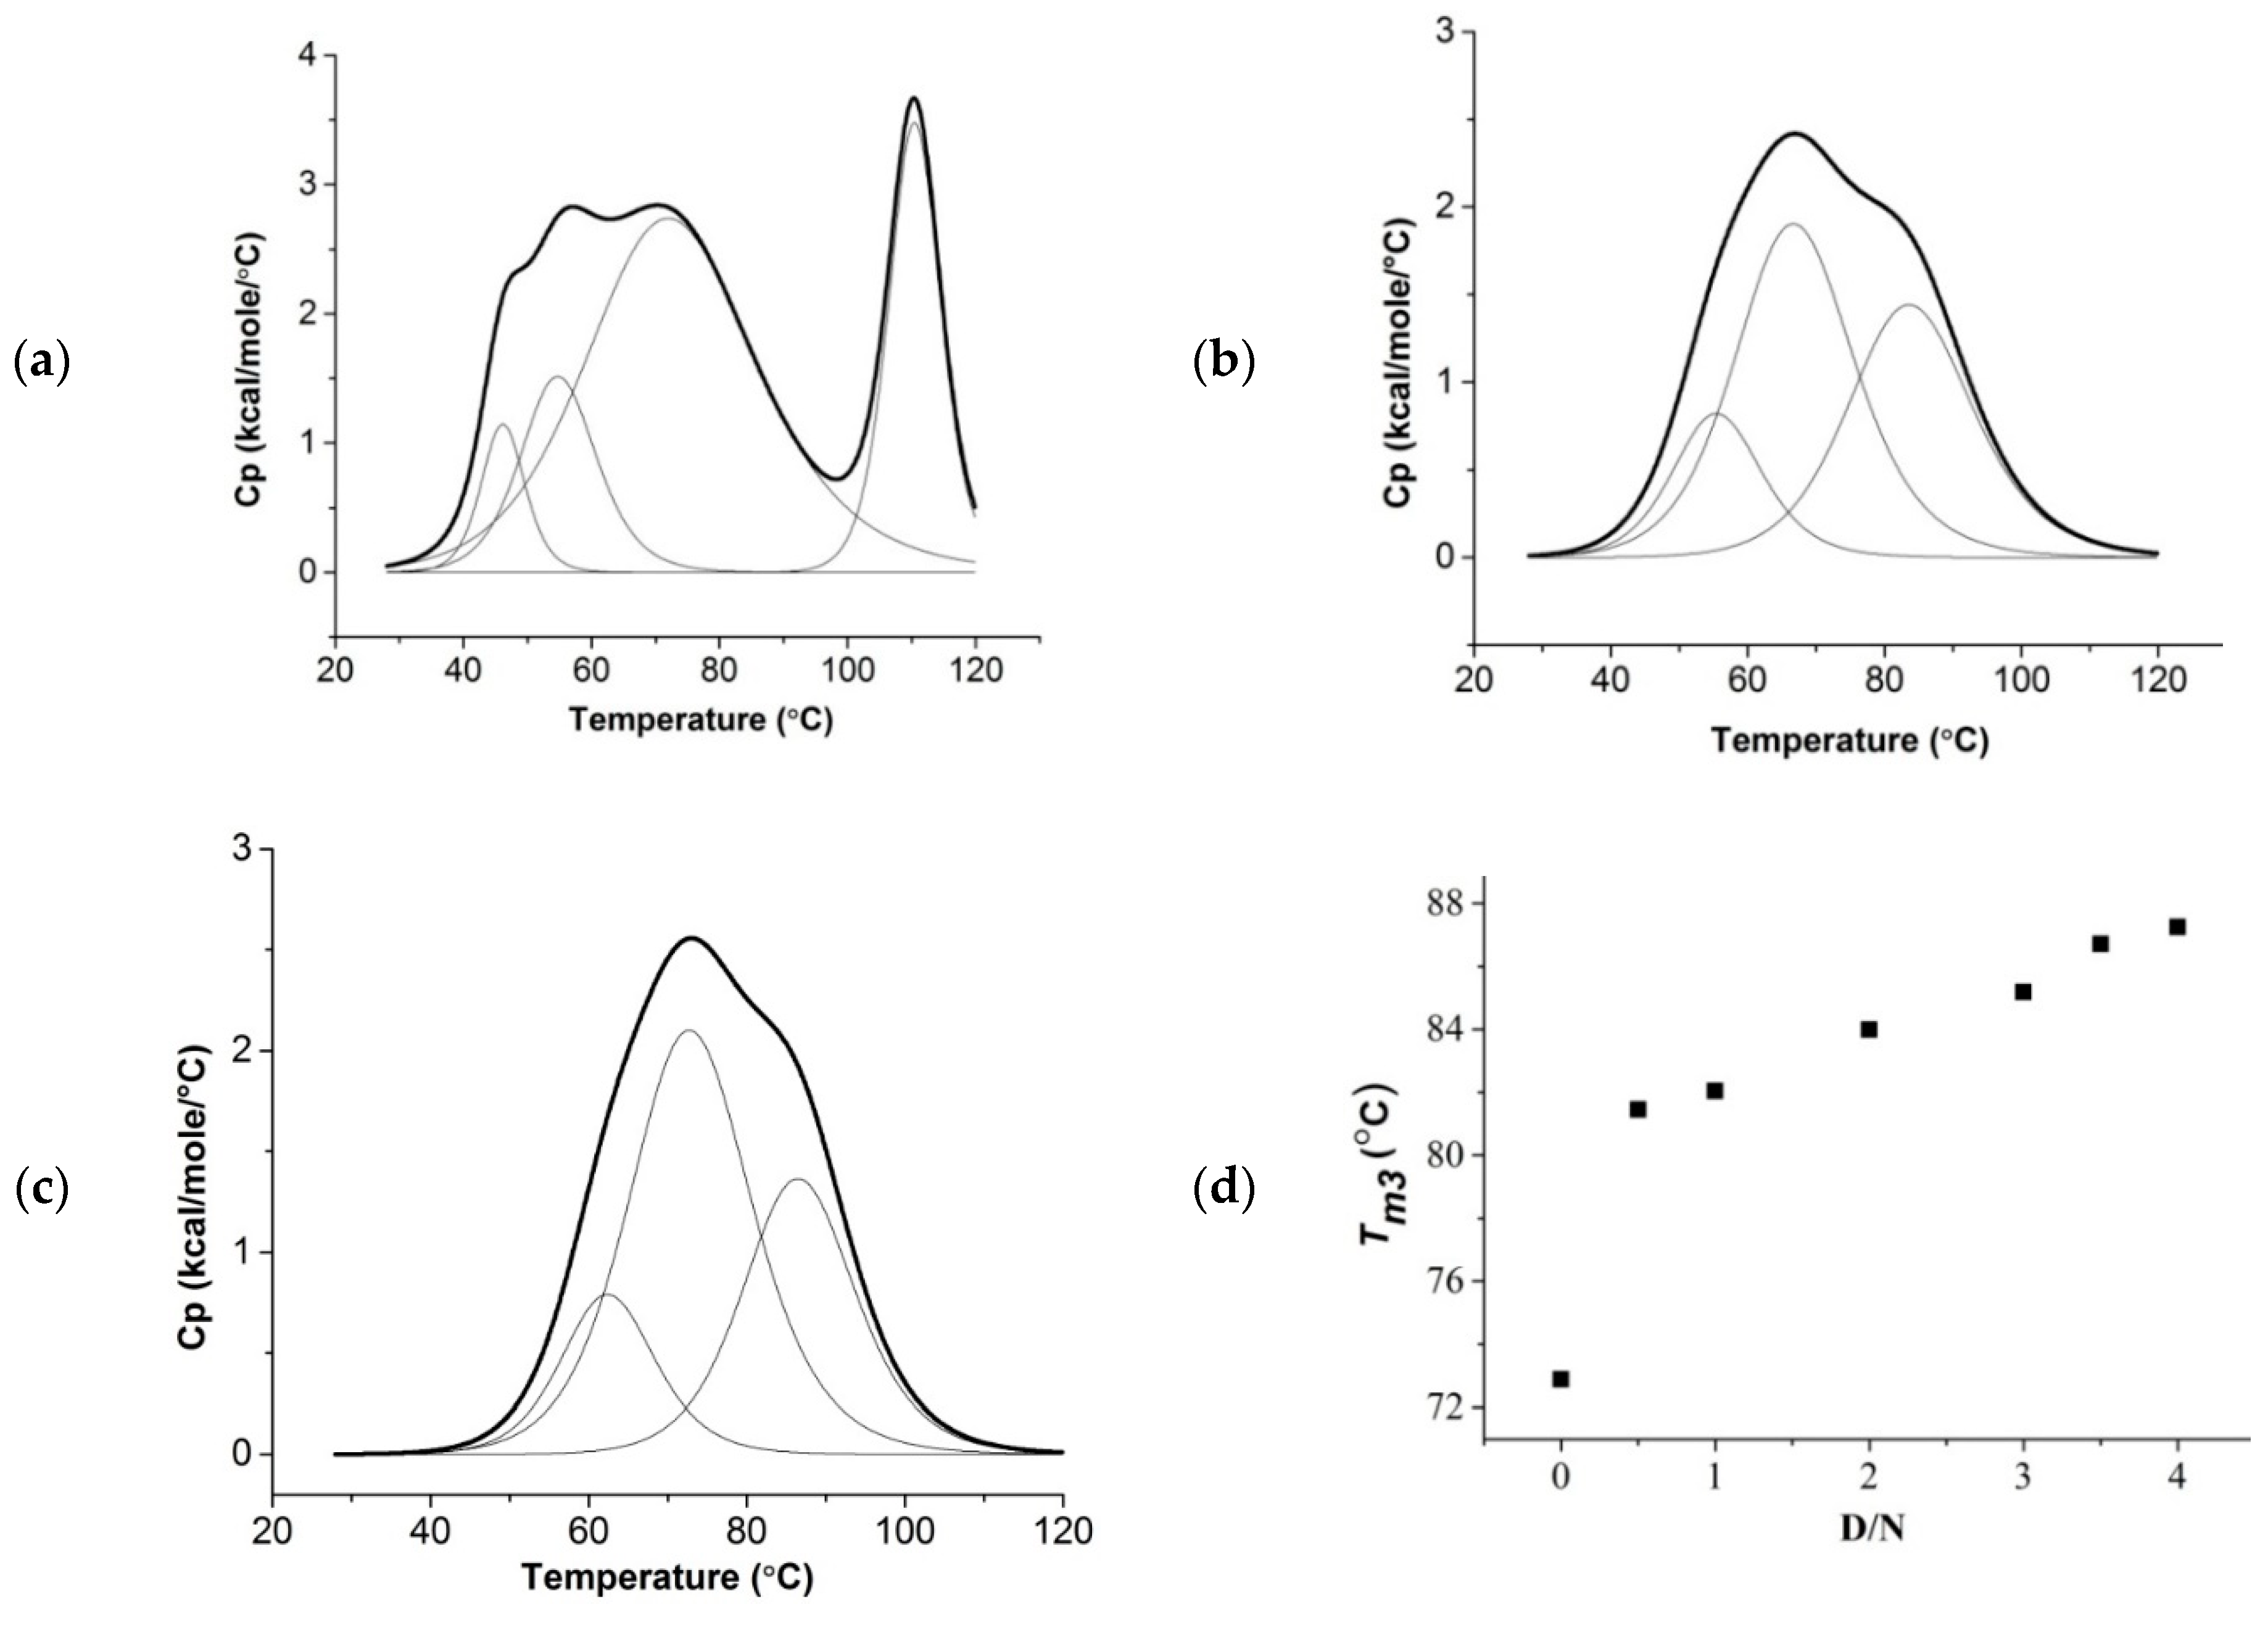
2.5. Thermal Denaturation
2.6. Groove Binding Mode
3. Materials and Methods
3.1. Surface Plasmon Resonance
3.2. Job Plot Using Fluorescence
3.3. Circular Dichroism
3.4. Nuclear Magnetic Resonance
3.5. Restrained Molecular Dynamics Simulations
3.6. Differential Scanning Calorimetry
4. Conclusions
Supplementary Materials
Author Contributions
Funding
Acknowledgments
Conflicts of Interest
References
- Neidle, S.; Parkinson, G. Telomere maintenance as a target for anticancer drug discovery. Nat. Rev. Drug Discov. 2002, 1, 383–393. [Google Scholar] [CrossRef] [PubMed]
- De Cian, A.; Lacroix, L.; Douarre, C.; Temime-Smaali, N.; Trentesaux, C.; Riou, J.F.; Mergny, J.L. Targeting telomeres and telomerase. Biochimie 2008, 90, 131–155. [Google Scholar] [CrossRef] [PubMed]
- Qin, Y.; Hurley, L.H. Structures, folding patterns, and functions of intramolecular DNA G-quadruplexes found in eukaryotic promoter regions. Biochimie 2008, 90, 1149–1171. [Google Scholar] [CrossRef] [PubMed]
- Monchaud, D.; Teulade-Fichou, M.-P. A hitchhiker’s guide to G-quadruplex ligands. Org. Biomol. Chem. 2008, 6, 627–636. [Google Scholar] [CrossRef] [PubMed]
- Neidle, S. The Molecular Basis for the Action of Some DNA-Binding Drugs. Prog. Med. Chem. 1979, 16, 151–221. [Google Scholar] [CrossRef] [PubMed]
- Minotti, G.; Menna, P.; Salvatorelli, E.; Cairo, G.; Gianni, L. Anthracyclines: Molecular Advances and Pharmacologic Developments in Antitumor Activity and Cardiotoxicity. Pharmacol. Rev. 2004, 56, 185–229. [Google Scholar] [CrossRef] [PubMed]
- Wójcik, K.; Zarebski, M.; Cossarizza, A.; Dobrucki, J.W. Daunomycin, an antitumor DNA intercalator, influences histone-DNA interactions. Cancer Biol. Ther. 2013, 14, 823–832. [Google Scholar] [CrossRef] [PubMed]
- Elmore, L.W.; Rehder, C.W.; Di, X.; McChesney, P.A.; Jackson-Cook, C.K.; Gewirtz, D.A.; Holt, S.E. Adriamycin-induced senescence in breast tumor cells involves functional p53 and telomere dysfunction. J. Biol. Chem. 2002, 277, 35509–35515. [Google Scholar] [CrossRef] [PubMed]
- Ogretmen, B.; Kraveka, J.M.; Schady, D.; Usta, J.; Hannun, Y.A.; Obeid, L.M. Molecular Mechanisms of Ceramide-mediated Telomerase Inhibition in the A549 Human Lung Adenocarcinoma Cell Line. J. Biol. Chem. 2001, 276, 32506–32514. [Google Scholar] [CrossRef] [PubMed]
- Nakajima, A.; Tauchi, T.; Sashida, G.; Sumi, M.; Abe, K.; Yamamoto, K.; Ohyashiki, J.H.; Ohyashiki, K. Telomerase inhibition enhances apoptosis in human acute leukemia cells: Possibility of antitelomerase therapy. Leukemia 2003, 17, 560–567. [Google Scholar] [CrossRef] [PubMed]
- Sabatino, M.A.; Marabese, M.; Ganzinelli, M.; Caiola, E.; Geroni, C.; Broggini, M. Down-regulation of the nucleotide excision repair gene XPG as a new mechanism of drug resistance in human and murine cancer cells. Mol. Cancer 2010, 9, 259. [Google Scholar] [CrossRef] [PubMed]
- Zhang, B.; Qian, D.; Ma, H.-H.; Jin, R.; Yang, P.-X.; Cai, M.-Y.; Liu, Y.-H.; Liao, Y.-J.; Deng, H.-X.; Mai, S.-J.; et al. Anthracyclines disrupt telomere maintenance by telomerase through inducing PinX1 ubiquitination and degradation. Oncogene 2012, 31, 1–12. [Google Scholar] [CrossRef] [PubMed]
- Hussner, J.; Ameling, S.; Hammer, E.; Herzog, S.; Steil, L.; Schwebe, M.; Niessen, J.; Schroeder, H.W.S.; Kroemer, H.K.; Ritter, C.A.; et al. Regulation of Interferon-Inducible Proteins by Doxorubicin via Interferon -Janus Tyrosine Kinase-Signal Transducer and Activator of Transcription Signaling in Tumor Cells. Mol. Pharmacol. 2012, 81, 679–688. [Google Scholar] [CrossRef] [PubMed]
- Ren, J.; Chaires, J.B. Sequence and structural selectivity of nucleic acid binding ligands. Biochemistry 1999, 38, 16067–16075. [Google Scholar] [CrossRef] [PubMed]
- Smargiasso, N.; Rosu, F.; Hsia, W.; Colson, P.; Baker, E.S.; Bowers, M.T.; De Pauw, E.; Gabelica, V. G-quadruplex DNA assemblies: Loop length, cation identity, and multimer formation. J. Am. Chem. Soc. 2008, 130, 10208–10216. [Google Scholar] [CrossRef] [PubMed]
- Phan, A.T.; Modi, Y.S.; Patel, D.J. Two-repeat Tetrahymena telomeric d(TGGGGTTGGGGT) sequence interconverts between asymmetric dimeric G-quadruplexes in solution. J. Mol. Biol. 2004, 338, 93–102. [Google Scholar] [CrossRef] [PubMed]
- Parkinson, G.N.; Lee, M.P.H.; Neidle, S. Crystal structure of parallel quadruplexes from human telomeric DNA. Nature 2002, 417, 876–880. [Google Scholar] [CrossRef] [PubMed]
- Vorlíčková, M.; Kejnovská, I.; Sagi, J.; Renčiuk, D.; Bednářová, K.; Motlová, J.; Kypr, J. Circular dichroism and guanine quadruplexes. Methods 2012, 57, 64–75. [Google Scholar] [CrossRef] [PubMed]
- Randazzo, A.; Galeone, A.; Mayol, L. 1H-NMR study of the interaction of distamycin A and netropsin with the parallel stranded tetraplex [d(TGGGGT)]4. Chem. Commun. 2001, 1030–1031. [Google Scholar] [CrossRef]
- Fedoroff, O.Y.; Salazar, M.; Han, H.; Chemeris, V.V.; Kerwin, S.M.; Hurley, L.H. NMR-based model of a telomerase-inhibiting compound bound to G-quadruplex DNA. Biochemistry 1998, 37, 12367–12374. [Google Scholar] [CrossRef] [PubMed]
- Cocco, M.J.; Hanakahi, LA.; Huber, M.D.; Maizels, N. Specific interactions of distamycin with G-quadruplex DNA. Nucleic Acids Res. 2003, 31, 2944–2951. [Google Scholar] [CrossRef] [PubMed]
- Gavathiotis, E.; Heald, R.A.; Stevens, M.F.G.; Searle, M.S. Drug recognition and stabilisation of the parallel-stranded DNA quadruplex d(TTAGGGT)4 containing the human telomeric repeat. J. Mol. Biol. 2003, 334, 25–36. [Google Scholar] [CrossRef] [PubMed]
- Clark, G.R.; Pytel, P.D.; Squire, C.J.; Neidle, S. Structure of the first parallel DNA quadruplex-drug complex. J. Am. Chem. Soc. 2003, 125, 4066–4067. [Google Scholar] [CrossRef] [PubMed]
- Clark, G.R.; Pytel, P.D.; Squire, C.J. The high-resolution crystal structure of a parallel intermolecular DNA G-4 quadruplex/drug complex employing syn glycosyl linkages. Nucleic Acids Res. 2012, 40, 5731–5738. [Google Scholar] [CrossRef] [PubMed]
- Shen, Z.; Mulholland, K.A.; Zheng, Y.; Wu, C. Binding of anticancer drug daunomycin to a TGGGGT G-quadruplex DNA probed by all-atom molecular dynamics simulations: Additional pure groove binding mode and implications on designing more selective G-quadruplex ligands. J. Mol. Model. 2017, 23, 256. [Google Scholar] [CrossRef] [PubMed]
- Scaglioni, L.; Mondelli, R.; Artali, R.; Sirtori, F.R.; Mazzini, S. Nemorubicin and doxorubicin bind the G-quadruplex sequences of the human telomeres and of the c-MYC promoter element Pu22. Biochim. Biophys. Acta Gen. Subj. 2016, 1860, 1129–1138. [Google Scholar] [CrossRef] [PubMed]
- Wang, Y.; Patel, D.J. Guanine Residues in d(T2AG3) and d(T2G4) Form Parallel-Stranded Potassium Cation Stabilized G-Quadruplexes with Anti Glycosidic Torsion Angles in Solution. Biochemistry 1992, 31, 8112–8119. [Google Scholar] [CrossRef] [PubMed]
- Balagurumoorthy, P.; Brahmachari, S.K. Structure and stability of human telomeric sequence. J. Biol. Chem. 1994, 269, 21858–21869. [Google Scholar] [PubMed]
- Gornall, K.C.; Samosorn, S.; Talib, J.; Bremner, J.B.; Beck, J.L. Selectivity of an indolyl berberine derivative for tetrameric G-quadruplex DNA. Rapid Commun. Mass Spectrom. 2007, 21, 1759–1766. [Google Scholar] [CrossRef] [PubMed]
- Xu, N.; Yang, H.; Cui, M.; Song, F.; Liu, Z.; Liu, S. Evaluation of alkaloids binding to the parallel quadruplex structure [d(TGGGGT)]4 by electrospray ionization mass spectrometry. J. Mass Spectrom. 2012, 47, 694–700. [Google Scholar] [CrossRef] [PubMed]
- Manet, I.; Manoli, F.; Zambelli, B.; Andreano, G.; Masi, A.; Cellai, L.; Ottani, S.; Marconi, G.; Monti, S. Complexes of the antitumoral drugs Doxorubicin and Sabarubicin with telomeric G-quadruplex in basket conformation: Ground and excited state properties. Photochem. Photobiol. Sci. 2011, 10, 1326–1337. [Google Scholar] [CrossRef] [PubMed]
- Manet, I.; Manoli, F.; Zambelli, B.; Andreano, G.; Masi, A.; Cellai, L.; Monti, S. Affinity of the anthracycline antitumor drugsDoxorubicin and Sabarubicin for human telomeric G-quadruplex structures. Phys. Chem. Chem. Phys. 2011, 13, 540–551. [Google Scholar] [CrossRef] [PubMed]
- Das, A.; Chatterjee, S.; Suresh Kumar, G. Targeting human telomeric G-quadruplex DNA with antitumour natural alkaloid aristololactam-β-d-glucoside and its comparison with daunomycin. J. Mol. Recognit. 2017. [Google Scholar] [CrossRef] [PubMed]
- White, E.W.; Tanious, F.; Ismail, M.A.; Reszka, A.P.; Neidle, S.; Boykin, D.W.; Wilson, W.D. Structure-specific recognition of quadruplex DNA by organic cations: Influence of shape, substituents and charge. Biophys. Chem. 2007, 126, 140–153. [Google Scholar] [CrossRef] [PubMed]
- Gallois, L.; Fiallo, M.; Garnier-Suillerot, A. Comparison of the interaction of doxorubicin, daunorubicin, idarubicin and idarubicinol with large unilamellar vesicles circular dichroism study. Biochim. Biophys. Acta Biomembr. 1998, 1370, 31–40. [Google Scholar] [CrossRef]
- Chaires, J.B.; Dattagupta, N.; Crothers, D.M. Self-Association of Daunomycin. Biochemistry 1982, 21, 3927–3932. [Google Scholar] [CrossRef] [PubMed]
- Agrawal, P.; Barthwal, S.K.; Barthwal, R. Studies on self-aggregation of anthracycline drugs by restrained molecular dynamics approach using nuclear magnetic resonance spectroscopy supported by absorption, fluorescence, diffusion ordered spectroscopy and mass spectrometry. Eur. J. Med. Chem. 2009, 44, 1437–1451. [Google Scholar] [CrossRef] [PubMed]
- Evstigneev, M.P.; Khomich, V.V.; Davies, D.B. Self-association of daunomycin antibiotic in various buffer solutions. Russ. J. Phys. Chem. 2006, 80, 741–746. [Google Scholar] [CrossRef]
- Kumar, P.; Barthwal, R. Structural and biophysical insight into dual site binding of the protoberberine alkaloid palmatine to parallel G-quadruplex DNA using NMR, fluorescence and Circular Dichroism spectroscopy. Biochimie 2018, 147, 153–169. [Google Scholar] [CrossRef] [PubMed]
- Padmapriya, K.; Barthwal, R. NMR based structural studies decipher stacking of the alkaloid coralyne to terminal guanines at two different sites in parallel G-quadruplex DNA, [d(TTGGGGT)]4 and [d(TTAGGGT)]4. Biochim. Biophys. Acta Gen. Subj. 2017, 1861, 37–48. [Google Scholar] [CrossRef] [PubMed]
- Pradeep, T.P.; Barthwal, R. NMR structure of dual site binding of mitoxantrone dimer to opposite grooves of parallel stranded G-quadruplex [d-(TTGGGGT)]4. Biochimie 2016, 128–129, 59–69. [Google Scholar] [CrossRef] [PubMed]
- Barthwal, R.; Sharma, U.; Srivastava, N.; Jain, M.; Awasthi, P.; Kaur, M.; Barthwal, S.K.; Govil, G. Structure of daunomycin complexed to d-TGATCA by two-dimensional nuclear magnetic resonance spectroscopy. Eur. J. Med. Chem. 2006, 41, 27–39. [Google Scholar] [CrossRef] [PubMed]
- Phan, A.T.; Kuryavyi, V.; Gaw, H.Y.; Patel, D.J. Small-molecule interaction with a five-guanine-tract G-quadruplex structure from the human MYC promoter. Nat. Chem. Biol. 2005, 1, 167–173. [Google Scholar] [CrossRef] [PubMed]
- Tripathi, S.; Barthwal, R. NMR based structure reveals groove binding of mitoxantrone to two sites of [d-(TTAGGGT)]4 having human telomeric DNA sequence leading to thermal stabilization of G-quadruplex. Int. J. Biol. Macromol. 2017, 111, 326–341. [Google Scholar] [CrossRef] [PubMed]
- Agrawal, P.; Govil, G.; Barthwal, R. Studies on drug-DNA complexes, adriamycin-d-(TGATCA)2 and 4′-epiadriamycin-d-(CGATCG)2, by phosphorus-31 nuclear magnetic resonance spectroscopy. Magn. Reson. Chem. 2009, 47, 390–397. [Google Scholar] [CrossRef] [PubMed]
- Gorenstein, D.G.; Kar, D. 31P chemical shifts in phosphate diester monoanions. Bond angle and torsional angle effects. Biochem. Biophys. Res. Commun. 1975, 65, 1073–1080. [Google Scholar] [CrossRef]
- Frederick, C.A.; Williams, L.D.; Ughetto, G.; van der Marel, G.A.; van Boom, H.J.; Rich, A.; Wang, A.H.J. Structural Comparison of Anticancer Drug-DNA Complexes: Adriamycin and Daunomycin. Biochemistry 1990, 29, 2538–2549. [Google Scholar] [CrossRef] [PubMed]
- Antonacci, C.; Chaires, J.B.; Sheardy, R.D. Biophysical Characterization of the Human Telomeric (TTAGGG)4 Repeat in a Potassium Solution. Biochemistry 2007, 46, 4654–4660. [Google Scholar] [CrossRef] [PubMed]
- Hargrove, A.E.; Zhong, Z.; Sessler, J.L.; Anslyn, E.V. Algorithms for the determination of binding constants and enantiomeric excess in complex host: Guest equilibria using optical measurements. New J. Chem. 2010, 34, 348–354. [Google Scholar] [CrossRef] [PubMed]
Sample Availability: Samples of the compounds are available from the authors. |


| Residues | T1 | T2 | G3 | G4 | ||||
|---|---|---|---|---|---|---|---|---|
| Protons | δb | ∆δ | δb | ∆δ | δb | ∆δ | δb | ∆δ |
| H8/H6 | 7.57 | −0.02 | 7.54 | 0.00 | 8.08 | −0.06 | 7.74 | −0.06 |
| H1′ | 6.15 | 0.01 | 6.05 | 0.02 | 6.03 | −0.04 | 6.02 | −0.04 |
| CH3 | 1.60 | −0.05 | 1.51 | −0.02 | - | - | - | - |
| NH2b | 7.57 | −0.02 | 7.54 | 0.00 | 9.73 | −0.11 | 9.05 | −0.12 |
| NH2nb | - | - | - | - | 6.14 | −0.16 | 6.06 | −0.14 |
| NH | - | - | - | - | 11.36 | −0.15 | 10.97 | −0.11 |
| Residues | G5 | G6 | T7 | |||||
| Protons | δb | ∆δ | δb | ∆δ | δb | ∆δ | ||
| H8/H6 | 7.74 | −0.10 | 7.69 | −0.02 | 7.64 | 0.30 | ||
| H1′ | 6.02 | −0.06 | 6.27 | 0.03 | 6.20 | 0.15 | ||
| CH3 | - | - | - | - | 1.84 | 0.21 | ||
| NH2b | 9.05 | −0.12 | 7.47 | 0.01 | 7.64 | 0.30 | ||
| NH2nb | 7.75 | −0.07 | 6.77 | 0.01 | - | - | ||
| NH | 10.82 | −0.12 | 10.55 | −0.34 | - | - | ||
| Protons | δf | δb | Δδ | Protons | δf | δb | Δδ |
|---|---|---|---|---|---|---|---|
| Ring D | Daunosamine sugar | ||||||
| 2H | 7.71 | 7.20 | −0.51 | 1′H | 5.49 | 5.11 | −0.38 |
| 1H | 7.53 | 7.03 | −0.50 | 2′eq | 1.99 | 1.81 | −0.18 |
| 3H | 7.43 | 6.93 | −0.50 | 2′ax | 1.99 | 1.81 | −0.18 |
| 4OCH3 | 3.94 | 3.60 | −0.34 | 3′H | 3.70 | 3.53 | −0.17 |
| Ring A | 4′H | 3.83 | 3.68 | −0.15 | |||
| 7H | 4.82 | 4.55 | −0.27 | 5′H | 4.27 | 4.05 | −0.22 |
| 8eq | 2.23 | 1.91 | −0.32 | 5′CH3 | 1.30 | 1.05 | −0.25 |
| 8ax | 2.13 | 1.91 | −0.22 | ||||
| 9COCH3 | 2.45 | 2.28 | −0.17 | ||||
| 10eq | 2.94 | 2.58 | −0.36 | ||||
| 10ax | 2.70 | 2.53 | −0.17 | ||||
| S. No. | Intermolecular NOE Correlations | Interproton Distances | S. No. | Intermolecular NOE Correlations | Interproton Distances | ||
|---|---|---|---|---|---|---|---|
| NOESY at D/N = 2.0 | rMD Model | NOESY at D/N = 2.0 | rMD Model | ||||
| 1 | 3H-T2CH3 | 4.22 | 3.44 | 12 | 4OCH3-T7H6 | 4.19 | 4.15 |
| 2 | 1H-T2CH3 | 4.06 | 3.96 | 13 | 1H-T1CH3 | 3–4 | 5.14 |
| 3 | 4OCH3-G6H1′ | 3.99 | 4.57 | 14 | 2H-G6H2′′ | nd | nd |
| 4 | 4OCH3-G6H8 | 4.20 | 4.83 | 15 | 1H-G6H2′′ | nd | nd |
| 5 | 4OCH3-G6NH | 4–5 | 4.31 | 16 | 3H-G6H2′′ | nd | nd |
| 6 | 2H-G6NH | 3–4 | 4.03 | 17 | 1H-G6H2′ | nd | nd |
| 7 | 1H-G6NH | 3.0 | 5.94 | 18 | 4OCH3-G6NH2b | 4.16 | 4.75 |
| 8 | 3H-G6NH | 3–4 | 2.79 | 19 | 5′CH3-G6H8 | nd | nd |
| 9 | 3H-T7CH3 | 4.79 | 4.24 | 20 | 5′CH3-G6H1′ | nd | nd |
| 10 | 1H-T7CH3 | 3.11 | 3.02 | 21 | 5′CH3-G6H2′′ | nd | nd |
| Experimental Restraints | |
|---|---|
| Intramolecular | |
| Daunomycin–Daunomycin | 11 |
| DNA–DNA | 138 |
| Intermolecular | |
| Daunomycin–DNA | 13 |
| Total restraints | 151 |
| Average Root Mean Square Deviation (RMSD) in Å | 0.35 |
| Restraint Violations (distances > 0.3 Å) | 5 |
| Consistent Valence Force Field (CVFF) energy of minimized structures (kcal/mole) | |
| Total | −1641.98 |
| Torsional | 240.33 |
| Electrostatic | −3163.33 |
| Van der Waals | 2527.77 |
© 2018 by the authors. Licensee MDPI, Basel, Switzerland. This article is an open access article distributed under the terms and conditions of the Creative Commons Attribution (CC BY) license (http://creativecommons.org/licenses/by/4.0/).
Share and Cite
Barthwal, R.; Tariq, Z. Molecular Recognition of Parallel G-quadruplex [d-(TTGGGGT)]4 Containing Tetrahymena Telomeric DNA Sequence by Anticancer Drug Daunomycin: NMR-Based Structure and Thermal Stability. Molecules 2018, 23, 2266. https://doi.org/10.3390/molecules23092266
Barthwal R, Tariq Z. Molecular Recognition of Parallel G-quadruplex [d-(TTGGGGT)]4 Containing Tetrahymena Telomeric DNA Sequence by Anticancer Drug Daunomycin: NMR-Based Structure and Thermal Stability. Molecules. 2018; 23(9):2266. https://doi.org/10.3390/molecules23092266
Chicago/Turabian StyleBarthwal, Ritu, and Zia Tariq. 2018. "Molecular Recognition of Parallel G-quadruplex [d-(TTGGGGT)]4 Containing Tetrahymena Telomeric DNA Sequence by Anticancer Drug Daunomycin: NMR-Based Structure and Thermal Stability" Molecules 23, no. 9: 2266. https://doi.org/10.3390/molecules23092266
APA StyleBarthwal, R., & Tariq, Z. (2018). Molecular Recognition of Parallel G-quadruplex [d-(TTGGGGT)]4 Containing Tetrahymena Telomeric DNA Sequence by Anticancer Drug Daunomycin: NMR-Based Structure and Thermal Stability. Molecules, 23(9), 2266. https://doi.org/10.3390/molecules23092266