Article

Salivary Hydrogen Sulfide Measured with a New Highly Sensitive Self-Immolative Coumarin-Based Fluorescent Probe

1
Department of Experimental Physiology and Pathophysiology, Laboratory of the Centre for Preclinical Research, Medical University of Warsaw, 02-097 Warsaw, Poland
2
Institute of Organic Chemistry Polish Academy of Sciences, Kasprzaka 44/52, 01-224 Warsaw, Poland
*
Authors to whom correspondence should be addressed.
Molecules 2018, 23(9), 2241; https://doi.org/10.3390/molecules23092241
Submission received: 22 July 2018 / Revised: 27 August 2018 / Accepted: 28 August 2018 / Published: 3 September 2018
(This article belongs to the Section Medicinal Chemistry)

Abstract

:
Ample evidence suggests that H2S is an important biological mediator, produced by endogenous enzymes and microbiota. So far, several techniques including colorimetric methods, electrochemical analysis and sulfide precipitation have been developed for H2S detection. These methods provide sensitive detection, however, they are destructive for tissues and require tedious sequences of preparation steps for the analyzed samples. Here, we report synthesis of a new fluorescent probe for H2S detection, 4-methyl-2-oxo-2H-chromen-7-yl 5-azidopentanoate (1). The design of 1 is based on combination of two strategies for H2S detection, i.e., reduction of an azido group to an amine in the presence of H2S and intramolecular lactamization. Finally, we measured salivary H2S concentration in healthy, 18–40-year-old volunteers immediately after obtaining specimens. The newly developed self-immolative coumarin-based fluorescence probe (C15H15N3O4) showed high sensitivity to H2S detection in both sodium phosphate buffer at physiological pH and in saliva. Salivary H2S concentration in healthy volunteers was within a range of 1.641–7.124 μM.

1. Introduction

Ample evidence shows that H2S plays a role of a mediator in many biological systems. For example, H2S has been found to contribute to the regulation of the circulatory system [1,2,3] nervous system [4,5], reproductive system [6,7,8] and energy balance [9,10]. In mammalian tissues, H2S is generated endogenously from cysteine and homocysteine. There are at least three enzymes that are responsible for converting sulfur-containing molecules into H2S: cystathionine β-synthase (CBS), cystathionine γ-lyase (CSE) and 3-mercaptopyruvate sulfurtransferase (MPST) [11,12]. Furthermore, H2S is generated in large amounts by microbiota, which is present in the intestines and in the oral cavity. On the one hand, microbiota-produced H2S seems to play a significant physiological role in cardiovascular and gastrointestinal systems [13,14,15,16,17,18,19]. On the other hand, the excessive bacterial production of H2S may cause medical complaints such as halitosis, a chronic bad breath condition [20,21].
Fast catabolism and low stability of H2S results in difficulties in the accurate analysis of H2S concentrations. Several methods have been traditionally employed for H2S detection, including colorimetric and electrochemical assays [22], gas chromatography and sulfide precipitation [23,24].
Most of these techniques require lengthy storing and/or complicated processing of analyzed sample. Therefore, new methods that will be useful for rapid and selective evaluation of H2S concentration in biological systems are highly desired. These requirements may be met by techniques employing fluorescent probes, which do not involve sophisticated sample processing and chemical treatment [25].
The goal of the study was to synthesize the probe that: (i) is facile to synthesize with an easy purification procedure (ii) acts fast (within seconds, considering real-time imaging of H2S-related biological processes), (iii) is chemically stable for long-term storage, (iv) shows a linear concentration–signal relationship within physiologically relevant H2S concentrations (v) is stable in aqueous solutions, especially in physiological pH of a body fluids. Finally, in order to confirm the usability of the designed 4-methyl-2-oxo-2H-chromen-7-yl 5-azidopentanoate (1) for the detection of H2S in biological samples, we aimed to establish salivary H2S concentration in healthy volunteers.

2. Results and Discussion

Here, we have designed and synthesized a new fluorescent probe (C13H11N3O4, compound 1) based on a coumarin scaffold. The operation of compound 1 is based on the azide group to amine group reduction mediated by H2S in combination with spontaneous intramolecular lactamization. The developed probe was characterized by 1H-NMR, 13C-NMR (The Supplementary Materials) Compound 1 showed dhe esired characteristics for a highly sensitive fluorescent probe for H2S detection. Compound 1 showed a good aqueous solubility and worked an an optimal pH ≈ 7.0, the pH of most of mammalian body fluids. Data analysis revealed a linear relationship between the fluorescence signal and the concentration of aqueous solutions of NaHS, a commonly used H2S donor. Finally, the compound 1 was synthesized from commercially available reagents in a straightforward procedure.
Currently, several methods for H2S detection are used, i.e., colorimetric and electrochemical assays and metal-induced sulfide precipitation. Despite the many advantages of the abovementioned methods their widespread use in biological systems is limited. This is due to the complex, multistep mechanisms of H2S detection, a slow response time, poor water solubility and poor stability in aqueous solutions of the reagents, and non-physiological pH of the reaction environment. Moreover, some of those methods require complicated sample processing steps and the destruction of cells or tissues. During the last years fluorescence-based probes have been attracting increasing interest as a method for H2S detection. The fluorescence-based assays for H2S detection offer high selectivity, sensitivity and biocompatibility, less invasiveness and enable real-time imaging [26,27,28]. Various fluorescence methods for H2S detection have been elegantly reviewed by Guo et al. [29]. The synthesis and design strategies of fluorescent probes are based on the use of specific chemical reactions and the use of several characteristic properties of H2S. The most commonly used strategy for designing fluorescent probes is the reduction of azide or nitro groups to amine groups [30,31,32,33,34]. Self-immolative probes based on coumarin were designed and synthesized by Han and co-workers [35]. Based on a similar strategy, Zhao and Song demonstrated a series of probes with para-azidobenzyl group attached to the 1,8-naphthalimide [36,37]. Other methods are based on unique dual nucleophilic reactions [25,38,39], high binding affinity towards copper ions [40,41,42] and a specific addition reaction to unsaturated double bond [43,44,45].
The evaluation of H2S concentration, or more precisely, free sulfhydryl group concentration may also be performed using Ellman’s reagent, i.e., 5,5′-dithiobis(2-nitrobenzoic acid), often referred to as DTNB [46,47,48]. However, the latter method requires alkaline conditions (pH 8.0) and the test absorbance response is obtained no sooner than after 15 min. Therefore, despite the progress in the field of detection methods, further development of highly sensitive and selective fluorescent probes for H2S detection is still needed to provide valuable information on the functions of H2S in physiological and pathological processes.
Saliva is a promising and increasingly used biological material for clinical investigations [49,50]. H2S in saliva may originate from its endogenous synthesis in tissues and from oral microbiota activity. The excessive concentration of H2S in the saliva is associated with halitosis [20,51,52].
In our study, using the newly synthesized probe we showed that the concentration of H2S in saliva of healthy 20–40-year-old humans is in the range between 1.641 and 7.124 μM (Table 1).
Our results are comparable to previously reported ones, however slightly higher [53,54,55]. Generally, the analysis of H2S is a tricky procedure because of the instability of H2S, its high volatility and rapid oxidation. This can lead to falsely elevated or decreased H2S concentrations. The most used methods for H2S detection are colorimetric assays (mainly the methylene blue method), high-performance liquid chromatography and gas chromatography [52]. However, there is much doubt about the reliability of abovementioned methods. Differences between the above methods and the fluorescence method using our probe include different duration of sample preparation and processing, and different measurement conditions. In our study, the collected saliva samples were tested instantly, whereas in other studies the samples were subjected to lengthy processing or storage. For example, in studies by Kaneshiro et al. and Ritz et al. saliva was collected by holding a cotton swab in the mouth for a few minutes [53,54]. Other methods require a chemical treatment with strong acid or base before analysis of H2S [36]. Some of those treatments can lead to falsely elevated or decreased H2S levels and/or cause irreversible destruction of the analyzed sample. For example, the methylene blue method uses acidic conditions (pH = 2) in which so-called acid labile sulfides (ALS) are formed. This contributes to falsely high H2S level readings. As pointed out by Siegel and Kanehira the methylene blue method may be disturbed by interference with other colored substances that interfere with the measurements, lowering the sensitivity of this method [55]. In contrast to the methylene blue method our measurements do not require any chemical pretreatment of the sample. Moreover, compound 1 works in an aqueous medium at pH = 7.4. Finally, the methylene blue method is a single point assay and does not monitor the H2S concentration in real time. There are also doubts about the repeatability of this method [56]. Another disadvantage of currently used methods is their long incubation periods, which are needed to achieve detection [57]. Ritz et al. analyzed H2S concentrations with the fluorescent probe SF4 which required up to 45 min of incubation with a chemosensor. Considering that H2S is a very volatile compound H2S concentrations may decrease significantly during such a long sample processing time.

3. Materials and Methods

3.1. Materials and Instruments

Unless noted otherwise, reagents and solvents for synthesis were obtained from commercial suppliers and employed without further purification. Commercial reagents for quantitating sulfhydryl groups were purchased from Thermo Fisher Scientific (Waltham, MA, USA). Buffer reagents were purchased from Sigma Aldrich (Saint Louis, MO, USA) and were used without purification. All spectroscopic measurements were performed in 0.1 mM sodium phosphate buffer (pH 7.4) or 0.1 M sodium phosphate buffer (pH 8.0). Silica gel P60 (SiliCycle, Québec, QC, Canada) was used for column chromatography and SiliCycle 60 F254 silica gel (precoated sheets, 0.25 mm thick) was used for analytical thin layer chromatography and visualized by fluorescence quenching under UV light. UV/Vis spectra were recorded at ambient temperature using a U-1900 spectrophotometer (Hitachi, Chiyoda, Tokyo, Japan) and quartz cuvettes. Fluorescence spectra were recorded at ambient temperature in quartz cuvettes using a F7000 spectrofluorometer (Hitachi).

3.2. Synthesis and Sensing Mechanisms

In the design of the probe for H2S we used 7-hydroxy-4-methylcoumarin as a fluorophore due to its good stability and desirable spectroscopic properties, such as large absorption extinction coefficients, sharp fluorescence emissions and excitation and emission in visible region [58,59]. The fluorescence of 7-hydroxy-4-methylcoumarin can be easily controlled by modification of hydroxyl group causing changes of physical and chemical properties and fluorescence quenching. Our probe operates by H2S-mediated reduction of azide group, which generates a primary amine, that can subsequently undergo spontaneous intramolecular lactamization to release 7-hydroxy-4-methyl-coumarin and piperidin-2-one (Figure 1). Our scientific concept is analogous to studies reported by Zadlo-Dobrowolska et al. for self-immolative carbonate-based probes [60]. Moreover, in comparison to other fluorogenic assays, self-immolative probes provide a more stable signal with higher signal to noise ratio.
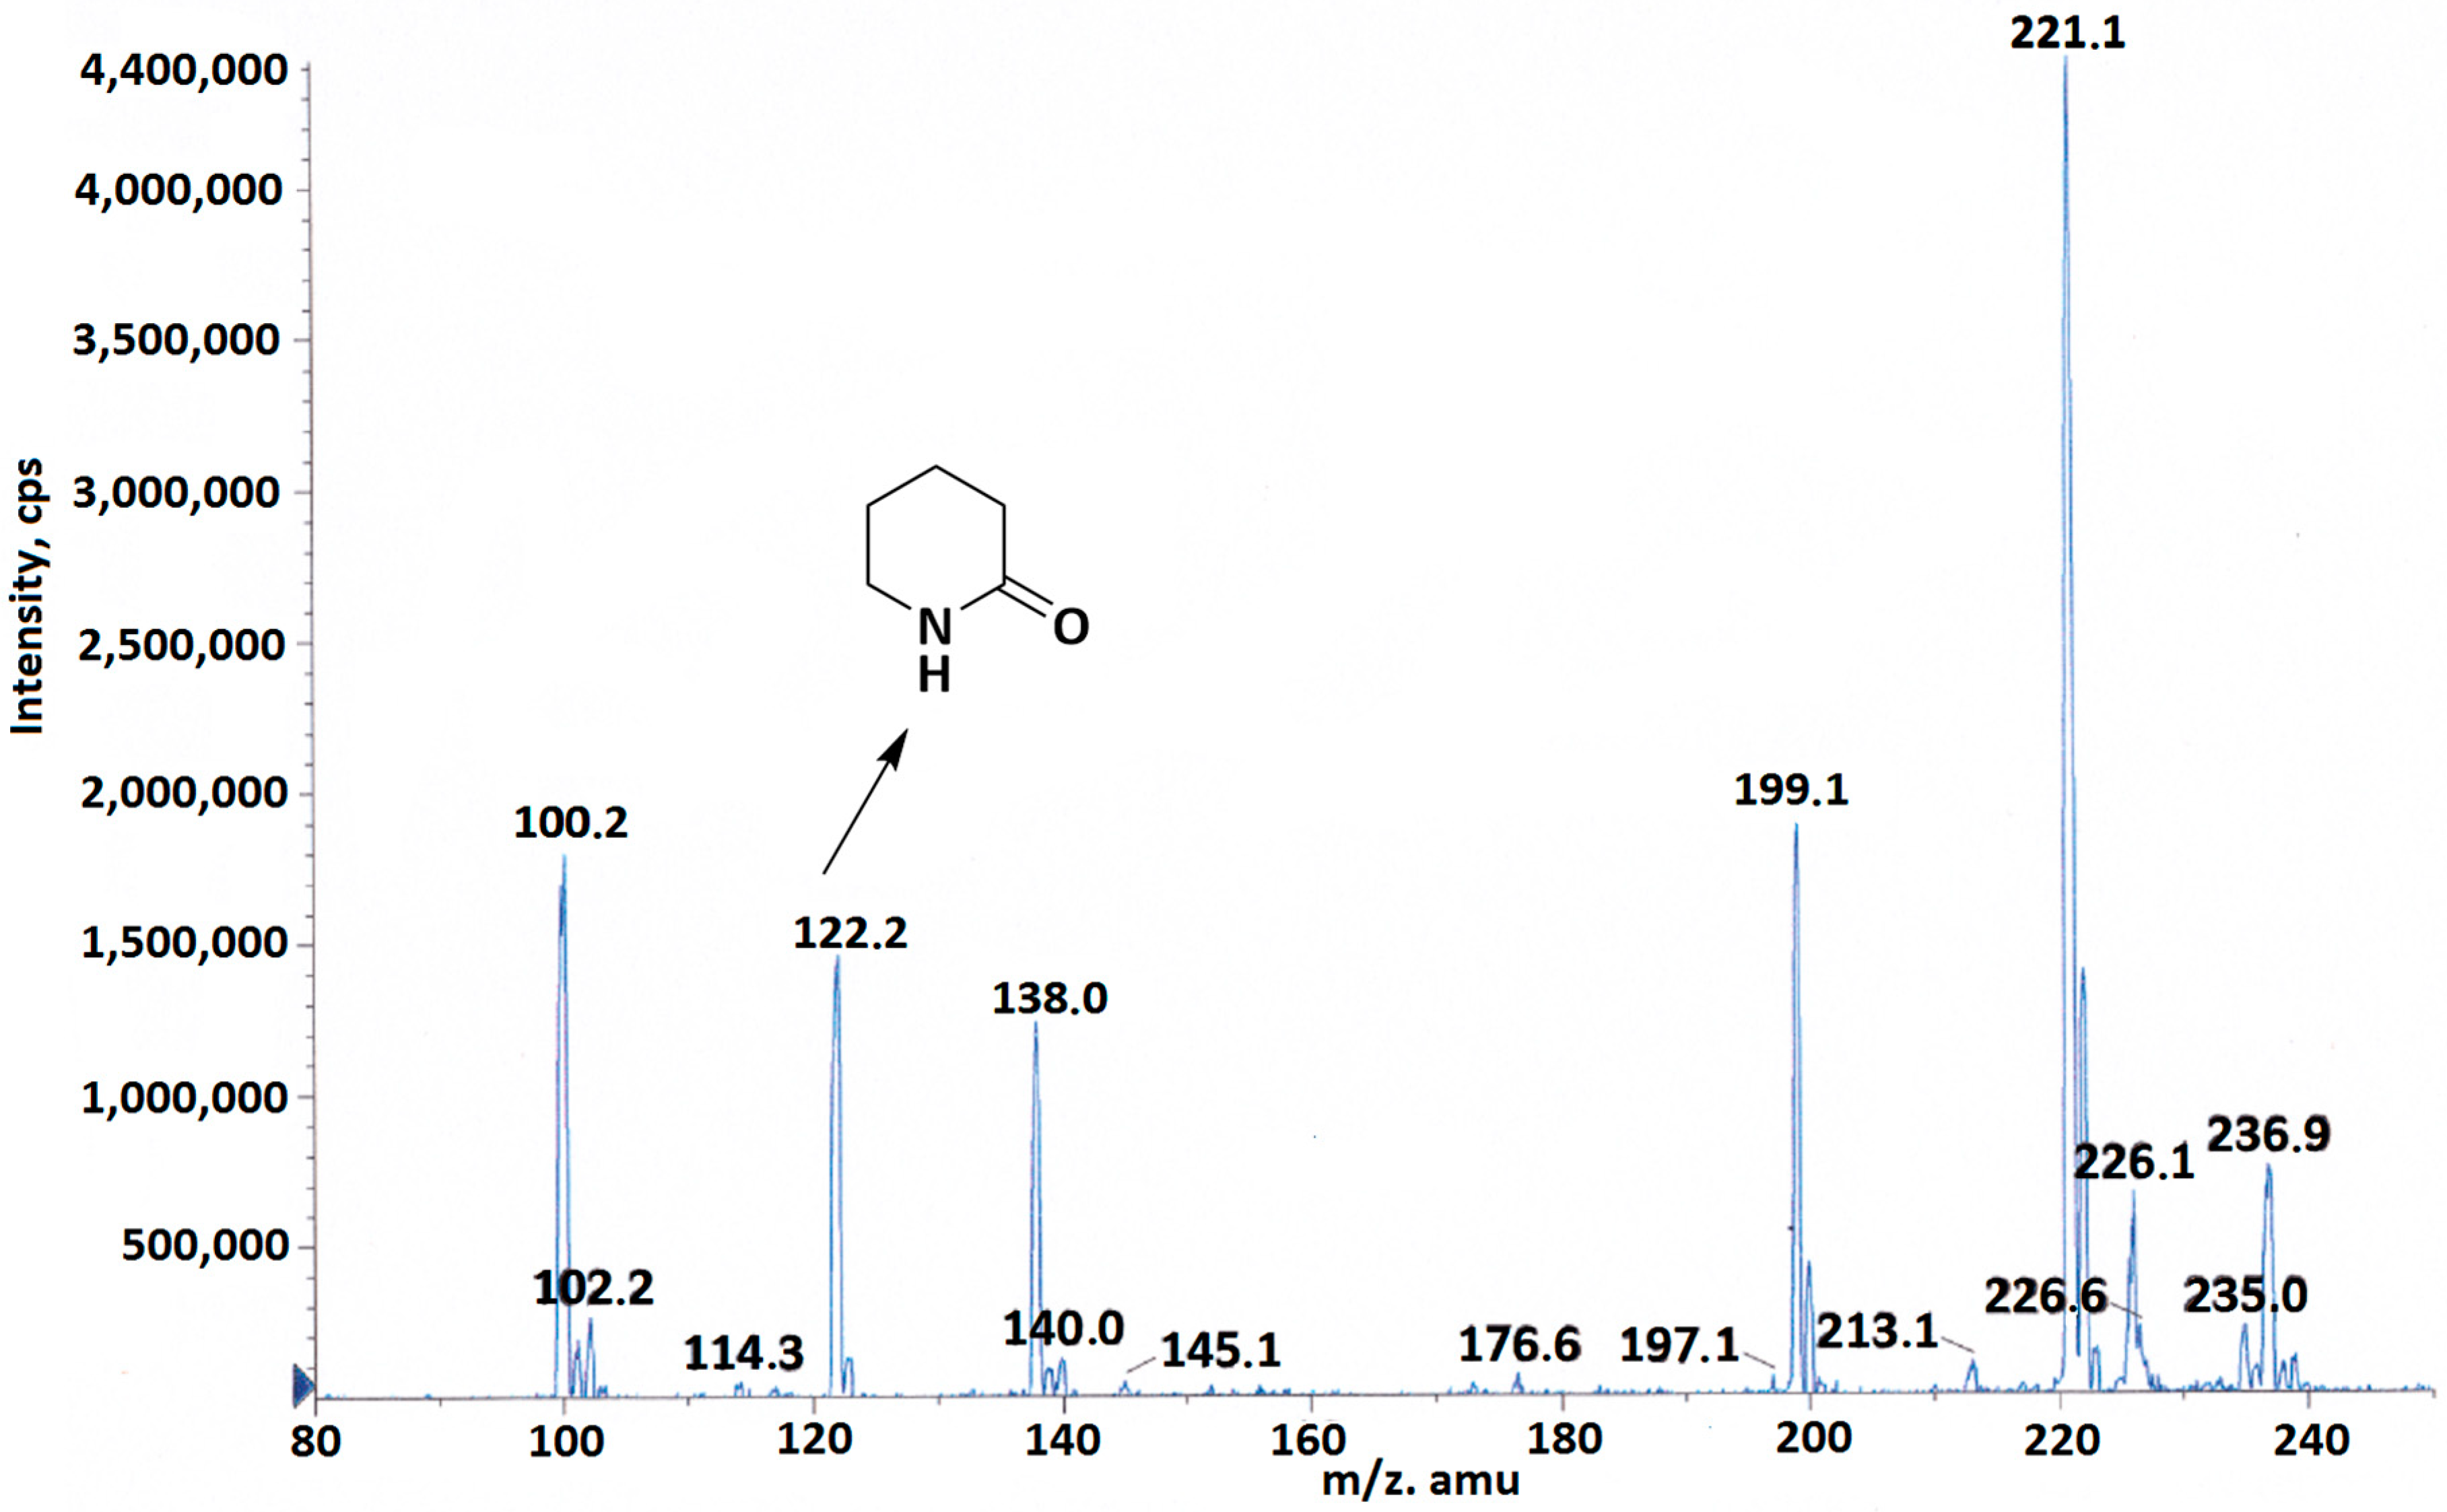
To confirm the proposed mechanism, the reaction solution was analyzed by high resolution mass spectrometry (HRMS) and NMR analysis. MS and NMR spectra confirmed formation of piperidin-2-one as a product of intramolecular lactamization. A major peak located at 122.2 corresponding to piperidin-2-one (C5H9NO, [M + Na]+: 122.07) was observed (Figure 2, the supplementary materials).
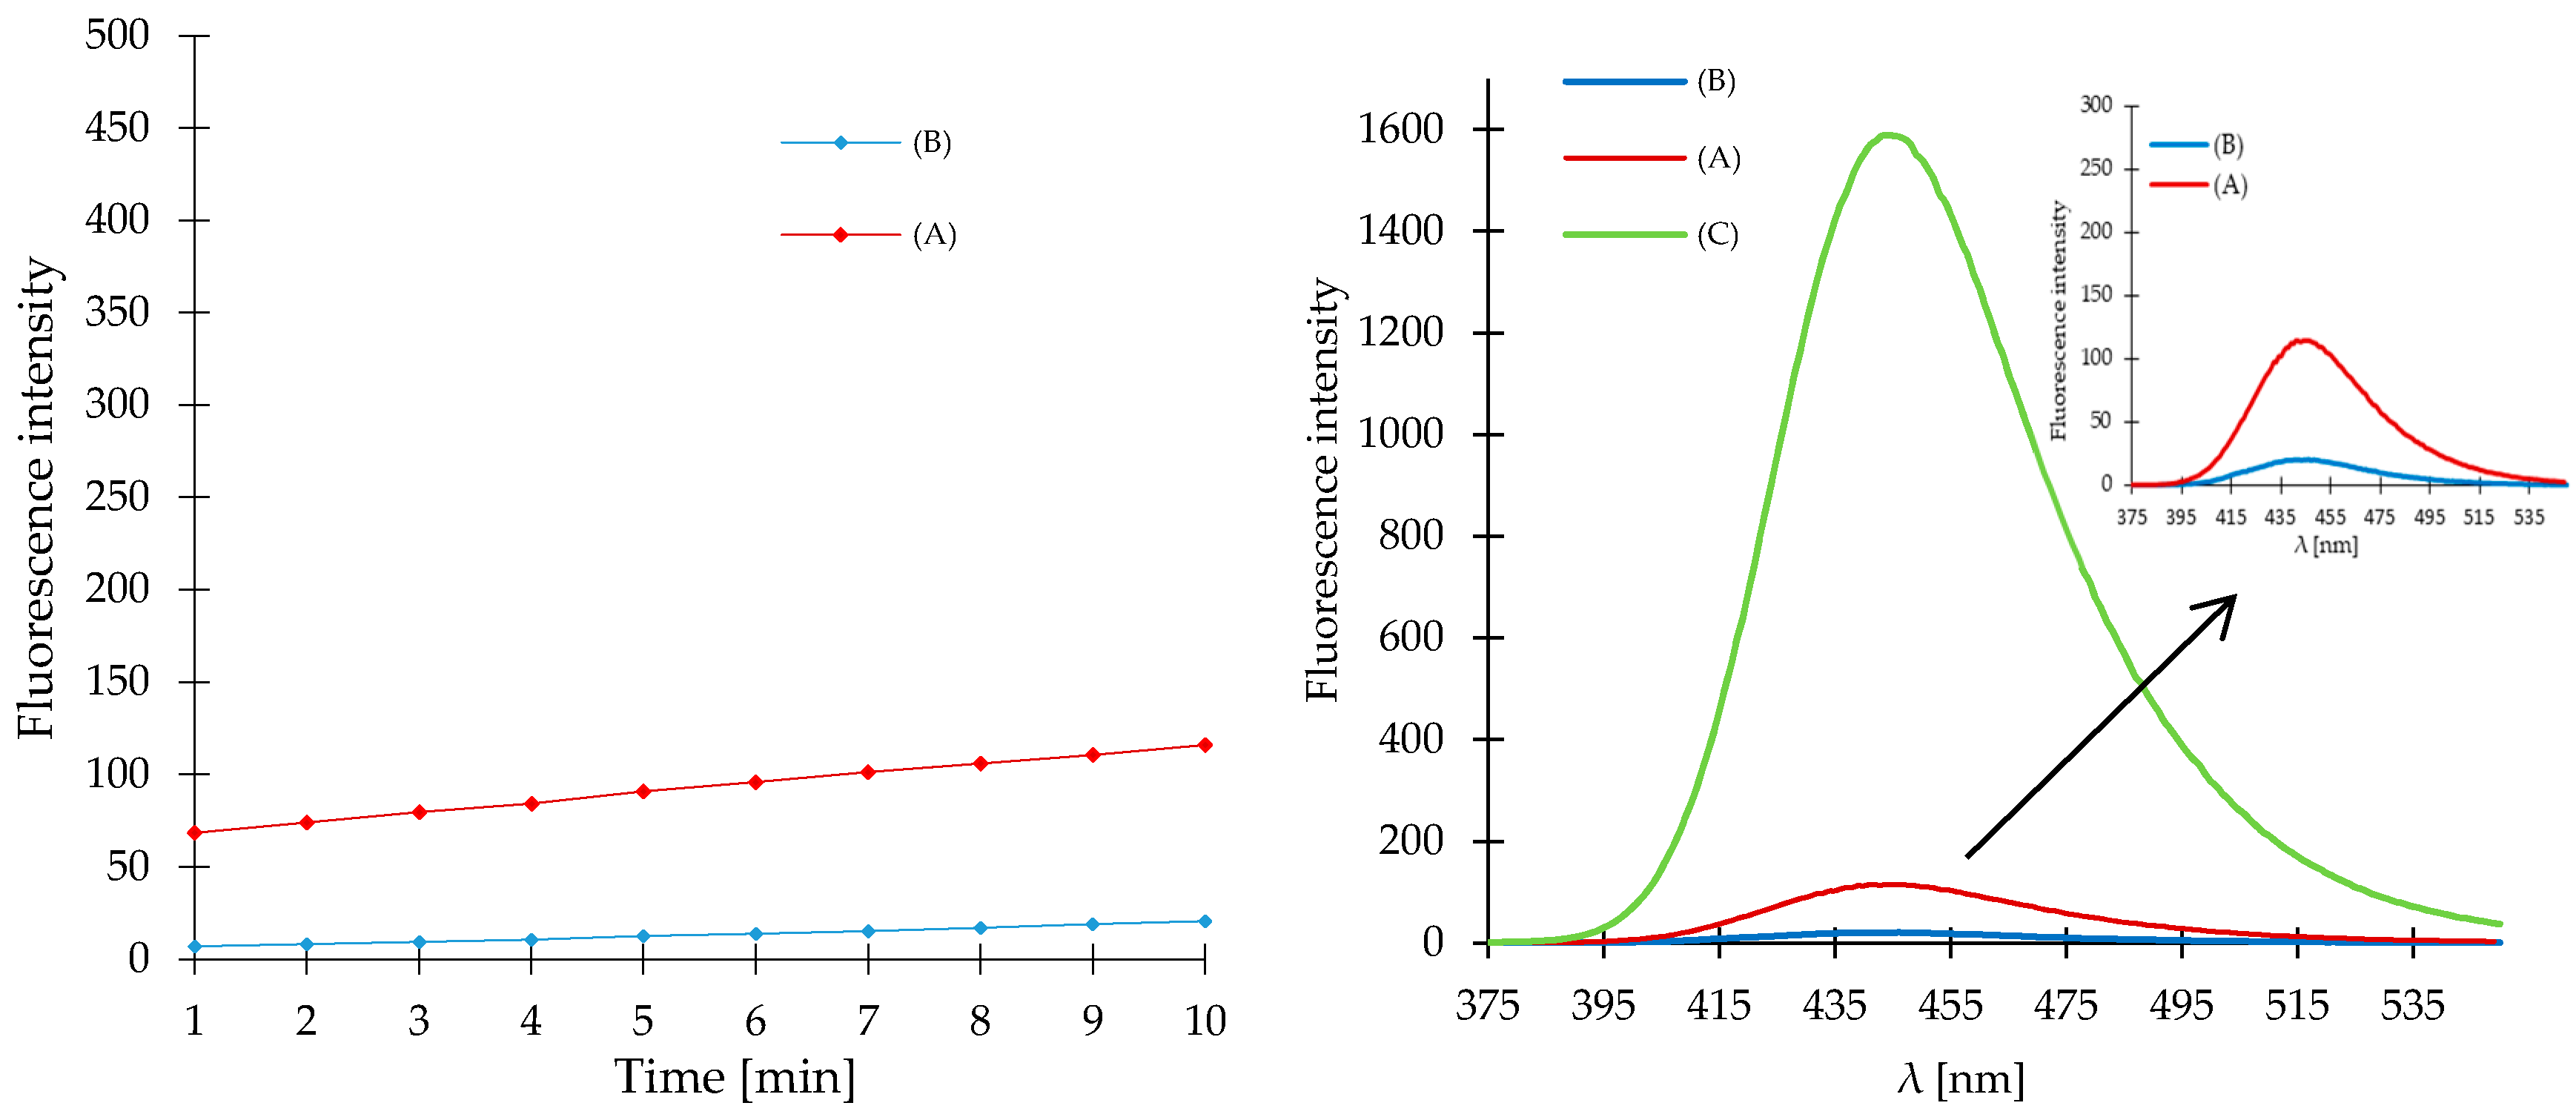
In order to check the validity of the proposed mechanism we synthesized 4-methyl-2-oxo-2H-chromen-7-yl 3-azidopropanoate (2) and compared the results of fluorometric measurements for the 4-methyl-2-oxo-2H-chromen-7-yl 5-azidopentanoate (1) with the results obtained for compound 2 under the same reaction conditions. For compound 2 a much lower fluorescence response was recorded, which could be due to progressive autohydrolysis of compound 2 (Figure 3A). The hydrolytic decomposition of the compound 1 is further enhanced by close location of an electron-acceptor azide group in relation to the ester bond in the 7-position of 4-methylcoumarin. In addition, NMR and MS analysis of the assay solution was performed. In contrast to compound 1, the 4-membered product of intramolecular lactamization was absent in the assay solution of compound 2 due to hydrolysis of the ester bond.
To confirm the proposed mechanism of compound 1 in sensing H2S, 4-methyl-2-oxo-2H-chromen-7-yl propionate (3) was synthesized and tested in parallel under the same conditions. The analysis of reaction solution of compound 3 after addition of NaHS by fluorometry showed a minimal fluorescence enhancement (Figure 3B). In this case minimum fluorescence was caused the hydrolysis of the ester bond. The observed lower fluorescence enhancement of compound 3 in comparison to 2, could result from the absence of the azide group in the structure of compound 3. The different responses of 4-methyl-2-oxo-2H-chromen-7-yl propionate (3) and compound 1 highlighted a key role of the azide moiety for the H2S detection mechanism. NMR and MS analysis confirmed the absence of the lactamization product in the reaction mixture.
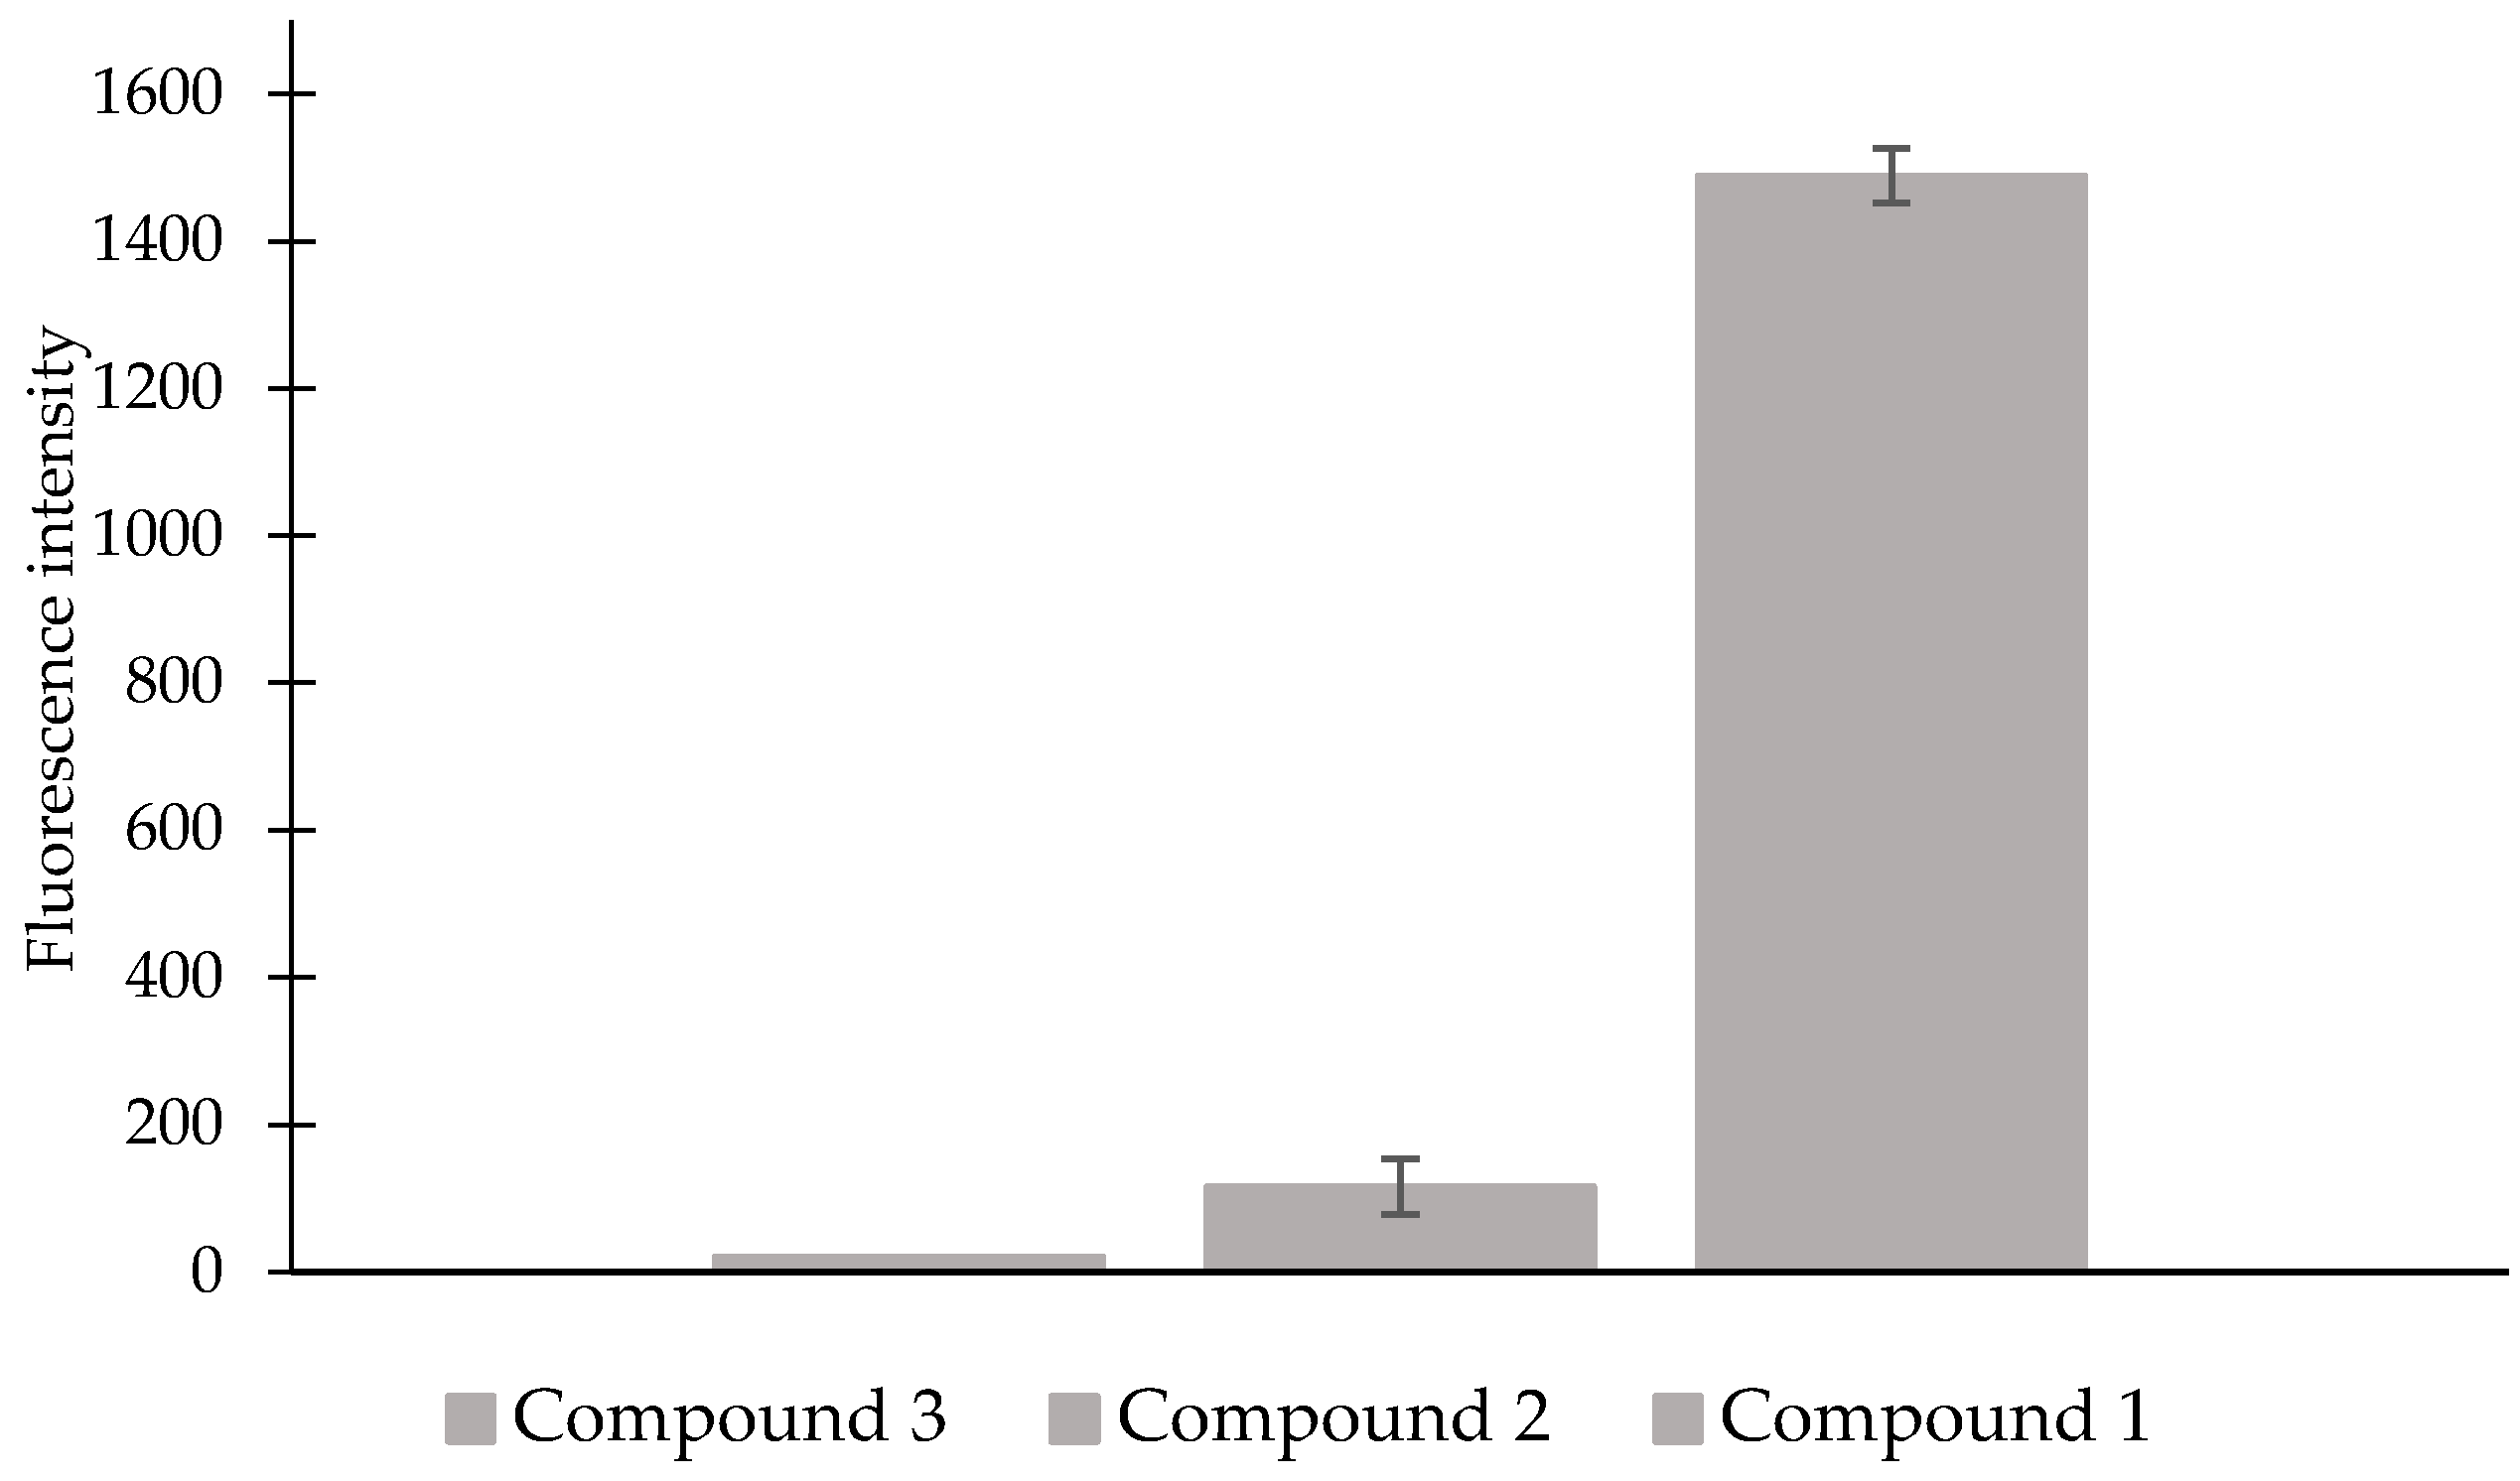
To sum up, the compound 1 can be used for the determination of H2S levels. Furthermore, it is characterized by a high stability and the lack of susceptibility to autohydrolysis. We showed that the distance of the reaction site and thus the azide group as the electron-acceptor group from the fluorophore reduces the susceptibility to autohydrolysis (Figure 4). The obtained results confirm proposed mechanism of H2S detection for the compound 1. Detection of H2S was achieved by the reduction of azide group mediated by H2S to amine group, then intramolecular lactamization with simultaneous release of highly fluorescent 7-hydroxy-4-methylcoumarin.
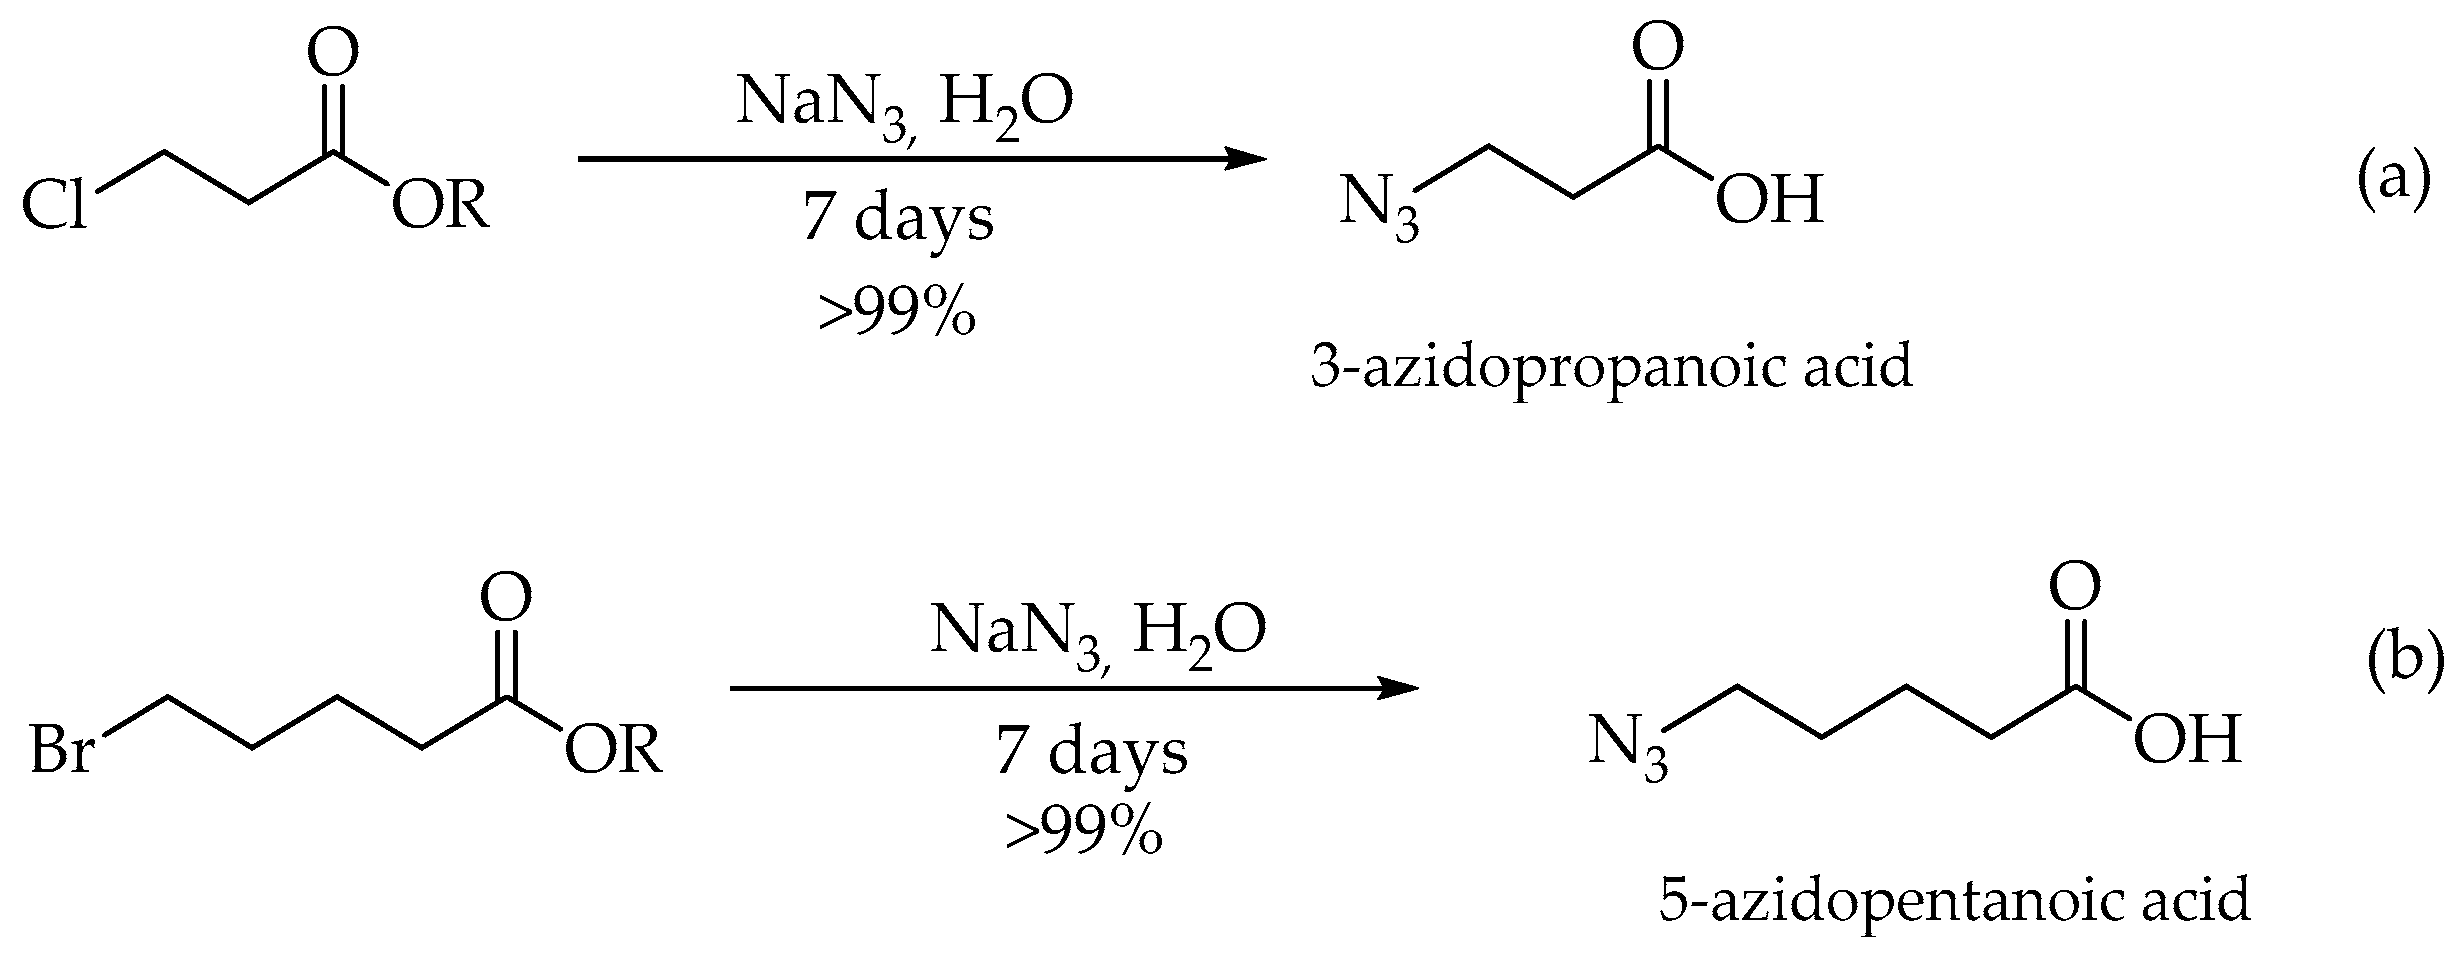
Firstly, intermediates 3-azidopropanonic acid and 5-azidopentanonic acid were obtained by reacting suitable ester 3-chloropropionate (a) or ester 5-bromopentanoate (b) with sodium azide in H2O (Figure 5). The compound 1 and the compound 2 were synthesized from the corresponding commercially available fluorescent 7-hydroxy-4-methylcoumarin (Figure 6).

3.3. Synthesis of 3-Azidopropanoic Acid and 5-Azidopentanoic acid

A solution of sodium azide (4 equiv.) in 10 mL water was added dropwise into the ester 3-chloropropionate or ester 5-bromopentanoate (1 equiv.). The reaction mixture was stirred at room temperature for 7 days. After this time the resulting reaction mixture was acidified with solution of HCl (1 M). Then, the mixture was extracted with ethyl acetate for several times. The combined organic layers were dried over anhydrous MgSO4 followed by filtration and concentrated under reduced pressure. The obtained product was used for the next reaction without purification. Then, the azide-probe (1) and compound 2 was readily synthesized by esterification of 7-hydroxy-4-methylcoumarin with suitable azido acid in CH2Cl2, under a room temperature as shown in Figure 6.
In turn 4-methyl-2-oxo-2H-chromen-7-yl propionate (3) was synthesized from the corresponding commercially available 7-hydroxy-4-methylcoumarin with butyric acid in CH2Cl2, under room temperature as shown in Figure 7.

3.4. Synthesis of 4-Methyl-2-oxo-2H-chromen-7-yl 5-Azidopentanoate (1)

5-Azidopentanoic acid (1.2 equiv.), 7-hydroxy-4-methylcoumarin (1 equiv.), and a catalytic amount of N,N-dimethylpyridin-4-amine (DMAP) were dissolved in dry CH2Cl2 (15 mL). Then DCC (2 equiv.) was added. The reaction mixture was stirred at room temperature for 12 h. The reaction was monitored by thin layer chromatography (TLC). After the reaction was completed, the precipitate was filtered and washed several times with CH2Cl2. The filtrate was concentrated under reduced pressure. The crude product was purified by silica gel chromatography (ethyl acetate/n-hexane 3:7) to obtain the pure product as white solid (80% yield). 1H-NMR (400 MHz, CDCl3) δ 7.57 (d, J = 8.6 Hz, 1H), 7.13–6.93 (m, 2H), 6.22 (s, 1H), 3.33 (t, J = 6.6 Hz, 2H), 2.62 (t, J = 7.3 Hz, 2H), 2.39 (d, J = 1.1 Hz, 3H), 1.82 (dt, J = 12.0, 7.1 Hz, 1H), 1.76–1.64 (m, 1H); 13C-NMR (100 MHz, CDCl3) δ 170.94, 160.38, 154.14, 153.01, 153.01, 151.93, 125.41, 117.99, 117.80, 114.45, 110.31, 77.43, 77.11, 76.79, 50.98, 33.65, 28.17, 21.93, 18.64 ppm. Element. Anal. calcd. for C15H15N3O4: C 59.80, H 5.02, N 13.95; found C 59.72, H 4.94, N 13.84.

3.5. Synthesis of 4-Methyl-2-oxo-2H-chromen-7-yl 3-Azidopropanoate (2)

3-azidopropanoic acid (1.2 equiv.), 7-hydroxy-4-methylcoumarin (1 equiv.) and DMAP (a catalytic amount) were dissolved in dry CH2Cl2 (15 mL). Then DCC (2 equiv.) was added. The reaction mixture was stirred at room temperature for 12 h. The reaction was monitored by thin layer chromatography (TLC). After the reaction was completed, the precipitate was filtered and washed several times with CH2Cl2. The filtrate was concentrated under reduced pressure. The crude product was purified by silica gel chromatography (ethyl acetate/n-hexane 3:7) to obtain the pure product as white solid (72% yield). 1H-NMR (400 MHz, CDCl3) δ 7.59 (d, J = 8.6 Hz, 1H), 7.15–7.02 (m, 2H), 6.24 (d, J = 0.8 Hz, 1H), 3.69 (t, J = 6.4 Hz, 2H), 2.86 (t, J = 6.4 Hz, 2H), 2.41 (d, J = 0.9 Hz, 3H); 13C-NMR (100 MHz, CDCl3) δ 168.88, 160.32, 154.15, 152.69, 151.86, 125.49, 118.03, 117.89, 114.62, 110.30, 46.55, 34.17, 18.66 ppm. Element. Anal. calcd. for C13H11N3O4: C 57.14, H 4.06, N 15.38; found C 57.08, H 4.02, N 15.29.

3.6. Synthesis of 4-Methyl-2-oxo-2H-chromen-7-yl Propionate (3)

Butyric acid (1.2 equiv.), 7-hydroxy-4-methylcoumarin (1 equiv.), and DMAP (a catalytic amount) were dissolved in dry CH2Cl2 (15 mL). Then DCC (2 equiv.) was added. The reaction mixture was stirred at room temperature for 12 h. The reaction was monitored by thin layer chromatography (TLC). After the reaction was completed, the precipitate was filtered and washed several times with CH2Cl2. The filtrate was concentrated under reduced pressure. The crude product was purified by silica gel chromatography (ethyl acetate/n-hexane 2:8) to obtain the pure product as a white solid (92% yield). 1H-NMR (400 MHz, CDCl3) δ 7.58 (d, J = 8.6 Hz, 1H), 7.31–6.75 (m, 2H), 6.22 (s, 1H), 2.62 (q, J = 7.5 Hz, 2H), 2.40 (d, J = 0.8 Hz, 3H), 1.26 (t, J = 7.5 Hz, 3H); 13C-NMR (100 MHz, CDCl3) δ 172.19, 160.40, 154.11, 153.20, 151.96, 125.37, 118.04, 117.67, 114.34, 110.30, 77.45, 77.13, 76.81, 27.69, 18.63, 8.88 ppm. Element. Anal. calcd. for C13H12O4: C 67.23, H 5.21; found C 67.19, H 5.17.

3.7. Characterization of the Fluorescence of Compound 1

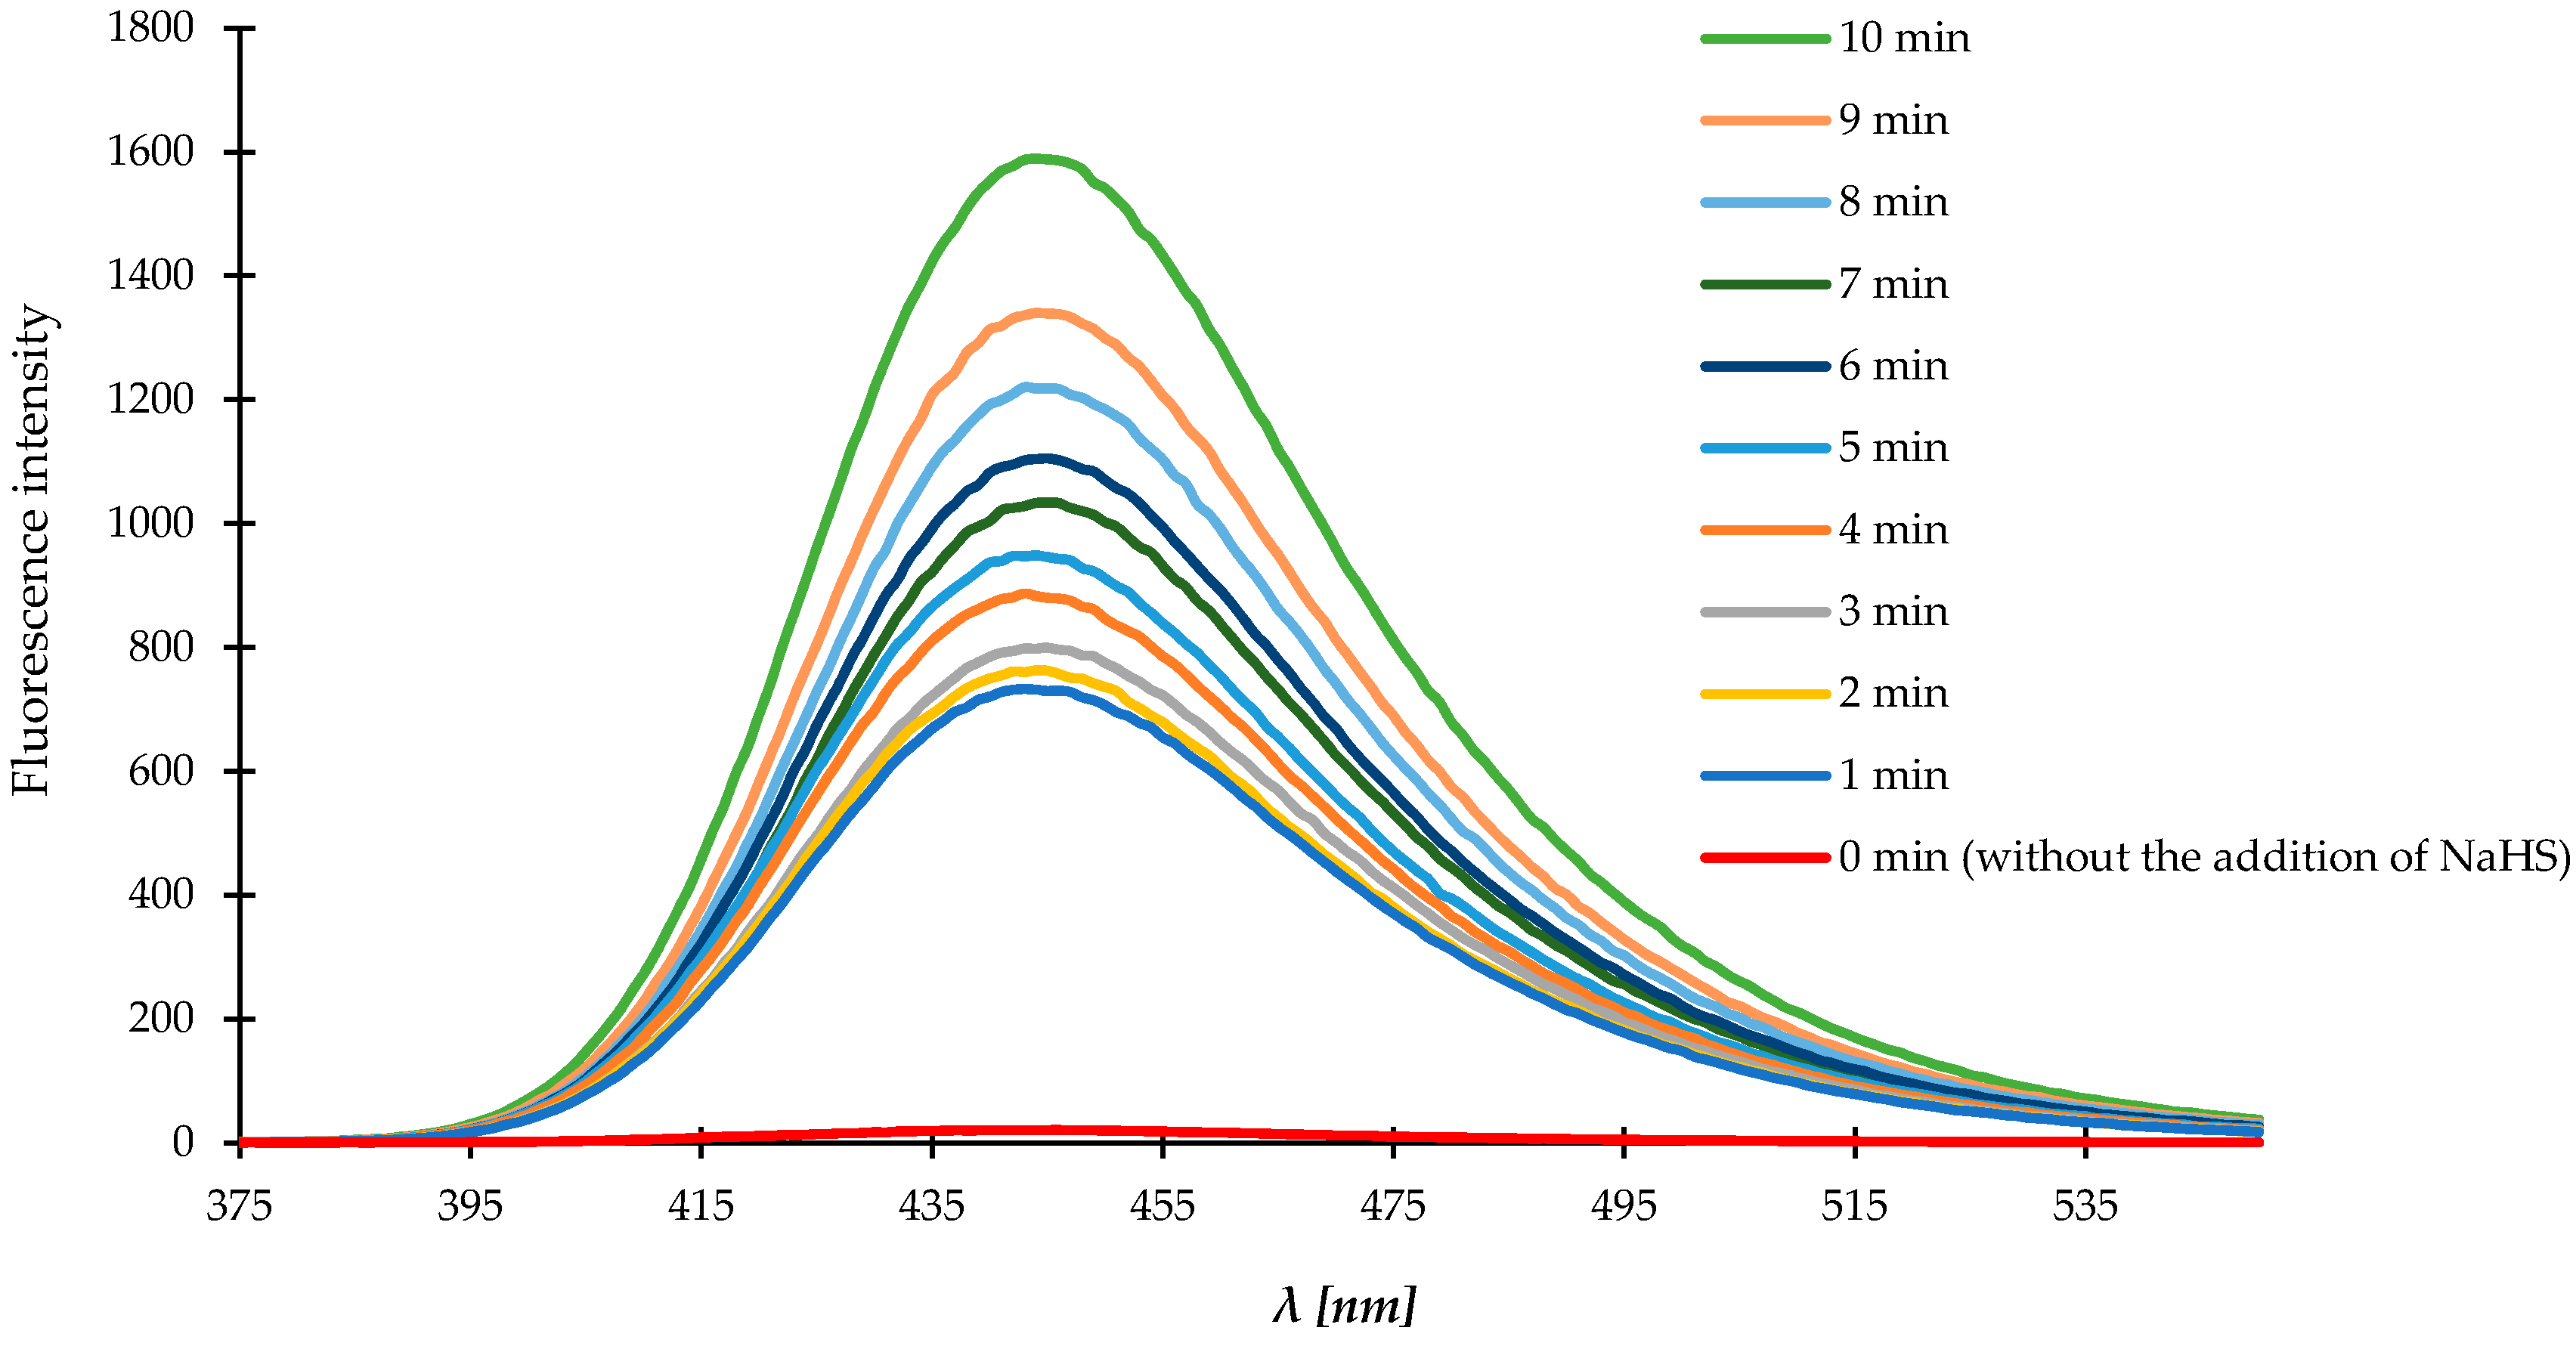
First, we examined the optical properties of the probe/compound 1. Compound 1 was non-fluorescent in sodium phosphate buffer containing 20% CH3CN at physiological pH 7.4. The sensing ability of H2S for the compound 1 was investigated using aqueous solutions of NaHS, a H2S donor. The solution was analyzed by fluorometry and spectra were recorded in selected time-points after the addition of NaHS. Upon addition of 0.1 mM NaHS, the solution of the compound 1 showed a strong fluorescence enhancement, as expected. A strong emission peak at 445 nm was detected when the reaction mixture was excited at 365 nm. The fluorescence intensity was dramatically increased due to the reduction of azide group to amine by H2S, intramolecular lactamization and the release of highly fluorescent 7-hydroxy-4-methylcoumarin. Within 10 min of reaction with NaHS (100 μM) the compound 1 generated an over 1000-fold fluorescence enhancement (Figure 8).
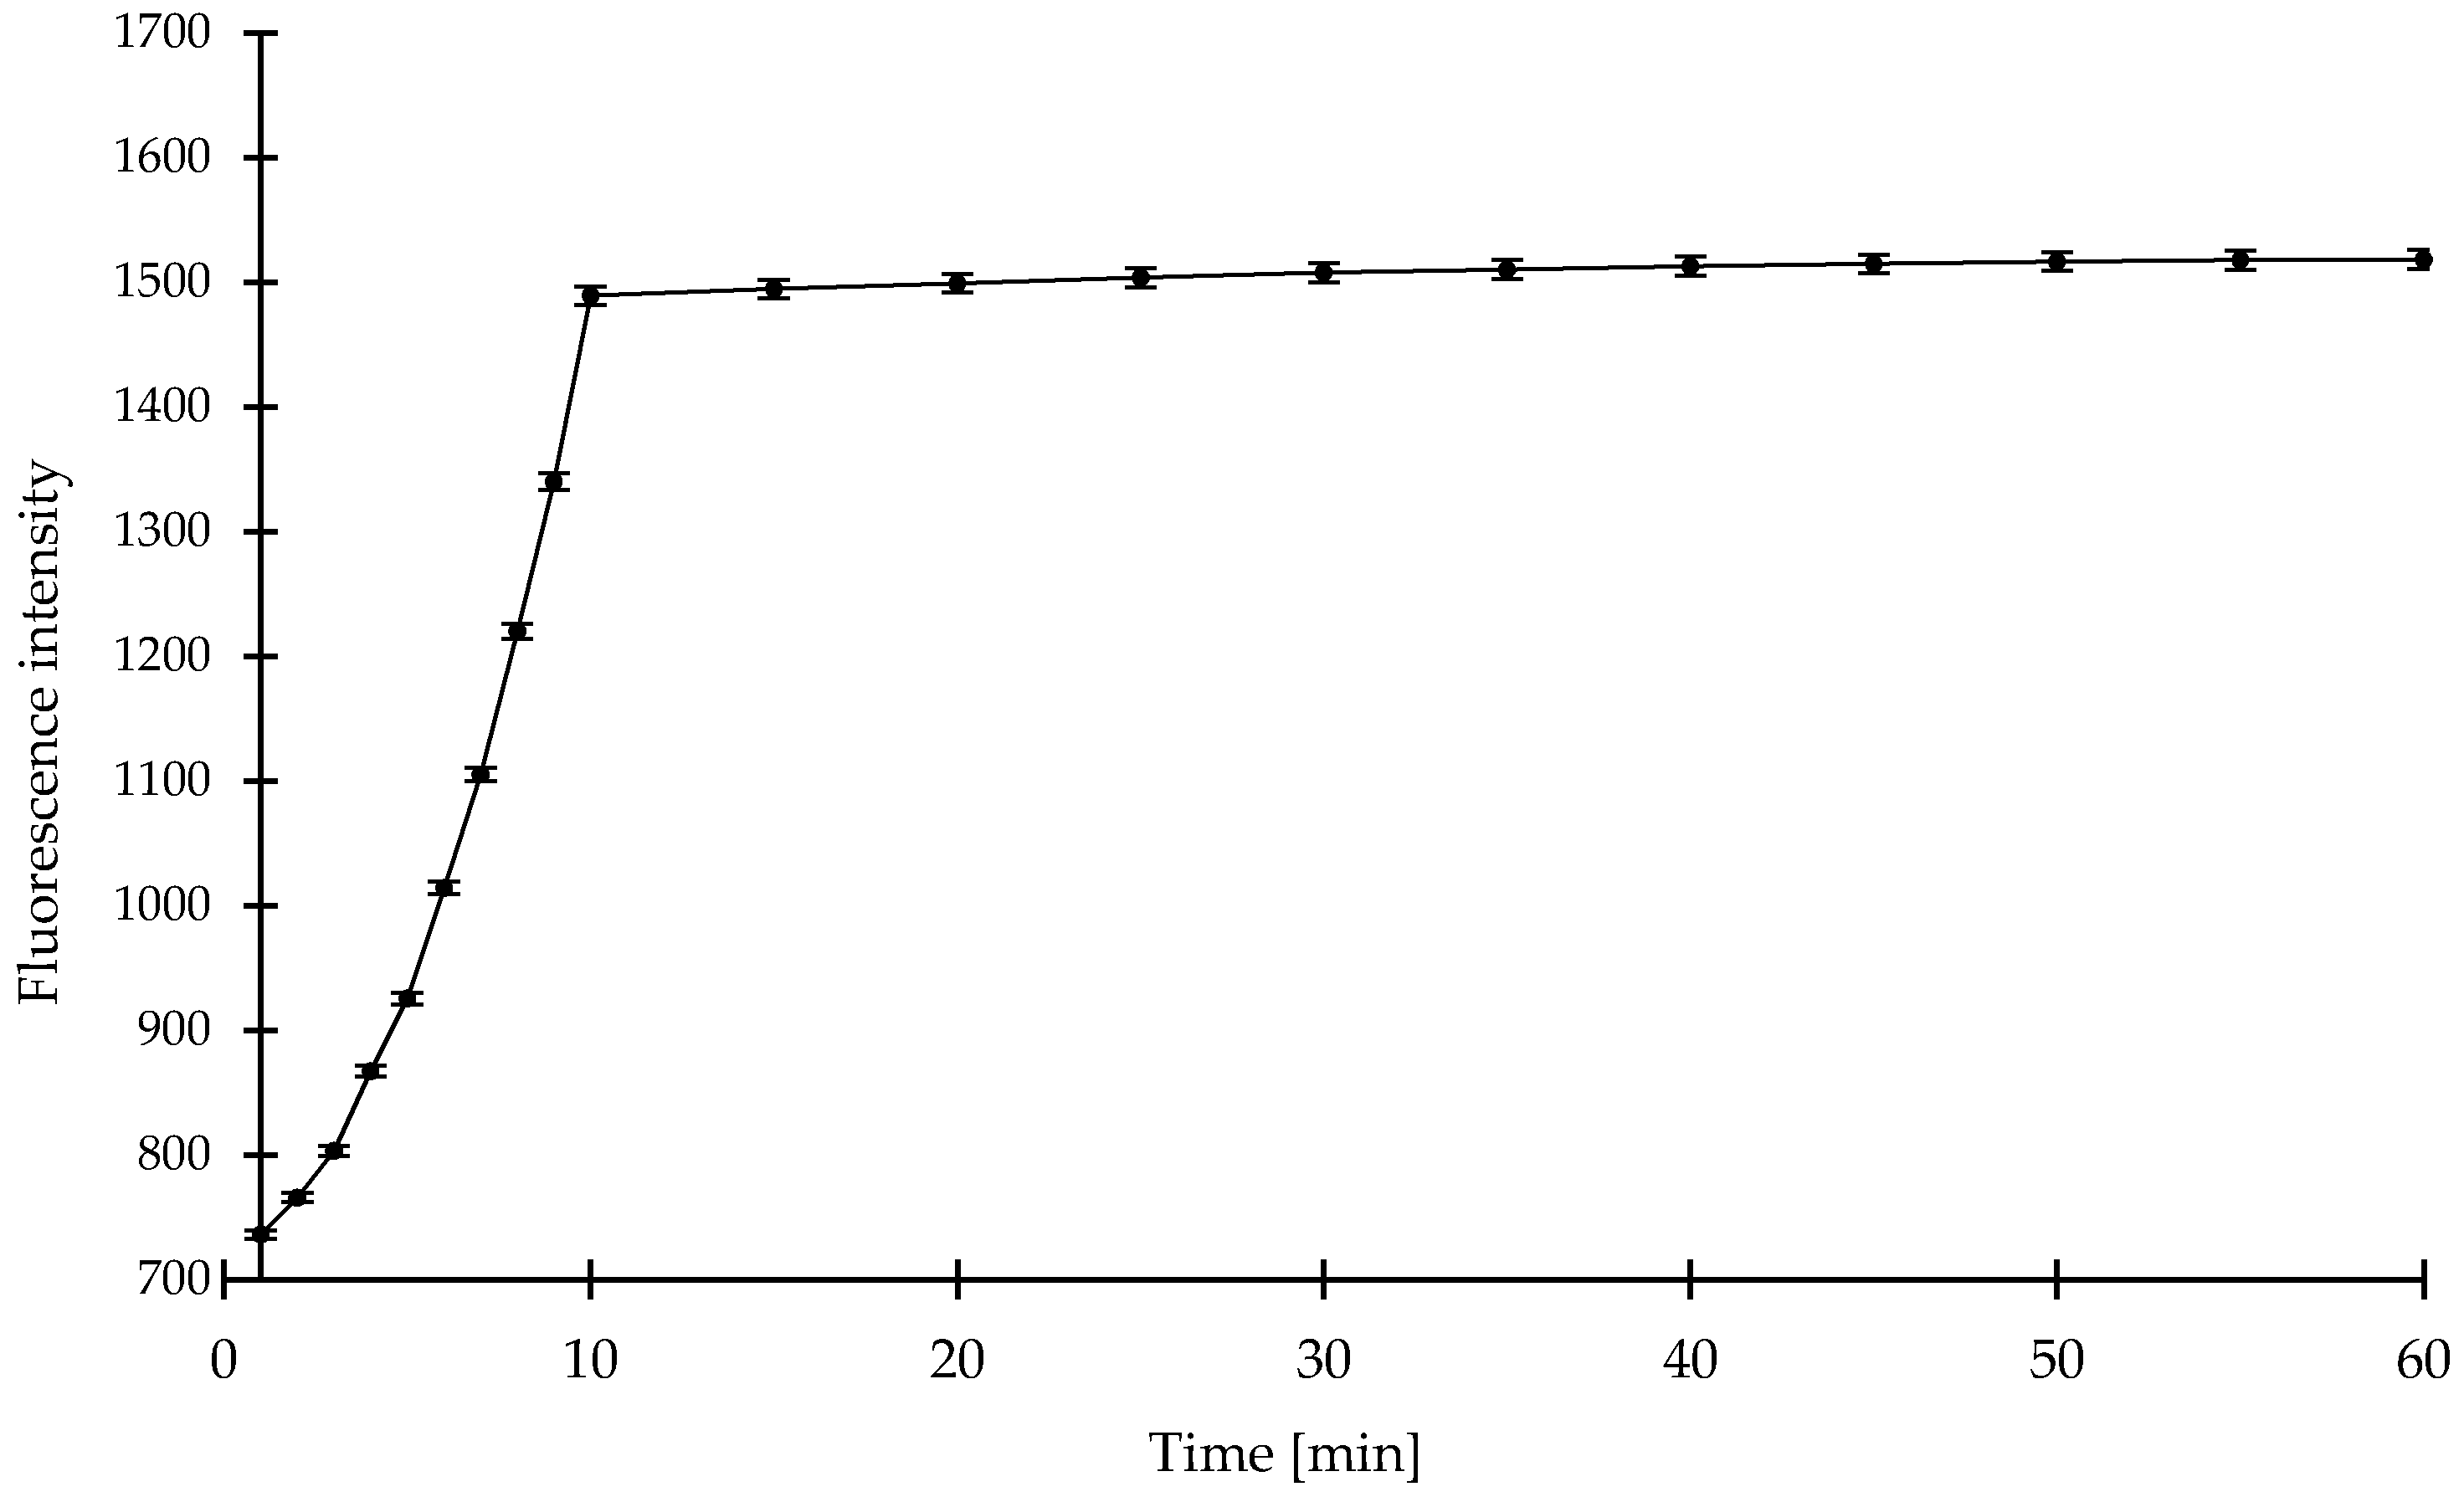
We examined the time courses of the fluorescence intensities of compound 1 in the presence of 100 μM NaHS. The time courses of the fluorescence intensities of the compound 1 (0.1 mM) in the presence of NaHS (0.1 mM) in sodium phosphate (pH = 7.4) buffered acetonitrile (20%, v/v) is displayed in Figure 9. The fluorescence signal increased rapidly at the beginning and reached steady state at around 10 min. When we extended reaction time to 60 min, the fluorescent intensity increased insignificantly, thus we chose 10 min as a test time.
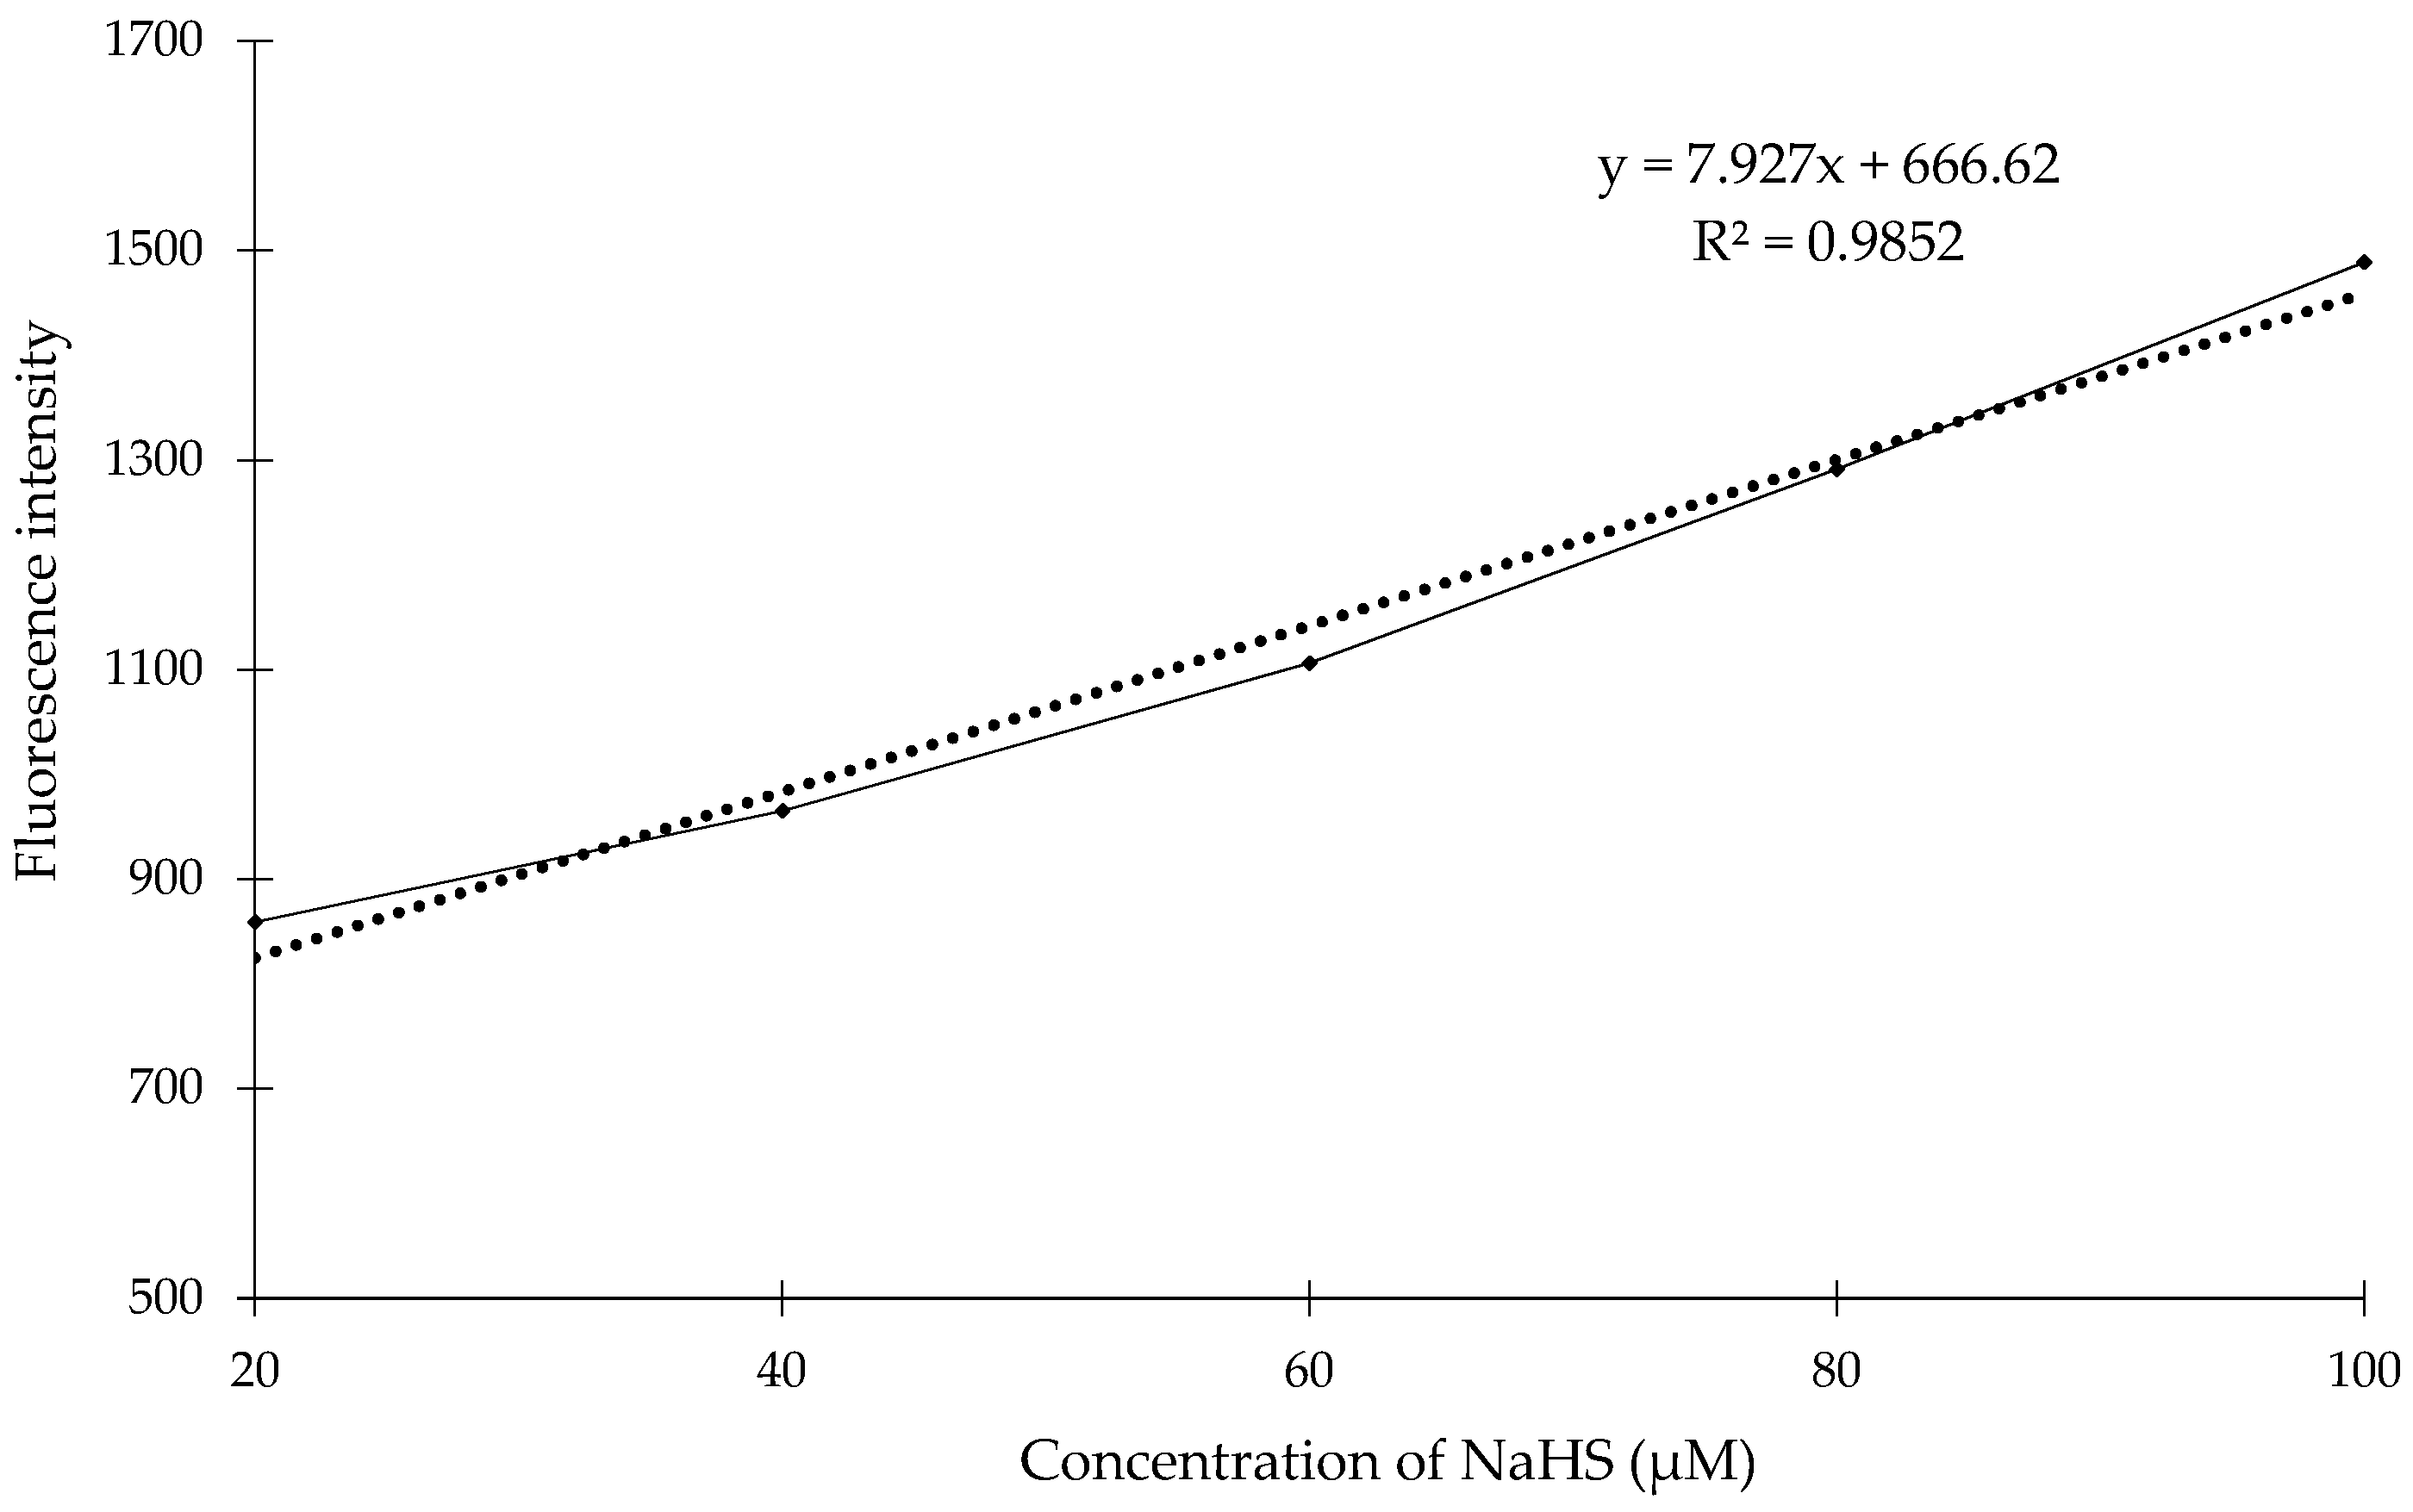
To evaluate the compound 1 for feasibility of quantitative determination of H2S concentration we examined the reactivity of the compound 1 in different concentrations of NaHS in sodium phosphate buffered acetonitrile (20% v/v CH3CN, pH = 7.4) at room temperature. NaHS (NaHS concentration from 20 μM up to 100 μM) was added to the test solution of the compound 1 (0.1 mM). As shown in Figure 10, we observed almost the linear relationship of fluorescence intensity of the compound 1 against varying concentrations of NaHS. The regression analyses was: FEx/Em (365/445 nm) = 7.927[H2S] + 666.62 with R2 = 0.985 in 10 min of incubation with NaHS.

3.8. Quantification of H2S Concentration Using Ellman’s Reagent (5,5-Dithiobis(2-Nitrobenzoic Acid) and the Developed Probe

We determined H2S levels in 20 μM up to 100 μM NaHS solution using DTNB method and our probe. DTNB assay was performed according to the protocol provided by the manufacturer (catalog number: 22,582, Thermo Fisher Scientific, Waltham, MA, USA).
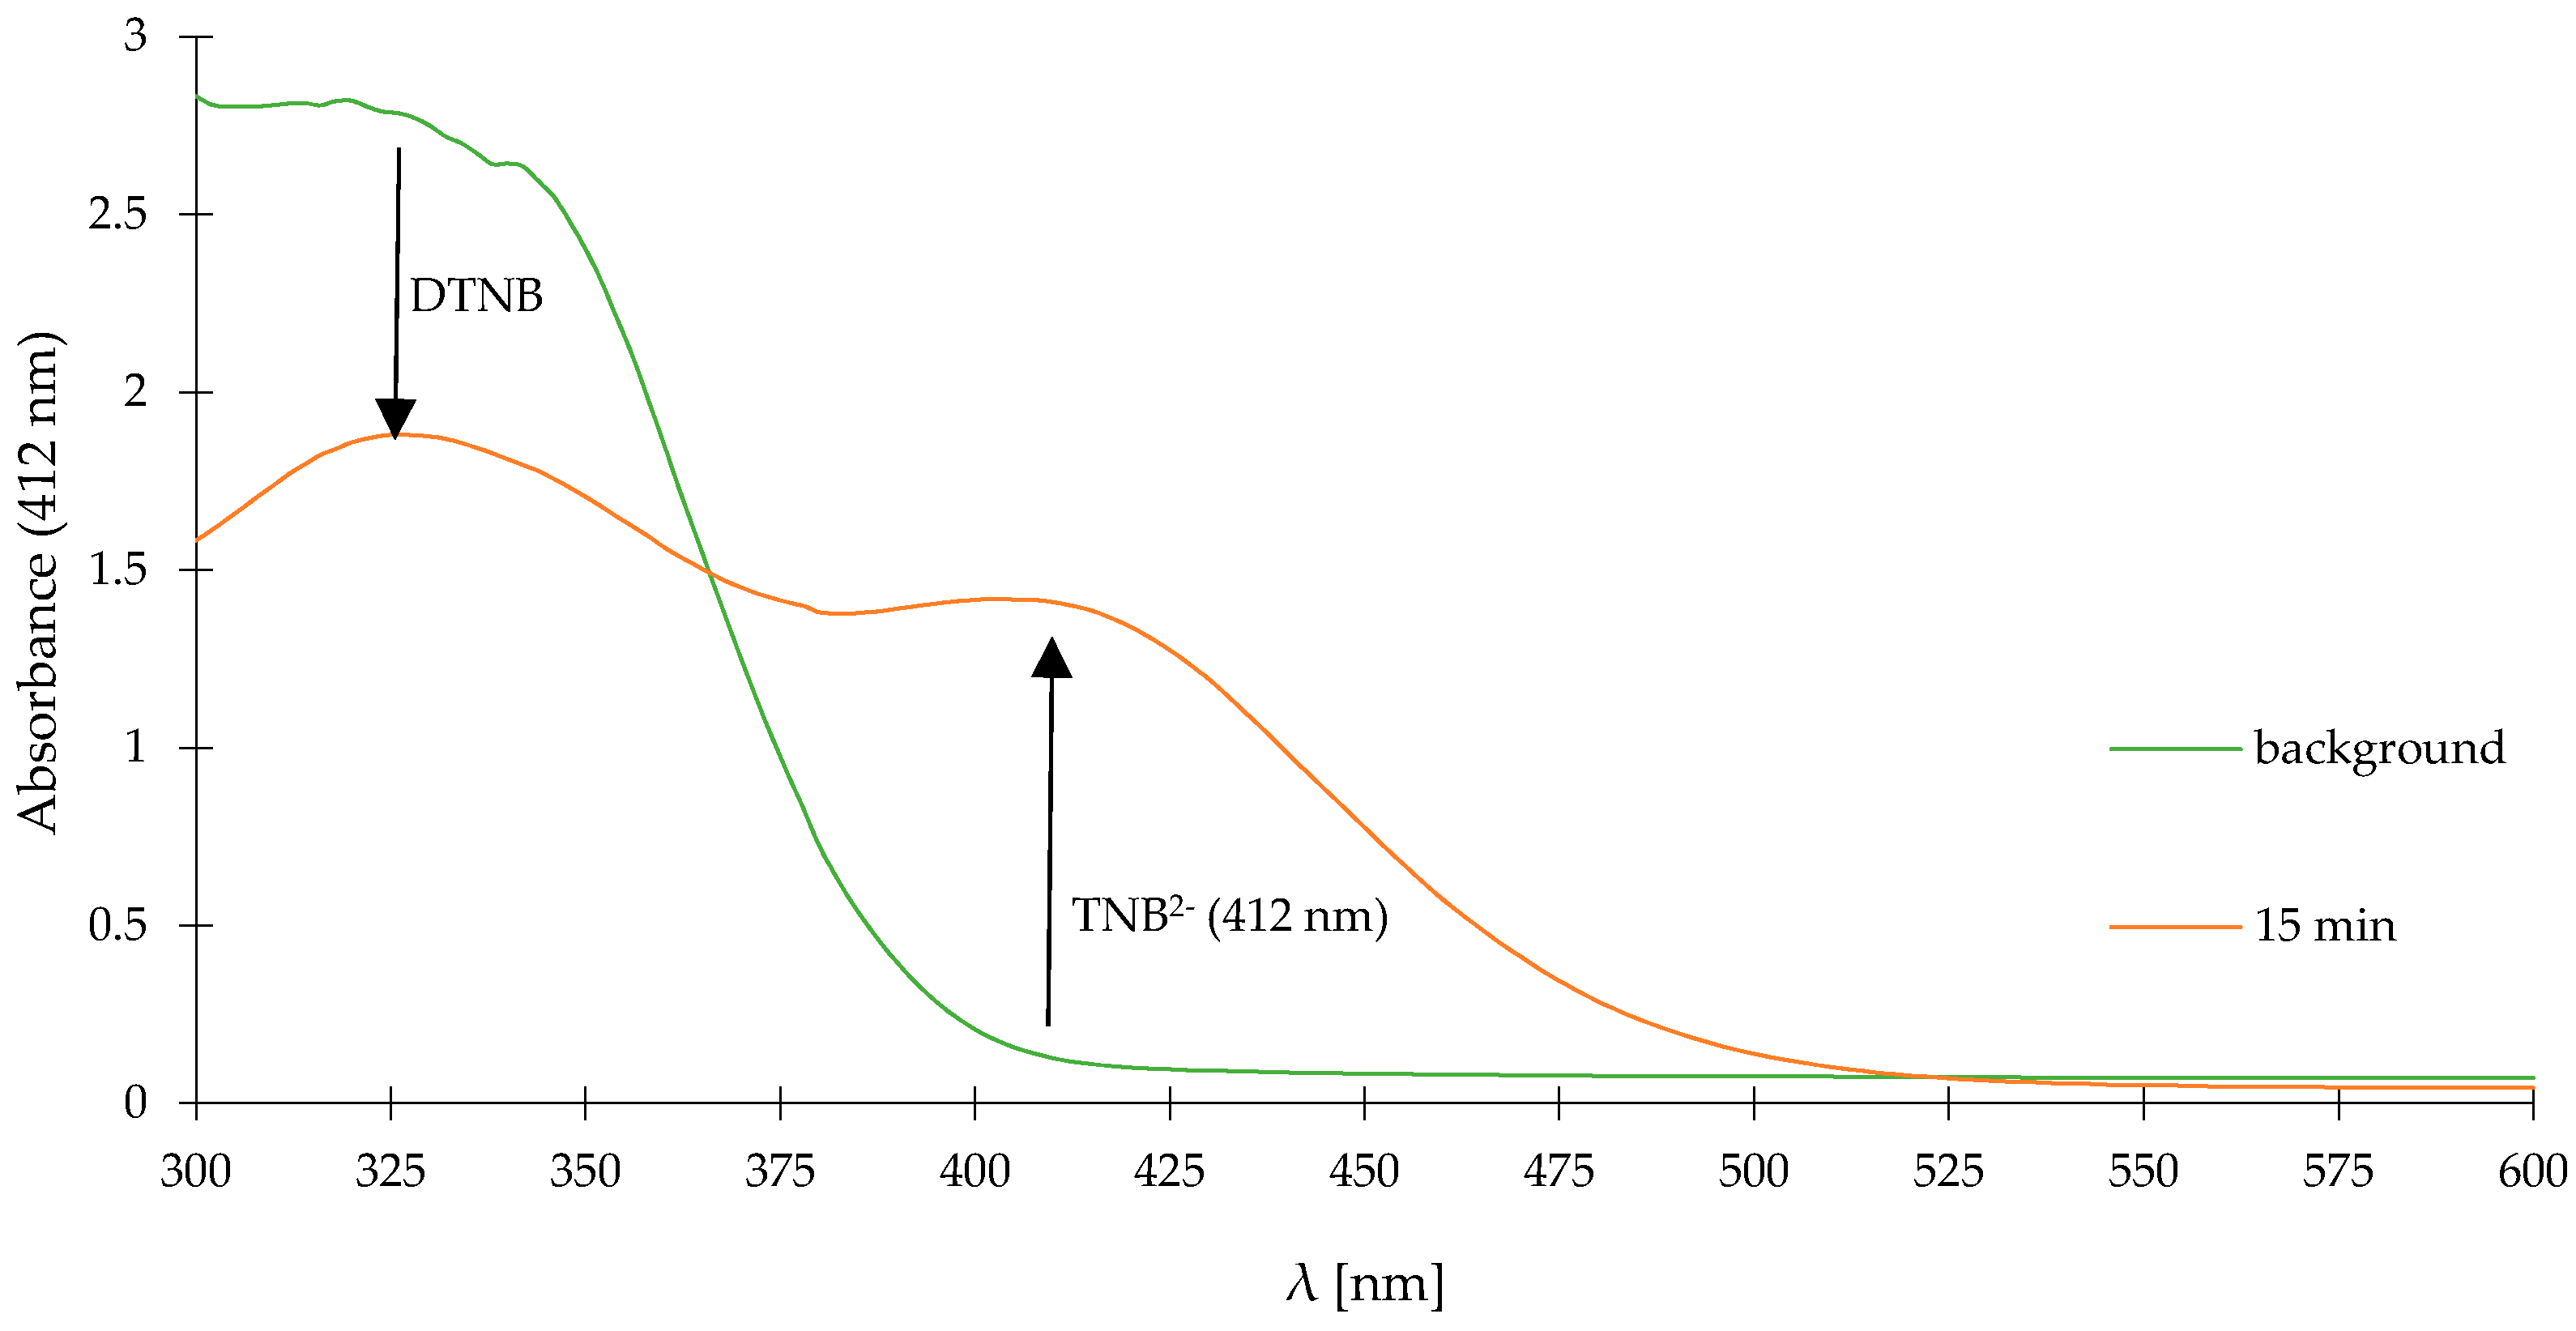
Figure 11 shows time-dependent UV-vis absorption spectra of SH-free DTNB solution (green line-background) and its mixture with NaHS (0.1 mM, orange line). After 15 min incubation, the effect reaction of DTNB with NaHS on absorption spectra was observed as gain of TNB2− (2-nitro-5-thiobenzoate anion) and a loss of DTNB, respectively. We chose 15 min as a test time, because after this time we did not observe any increase in the intensity of absorbance, 15 min is also the incubation time which is required for the measurement procedure recommended by the manufacturer.
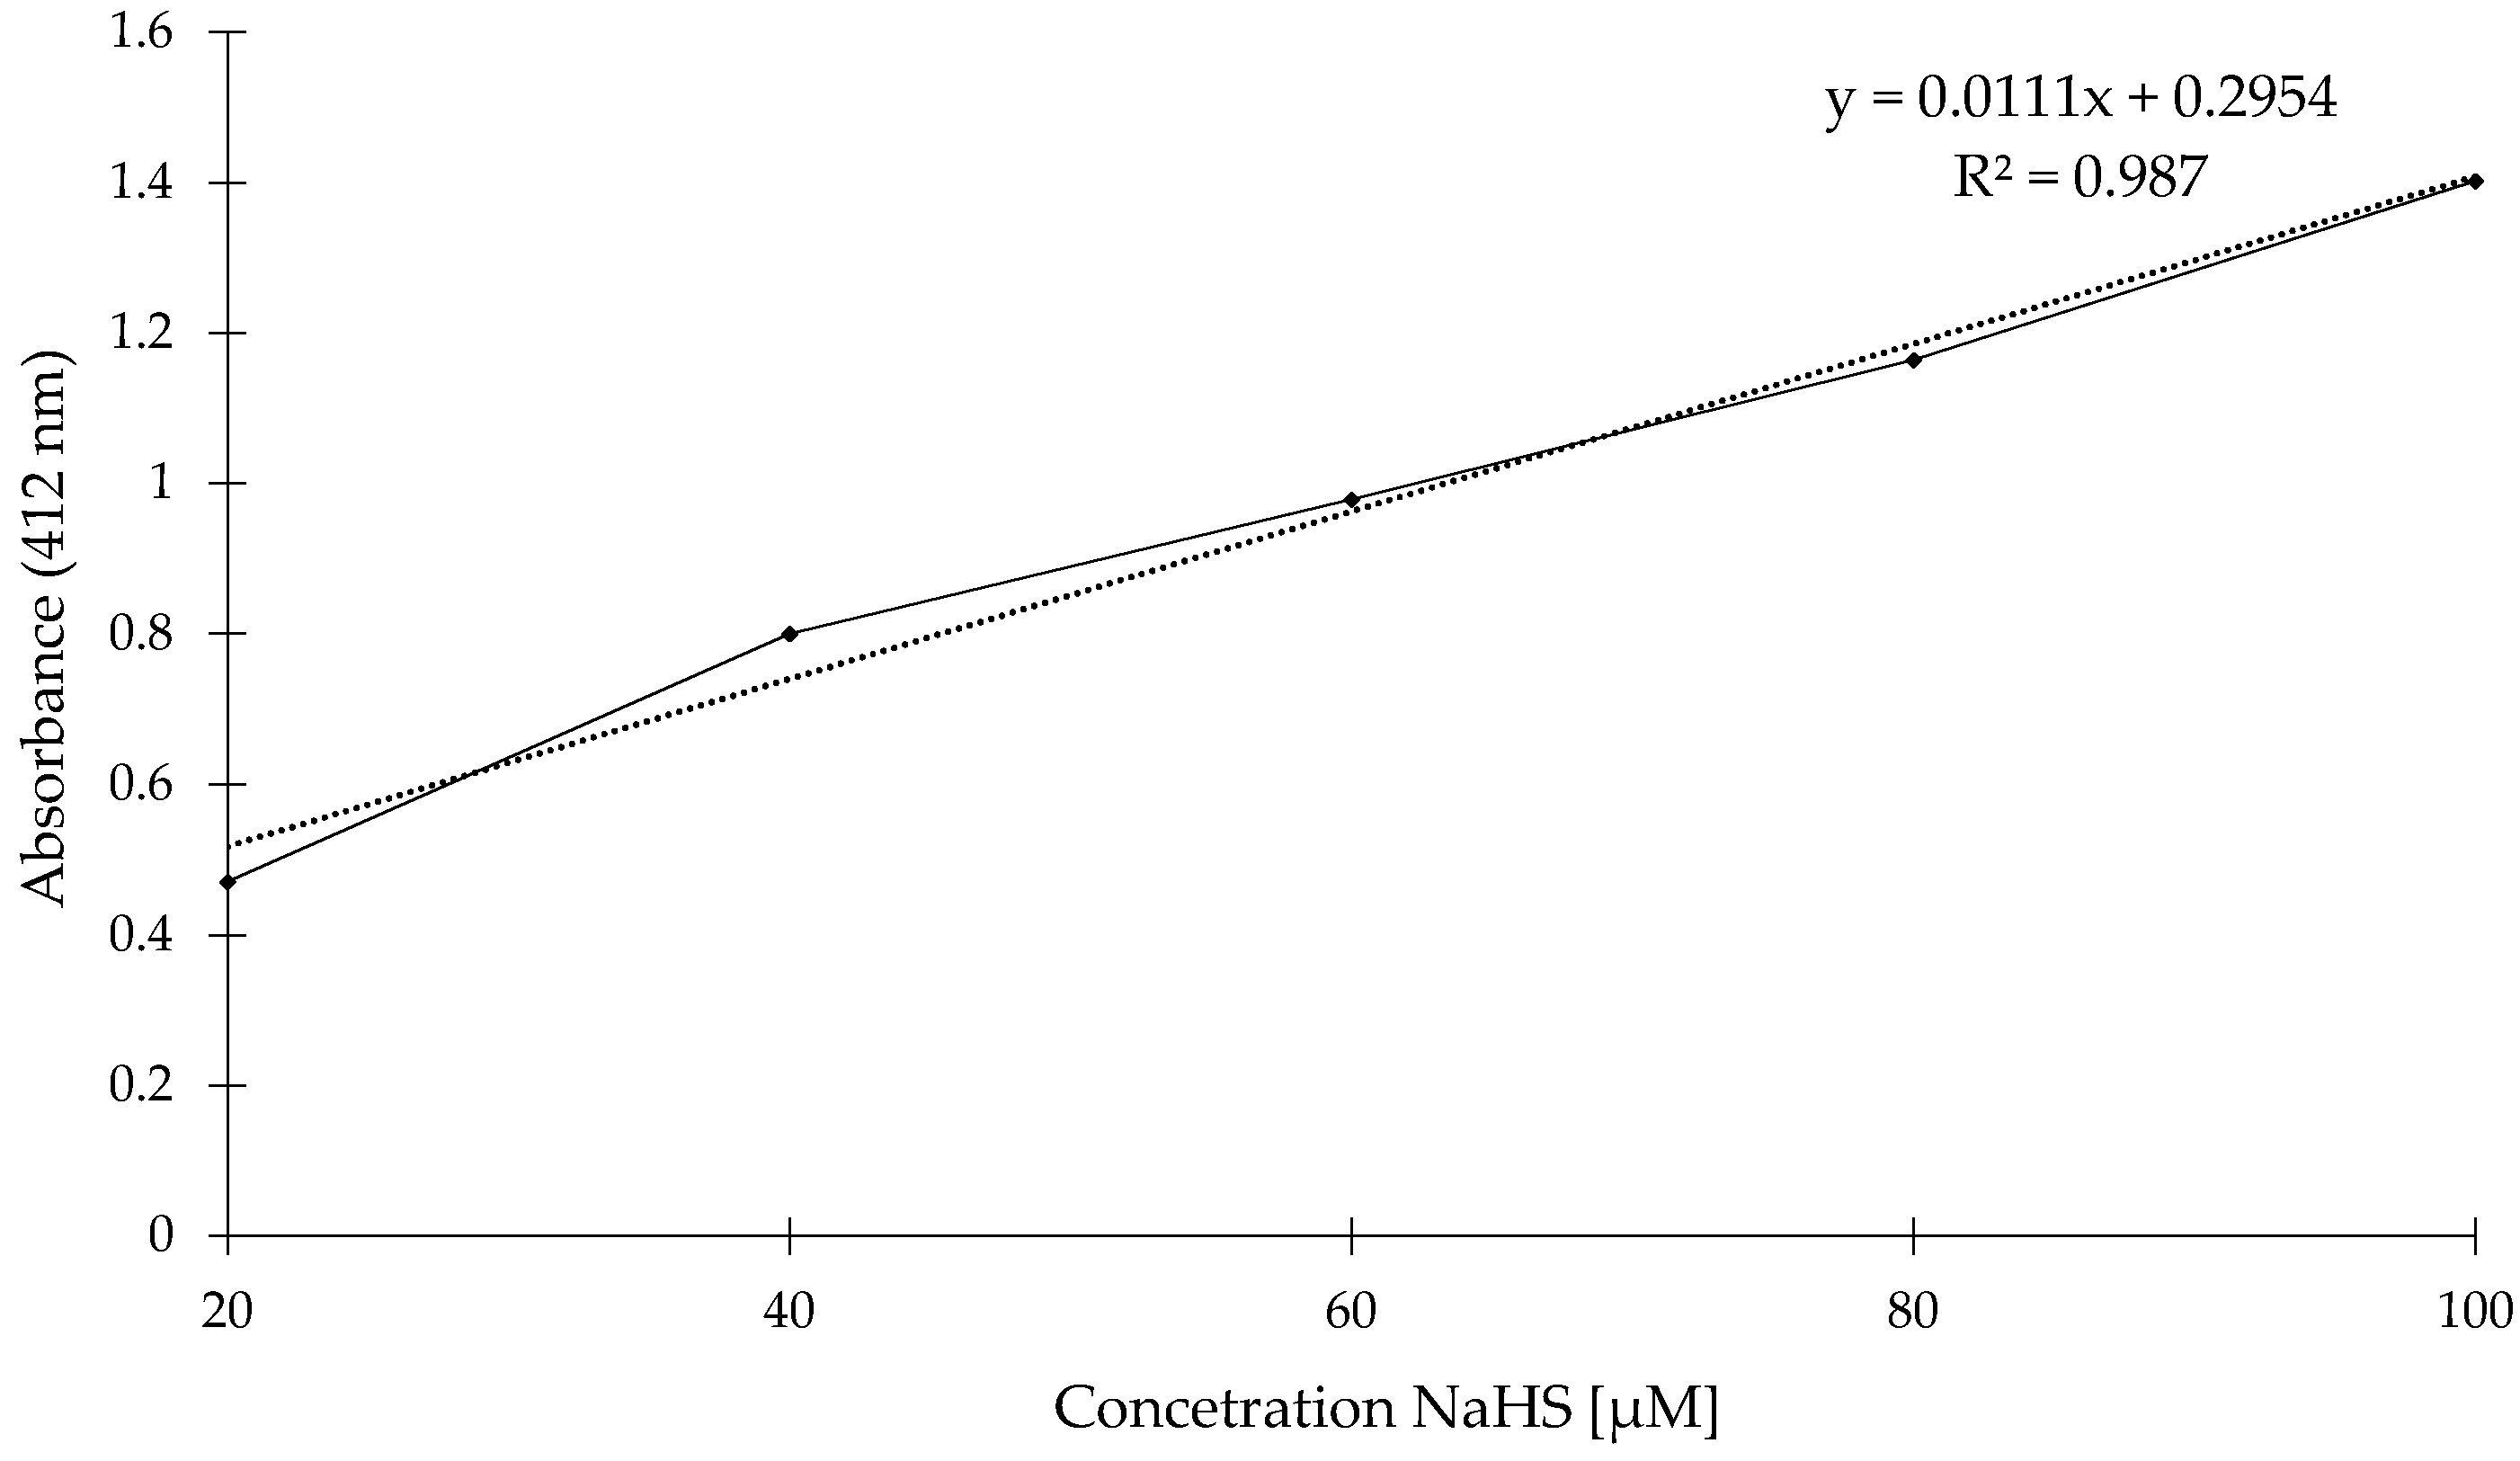
To determine relationship between changes of absorbance and concentration of NaHS, we recorded the absorbance in different concentrations of NaHS aqueous solution. Concentration of NaHS from 20 μM up to 100 μM, were used. As shown in Figure 12, we observed an increase in the absorbance along with increasing NaHS concentration.
Table 2 summarizes the results of H2S detection (aqueous solution of NaHS, a H2S donor) which have been obtained by Ellman’s test and by fluorescence method using our probe. In Table 2 are shown the results of H2S detection (aqueous solution of NaHS, a H2S donor) which have been obtained by Ellman’s test and by fluorescence method using our probe.

3.9. H2S Detection in Saliva

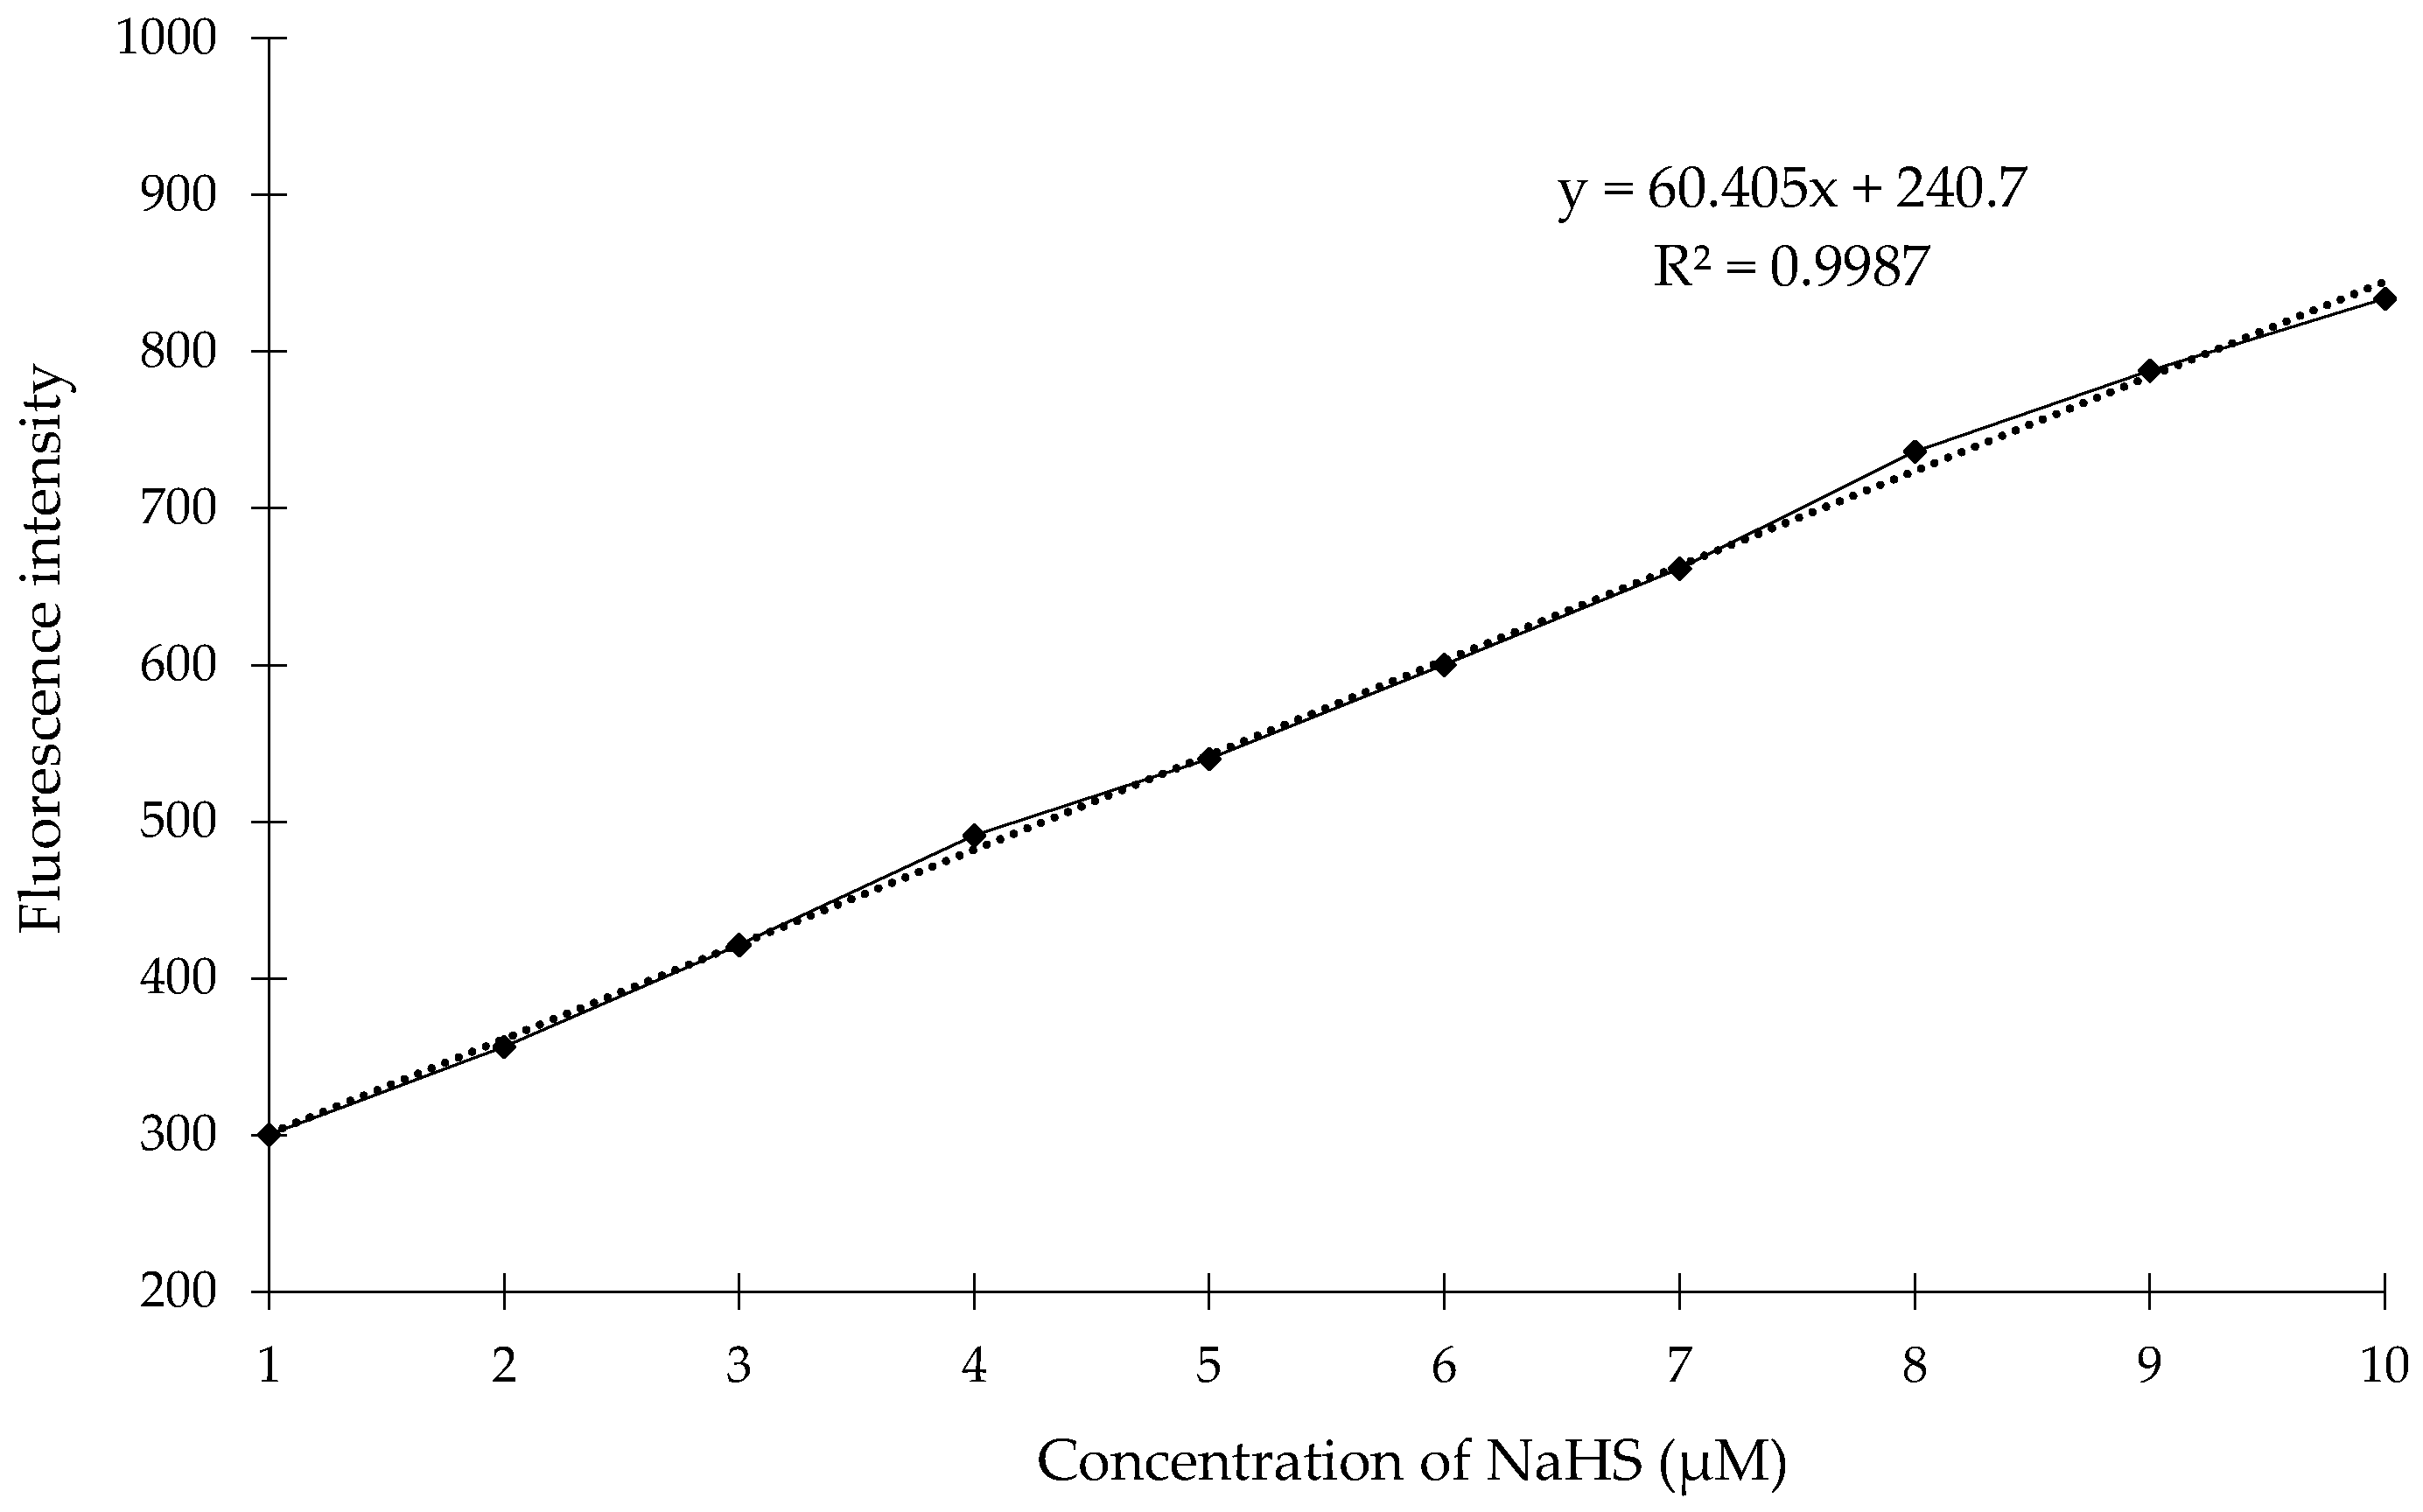
To determine whether the novel compound 1 can be used for the determination of H2S concentrations in a biological sample we performed competition experiments in 15 samples of saliva. Additionally, we plotted the calibration curve for the compound 1 in range concentrations of NaHS from 1 μM up to 10 μM. As shown in Figure 13, we observed almost the linear relationship of fluorescence intensity of the compound 1 in this range concentration of NaHS. The regression analyses were: FEx/Em (365/445 nm) = 60.405[H2S] + 240.7 with R2 = 0.9987. The obtained fluorescence data for saliva samples were converted into H2S concentrations by means of a calibration curve. The obtained results measured by fluorescence method with the compound 1 for 15 samples of saliva are presented in Table 1.

3.10. General Procedure for H2S Detection by the Fluorescence Method

NaHS solutions with appropriate concentrations were prepared using sodium phosphate buffer as a solvent. For the assay, the various volumes of NaHS solution were added respectively to solution of 1, 2 and 3 in sodium phosphate buffer containing 20% CH3CN (pH = 7.4). The total volume of the solution being measured was 2000 μL. The final concentration of the compound 1 was 0.1 mM, while various concentration of NaHS were added (in range from 1 to 10 μM and in range from 20 to 100 μM). The fluorescence response was monitored over time. Emission spectra were collected between 350 nm and 550 nm with λex = 365 nm. Time points represent time range from 1 to 10 min after addition of NaHS. The spectrum at t = 0 min was acquired from a 0.1 mM solution of the compound 1 without NaHS. Fluorescence data and obtained linear calibration curves were used to calculate the reaction rate of NaHS with the compound 1 and concentrations of H2S.

3.11. General Procedure for H2S Detection Using the Ellman’s Test

Procedure was carried out quantitating sulfhydryl groups according to the manual attached by Thermo Fisher Scientific (Catalog number: 22,582). The procedure for the quantification of sulfhydryl groups was performed according to the manual attached by Thermo Fisher Scientific (Catalog number: 22,582).

3.12. General Procedure for H2S Detection in Saliva Using Compound 1

In these experiments an appropriate sample of saliva (0.4 mL) were added to solution of the compound 1 in the in sodium phosphate buffer containing 20% CH3CN (pH = 7.4). The final concentration of the compound 1 was 0.1 mM. The total volume of the solution being measured was 2000 μL. The fluorescence response of the compound 1 was monitored over time with λex = 365 nm and λem = 445 nm. The spectrum at t = 0 min was acquired from a solution of the compound 1 without saliva. Fluorescence data were converted into H2S concentrations in sample of saliva by means of a calibration curve.

3.13. Collection of Saliva Samples

The study was performed in compliance with the ethical guidelines of the 1975 Declaration of Helsinki and was approved by the Bioethics Committee of the Medical University of Warsaw (approval no. KB/138/2018). Informed consent was obtained in every case. Samples were obtained from 15 adult volunteers. Demographics and clinical data of the study subjects are listed in Table 3. Inclusion criteria were as follows: healthy, 18–40 years-old, male and female. Exclusion criteria were as follows: chronic general diseases, acute general diseases, current dental problems, halitosis, treatment with any drugs or dietary supplement including probiotics during the last month before the study. Subjects brushed teeth and did not drink and eat for 90 min before saliva collection. Samples were collected directly to Eppendorf tubes after short exposition of subjects to the smell of lemon.

4. Conclusions

We synthesized a new fluorescent, self-immolative probe for H2S detection in biological fluids. The design of compound 1 was based on the combination of two strategies for H2S detection, i.e., reduction of an azido group to an amine in the presence of H2S and spontaneous intramolecular lactamization. The compound 1 showed several characteristics that are desirable for evaluation of H2S concentration in biological systems and human body fluids, including straightforward synthesis, stability, reactivity in aqueous media at physiological pH and fast response time. Finally, we measured salivary H2S concentration in healthy, 18–40-year-old volunteers immediately after obtaining specimens. Salivary H2S concentration in healthy humans was within a range of 1.641–7.124 μM.

Supplementary Materials

The Supplementary Materials are available online.

Author Contributions

Conception or design of the work: E.Z., R.O., D.K., M.U. Performing analyzes or interpretation of data for the work: E.Z., M.K., D.K., M.U. Drafting the work: E.Z., D.K., M.U. All authors have approved the final version of the manuscript and agreed to be accountable for all aspects of the work. All persons designated as authors qualify for authorship, and all those who qualify for authorship are listed. The authors declare no conflict of interest.

Funding

This work was supported by the National Science Centre, Poland grant no. UMO-2016/22/E/NZ5/00647.

Acknowledgments

The experiments were performed at the Institute of Organic Chemistry Polish Academy of Sciences, Warsaw, Poland and the Laboratory of Experimental Physiology and Pathophysiology, Laboratory of the Centre for Preclinical Research, Medical University of Warsaw, Poland.

Conflicts of Interest

The authors declare no conflict of interest. The founding sponsors had no role in the design of the study; in the collection, analyses, or interpretation of data; in the writing of the manuscript, and in the decision to publish the results.

Abbreviations

ALSAcid Labile Sulfide
CDCl3Deuterated chloroform
CH2Cl2Dichloromethane
CH3CNAcetonitrile
CLSSChemiLuminescent Sulfide Sensors
13C-NMRCarbon-13 nuclear magnetic resonance
CuSCopper sulfide
CTABCetyltrimethylammonium bromide
DCCN,N′-Dicyclohexylcarbodiimide
DMAPN,N-Dimethylpyridin-4-amine
DTNB5,5′-Dithiobis(2-nitrobenzoic acid)
HClHydrochloric acid
1H-NMRProton nuclear magnetic resonance
HRMSHigh Resolution Mass Spectrometry
H2SHydrogen sulfide
MgSO4Magnesium sulfate
mMMillimolar concentration
MSMass Spectrometry
NaHSSodium hydrosulfide
R2Coefficient of determination
SEStandard Error
SFSulfur fluride
TLCThin layer chromatography
TNB2−2-Nitro-5-thiobenzoate anion
UV-visUltraviolet–visible spectroscopy
λexExcitation wavelength
λemEmission wavelength

References

  1. Lavu, M.; Bhushan, S.; Lefer, D.J. Hydrogen sulfide-mediated cardioprotection: Mechanisms and therapeutic potential. Clin. Sci. 2011, 120, 219–229. [Google Scholar] [CrossRef] [PubMed]
  2. Whiteman, M.; Moore, P.K. Hydrogen sulfide and the vasculature: A novel vasculoprotective entity and regulator of nitric oxide bioavailability? J. Cell. Mol. Med. 2009, 13, 488–507. [Google Scholar] [CrossRef] [PubMed] [Green Version]
  3. Yang, G.; Wu, L.; Jiang, B.; Yang, W.; Qi, J.; Cao, K.; Meng, Q.; Mustafa, A.K.; Mu, W.; Zhang, S.; et al. H2S as a physiologic vasorelaxant: Hypertension in mice with deletion of cystathionine gamma-lyase. Science 2008, 322, 587–590. [Google Scholar] [CrossRef] [PubMed]
  4. Zhang, X.; Bian, J.S. Hydrogen sulfide: A neuromodulator and neuroprotectant in the central nervous system. ACS Chem. Neurosci. 2014, 5, 876–883. [Google Scholar] [CrossRef] [PubMed]
  5. Kulkarni, K.H.; Monjok, E.M.; Zeyssig, R.; Kouamou, G.; Bongmba, O.N.; Opere, C.A.; Njie, Y.F.; Ohia, S.E. Effect of hydrogen sulfide on sympathetic neurotransmission and catecholamine levels in isolated porcine iris-ciliary body. Neurochem. Res. 2009, 34, 400–406. [Google Scholar] [CrossRef] [PubMed]
  6. Zhu, X.Y.; Gu, H.; Ni, X. Hydrogen sulfide in the endocrine and reproductive systems. Expert Rev. Clin. Pharmacol. 2011, 4, 75–82. [Google Scholar] [CrossRef] [PubMed]
  7. Srilatha, B.; Hu, L.; Adaikan, G.P.; Moore, P.K. Initial characterization of hydrogen sulfide effects in female sexual function. J. Sex. Med. 2009, 6, 1875–1884. [Google Scholar] [CrossRef] [PubMed]
  8. Srilatha, B.; Adaikan, P.G.; Li, L.; Moore, P.K. Hydrogen sulphide: A novel endogenous gasotransmitter facilitates erectile function. J. Sex. Med. 2007, 4, 1304–1311. [Google Scholar] [CrossRef] [PubMed]
  9. Yang, G.; Yang, W.; Wu, L.; Wang, R. H2S, endoplasmic reticulum stress, and apoptosis of insulin-secreting beta cells. J. Biol. Chem. 2007, 282, 16567–16576. [Google Scholar] [CrossRef] [PubMed]
  10. Yang, W.; Yang, G.; Jia, X.; Wu, L.; Wang, R. Activation of KATP channels by H2S in rat insulin-secreting cells and the underlying mechanisms. J. Physiol. 2005, 569, 519–531. [Google Scholar] [CrossRef] [PubMed]
  11. Singh, S.; Padovani, D.; Leslie, R.A.; Chiku, T.; Banerjee, R. Relative contributions of cystathionine beta-synthase and gamma-cystathionase to H2S biogenesis via alternative trans-sulfuration reactions. J. Biol. Chem. 2009, 284, 22457–22466. [Google Scholar] [CrossRef] [PubMed]
  12. Chiku, T.; Padovani, D.; Zhu, W.; Singh, S.; Vitvitsky, V.; Banerjee, R. H2S biogenesis by human cystathionine gamma-lyase leads to the novel sulfur metabolites lanthionine and homolanthionine and is responsive to the grade of hyperhomocysteinemia. J. Biol. Chem. 2009, 284, 11601–11612. [Google Scholar] [CrossRef] [PubMed]
  13. Linden, D.R. Hydrogen sulfide signaling in the gastrointestinal tract. Antioxid. Redox Signal. 2014, 20, 818–830. [Google Scholar] [CrossRef] [PubMed]
  14. Linden, D.R.; Levitt, M.D.; Farrugia, G.; Szurszewski, J.H. Endogenous production of H2S in the gastrointestinal tract: Still in search of a physiologic function. Antioxid. Redox Signal. 2010, 12, 1135–1146. [Google Scholar] [CrossRef] [PubMed]
  15. Ufnal, M.; Sikora, N.; Dudek, M. Exogenous hydrogen sulfide produces hemodynamic effects by triggering central neuroregulatory mechanisms. Acta Neurobiol. Exp. 2008, 68, 382–388. [Google Scholar]
  16. Huc, T.; Jurkowska, H.; Wrobel, M.; Jaworska, K.; Onyszkiewicz, M.; Ufnal, M. Colonic hydrogen sulfide produces portal hypertension and systemic hypotension in rats. Exp. Biol. Med. 2018, 243, 96–106. [Google Scholar] [CrossRef] [PubMed]
  17. Drapala, A.; Koszelewski, D.; Tomasova, L.; Ostaszewski, R.; Grman, M.; Ondrias, K.; Ufnal, M. Parenteral Na2S, a fast-releasing H2S donor, but not GYY4137, a slow-releasing H2S donor, lowers blood pressure in rats. Acta Biochim. Pol. 2017, 64, 561–566. [Google Scholar] [CrossRef] [PubMed]
  18. Sikora, M.; Drapala, A.; Ufnal, M. Exogenous hydrogen sulfide causes different hemodynamic effects in normotensive and hypertensive rats via neurogenic mechanisms. Pharmacol. Rep. 2014, 66, 751–758. [Google Scholar] [CrossRef] [PubMed]
  19. Tomasova, L.; Drapala, A.; Jurkowska, H.; Wróbel, M.; Ufnal, M. Na2S, a fast-releasing H2S donor, given as suppository lowers blood pressure in rats. Pharmacol. Rep. 2017, 69, 971–977. [Google Scholar] [CrossRef] [PubMed]
  20. Ratcliff, P.A.; Johnson, P.W. The relationship between oral malodor, gingivitis, and periodontitis. A review. J. Periodontology 1999, 70, 485–489. [Google Scholar] [CrossRef] [PubMed]
  21. Ayers, K.M.; Colquhoun, A. Halitosis: Causes, diagnosis, and treatment. N. Z. Dent. J. 1998, 94, 156–160. [Google Scholar] [PubMed]
  22. Searcy, D.G.; Peterson, M.A. Hydrogen sulfide consumption measured at low steady state concentrations using a sulfidostat. Anal. Biochem. 2004, 324, 269–275. [Google Scholar] [CrossRef] [PubMed]
  23. Radford-Knoery, J.; Cutter, G.A. Determination of carbonyl sulfide and hydrogen sulfide species in natural waters using specialized collection procedures and gas chromatography with flame photometric detection. Anal. Chem. 1993, 65, 976–982. [Google Scholar] [CrossRef]
  24. Hou, F.P.; Huang, L.; Xi, P.X.; Cheng, J.; Zhao, X.F.; Xie, G.Q.; Shi, Y.J.; Cheng, F.J.; Yao, X.J.; Bai, D.C.; et al. A retrievable and highly selective fluorescent probe for monitoring sulfide and imaging in living cells. Inorg. Chem. 2012, 51, 2454–2460. [Google Scholar] [CrossRef] [PubMed]
  25. Xuan, W.; Sheng, C.; Cao, Y.; He, W.; Wang, W. Fluorescent probes for the detection of hydrogen sulfide in biological systems. Angew. Chem. Int. Ed. 2012, 51, 2282–2284. [Google Scholar] [CrossRef] [PubMed]
  26. Ding, Y.B.; Tang, Y.Y.; Zhu, W.H.; Xie, Y.S. Fluorescent and colorimetric ion probes based on conjugated oligopyrroles. Chem. Soc. Rev. 2015, 44, 1101–1112. [Google Scholar] [CrossRef] [PubMed] [Green Version]
  27. Ding, Y.B.; Zhu, W.H.; Xie, Y.S. Development of ion chemosensors based on porphyrin analogues. Chem. Rev. 2016, 117, 2203–2256. [Google Scholar] [CrossRef] [PubMed]
  28. Wang, Y.; Lv, X.; Guo, W. A reaction-based and highly selective fluorescent probe for hydrogen sulfide. Dyes Pigment. 2017, 139, 482–486. [Google Scholar] [CrossRef]
  29. Guo, Z.; Chen, G.; Zeng, G.; Li, Z.; Chen, A.; Wang, J.; Jiang, L. Fluorescence chemosensors for hydrogen sulfide detection in biological systems. Analyst 2015, 140, 1772–1786. [Google Scholar] [CrossRef] [PubMed]
  30. Lippert, A.R.; New, E.J.; Chang, C.J. Reaction-based fluorescent probes for selective imaging of hydrogen sulfide in living cells. J. Am. Chem. Soc. 2011, 133, 10078–10080. [Google Scholar] [CrossRef] [PubMed]
  31. Ding, S.; Feng, W.; Feng, G. Rapid and highly selective detection of H2S by nitrobenzofurazan (NBD) ether-based fluorescent probes with an aldehyde group. Sens. Actuators B Chem. 2017, 238, 619–625. [Google Scholar] [CrossRef]
  32. Han, Q.; Mou, Z.; Wang, H.; Tang, X.; Dong, Z.; Wang, L.; Dong, X.; Liu, W. Highly selective and sensitive one-and two-photon ratiometric fluorescent probe for intracellular hydrogen polysulfide sensing. Anal. Chem. 2016, 88, 7206–7212. [Google Scholar] [CrossRef] [PubMed]
  33. Jin, X.; Wu, S.; She, M.; Jia, Y.; Hao, L.; Yin, B.; Wang, L.; Obst, M.; Shen, Y.; Zhang, Y. Novel fluorescein-based fluorescent probe for detecting H2S and Its real applications in blood plasma and biological imaging. Anal. Chem. 2016, 88, 11253–11260. [Google Scholar] [CrossRef] [PubMed]
  34. Zhou, Y.; Zhang, X.; Yang, S.; Li, Y.; Qing, Z.; Zheng, J.; Li, J.; Yang, R. Ratiometric visualization of NO/H2S cross-talk in living cells and tissues using a nitroxyl-responsive two-photon fluorescence probe. Anal. Chem. 2017, 89, 4587–4594. [Google Scholar] [CrossRef] [PubMed]
  35. Wu, Z.; Li, Z.; Yang, L.; Han, J.; Han, S. Fluorogenic detection of hydrogen sulfide via reductive unmasking of o-azidomethylbenzoyl-coumarin conjugate. Chem. Commun. 2012, 48, 10120–10122. [Google Scholar] [CrossRef] [PubMed]
  36. Zhang, L.; Li, S.; Hong, M.; Xu, Y.; Wang, S.; Liu, Y.; Qian, Y.; Zhao, J. A colorimetric and ratiometric fluorescent probe for the imaging of endogenous hydrogen sulphide in living cells and sulphide determination in mouse hippocampus. J. Org. Biomol. Chem. 2014, 12, 5115–5125. [Google Scholar] [CrossRef] [PubMed]
  37. Liu, X.L.; Du, X.J.; Dai, C.G.; Song, Q.H. Ratiometric two-photon fluorescent probes for mitochondrial hydrogen sulfide in living cells. J. Org. Chem. 2014, 79, 9481–9489. [Google Scholar] [CrossRef] [PubMed]
  38. Li, H.; Peng, W.; Feng, W.; Wang, Y.; Chen, G.; Wang, S.; Li, S.; Li, H.; Wang, K.; Zhang, J. A novel dual-emission fluorescent probe for the simultaneous detection of H2S and GSH. Chem. Commun. 2016, 52, 4628–4631. [Google Scholar] [CrossRef] [PubMed]
  39. Xie, Q.L.; Liu, W.; Liu, X.J.; Ouyang, F.; Kuang, Y.Q.; Jiang, J.H. An azidocoumarin-based fluorescent probe for imaging lysosomal hydrogen sulfide in living cells. Anal. Methods 2017, 9, 2859–2864. [Google Scholar] [CrossRef]
  40. Sasakura, K.; Hanaoka, K.; Shibuya, N.; Mikami, Y.; Kimura, Y.; Komatsu, T.; Ueno, T.; Terai, T.; Kimura, H.; Nagano, T. Development of a highly selective fluorescence probe for hydrogen sulfide. J. Am. Chem. Soc. 2011, 133, 18003–18005. [Google Scholar] [CrossRef] [PubMed]
  41. Choi, M.G.; Cha, S.; Lee, H.; Jeon, H.L.; Chang, S.K. Sulfide-selective chemosignaling by a Cu2+ complex of dipicolylamine appended fluorescein. Chem. Commun. 2009, 47, 7390–7392. [Google Scholar] [CrossRef] [PubMed]
  42. Sathyadevi, P.; Lee, L.Y.; Wang, Y.L.; Chen, Y.J.; Chen, C.Y.; Wang, Y.M. A water soluble and fast response fluorescent turn-on copper complex probe for H2S detection in zebra fish. Talanta 2016, 147, 445–452. [Google Scholar]
  43. Chen, Y.; Zhu, C.; Yang, Z.; Chen, J.; He, Y.; Jiao, Y.; He, W.; Qiu, L.; Cen, J.; Guo, Z. A ratiometric fluorescent probe for rapid detection of hydrogen sulfide in mitochondria. Angew. Chem. 2013, 125, 1732–1735. [Google Scholar] [CrossRef]
  44. Wang, L.; Chen, X.; Cao, D. A nitroolefin functionalized DPP fluorescent probe for the selective detection of hydrogen sulfide. New J. Chem. 2017, 41, 3367–3373. [Google Scholar] [CrossRef]
  45. Zhou, L.; Lu, D.; Wang, Q.; Liu, S.; Lin, Q.; Sun, H. Molecular engineering of a mitochondrial-targeting two-photon in and near-infrared out fluorescent probe for gaseous signal molecules H2S in deep tissue bioimaging. Biosens. Bioelectron. 2017, 91, 699–705. [Google Scholar] [CrossRef] [PubMed]
  46. Nashet, A.S.; Osuga, D.T.; Feeney, R.E. Hydrogen Sulfide in Redox Biology. Anal. Biochem. 1977, 79, 394–405. [Google Scholar]
  47. Ellman, G.L. Tissue sulfhydryl groups. Arch. Biochem. Biophys. 1959, 82, 70–77. [Google Scholar] [CrossRef]
  48. Gura, T. Just spit it out. Nat. Med. 2008, 14, 706–709. [Google Scholar] [CrossRef] [PubMed]
  49. Aas, J.A.; Paster, B.J.; Stokes, L.N.; Olsen, I.; Dewhirst, F.E. Defining the normal bacterial flora of the oral cavity. J. Clin. Microbiol. 2005, 43, 5721–5732. [Google Scholar] [CrossRef] [PubMed]
  50. Moore, W.E.; Moore, L.V. The bacteria of periodontal diseases. Periodontolgy 2000 1994, 5, 66–77. [Google Scholar] [CrossRef]
  51. Matsuyama, T.; Kawai, T.; Izumi, Y.; Taubman, M.A. Expression of major histocompatibility complex class II and CD80 by gingival epithelial cells induces activation of CD4+ T cells in response to bacterial challenge. Infect. Immun. 2005, 73, 1044–1051. [Google Scholar] [CrossRef] [PubMed]
  52. Kleinberg, I.; Westbay, G. Oral malodor. Crit. Rev. Oral Biol. Med. 1990, 1, 247–259. [Google Scholar] [CrossRef] [PubMed]
  53. Ubuka, T. Assay methods and biological roles of labile sulfur in animal tissues. J. Chromatogr. B Anal. Technol. Biomed. Life Sci. 2002, 781, 227–249. [Google Scholar] [CrossRef]
  54. Kanehira, T.; Hongo, H.; Takehara, J.; Asano, K.; Osada, K.; Izumi, H.; Fujii, Y.; Sakamoto, W. A novel visual test for hydrogen sulfide on the tongue dorsum. Open J. Stomatol. 2012, 2, 314–321. [Google Scholar] [CrossRef]
  55. Krolla, J.K.; Werchana, C.A.; Reevesb, A.G.; Bruemmerb, K.J.; Lippertb, A.R.; Thomas Ritza, T. Sensitivity of salivary hydrogen sulfide to psychological stress and its association with exhaled nitric oxide and affect. Physiol. Behav. 2017, 179, 99–104. [Google Scholar] [CrossRef] [PubMed]
  56. Szabó, A.; Tarnai, Z.; Berkovits, C.; Novák, P.; Mohácsi, A.; Braunitzer, G.; Rakonczay, Z.; Turzó, K.; Nagy, K.; Szabó, G. Volatile sulphur compound measurement with OralChroma (TM): A methodological improvement. J. Breath Res. 2015, 9, 016001. [Google Scholar] [CrossRef] [PubMed]
  57. Jain, S.K.; Bull, R.; Rains, J.L.; Bass, P.F.; Levine, S.N.; Reddy, S.; McVie, R.; Bocchini, J.A. Low levels of hydrogen sulfide in the blood of diabetes patients and streptozotocin-treated rats causes vascular inflammation? Antioxid. Redox Signal. 2010, 12, 1333–1337. [Google Scholar] [CrossRef] [PubMed]
  58. Olson, K.R.; DeLeon, E.R.; Liu, F. Controversies and conundrums in hydrogen sulfide biology. Nitric Oxide 2014, 41, 11–26. [Google Scholar] [CrossRef] [PubMed]
  59. Li, H.; Cai, L.; Chen, Z.; Wang, W. Coumarin-Derived Fluorescent Chemosensors. IntechOpen 2012, 121–151. [Google Scholar] [CrossRef]
  60. Żądło-Dobrowolska, A.; Szczygieł, M.; Koszelewski, D.; Paprocki, D.; Ostaszewski, R. Self-immolative versatile fluorogenic probes for screening of hydrolytic enzyme activity. Org. Biomol. Chem. 2016, 14, 9146–9150. [Google Scholar] [CrossRef] [PubMed]
Sample Availability: Samples of the compounds 3-azidopropanonic acid, 5-azidopentanonic acid, 4-Methyl-2-oxo-2H-chromen-7-yl 5-Azidopentanoate (1), 4-Methyl-2-oxo-2H-chromen-7-yl 3-Azidopropanoate (2) and 4-Methyl-2-oxo-2H-chromen-7-yl Propionate (3) are available from the authors.
Figure 1. Mechanism of H2S detection for the self-immolative probe.
Molecules 23 02241 g001
Figure 2. HRMS confirmed formation of piperidin-2-one in the reaction of the compound 1 with NaHS.
Molecules 23 02241 g002
Figure 3. Time course experiment of compound 2 (0.1 mM, A) and 3 (0.1 mM, B) reacting with NaHS in sodium phosphate buffer (pH = 7.4) at room temperature. Time points represent time range from 1 to 10 min after addition of NaHS (0.1 mM). Fluorescence spectra of compound 1 (C), 2 (A) and 3 (B) were recorded for 10 min after addition of NaHS (0.1 mM).
Molecules 23 02241 g003
Figure 4. Comparison of fluorescence responses for the compound 1, 2 and 3 (0.1 mM). Data were acquired at room temperature after addition of NaHS (0.1 mM) in sodium phosphate buffer (pH = 7.4, 20% CH3CN) with excitation at 365 nm. Means ± SE from three measurements of the fluorescence responses are presented.
Molecules 23 02241 g004
Figure 5. The synthesis of 3-azidopropanonic (a) acid and 5-azidopentanonic acid (b).
Molecules 23 02241 g005
Figure 6. The synthesis of compounds 1 (a) and 2 (b).
Molecules 23 02241 g006
Figure 7. The synthesis of 4-methyl-2-oxo-2H-chromen-7-yl propionate (3).
Molecules 23 02241 g007
Figure 8. Fluorescence response of the self-immolative probe/compound 1 (0.1 mM) to 0.1 mM NaHS. Data were acquired at room temperature in sodium phosphate buffer (pH = 7.4) with excitation at 365 nm. Emission was collected in the time range 1–10 min after the addition of 0.1 mM NaHS. The spectrum at t = 0 min was acquired from a 0.1 mM solution of the compound 1 without the addition of NaHS.
Molecules 23 02241 g008
Figure 9. Time course experiment of the compound 1 (0.1 mM) reacting with NaHS (0.1 mM) in sodium phosphate buffer (pH = 7.4) at room temperature. Time points represent time range from 1 to 60 min after addition of NaHS (0.1 mM). Means ± SE from three measurements of the fluorescence responses are presented.
Molecules 23 02241 g009
Figure 10. The correlation between fluorescence intensity and NaHS concentration determined using a fluorometer: the compound 1 (0.1 mM) with NaHS (20–100 μM) in sodium phosphate buffer (λex = 365 nm) at room temperature. The points represent the mean fluorescence responses at 10 min after the addition of NaHS.
Molecules 23 02241 g010
Figure 11. Time-dependent UV-vis absorption spectra of SH-free DTNB solution (green line-background) and its mixture with NaHS (0.1 mM, orange line) in the reaction buffer (pH 8.0) at room temperature. The absorbance at 412 nm was recorded 15 min after addition of NaHS.
Molecules 23 02241 g011
Figure 12. The correlation between absorbance and NaHS concentration determined by the DTNB assay in sodium phosphate buffer (pH 8.0) at room temperature. The absorbance at 412 nm was recorded for 15 min after addition of various concentrations of NaHS from 20 to 100 μm. Values of absorbance are given as means obtained from 3 measurements. Background values were subtracted from the sample values.
Molecules 23 02241 g012
Figure 13. The correlation between fluorescence intensity and NaHS concentration determined using a fluorometer: the compound 1 (0.1 mM) with NaHS (1–10 μM) in sodium phosphate buffer (λex = 365 nm) at room temperature. The points represent the mean fluorescence responses at 10 min after the addition of NaHS.
Molecules 23 02241 g013
Table 1. Salivary H2S concentration in healthy volunteers.
Samples of Saliva (n = 15)
H2S concentration [μM]RangeMeanSE
1.641–7.1243.424±0.547
Table 2. Comparison of detection methods for H2S.
Concentration of NaHS [μM]Ellman’s Test (μM) aFluorescence Method Using the Compound 1 (μM) b
C H2S[μM]V [μM s−1]C H2S[μM]V [μM s−1]
2015.820.01817.000.028
4036.910.04138.150.064
6057.630.06458.100.097
8078.250.08778.600.13
10094.520.10597.230.16
a Conditions: 10 mM Ellman’s Reagent Solution in sodium phosphate buffer (pH 8.0), room temperature, the absorbance at 412 nm was recorded 15 min after addition of NaHS. b Conditions: 0.1 mM the fluorogenic probe in sodium phosphate buffer (pH 7.4), room temperature, the fluorescence intensity was recorded 10 min after the addition of NaHS.
Table 3. Demographics and clinical data of the study subjects and H2S levels in the saliva samples obtained using fluorescence method with the compound 1.
Participant Demographics and Physical Characteristics.
Healthy volunteers (n)15
Age (years)MeanSE (standard error)Range
281.618–40
Sex (m/f)7/8
Ethnicity:
Caucasian100%
Other-