Imaging of Human Insulin Secreting Cells with Gd-DOTA-P88, a Paramagnetic Contrast Agent Targeting the Beta Cell Biomarker FXYD2γa

 , , ,
, , , 
 ,
,  and
and 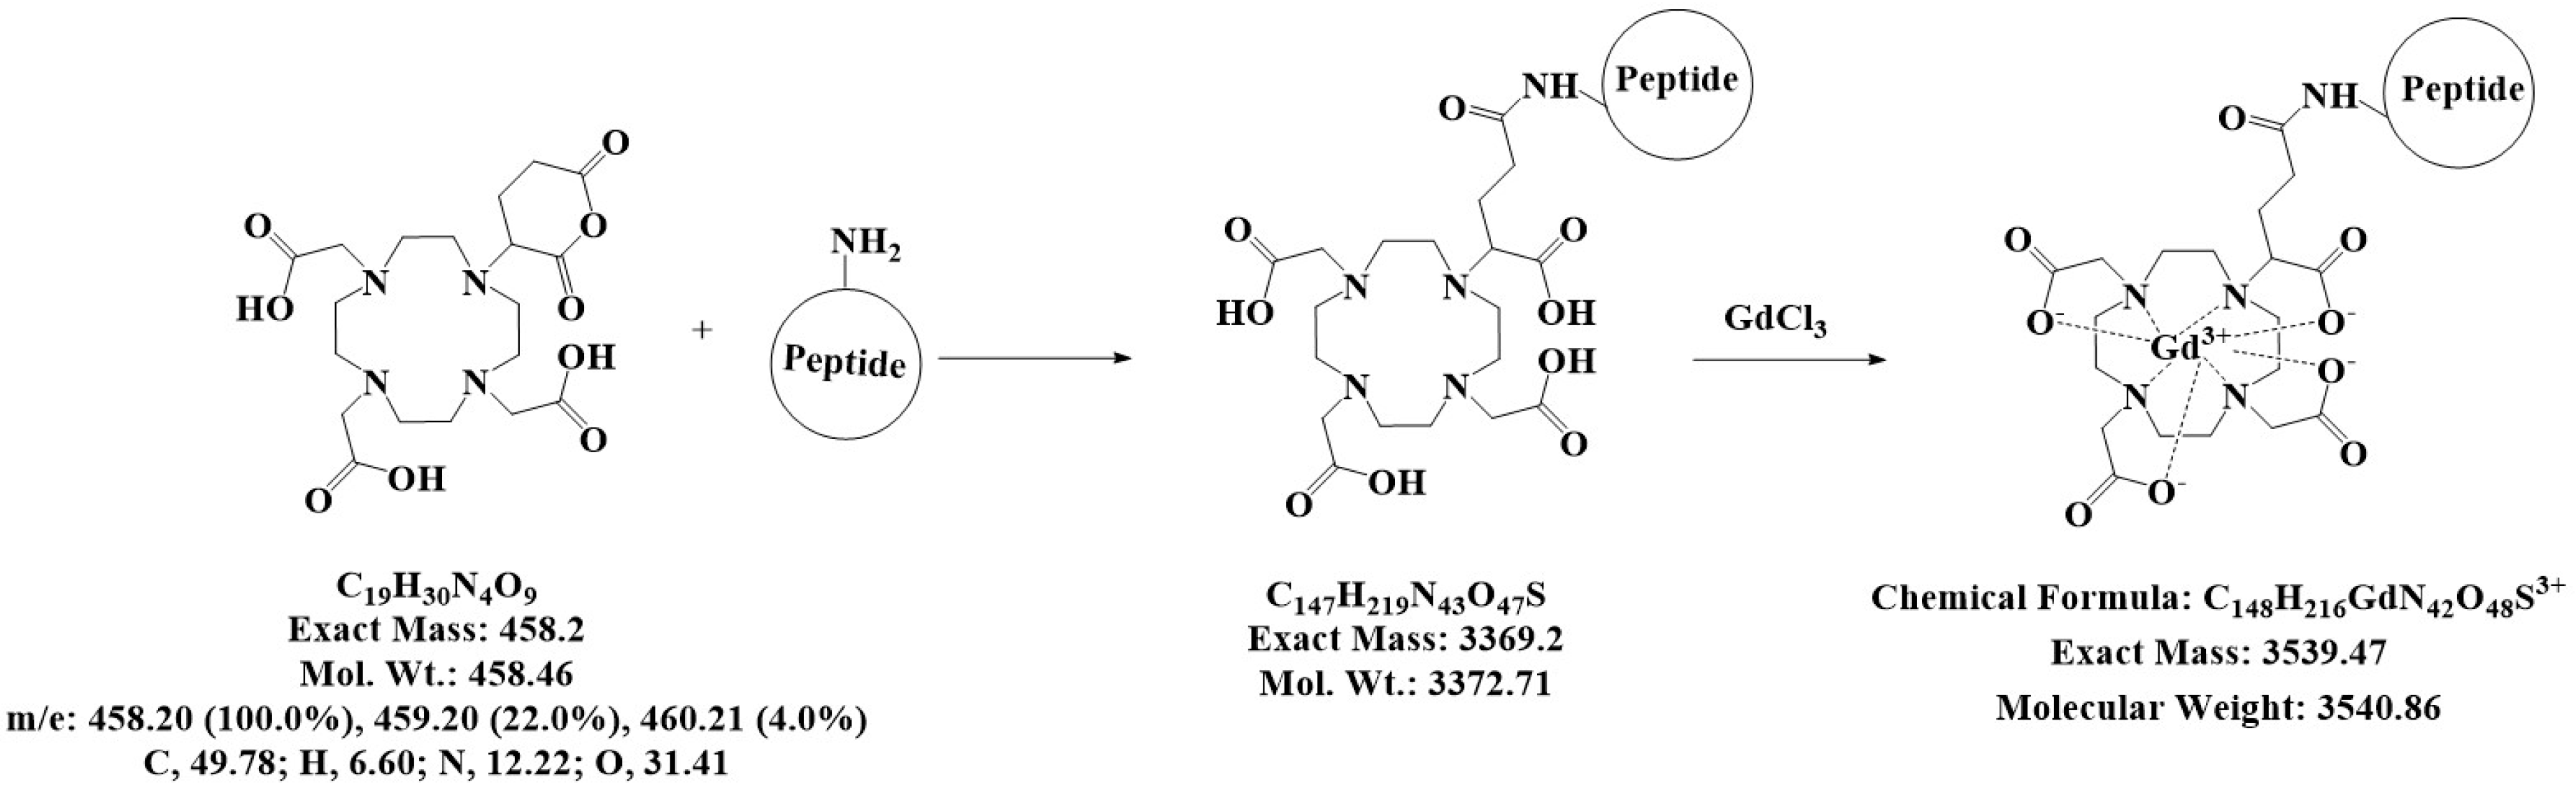
Abstract
1. Introduction
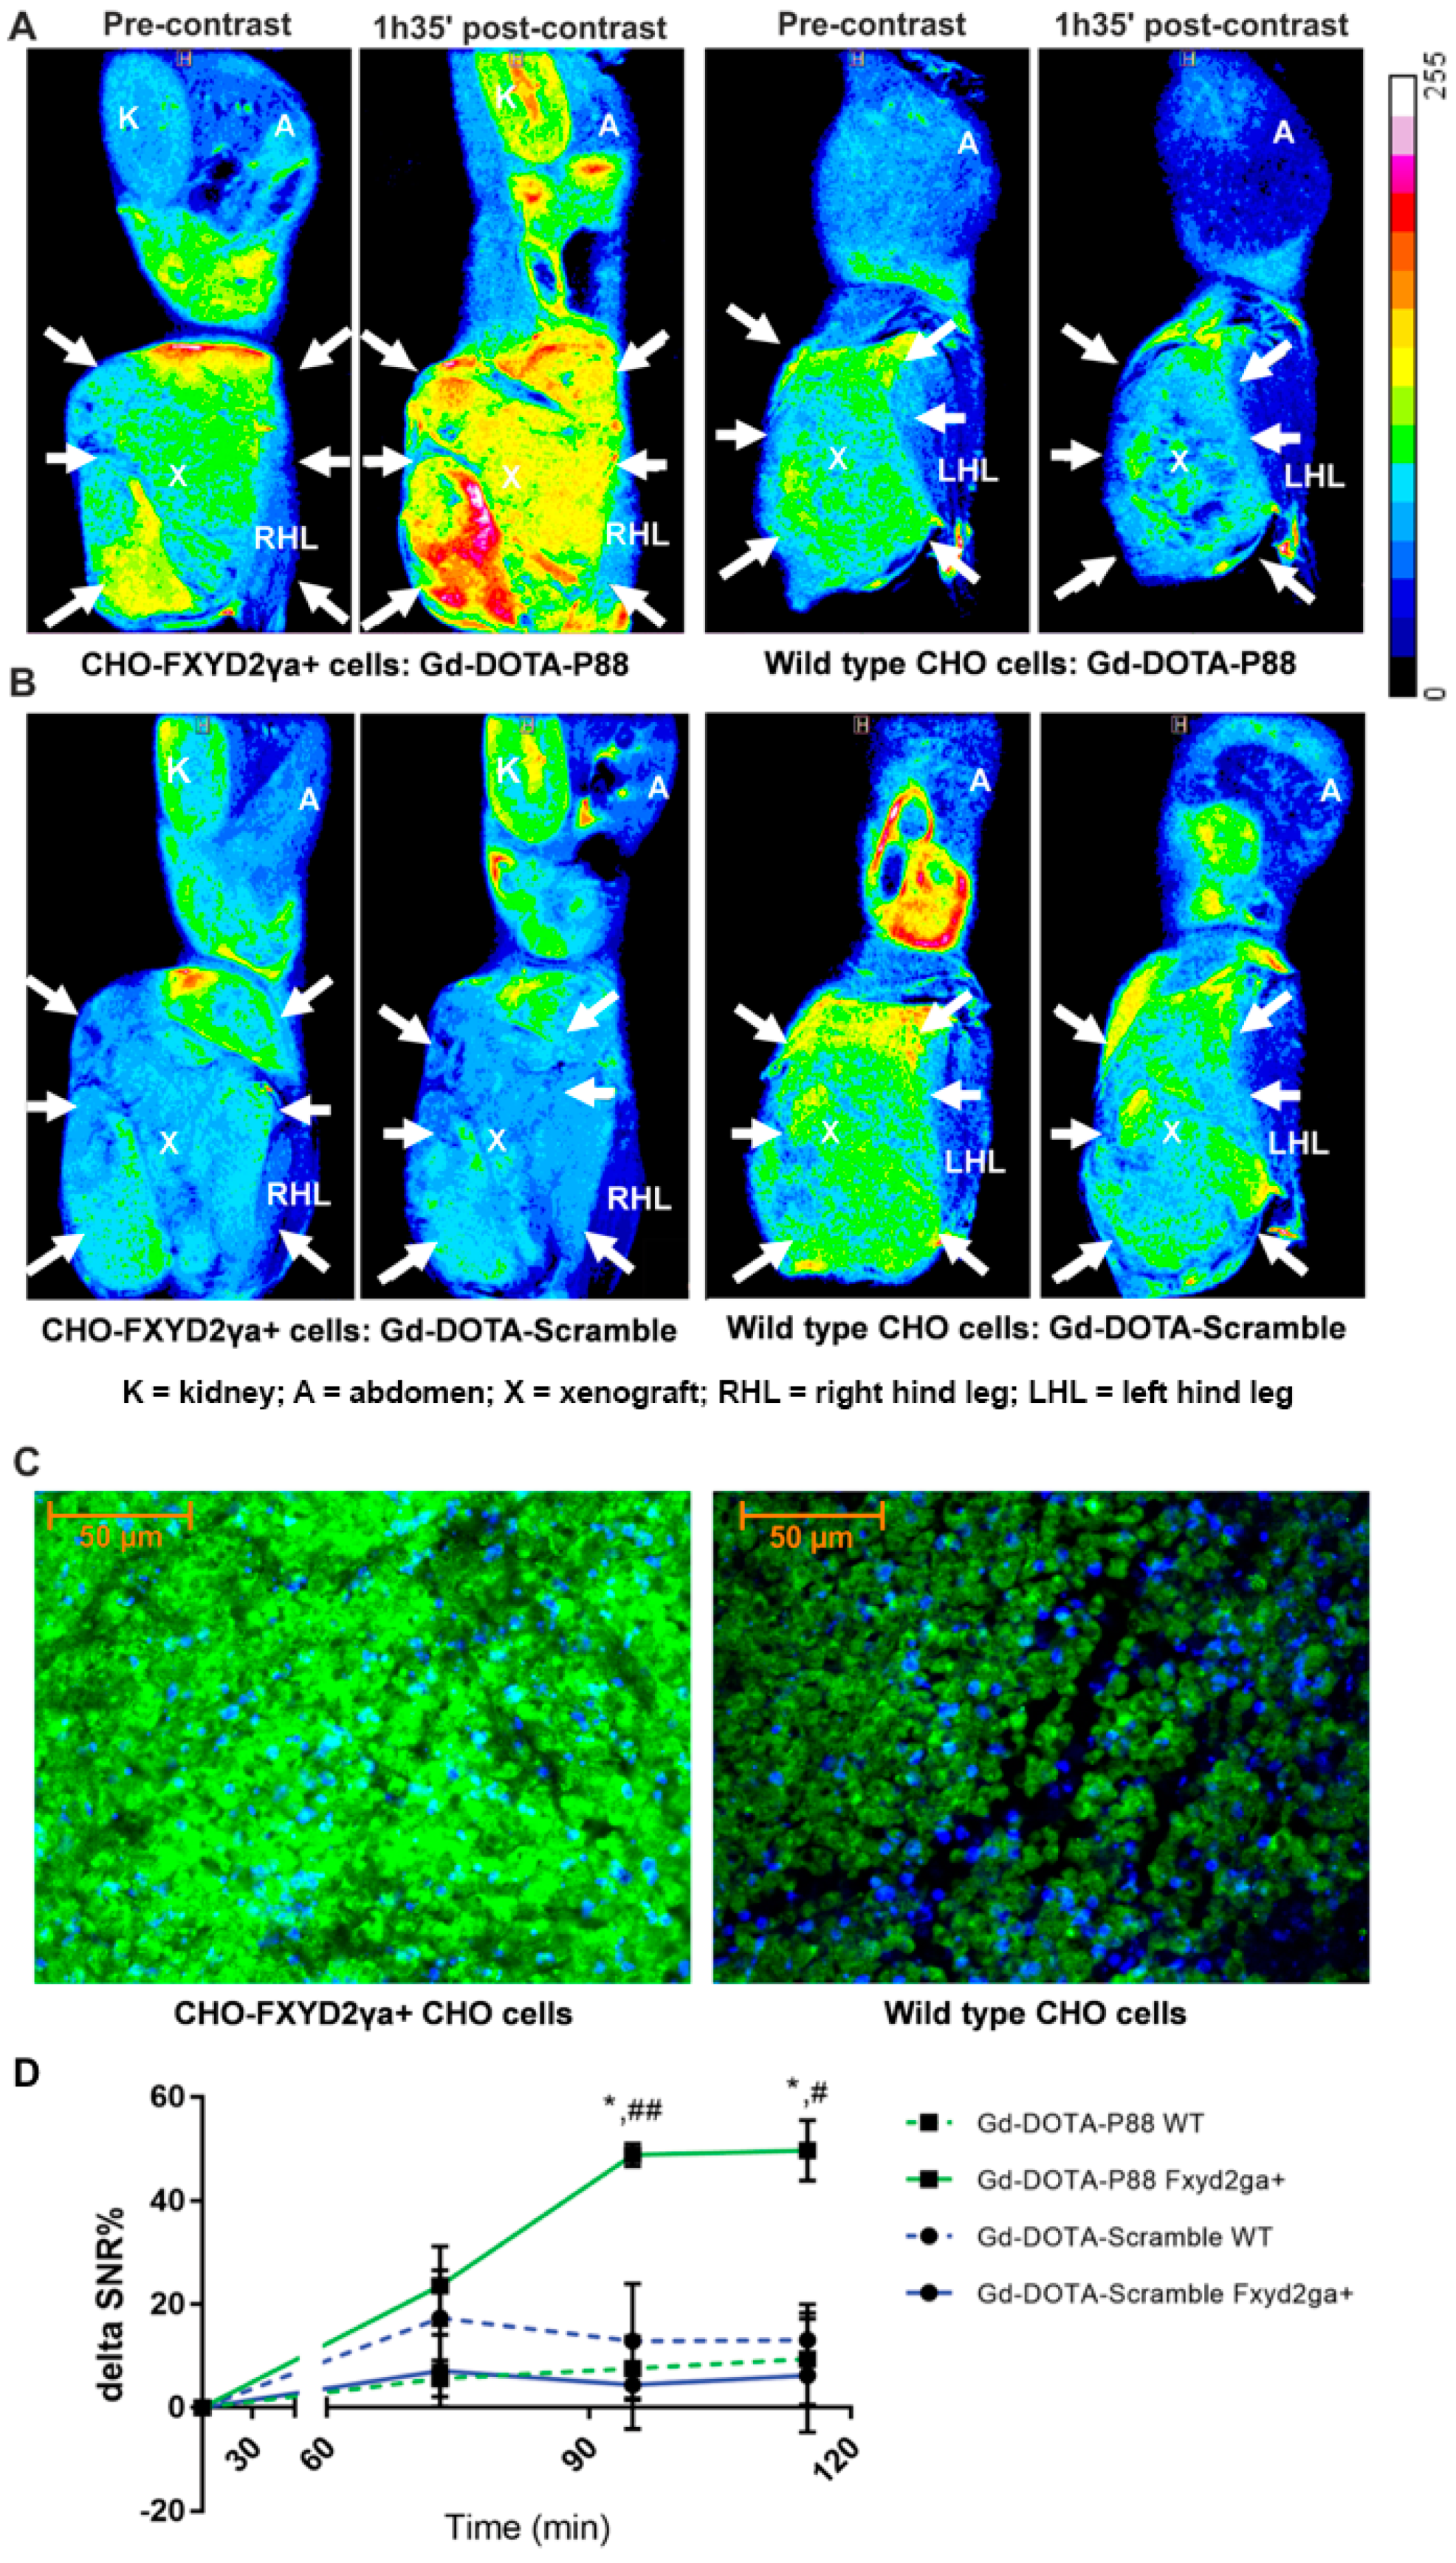
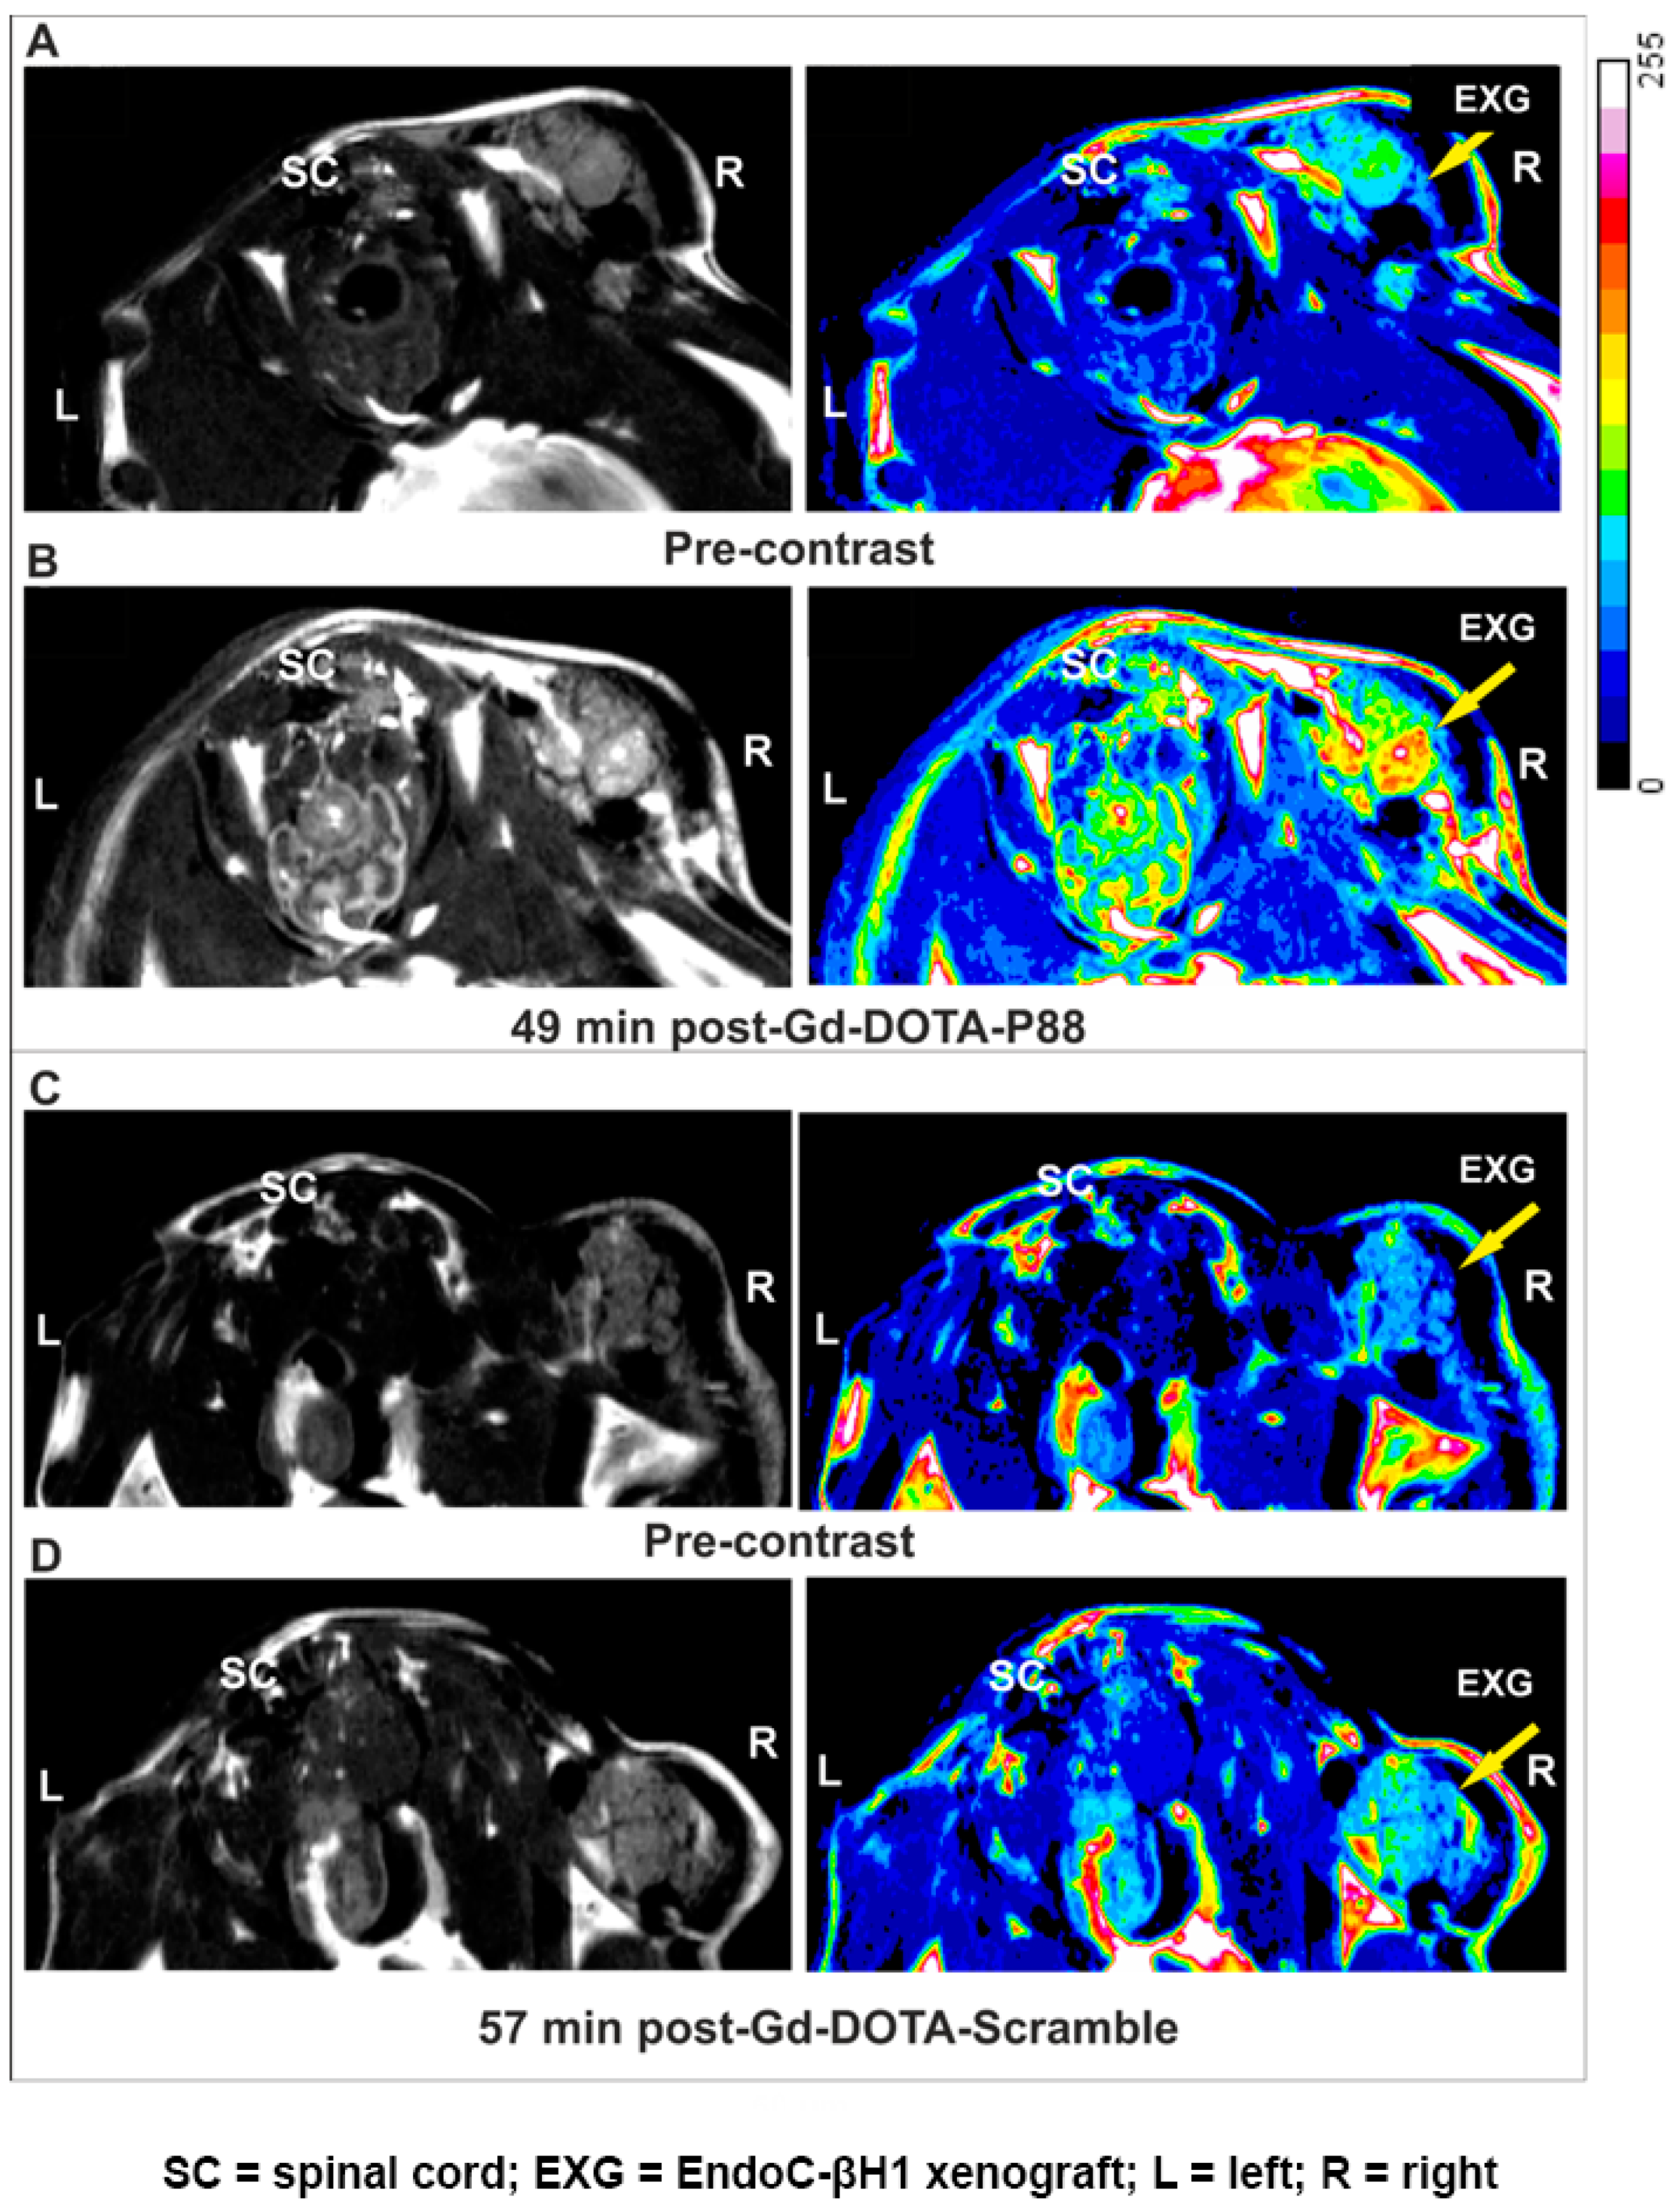
2. Results
3. Discussion
4. Materials and Methods
4.1. Ethical Statements
4.2. Cell Culture and Transfection
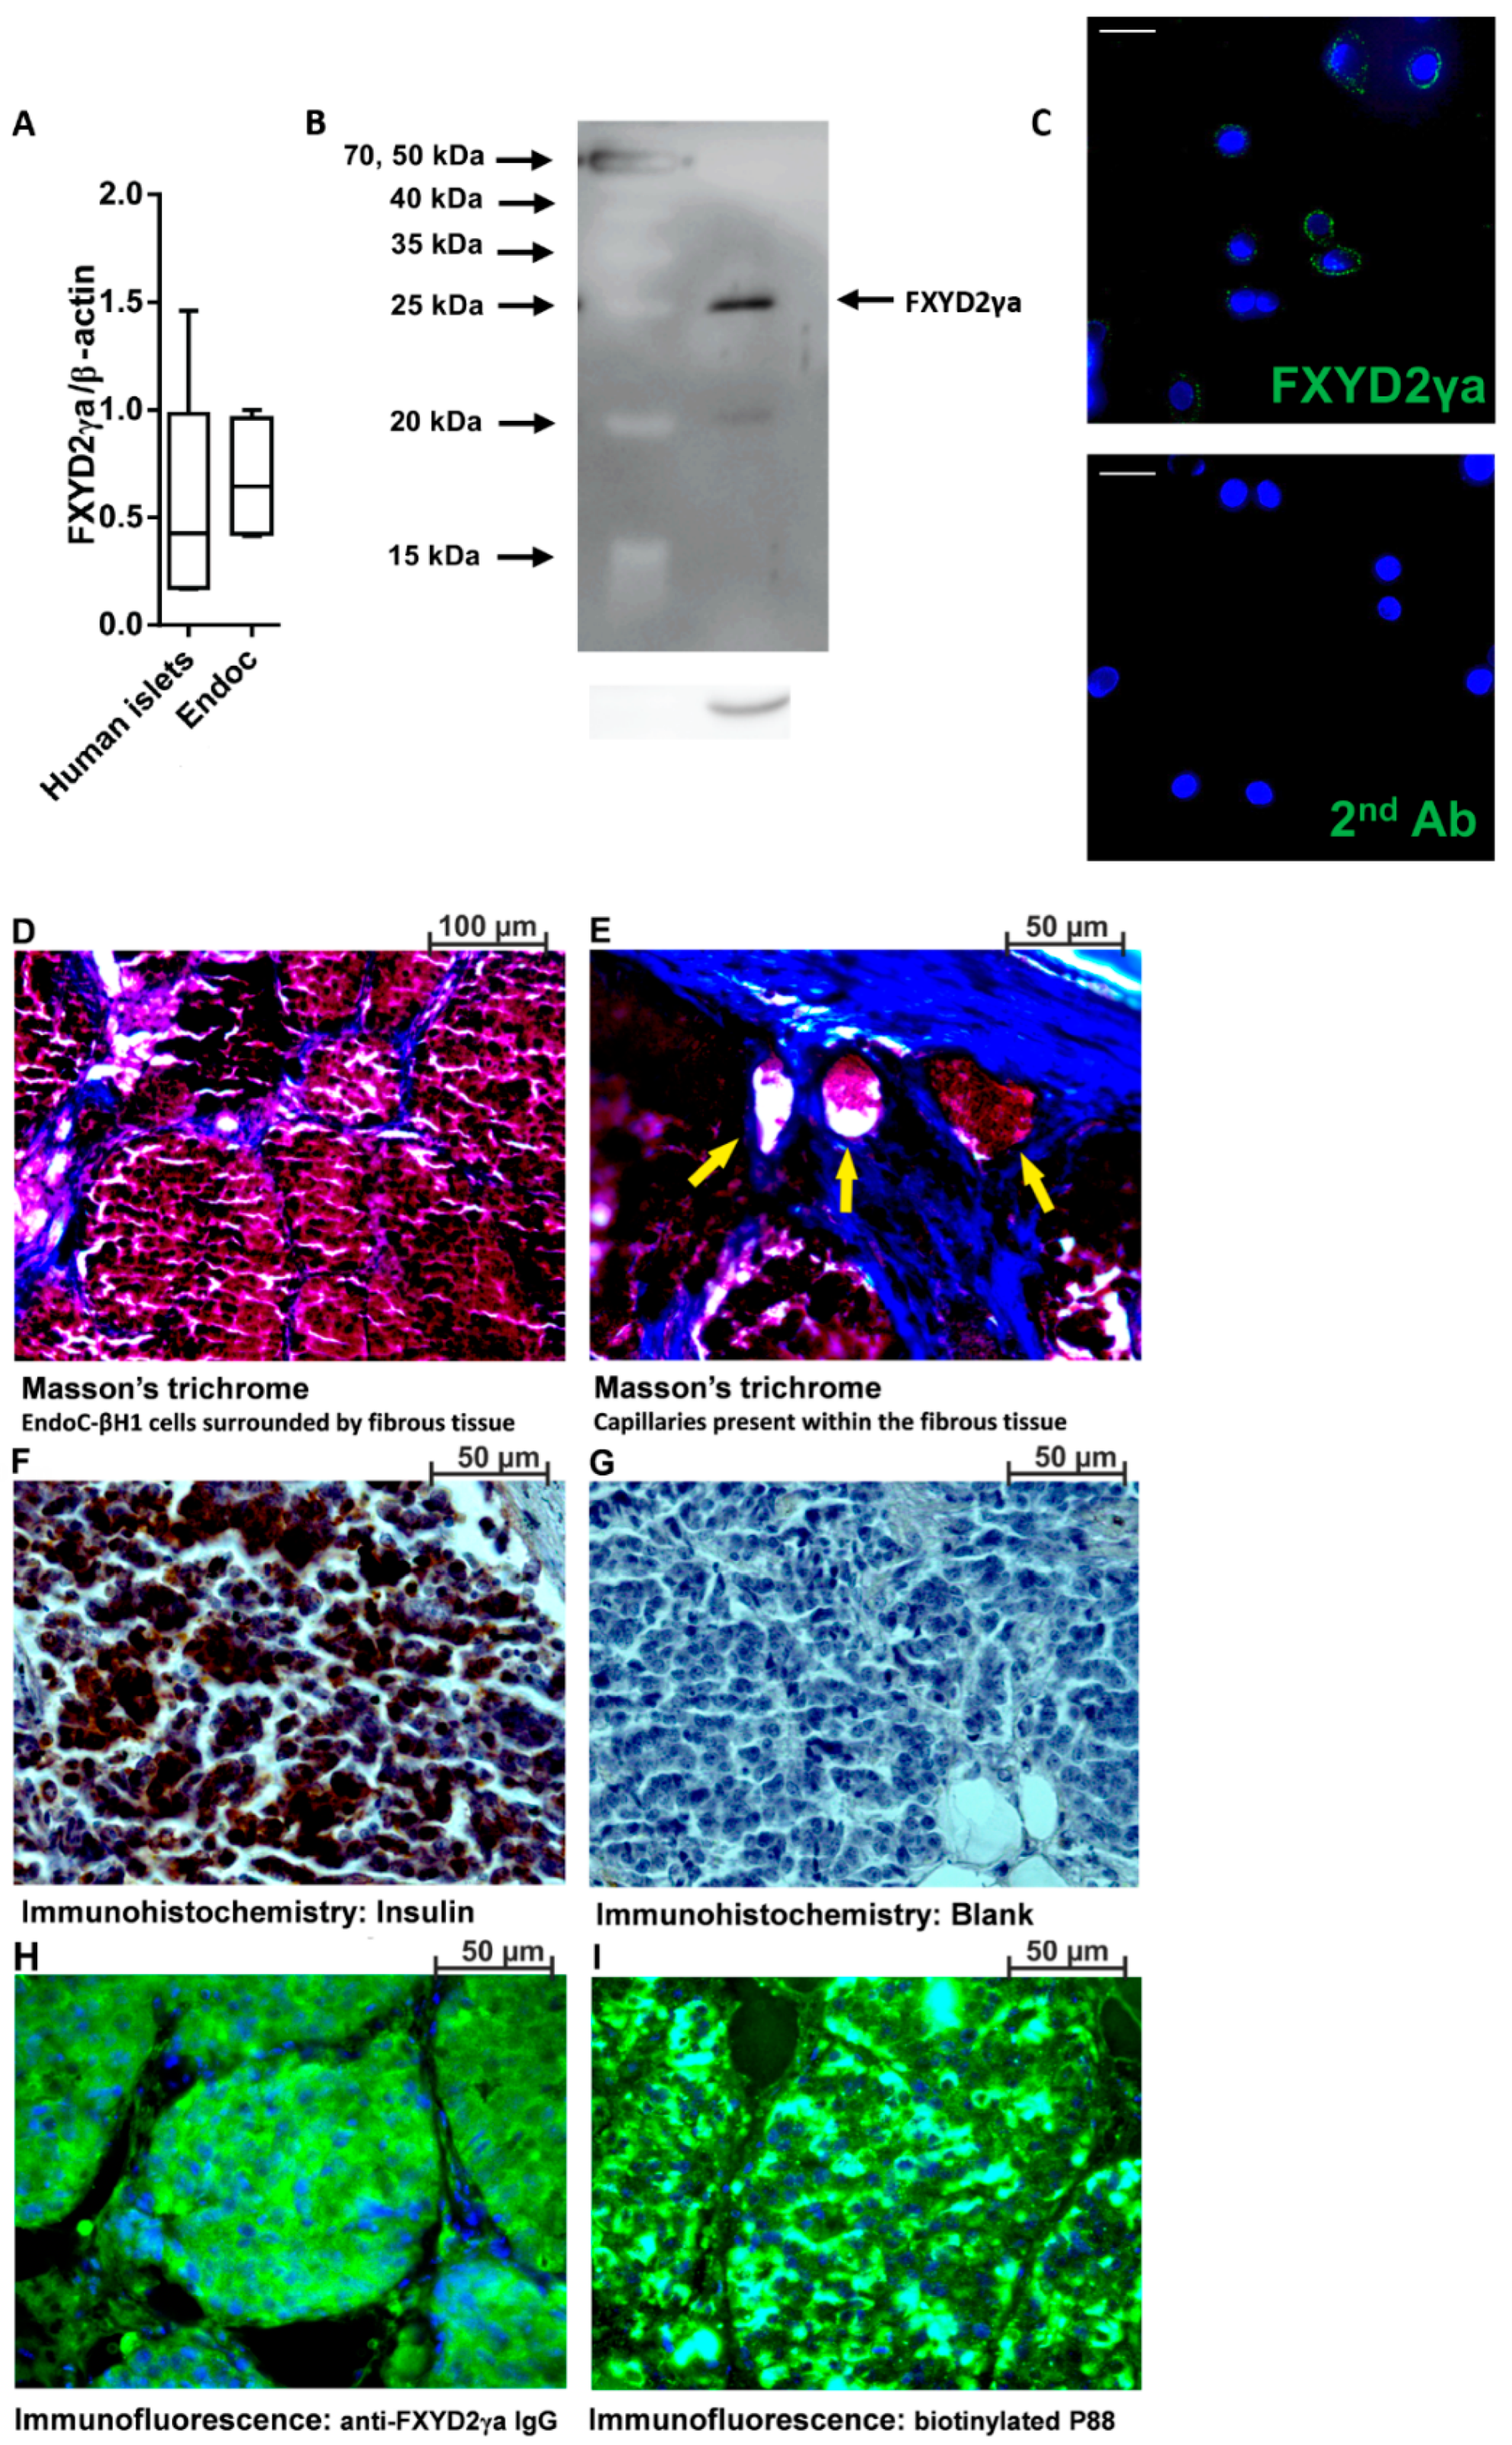
4.3. Immunoblotting and Immunocy to Fluorescence
4.4. Mouse Models Implanted with Human EndoC-βH1 or CHO-FXYD2γa+ Cells
4.5. Validation of Cell Xenografts by Histochemistry, Immunohistochemistry and Immunofluorescence
4.6. Synthesis of Gd-DOTA-P88 and Gd-DOTA-Scramble
4.7. MRI and Ex Vivo Biodistribution of Gd-DOTA-P88 and Gd-DOTA-Scramble
4.8. Synthesis of NOTA-P88 and Radiolabeling
4.9. Competitive Binding Assay
4.10. Statistical Analyses
5. Conclusions
Supplementary Materials
Author Contributions
Funding
Acknowledgments
Conflicts of Interest
References
- Katsarou, A.; Gudbjornsdottir, S.; Rawshani, A.; Dabelea, D.; Bonifacio, E.; Anderson, B.J.; Jacobsen, L.M.; Schatz, D.A.; Lernmark, A. Type 1 diabetes mellitus. Nat. Rev. Dis. Primers 2017, 3, 17016. [Google Scholar] [CrossRef] [PubMed]
- Eizirik, D.L.; Colli, M.L.; Ortis, F. The role of inflammation in insulitis and β-cell loss in type 1 diabetes. Nat. Rev. Endocrinol. 2009, 5, 219–226. [Google Scholar] [CrossRef] [PubMed]
- Patterson, C.; Guariguata, L.; Dahlquist, G.; Soltesz, G.; Ogle, G.; Silink, M. Diabetes in the young—A global view and worldwide estimates of numbers of children with type 1 diabetes. Diabetes Res. Clin. Pract. 2014, 103, 161–175. [Google Scholar] [CrossRef] [PubMed]
- Andralojc, K.; Srinivas, M.; Brom, M.; Joosten, L.; de Vries, I.J.; Eizirik, D.L.; Boerman, O.C.; Meda, P.; Gotthardt, M. Obstacles on the way to the clinical visualisation of beta cells: Looking for the aeneas of molecular imaging to navigate between scylla and charybdis. Diabetologia 2012, 55, 1247–1257. [Google Scholar] [CrossRef] [PubMed]
- Eich, T.; Eriksson, O.; Lundgren, T.; Transplantation, N.N.F.C.I. Visualization of early engraftment in clinical islet transplantation by positron-emission tomography. N. Engl. J. Med. 2007, 356, 2754–2755. [Google Scholar] [CrossRef] [PubMed]
- Ryan, E.A.; Paty, B.W.; Senior, P.A.; Bigam, D.; Alfadhli, E.; Kneteman, N.M.; Lakey, J.R.; Shapiro, A.M. Five-year follow-up after clinical islet transplantation. Diabetes 2005, 54, 2060–2069. [Google Scholar] [CrossRef] [PubMed]
- Leoni, L.; Roman, B.B. MR imaging of pancreatic islets: Tracking isolation, transplantation and function. Curr. Pharm. Des. 2010, 16, 1582–1594. [Google Scholar] [CrossRef] [PubMed]
- Freeby, M.; Ichise, M.; Harris, P.E. Vesicular monoamine transporter, type 2 (VMAT2) expression as it compares to insulin and pancreatic polypeptide in the head, body and tail of the human pancreas. Islets 2012, 4, 393–397. [Google Scholar] [CrossRef] [PubMed]
- Gotthardt, M.; Eizirik, D.L.; Cnop, M.; Brom, M. Beta cell imaging—A key tool in optimized diabetes prevention and treatment. Trends Endocrinol. Metab. TEM 2014, 25, 375–377. [Google Scholar] [CrossRef] [PubMed]
- Wang, Y.; Lim, K.; Normandin, M.; Zhao, X.; Cline, G.W.; Ding, Y.S. Synthesis and evaluation of [18F] exendin (9–39) as a potential biomarker to measure pancreatic β-cell mass. Nucl. Med. Biol. 2012, 39, 167–176. [Google Scholar] [CrossRef] [PubMed]
- Wild, D.; Wicki, A.; Mansi, R.; Behe, M.; Keil, B.; Bernhardt, P.; Christofori, G.; Ell, P.J.; Macke, H.R. Exendin-4-based radiopharmaceuticals for glucagonlike peptide-1 receptor PET/CT and SPECT/CT. J. Nucl. Med. 2010, 51, 1059–1067. [Google Scholar] [CrossRef] [PubMed]
- Flamez, D.; Roland, I.; Berton, A.; Kutlu, B.; Dufrane, D.; Beckers, M.C.; De Waele, E.; Rooman, I.; Bouwens, L.; Clark, A.; et al. A genomic-based approach identifies FXYD domain containing ion transport regulator 2 (FXYD2)gammaa as a pancreatic beta cell-specific biomarker. Diabetologia 2010, 53, 1372–1383. [Google Scholar] [CrossRef] [PubMed]
- Burtea, C.; Laurent, S.; Crombez, D.; Delcambre, S.; Sermeus, C.; Millard, I.; Rorive, S.; Flamez, D.; Beckers, M.C.; Salmon, I.; et al. Development of a peptide-functionalized imaging nanoprobe for the targeting of (FXYD2)gammaa as a highly specific biomarker of pancreatic beta cells. Contrast Media Mol. Imaging 2015, 10, 398–412. [Google Scholar] [CrossRef] [PubMed]
- Burtea, C.; Laurent, S.; Sanli, T.; Fanfone, D.; Devalckeneer, A.; Sauvage, S.; Beckers, M.C.; Rorive, S.; Salmon, I.; Vander Elst, L.; et al. Screening for peptides targeted to IL-7Rα for molecular imaging of rheumatoid arthritis synovium. Arthr. Res. Ther. 2016, 18, 230. [Google Scholar] [CrossRef] [PubMed]
- Wáng, Y.X.J.; Idée, J.-M. A comprehensive literatures update of clinical researches of superparamagnetic resonance iron oxide nanoparticles for magnetic resonance imaging. Quant. Imaging Med. Surg. 2017, 7, 88–122. [Google Scholar] [CrossRef] [PubMed]
- Aime, S.; Caravan, P. Biodistribution of gadolinium-based contrast agents, including gadolinium deposition. J. Magn. Reson. Imaging 2009, 30, 1259–1267. [Google Scholar] [CrossRef] [PubMed]
- Kartamihardja, A.A.; Nakajima, T.; Kameo, S.; Koyama, H.; Tsushima, Y. Impact of impaired renal function on gadolinium retention after administration of gadolinium-based contrast agents in a mouse model. Investig. Radiol. 2016, 51, 655–660. [Google Scholar] [CrossRef] [PubMed]
- Deray, G.; Rouviere, O.; Bacigalupo, L.; Maes, B.; Hannedouche, T.; Vrtovsnik, F.; Rigothier, C.; Billiouw, J.M.; Campioni, P.; Ferreiros, J.; et al. Safety of meglumine gadoterate (Gd-DOTA)-enhanced mri compared to unenhanced MRI in patients with chronic kidney disease (RESCUE study). Eur. Radiol. 2013, 23, 1250–1259. [Google Scholar] [CrossRef] [PubMed]
- Christoffersson, G.; Henriksnas, J.; Johansson, L.; Rolny, C.; Ahlstrom, H.; Caballero-Corbalan, J.; Segersvard, R.; Permert, J.; Korsgren, O.; Carlsson, P.O.; et al. Clinical and experimental pancreatic islet transplantation to striated muscle: Establishment of a vascular system similar to that in native islets. Diabetes 2010, 59, 2569–2578. [Google Scholar] [CrossRef] [PubMed]
- Ionescu-Tirgoviste, C.; Gagniuc, P.A.; Gubceac, E.; Mardare, L.; Popescu, I.; Dima, S.; Militaru, M. A 3d map of the islet routes throughout the healthy human pancreas. Sci. Rep. 2015, 5, 14634. [Google Scholar] [CrossRef] [PubMed]
- Burtea, C.; Laurent, S.; Vander Elst, L.; Muller, R.N. Contrast agents: Magnetic resonance. Handb. Exp. Pharmacol. 2008, 185, 135–165. [Google Scholar]
- Jacques, V.; Dumas, S.; Sun, W.C.; Troughton, J.S.; Greenfield, M.T.; Caravan, P. High-relaxivity magnetic resonance imaging contrast agents. Part 2. Optimization of inner- and second-sphere relaxivity. Investig. Radiol. 2010, 45, 613–624. [Google Scholar] [CrossRef] [PubMed]
- Marchetti, P.; Suleiman, M.; Marselli, L. Organ donor pancreases for the study of human islet cell histology and pathophysiology: A precious and valuable resource. Diabetologia 2018, 61, 770–774. [Google Scholar] [CrossRef] [PubMed]
- Del Guerra, S.; Lupi, R.; Marselli, L.; Masini, M.; Bugliani, M.; Sbrana, S.; Torri, S.; Pollera, M.; Boggi, U.; Mosca, F.; et al. Functional and molecular defects of pancreatic islets in human type 2 diabetes. Diabetes 2005, 54, 727–735. [Google Scholar] [CrossRef] [PubMed]
- Ravassard, P.; Hazhouz, Y.; Pechberty, S.; Bricout-Neveu, E.; Armanet, M.; Czernichow, P.; Scharfmann, R. A genetically engineered human pancreatic beta cell line exhibiting glucose-inducible insulin secretion. J. Clin. Investig. 2011, 121, 3589–3597. [Google Scholar] [CrossRef] [PubMed]
- Brozzi, F.; Gerlo, S.; Grieco, F.A.; Nardelli, T.R.; Lievens, S.; Gysemans, C.; Marselli, L.; Marchetti, P.; Mathieu, C.; Tavernier, J.; et al. A combined “Omics” Approach identifies N-Myc interactor as a novel cytokine-induced regulator of IRE1α protein and c-Jun N-terminal kinase in pancreatic beta cells. J. Biol. Chem. 2014, 289, 20677–20693. [Google Scholar] [CrossRef] [PubMed]
- Livak, K.J.; Schmittgen, T.D. Analysis of relative gene expression data using real-time quantitative PCR and the 2−ΔΔCT method. Methods 2001, 25, 402–408. [Google Scholar] [CrossRef] [PubMed]
- Capito, C.; Simon, M.T.; Aiello, V.; Clark, A.; Aigrain, Y.; Ravassard, P.; Scharfmann, R. Mouse muscle as an ectopic permissive site for human pancreatic development. Diabetes 2013, 62, 3479–3487. [Google Scholar] [CrossRef] [PubMed]
- Rohwer, H.; Collier, N.; Hosten, E. Spectrophotometric study of arsenazo III and its interactions with lanthanides. Anal. Chim. Acta 1995, 314, 219–223. [Google Scholar] [CrossRef]
- Burtea, C.; Laurent, S.; Colet, J.M.; Vander Elst, L.; Muller, R.N. Development of new glucosylated derivatives of gadolinium diethylenetriaminepentaacetic for magnetic resonance angiography. Investig. Radiol. 2003, 38, 320–333. [Google Scholar] [CrossRef]
Sample Availability: Samples of the different compounds used in this study are available from the authors. |


© 2018 by the authors. Licensee MDPI, Basel, Switzerland. This article is an open access article distributed under the terms and conditions of the Creative Commons Attribution (CC BY) license (http://creativecommons.org/licenses/by/4.0/).
Share and Cite
Demine, S.; Balhuizen, A.; Debaille, V.; Joosten, L.; Fereau, M.; Chilla, S.N.M.; Millard, I.; Scharfmann, R.; Egrise, D.; Goldman, S.; et al. Imaging of Human Insulin Secreting Cells with Gd-DOTA-P88, a Paramagnetic Contrast Agent Targeting the Beta Cell Biomarker FXYD2γa. Molecules 2018, 23, 2100. https://doi.org/10.3390/molecules23092100
Demine S, Balhuizen A, Debaille V, Joosten L, Fereau M, Chilla SNM, Millard I, Scharfmann R, Egrise D, Goldman S, et al. Imaging of Human Insulin Secreting Cells with Gd-DOTA-P88, a Paramagnetic Contrast Agent Targeting the Beta Cell Biomarker FXYD2γa. Molecules. 2018; 23(9):2100. https://doi.org/10.3390/molecules23092100
Chicago/Turabian StyleDemine, Stéphane, Alexander Balhuizen, Vinciane Debaille, Lieke Joosten, Maïté Fereau, Satya Narayana Murthy Chilla, Isabelle Millard, Raphaël Scharfmann, Dominique Egrise, Serge Goldman, and et al. 2018. "Imaging of Human Insulin Secreting Cells with Gd-DOTA-P88, a Paramagnetic Contrast Agent Targeting the Beta Cell Biomarker FXYD2γa" Molecules 23, no. 9: 2100. https://doi.org/10.3390/molecules23092100
APA StyleDemine, S., Balhuizen, A., Debaille, V., Joosten, L., Fereau, M., Chilla, S. N. M., Millard, I., Scharfmann, R., Egrise, D., Goldman, S., Marchetti, P., Gotthardt, M., Laurent, S., Burtea, C., & Eizirik, D. L. (2018). Imaging of Human Insulin Secreting Cells with Gd-DOTA-P88, a Paramagnetic Contrast Agent Targeting the Beta Cell Biomarker FXYD2γa. Molecules, 23(9), 2100. https://doi.org/10.3390/molecules23092100