Synthesis of 2,6-Diamino-Substituted Purine Derivatives and Evaluation of Cell Cycle Arrest in Breast and Colorectal Cancer Cells

 ,
, 
 ,
, 
Abstract
1. Introduction
2. Results and Discussion
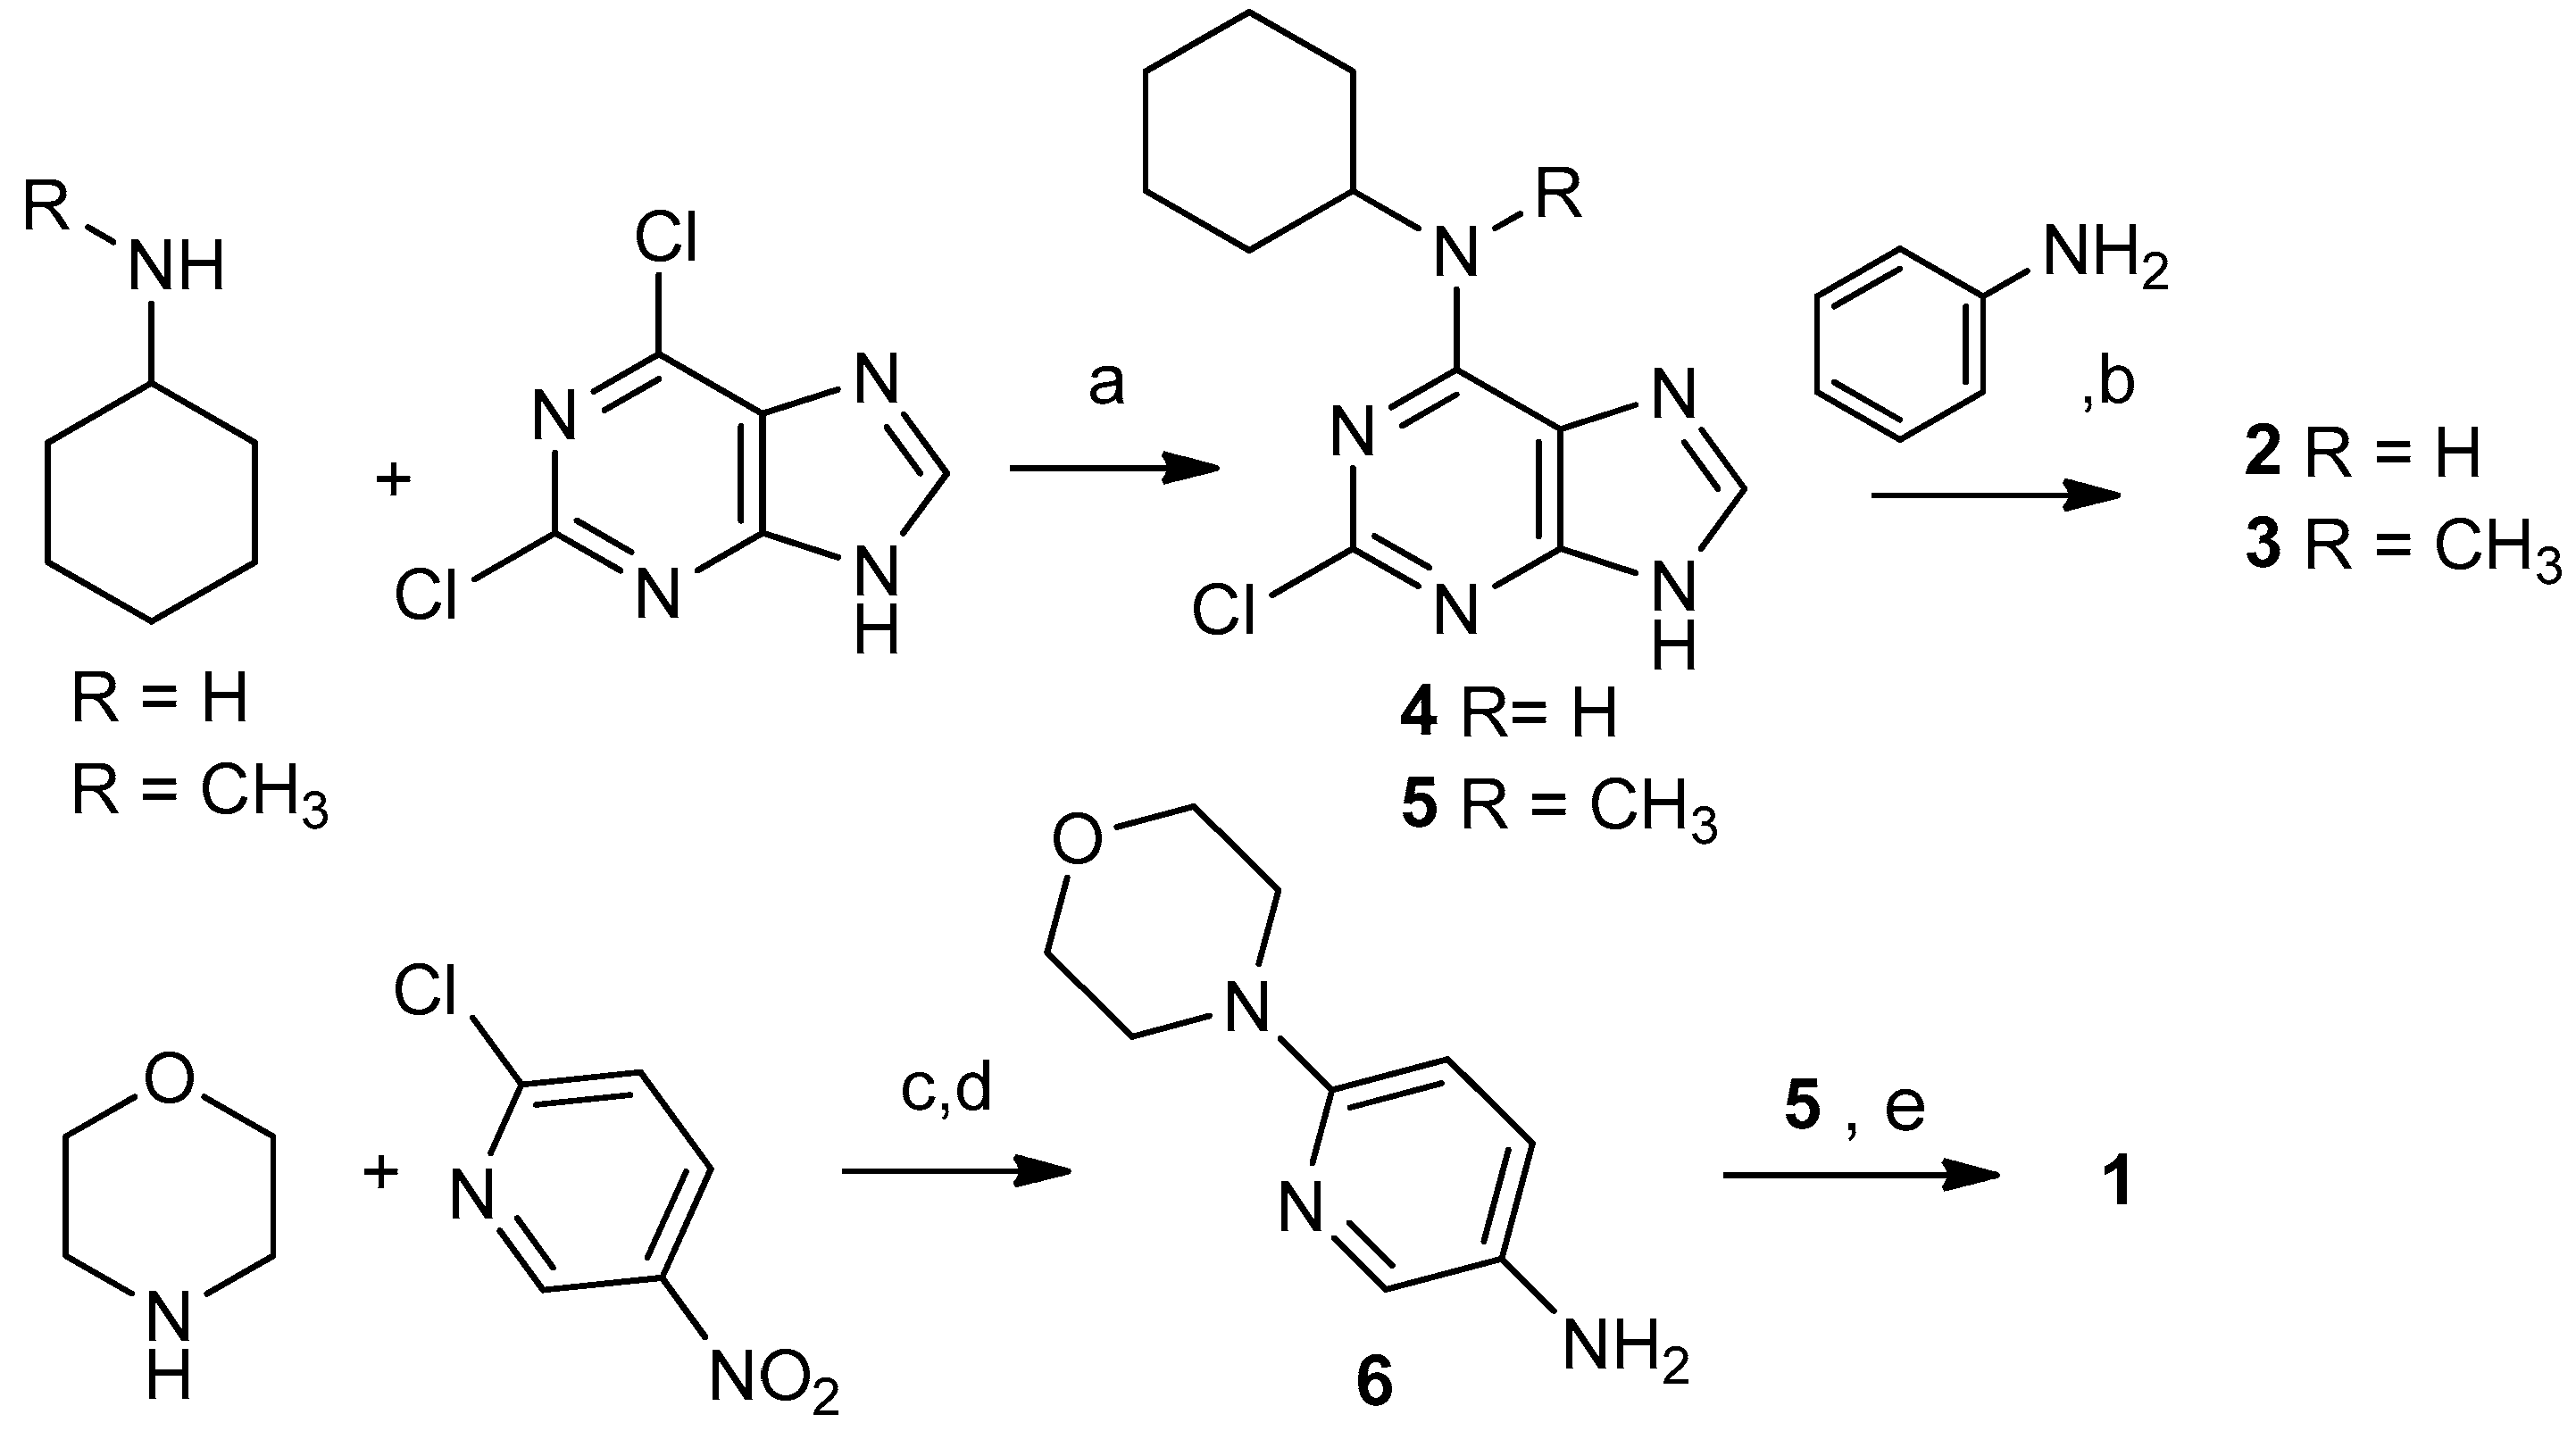
2.1. Selection and Synthesis of Compounds 1–3
2.2. Study on the Tautomeric Forms of Product 3
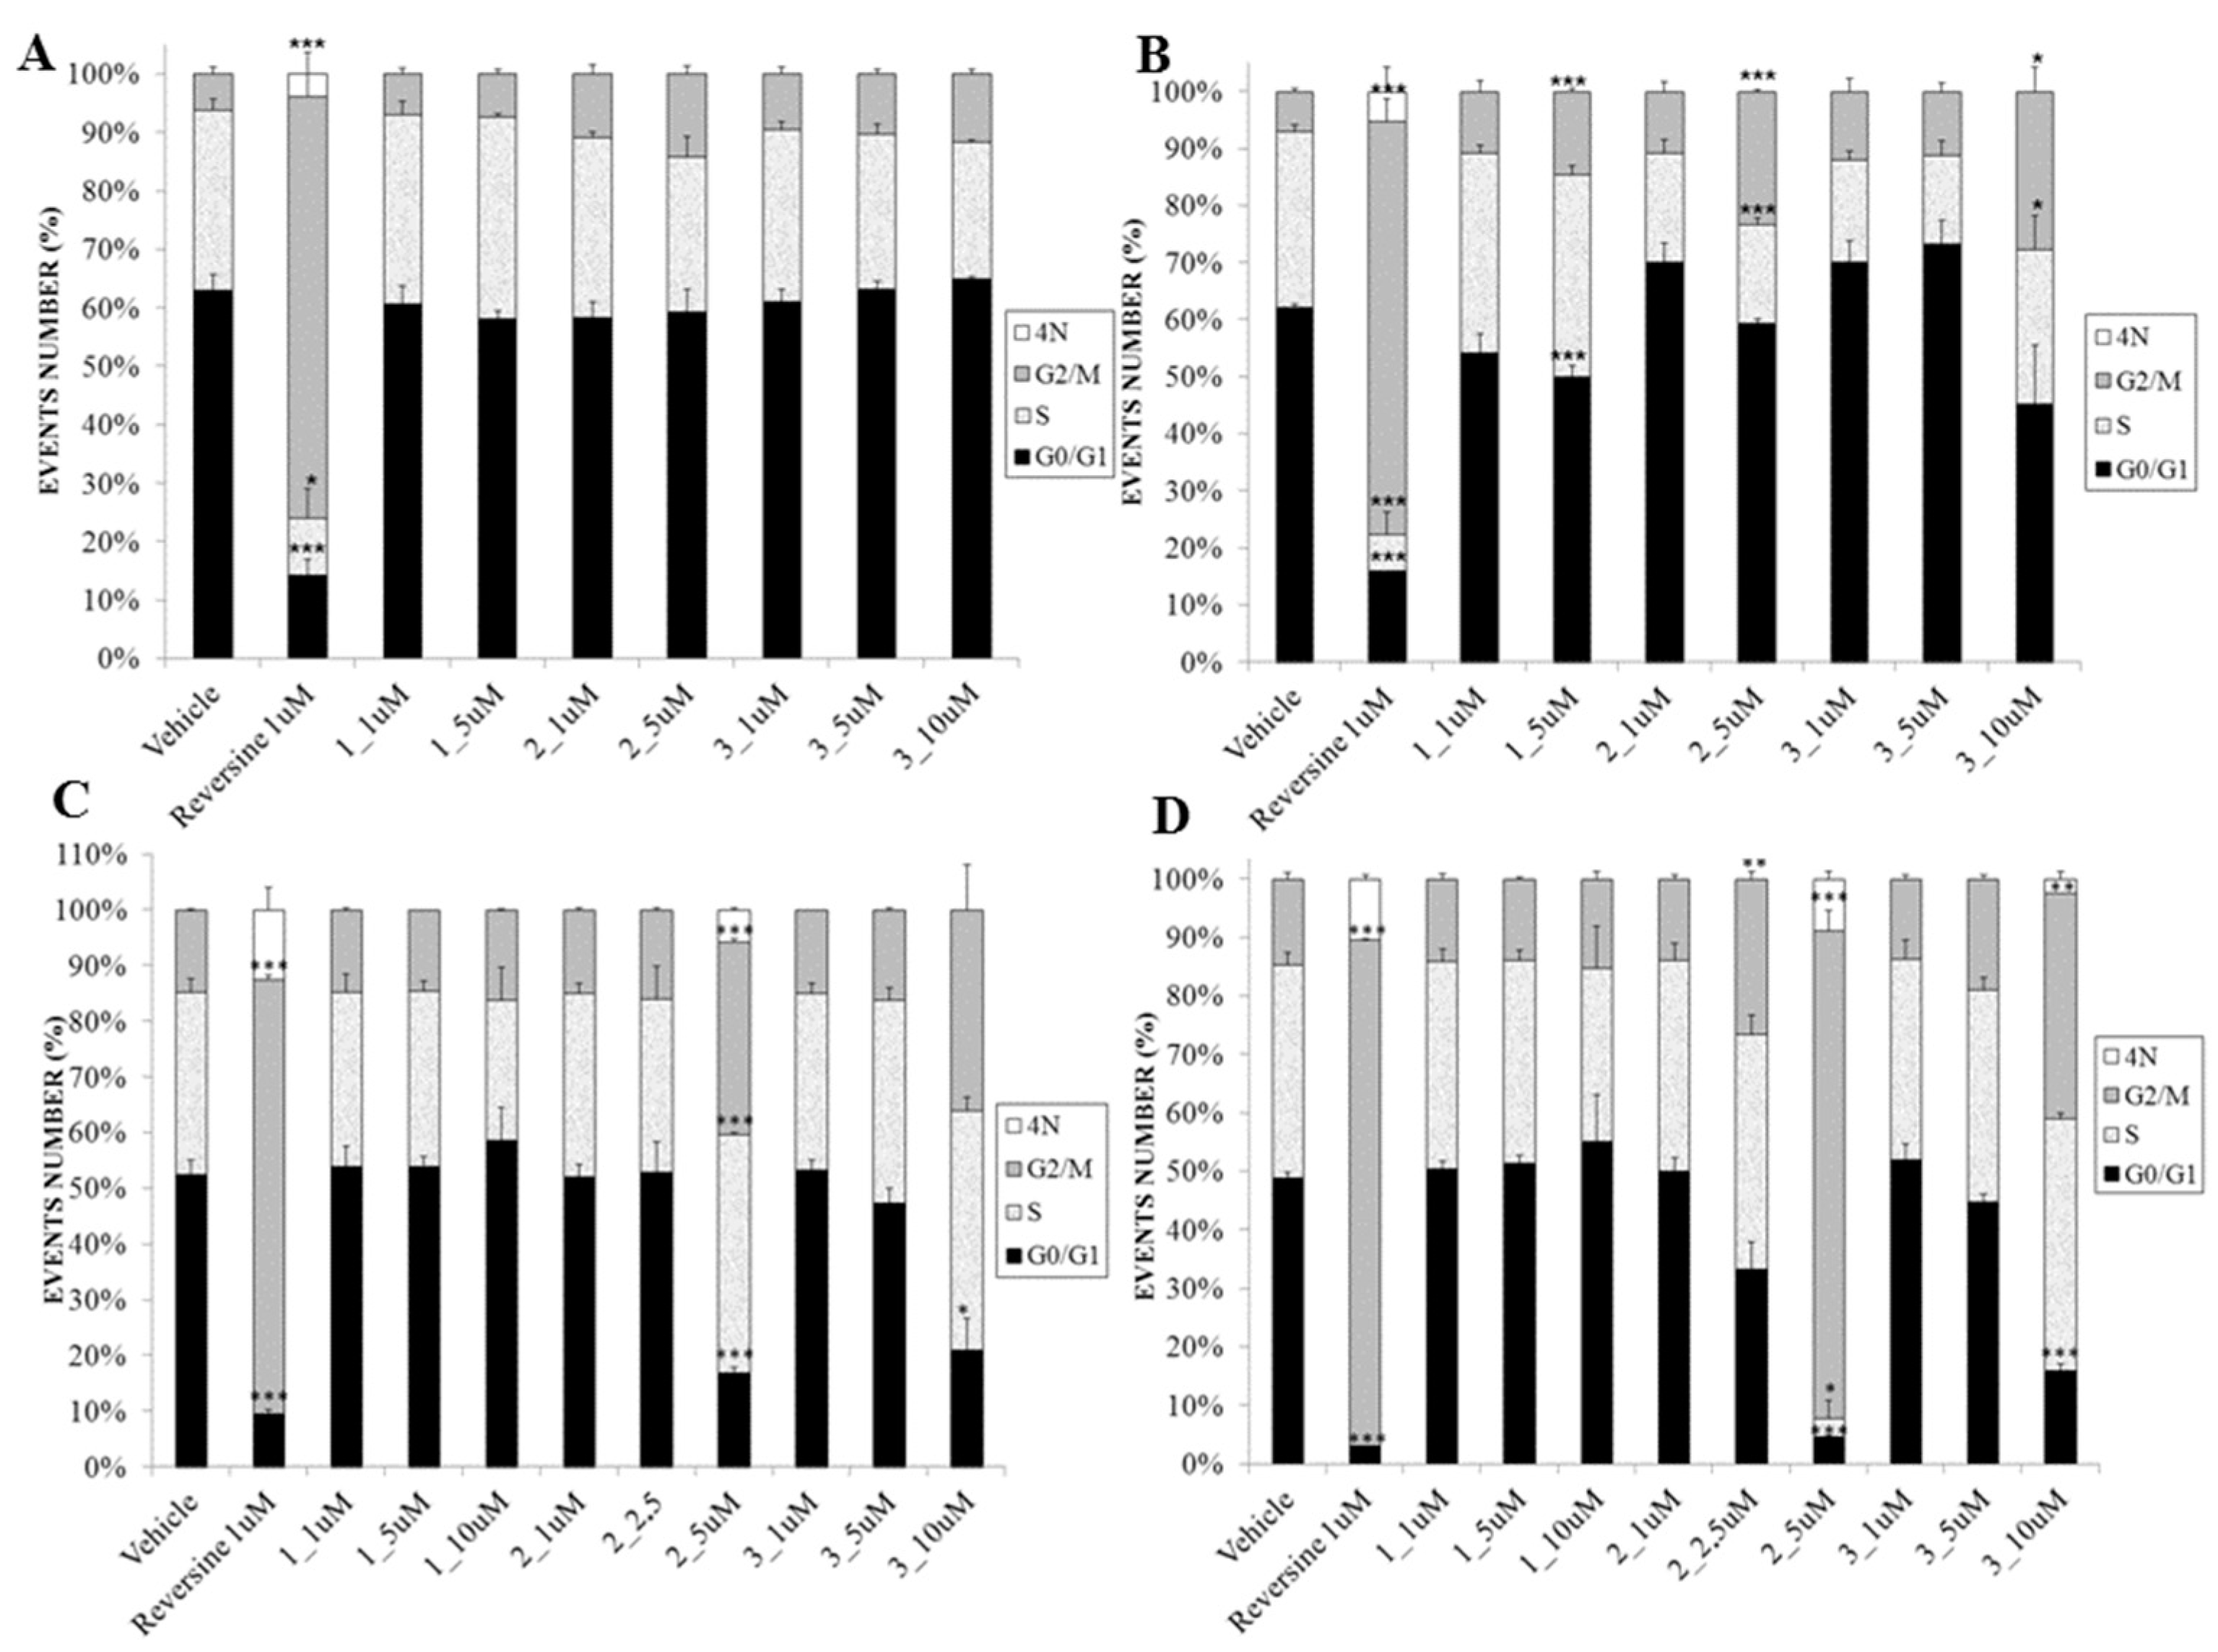
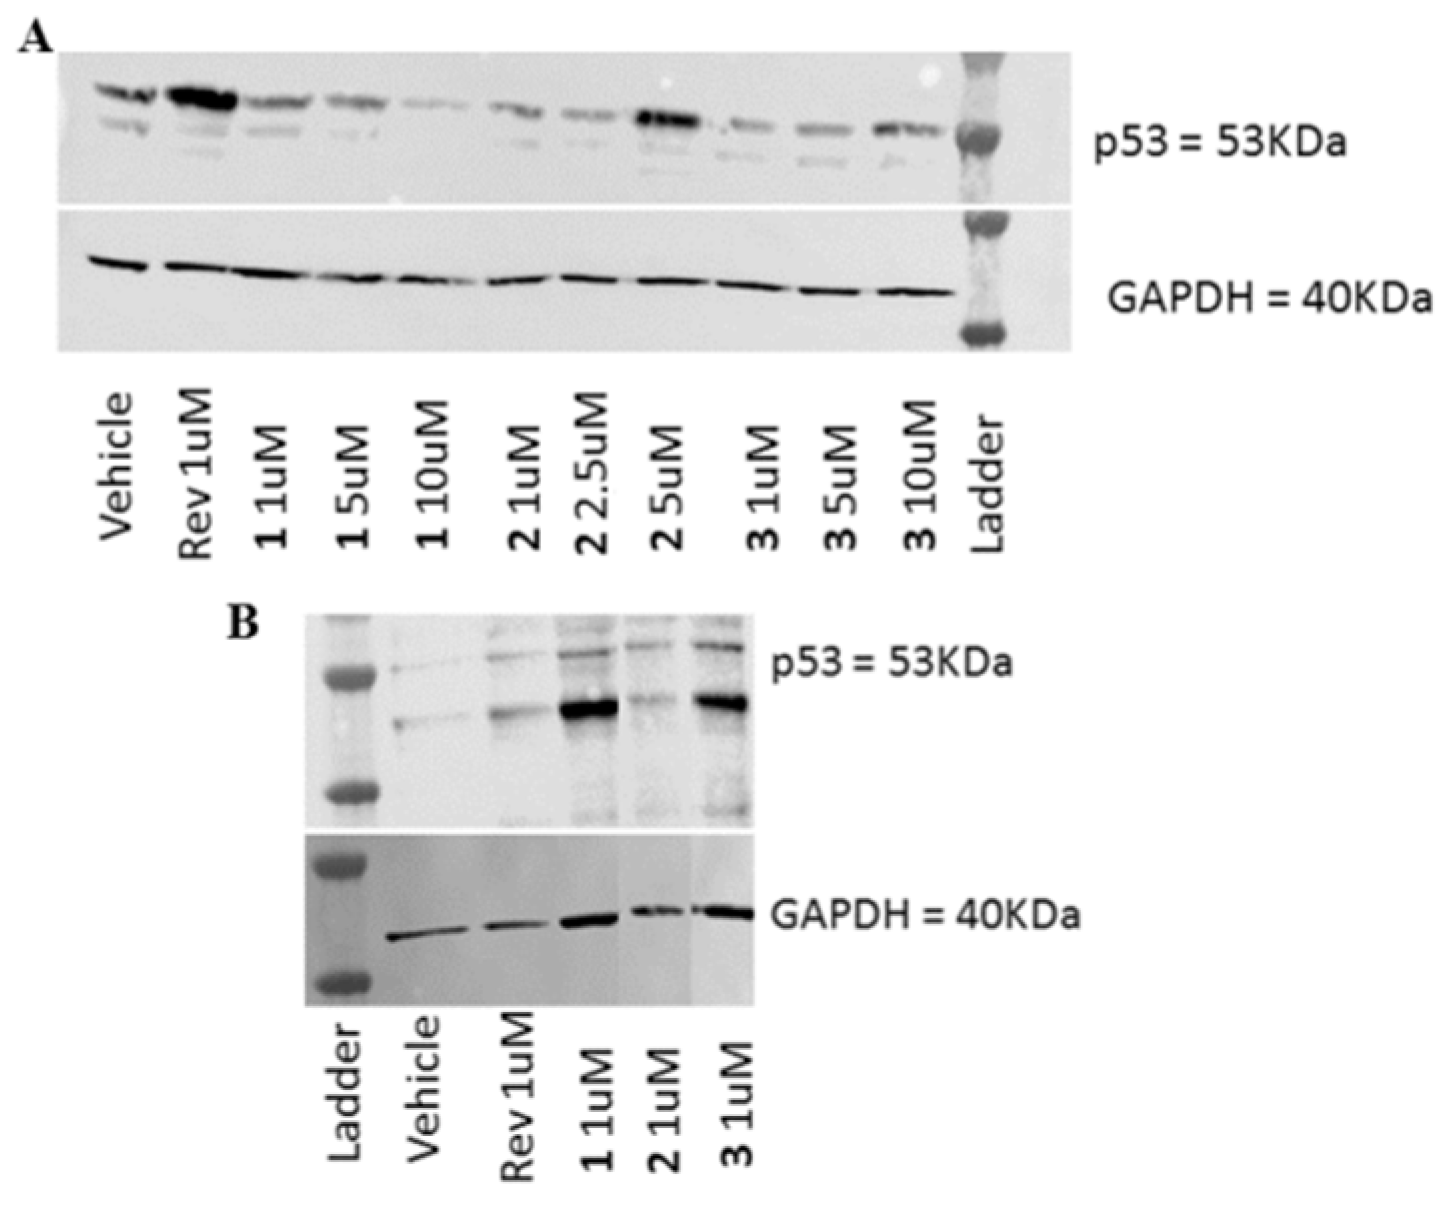
2.3. Biological Evaluation
3. Materials and Methods
3.1. Chemistry
3.1.1. General
3.1.2. Typical Reaction Procedure for Precursors 4 and 5
3.1.3. Synthesis of 6-Morpholinopyridin-3-amine (6)
3.1.4. Synthesis of N6-Cyclohexyl-N6-methyl-N2-(6-morpholinopyridin-3-yl)-7H-purine-2,6-diamine (1)
3.1.5. Typical Reaction Procedure for Products 2 and 3
3.2. Computational Analysis
3.3. Biological Evaluation
3.3.1. General
3.3.2. Cell Culture
3.3.3. Cell Viability Assay (MTT Assay)
3.3.4. Cell Cycle Assay
3.3.5. Membrane and Nuclei Staining
3.3.6. Western Blot
3.3.7. Statistical Analysis
4. Conclusions
Supplementary Materials
Author Contributions
Funding
Acknowledgments
Conflicts of Interest
References
- Anastasia, L.; Pelissero, G.; Venerando, B.; Tettamanti, G. Cell reprogramming: Expectations and challenges for chemistry in stem cell biology and regenerative medicine. Cell Death Differ. 2010, 17, 1230–1237. [Google Scholar] [CrossRef] [PubMed]
- Chen, S.; Zang, Q.; Wu, X.; Schultz, P.G.; Ding, S. Dedifferentiation of lineage committed cells by a small molecule. J. Am. Chem. Soc. 2004, 126, 410–411. [Google Scholar] [CrossRef] [PubMed]
- Anastasia, L.; Sampaolesi, M.; Papini, N.; Oleari, D.; Lamorte, G.; Tringali, C.; Monti, E.; Galli, D.; Tettamanti, G.; Cossu, G.; et al. Reversine-treated fibroblasts acquire myogenic competence in vitro and in regenerating skeletal muscle. Cell Death Differ. 2006, 13, 2042–2051. [Google Scholar] [CrossRef] [PubMed]
- Lee, E.K.; Bae, G.U.; You, J.S.; Lee, J.C.; Jeon, Y.J.; Park, J.W.; Park, J.H.; Ahn, S.H.; Kim, Y.K.; Choi, W.S.; et al. Reversine increases the plasticity of lineage-committed cells toward neuroectodermal lineage. J. Biol. Chem. 2009, 284, 2891–2901. [Google Scholar] [CrossRef] [PubMed]
- Pikir, B.S.; Susilowati, H.; Hendrianto, E.; Abdulrantam, F. Reversine increase the plasticity of bone marrow-derived mesenchymal stem cell for generation of cardiomyocyte in vitro. Acta Med. Indones. 2012, 44, 23–27. [Google Scholar] [PubMed]
- Marumoto, T.; Zhang, D.; Saya, H. Aurora-A—A guardian of poles. Nat. Rev. Cancer 2005, 5, 42–50. [Google Scholar] [CrossRef] [PubMed]
- Hauf, S.; Cole, R.; LaTerra, S.; Zimmer, C.; Schnapp, G.; Walter, R.; Heckel, A.; van Meel, J.; Rieder, C.L.; Peters, J.M. The small molecule Hesperadin reveals a role for Aurora B in correcting kinetochore–microtubule attachment and in maintaining the spindle assembly checkpoint. J. Cell Biol. 2003, 161, 281–294. [Google Scholar] [CrossRef] [PubMed]
- London, N.; Biggins, S. Signalling dynamics in the spindle checkpoint response. Nat. Rev. Mol. Cell Biol. 2014, 15, 736–748. [Google Scholar] [CrossRef] [PubMed]
- Hiruma, Y.; Koch, A.; Dharadhar, S.; Joosten, R.P.; Perrakis, A. Structural basis of reversine selectivity in inhibiting Mps1 more potently than Aurora B kinase. Proteins Struct. Funct. Bioinf. 2016, 84, 1761–1766. [Google Scholar] [CrossRef] [PubMed]
- Piccoli, M.; Palazzolo, G.; Conforti, E.; La-morte, G.; Papini, N.; Creo, P.; Fania, C.; Scaringi, R.; Bergante, S.; Tringali, C.; et al. The synthetic purine reversine selectively induces cell death of cancer cells. J. Cell. Biochem. 2012, 113, 3207–3217. [Google Scholar] [CrossRef] [PubMed]
- Jemaà, M.; Galluzzi, L.; Kepp, O.; Boilève, A.; Lissa, D.; Senovilla, L.; Harper, F.; Pierron, G.; Berardinelli, F.; Antoccia, A.; et al. Preferential killing of p53-deficient cancer cells by reversine. Cell Cycle 2012, 11, 2149–2158. [Google Scholar] [CrossRef] [PubMed]
- D’Alise, A.M.; Amabile, G.; Iovino, M.; Di Giorgio, F.P.; Bartiromo, M.; Sessa, F.; Villa, F.; Musacchio, A.; Cortese, R. Reversine, a novel Aurora kinases inhibitor, inhibits colony formation of human acute myeloid leukemia cells. Mol. Cancer Ther. 2008, 7, 1140–1149. [Google Scholar] [CrossRef] [PubMed]
- Hsieh, T.C.; Traganos, F.; Darzynkiewicz, Z.; Wu, J.M. The 2,6-disubstituted purine reversine induces growth arrest and polyploidy in human cancer cells. Int. J. Oncol. 2007, 31, 1293–1300. [Google Scholar] [CrossRef] [PubMed]
- Santaguida, S.; Tighe, A.; D’Alise, A.M.; Taylor, S.S.; Musacchio, A. Dissecting the role of MPS1 in chromosome biorientation and the spindle checkpoint through the small molecule inhibitor reversine. J. Cell Biol. 2010, 190, 73–87. [Google Scholar] [CrossRef] [PubMed]
- Kuo, C.H.; Lu, Y.C.; Tseng, Y.S.; Shi, C.S.; Chen, S.H.; Chen, P.T.; Wu, F.L.; Chang, Y.P.; Lee, Y.R. Reversine induces cell cycle arrest, polyploidy, and apoptosis in human breast cancer cells. Breast Cancer 2012, 21, 358–369. [Google Scholar] [CrossRef] [PubMed]
- Hua, S.C.; Chang, T.C.; Chen, H.R.; Lu, C.H.; Liu, Y.W.; Chen, S.H.; Yu, H.I.; Chang, Y.P.; Lee, Y.R. Reversine, a 2,6-disubstituted purine, as an anti-cancer agent in differentiated and undifferentiated thyroid cancer cells. Pharm. Res. 2012, 29, 1990–2005. [Google Scholar] [CrossRef] [PubMed]
- Lu, C.H.; Liu, Y.W.; Hua, S.C.; Yu, H.I.; Chang, Y.P.; Lee, Y.R. Autophagy induction of reversine on human follicular thyroid cancer cells. Biomed. Pharmacother. 2012, 66, 642–647. [Google Scholar] [CrossRef] [PubMed]
- Fang, C.Y.; Chen, J.S.; Chang, S.K.; Shen, C.H. Reversine induces autophagic cell death through the AMP-activated protein kinase pathway in urothelial carcinoma cells. Anti-Cancer Drugs 2018, 29, 29–39. [Google Scholar] [CrossRef] [PubMed]
- Gasco, M.; Shami, S.; Cook, T. The p53 pathway in breast cancer. Breast Cancer Res. 2002, 4, 70–76. [Google Scholar] [CrossRef] [PubMed]
- Kumar, D.V.; Hoarau, C.; Bursavich, M.; Slattum, P.; Gerrish, D.; Yager, K.; Saunders, M.; Shenderovich, B.L.; Roth, R.; McKinnon, A.; et al. Lead optimization of purine based orally bioavailable Mps1 (TTK) inhibitors. Bioorg. Med. Chem. Lett. 2012, 22, 4377–4385. [Google Scholar] [CrossRef] [PubMed]
- Perreira, M.; Jiang, J.K.; Klutz, A.M.; Gao, Z.G.; Shainberg, A.; Lu, C.; Craig, J.T.; Jacobson, K.A. Reversine and its 2-substituted adenine derivatives as potent and selective adenosine receptor antagonists. J. Med. Chem. 2005, 48, 4910–4918. [Google Scholar] [CrossRef] [PubMed]
- Raczynska, E.D.; Kaminska, B. Prototropy and p-electron delocalization for purine and its radical ions–DFT studies. J. Phys. Org. Chem. 2010, 23, 828–835. [Google Scholar] [CrossRef]
- Raczyńska, E.D.; Kamińska, B. Variations of the tautomeric preferences and π-electron delocalization for the neutral and redox forms of purine when proceeding from the gas phase (DFT) to water (PCM). J. Mol. Model. 2013, 19, 3947–3960. [Google Scholar] [CrossRef] [PubMed]
- Brummelkamp, T.R.; Bernards, R.; Agami, R. A system for stable expression of short interfering RNAS in mammalian cells. Science 2002, 296, 550–553. [Google Scholar] [CrossRef] [PubMed]
- Sur, S.; Pagliarini, R.; Bunz, F.; Rago, C.; Diaz, L.A.; Kinzler, K.W.; Vogelstein, B.; Papadopoulos, N. A Panel of isogenic human cancer cells suggests a therapeutic approach for cancers with inactivated p53. Proc. Natl. Acad. Sci. USA 2009, 106, 3964–3969. [Google Scholar] [CrossRef] [PubMed]
- Zaccara, S.; Tebaldi, T.; Pederiva, C.; Ciribilli, Y.; Bisio, A.; Inga, A. p53-Directed translational control can shape and expand the universe of p53 target genes. Cell Death Differ. 2014, 21, 1522–1534. [Google Scholar] [CrossRef] [PubMed]
- Sato, K.; Ohta, T.; Venkitaraman, A.R. A mitotic role for the DNA damage responsive CHK2 kinase. Nat. Cell Biol. 2010, 12, 424–425. [Google Scholar] [CrossRef] [PubMed]
- Lukin, D.J.; Carvajal, L.A.; Liu, W.; Silverman, L.R.; Manfredi, J.J. p53 Promotes cell survival due to the reversibility of its cell cycle checkpoints. Mol. Cancer Res. 2015, 13, 16–28. [Google Scholar] [CrossRef] [PubMed]
- Frisch, M.J.; Trucks, G.W.; Schlegel, H.B.; Scuseria, G.E.; Robb, M.A.; Cheeseman, J.R.; Montgomery, J.A.; Vreven, T., Jr.; Kudin, K.N.; Burant, J.C.; et al. Gaussian; Revision E.01; Gaussian, Inc.: Wallingford, CT, USA, 2004. [Google Scholar]
- Becke, A.D. Density-functional thermochemistry. III. The role of exact exchange. J. Chem. Phys. 1993, 98, 5648–5652. [Google Scholar] [CrossRef]
- Lee, C.; Yang, W.; Parr, R.G. Development of the Colle-Salvetti correlation-energy formula into a functional of the electron density. Phys. Rev. B 1988, 37, 785–789. [Google Scholar] [CrossRef]
- Trott, O.; Olson, A.J. AutoDock Vina: Improving the speed and accuracy of docking with a new scoring function, efficient optimization, and multithreading. J. Comp. Chem. 2010, 31, 455–461. [Google Scholar] [CrossRef] [PubMed]
- Filippakopoulos, P.; Soundararajan, M.; Keates, T.; Elkins, J.M.; King, O.; Fedorov, O.; Picaud, S.S.; Pike, A.C.W.; Yue, W.; Chaikuad, A.; et al. Small-molecule kinase inhibitors provide insight into Mps1 cell cycle function. Nat. Chem. Biol. 2010, 6, 359–368. [Google Scholar] [CrossRef]
- Laskowski, R.A.; Swindells, M.B. LigPlot+: Multiple ligand–protein interaction diagrams for drug discovery. J. Chem. Inf. Model. 2011, 51, 2778–2786. [Google Scholar] [CrossRef] [PubMed]
Sample Availability: Samples of the compounds 1, 2 and 3 are available from the authors. |


| Entry | Minimized Structure | Condition | ΔE (kJ/mol) |
|---|---|---|---|
| 1 |  | gas phase | -- |
| CHCl3 | -- | ||
| water | 17.58954 | ||
| 2 |  | gas phase | 6.33039 |
| CHCl3 | 6.24671 | ||
| water | 4.35136 | ||
| 3 |  | gas phase | 1.56063 |
| CHCl3 | 1.86188 | ||
| water | -- | ||
| 4 |  | gas phase | 3.46017 |
| CHCl3 | 3.11708 | ||
| water | 1.058552 | ||
| 5 |  | gas phase | 4.92875 |
| CHCl3 | 21.17926 | ||
| water | 18.43052 | ||
| 6 |  | gas phase | 6.7195 |
| CHCl3 | 29.88213 | ||
| water | 21.50576 | ||
| 7 |  | gas phase | 35.5933 |
| CHCl3 | 22.57268 | ||
| water | 13.31767 | ||
| 8 |  | gas phase | 2.87441 |
| CHCl3 | 26.39267 | ||
| water | 17.58954 |
| Compound | MCF-7 Vector | MCF-7 shp53 | HCT116 p53+/+ | HCT116 p53−/− |
|---|---|---|---|---|
| Reversine | 9.5 | 11.0 | 16.7 | 7.5 |
| 1 | 99.5 | 111.2 | 117.2 | 157.9 |
| 2 | 35.3 | 39.7 | 40.4 | 38.1 |
| 3 | 35.7 | 36.5 | 73.2 | 67.6 |
© 2018 by the authors. Licensee MDPI, Basel, Switzerland. This article is an open access article distributed under the terms and conditions of the Creative Commons Attribution (CC BY) license (http://creativecommons.org/licenses/by/4.0/).
Share and Cite
Bosco, B.; Defant, A.; Messina, A.; Incitti, T.; Sighel, D.; Bozza, A.; Ciribilli, Y.; Inga, A.; Casarosa, S.; Mancini, I. Synthesis of 2,6-Diamino-Substituted Purine Derivatives and Evaluation of Cell Cycle Arrest in Breast and Colorectal Cancer Cells. Molecules 2018, 23, 1996. https://doi.org/10.3390/molecules23081996
Bosco B, Defant A, Messina A, Incitti T, Sighel D, Bozza A, Ciribilli Y, Inga A, Casarosa S, Mancini I. Synthesis of 2,6-Diamino-Substituted Purine Derivatives and Evaluation of Cell Cycle Arrest in Breast and Colorectal Cancer Cells. Molecules. 2018; 23(8):1996. https://doi.org/10.3390/molecules23081996
Chicago/Turabian StyleBosco, Bartolomeo, Andrea Defant, Andrea Messina, Tania Incitti, Denise Sighel, Angela Bozza, Yari Ciribilli, Alberto Inga, Simona Casarosa, and Ines Mancini. 2018. "Synthesis of 2,6-Diamino-Substituted Purine Derivatives and Evaluation of Cell Cycle Arrest in Breast and Colorectal Cancer Cells" Molecules 23, no. 8: 1996. https://doi.org/10.3390/molecules23081996
APA StyleBosco, B., Defant, A., Messina, A., Incitti, T., Sighel, D., Bozza, A., Ciribilli, Y., Inga, A., Casarosa, S., & Mancini, I. (2018). Synthesis of 2,6-Diamino-Substituted Purine Derivatives and Evaluation of Cell Cycle Arrest in Breast and Colorectal Cancer Cells. Molecules, 23(8), 1996. https://doi.org/10.3390/molecules23081996