Deep Neural Network Based Predictions of Protein Interactions Using Primary Sequences


Abstract
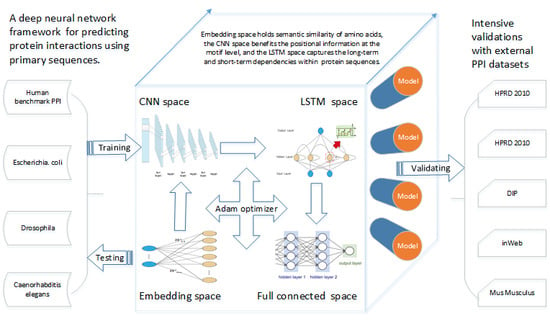
1. Introduction
2. Materials and Methods
2.1. Datasets
2.1.1. Benchmark Dataset
2.1.2. Validation Datasets
- HPRD: The HPRD is a centralized repository for domain architecture, post-translational modifications, interaction networks, and disease associations in the human proteome. All the information in the HPRD was manually extracted from literature by expert biologists. The 2010 version of the HPRD dataset for protein interactions was downloaded.
- DIP: The Database of Interacting Proteins (DIP) archives and evaluates experimentally determined interactions between proteins. All the interactions in the DIP are culled from peer-reviewed literature and are manually entered into the database by expert curators. The released version 20160430 was downloaded.
- HIPPIE: The Human Integrated Protein–Protein Interaction Reference (HIPPIE) provides confidence-scored and functionally annotated human protein–protein interactions. The PPIs with confidence scores equal to or greater than 0.73 were regarded as “high quality” (HQ) data, while those with scores lower than 0.73 were regarded as “low quality” (LQ) data. Both HQ and LQ data of HIPPIE (version 2.0) were downloaded.
- inWeb_inbiomap: This integrates eight large PPI databases and provides a scored human protein interaction network with severalfold more interactions and better functional biological relevance than comparable resources. We also distinguished between two types of PPI data: HQ data, whose confidence score was equal to 1, and LQ data for the rest. The newly released inWeb_inbiomap was downloaded.
2.1.3. Datasets from Other Species
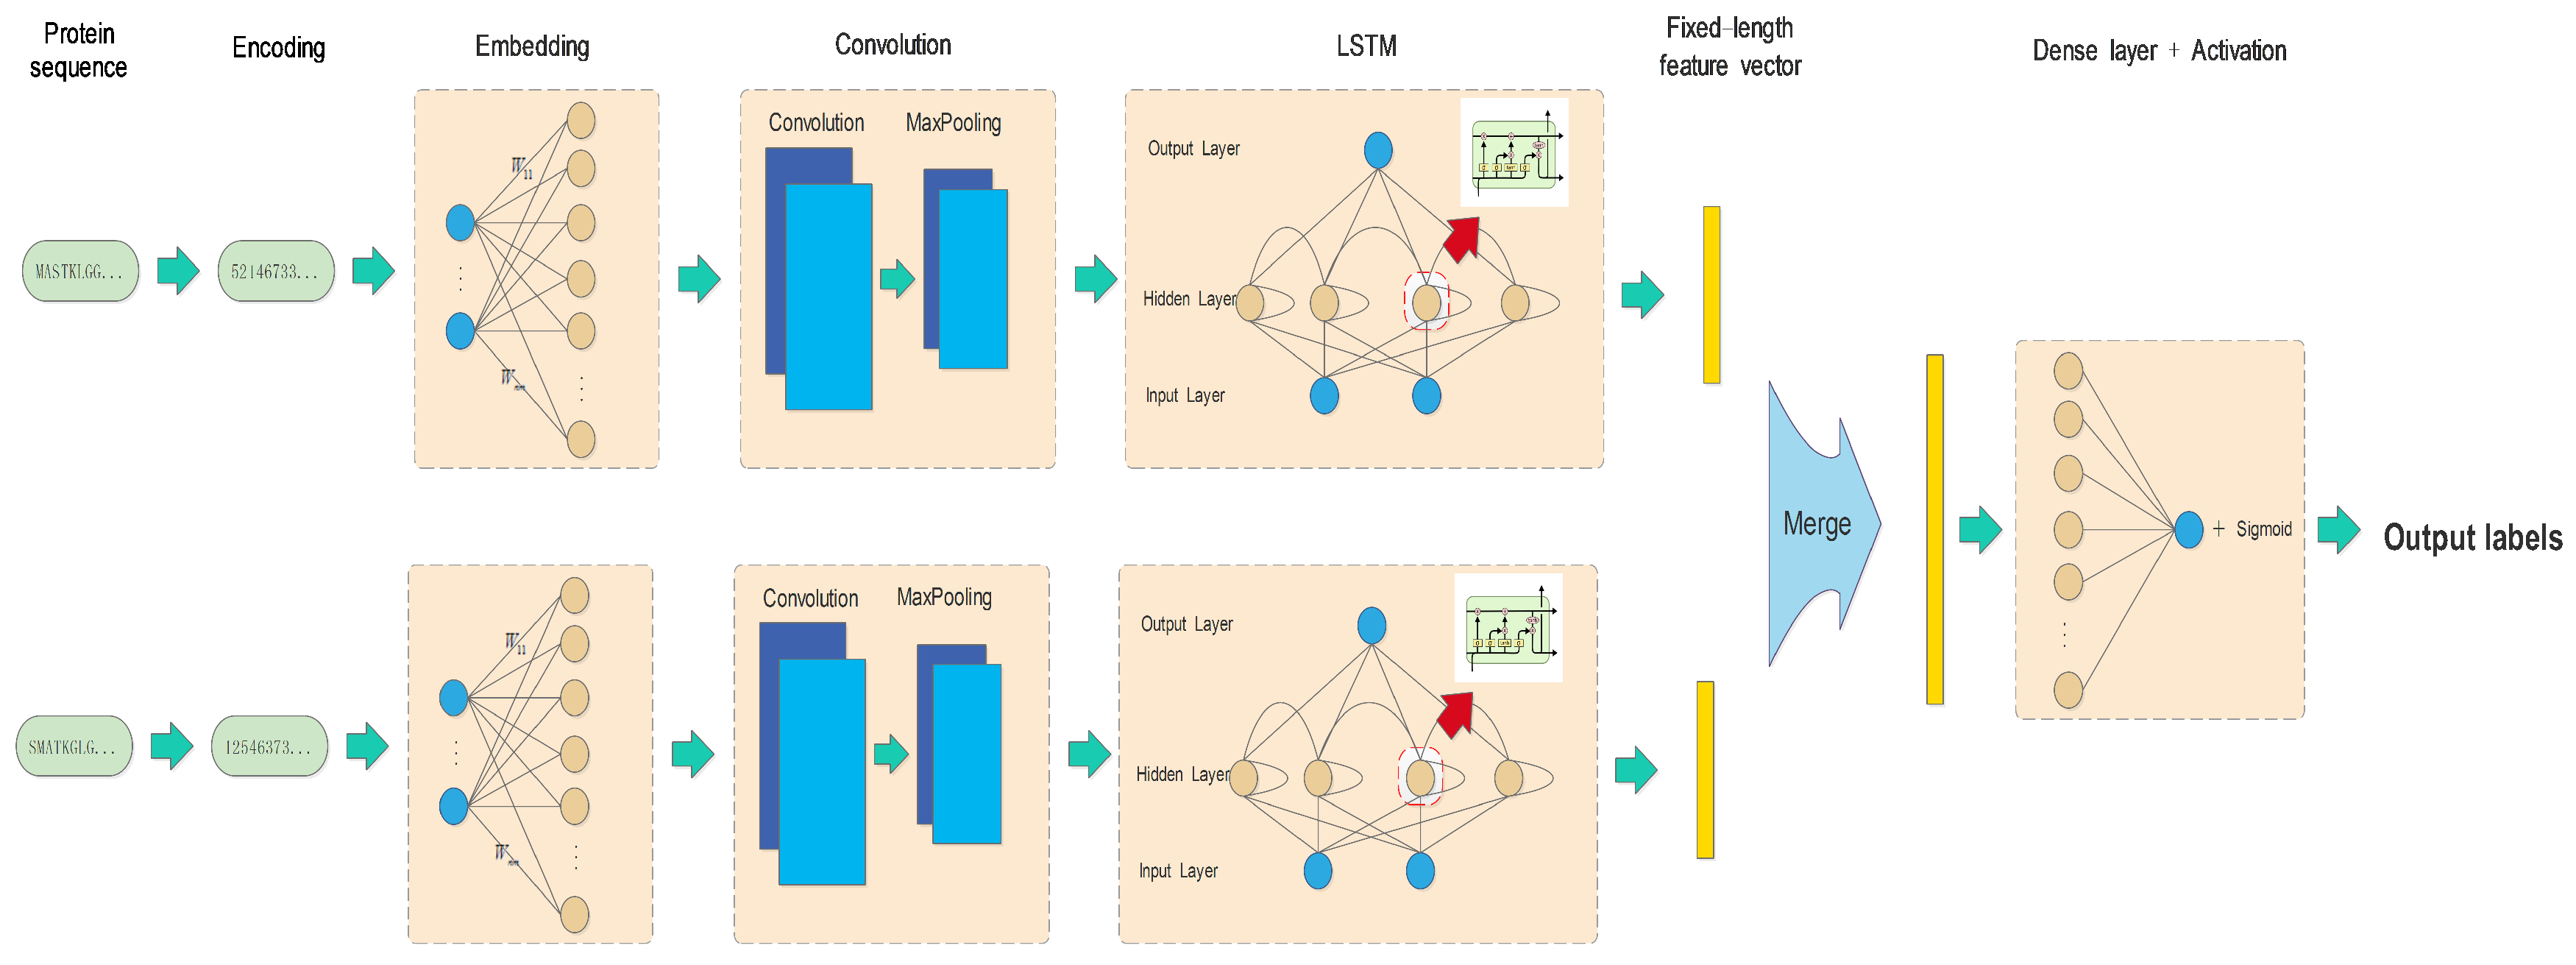
2.2. Methods
3. Results
3.1. Evaluation Criteria
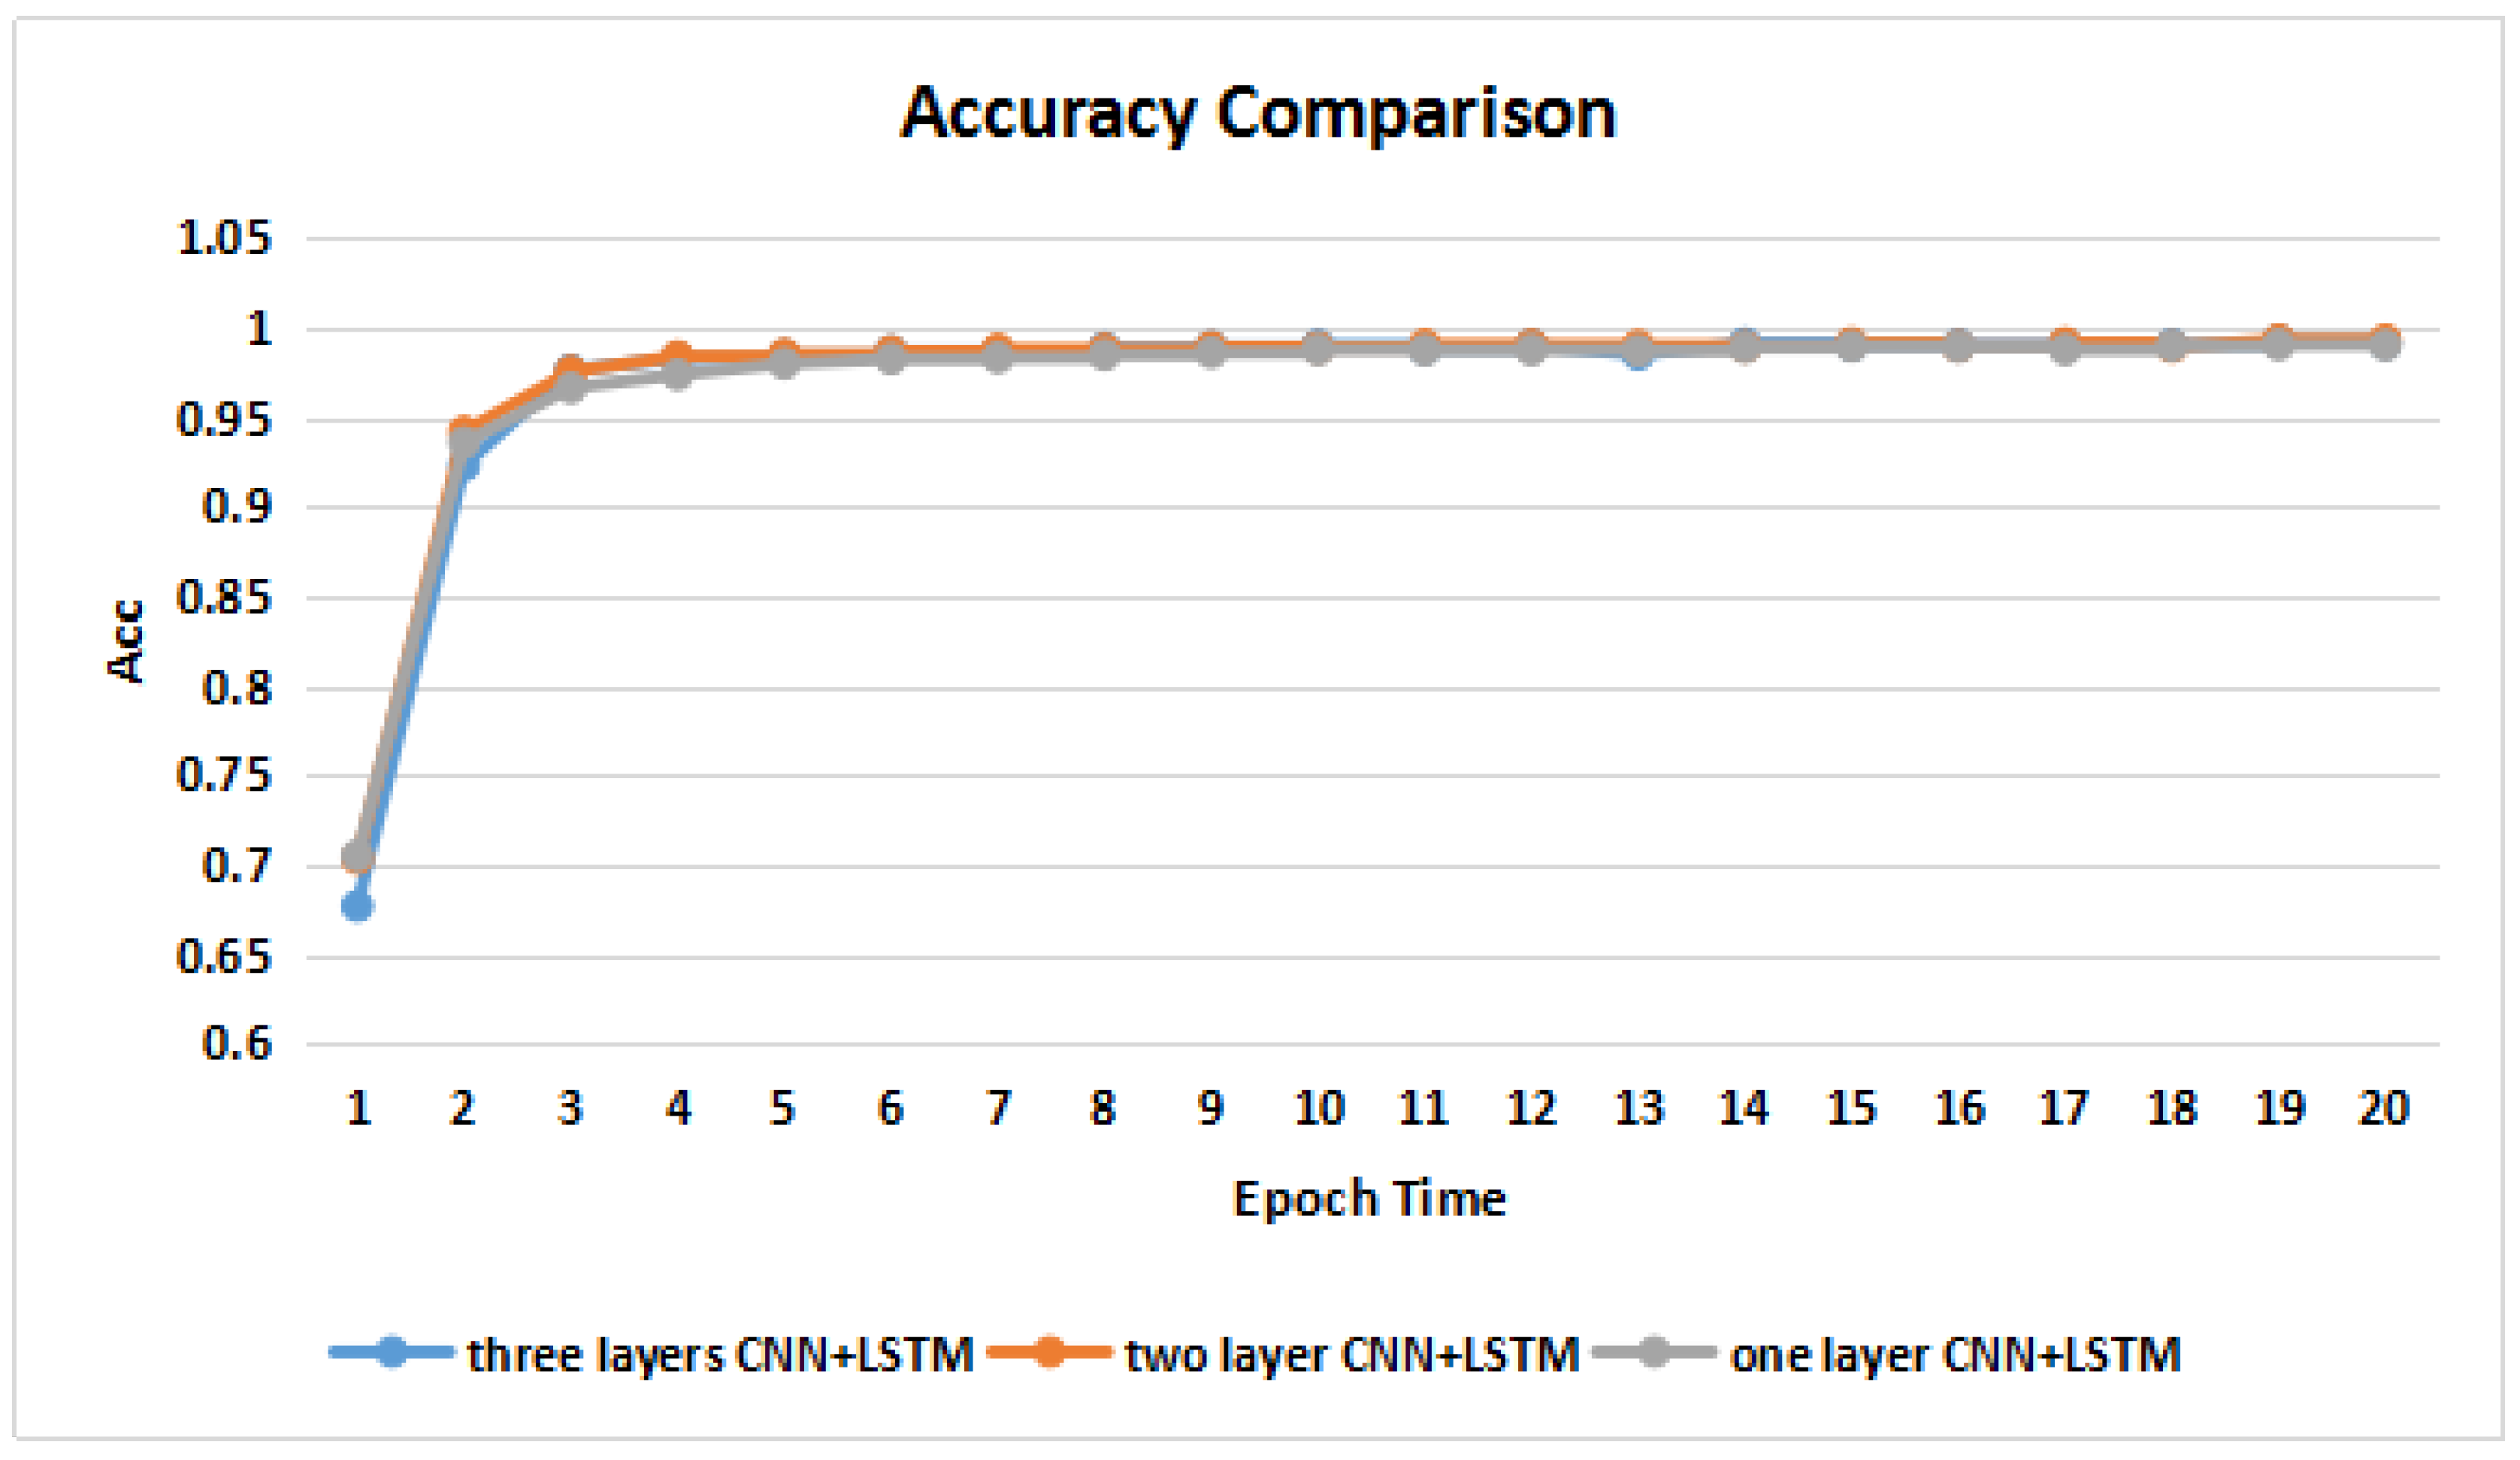
3.2. Training and Validation on the Benchmark Dataset
3.3. Generalization Performances on the Validation Datasets
3.4. Performances on Other Species and Cross-Species Validations
4. Discussion
5. Conclusions
Author Contributions
Funding
Conflicts of Interest
References
- Cui, W.; Gong, X.J.; Yu, H.; Zhang, X. Mining topological structures of protein-protein interaction networks for human brain-specific genes. Genet. Mol. Res. 2015, 14, 12437–12445. [Google Scholar] [CrossRef] [PubMed]
- Skrabanek, L.; Saini, H.K.; Bader, G.D.; Enright, A.J. Computational prediction of protein–protein interactions. Mol. Biotechnol. 2008, 38, 1–17. [Google Scholar] [CrossRef] [PubMed]
- Zhu, H.; Bilgin, M.; Bangham, R.; Hall, D.; Casamayor, A.; Bertone, P.; Lan, N.; Jansen, R.; Bidlingmaier, S.; Houfek, T.; et al. Global analysis of protein activities using proteome chips. Science 2001, 293, 2101–2105. [Google Scholar] [CrossRef] [PubMed]
- Ho, Y.; Gruhler, A.; Heilbut, A.; Bader, G.D.; Moore, L.; Adams, S.-L.; Millar, A.; Taylor, P.; Bennett, K.; Boutilier, K.; et al. Systematic identification of protein complexes in Saccharomyces cerevisiae by mass spectrometry. Nature 2002, 415, 180–183. [Google Scholar] [CrossRef] [PubMed]
- Havin, A.C.; Bösche, M.; Krause, R.; Grandi, P.; Marzioch, M.; Bauer, A.; Schultz, J.; Rick, J.M.; Michon, A.M.; Cruciat, C.M.; et al. Functional organization of the yeast proteome by systematic analysis of protein complexes. Nature 2002, 415, 141–147. [Google Scholar]
- Zhou, C.; Yu, H.; Ding, Y.; Guo, F.; Gong, X.J. Multi-scale encoding of amino acid sequences for predicting protein interactions using gradient boosting decision tree. PLoS ONE 2017, 12, e0181426. [Google Scholar] [CrossRef] [PubMed]
- Sowmya, G.; Ranganathan, S. Protein-Protein Interactions and Prediction: A Comprehensive Overview. Protein Peptide Lett. 2014, 21, 779–789. [Google Scholar] [CrossRef]
- Shen, J.; Zhang, J.; Luo, X.; Zhu, W.; Yu, K.; Chen, K.; Li, Y.; Jiang, H. Predicting protein–protein interactions based only on sequences information. Proc. Natl. Acad. Sci. USA 2007, 104, 4337–4341. [Google Scholar] [CrossRef] [PubMed]
- Guo, Y.; Yu, L.; Wen, Z.; Li, M. Using support vector machine combined with auto covariance to predict protein–protein interactions from protein sequences. Nucleic Acids Res. 2008, 36, 3025–3030. [Google Scholar] [CrossRef] [PubMed]
- Zhou, Y.Z.; Gao, Y.; Zheng, Y.Y. Prediction of protein-protein interactions using local description of amino acid sequence. In Advances in Computer Science and Education Applications; Springer: Berlin/Heidelberg, Germany, 2011; pp. 254–262. [Google Scholar]
- Yang, L.; Xia, J.F.; Gui, J. Prediction of protein-protein interactions from protein sequence using local descriptors. Protein Peptide Lett. 2010, 17, 1085–1090. [Google Scholar] [CrossRef]
- You, Z.H.; Zhu, L.; Zheng, C.H.; Yu, H.J.; Deng, S.P.; Ji, Z. Prediction of protein-protein interactions from amino acid sequences using a novel multi-scale continuous and discontinuous feature set. BMC Bioinform. 2014, 15, S9. [Google Scholar] [CrossRef] [PubMed]
- You, Z.H.; Chan, K.C.; Hu, P. Predicting protein-protein interactions from primary protein sequences using a novel multi-scale local feature representation scheme and the random forest. PLoS ONE 2015, 10, e0125811. [Google Scholar] [CrossRef] [PubMed]
- Huang, Y.A.; You, Z.H.; Gao, X.; Wong, L.; Wang, L. Using weighted sparse representation model combined with discrete cosine transformation to predict protein-protein interactions from protein sequence. BioMed Res. Int. 2015, 2015. [Google Scholar] [CrossRef] [PubMed]
- You, Z.H.; Yu, J.Z.; Zhu, L.; Li, S.; Wen, Z.K. A MapReduce based parallel SVM for large-scale predicting protein–protein interactions. Neurocomputing 2014, 145, 37–43. [Google Scholar] [CrossRef]
- Ding, Y.; Tang, J.; Guo, F. Identification of protein–protein interactions via a novel matrix-based sequence representation model with amino acid contact information. Int. J. Mol. Sci. 2016, 17, 1623. [Google Scholar] [CrossRef] [PubMed]
- Xia, J.F.; Zhao, X.M.; Huang, D.S. Predicting protein–protein interactions from protein sequences using meta predictor. Amino Acids 2010, 39, 1595–1599. [Google Scholar] [CrossRef] [PubMed]
- Friedman, J.H. Greedy function approximation: A gradient boosting machine. Ann. Stat. 2001, 29, 1189–1232. [Google Scholar] [CrossRef]
- Hinton, G.; Deng, L.; Yu, D.; Dahl, G.E.; Mohamed, A.R.; Jaitly, N.; Senior, A.; Vanhoucke, V.; Nguyen, P.; Sainath, T.N.; et al. Deep neural networks for acoustic modeling in speech recognition: The shared views of four research groups. IEEE Signal Process. Mag. 2012, 29, 82–97. [Google Scholar] [CrossRef]
- Graves, A.; Mohamed, A.R.; Hinton, G. Speech recognition with deep recurrent neural networks. In Proceedings of the 2013 IEEE International Conference on Acoustics, Speech and Signal Processing (ICASSP), Vancouver, BC, Canada, 26–31 May 2013; pp. 6645–6649. [Google Scholar]
- Krizhevsky, A.; Sutskever, I.; Hinton, G.E. Imagenet classification with deep convolutional neural networks. Adv. Neural Inf. Process. Syst. 2012, 1, 1097–1105. [Google Scholar] [CrossRef]
- Silver, D.; Huang, A.; Maddison, C.J.; Guez, A.; Sifre, L.; Van Den Driessche, G.; Schrittwieser, J.; Antonoglou, I.; Panneershelvam, V.; Lanctot, M.; et al. Mastering the game of Go with deep neural networks and tree search. Nature 2016, 529, 484–489. [Google Scholar] [CrossRef] [PubMed]
- Lipton, Z.C.; Berkowitz, J.; Elkan, C. A critical review of recurrent neural networks for sequence learning. arXiv, 2015; arXiv:1506.00019. [Google Scholar]
- LeCun, Y.; Bengio, Y.; Hinton, G. Deep learning. Nature 2015, 521, 436. [Google Scholar] [CrossRef] [PubMed]
- Sutskever, I.; Vinyals, O.; Le, Q.V. Sequence to sequence learning with neural networks. Adv. Neural Inf. Process. Syst. 2014, 2, 3104–3112. [Google Scholar]
- Kuksa, P.P.; Min, M.R.; Dugar, R.; Gerstein, M. High-order neural networks and kernel methods for peptide-MHC binding prediction. Bioinformatics 2015, 31, 3600–3607. [Google Scholar] [CrossRef] [PubMed]
- Xu, Y.; Dai, Z.; Chen, F.; Gao, S.; Pei, J.; Lai, L. Deep learning for drug-induced liver injury. J. Chem. Inf. Model. 2015, 55, 2085–2093. [Google Scholar] [CrossRef] [PubMed]
- Li, Y.; Shi, W.; Wasserman, W.W. Genome-wide prediction of cis-regulatory regions using supervised deep learning methods. BMC Bioinform. 2018, 19, 202. [Google Scholar] [CrossRef] [PubMed]
- Zeng, H.; Edwards, M.D.; Liu, G.; Gifford, D.K. Convolutional neural network architectures for predicting DNA–protein binding. Bioinformatics 2016, 32, i121–i127. [Google Scholar] [CrossRef] [PubMed]
- Zhang, S.; Zhou, J.; Hu, H.; Gong, H.; Chen, L.; Cheng, C.; Zeng, J. A deep learning framework for modeling structural features of RNA-binding protein targets. Nucleic Acids Res. 2015, 44, e32. [Google Scholar] [CrossRef] [PubMed]
- Vincent, P.; Larochelle, H.; Lajoie, I.; Bengio, Y.; Manzagol, P.A. Stacked denoising autoencoders: Learning useful representations in a deep network with a local denoising criterion. J. Mach. Learn. Res. 2010, 11, 3371–3408. [Google Scholar]
- Sun, T.; Zhou, B.; Lai, L.; Pei, J. Sequence-based prediction of protein protein interaction using a deep-learning algorithm. BMC Bioinform. 2017, 18, 277. [Google Scholar] [CrossRef] [PubMed]
- Pan, X.; Shen, H.B. RNA-protein binding motifs mining with a new hybrid deep learning based cross-domain knowledge integration approach. BMC Bioinform. 2017, 18, 136. [Google Scholar] [CrossRef] [PubMed]
- Qu, Y.H.; Yu, H.; Gong, X.J.; Xu, J.H.; Lee, H.S. On the prediction of DNA-binding proteins only from primary sequences: A deep learning approach. PLoS ONE 2017, 12, e0188129. [Google Scholar] [CrossRef] [PubMed]
- Pan, X.Y.; Zhang, Y.N.; Shen, H.B. Large-Scale prediction of human protein- protein interactions from amino acid sequence based on latent topic features. J. Proteom. Res. 2010, 9, 4992–5001. [Google Scholar] [CrossRef] [PubMed]
- Graves, A. Generating sequences with recurrent neural networks. arXiv, 2013; arXiv:1308.0850. [Google Scholar]
- Lin, C.; Zou, Y.; Qin, J.; Liu, X.; Jiang, Y.; Ke, C.; Zou, Q. Hierarchical classification of protein folds using a novel ensemble classifier. PLoS ONE 2013, 8, e56499. [Google Scholar] [CrossRef] [PubMed]
- Hou, J.; Adhikari, B.; Cheng, J. DeepSF: Deep convolutional neural network for mapping protein sequences to folds. Bioinformatics 2017, 34, 1295–1303. [Google Scholar] [CrossRef] [PubMed]
- Simonyan, K.; Zisserman, A. Very Deep Convolutional Networks for Large-Scale Image Recognition. In Proceedings of the International Conference on Learning Representations (ICRL), San Diego, CA, USA, 7–9 May 2015; pp. 1–14. [Google Scholar] [CrossRef]
- Ioffe, S.; Szegedy, C. Batch Normalization: Accelerating Deep Network Training by Reducing Internal Covariate Shift. In Proceedings of the the 32nd International Conference on Machine Learning, Lille, France, 6–10 July 2015; Volume 37, pp. 448–456. [Google Scholar] [CrossRef]
- Wang, T.; Li, L.; Huang, Y.A.; Zhang, H.; Ma, Y.; Zhou, X. Prediction of Protein-Protein Interactions from Amino Acid Sequences Based on Continuous and Discrete Wavelet Transform Features. Molecules 2018, 23, 823. [Google Scholar] [CrossRef] [PubMed]
Sample Availability: Not available. |


| Dataset | Positive Samples | Negative Samples | Total |
|---|---|---|---|
| Benchmark set | 29,071 | 31,496 | 60,567 |
| Training set | 26,128 | 28,439 | 54,567 |
| Hold-out test set | 2943 | 3057 | 6000 |
| Dataset | 2010 HPRD | DIP | HIPPIE HQ | HIPPIE LQ | inWeb_inbiomap HQ | inWeb_inbiomap HQ |
|---|---|---|---|---|---|---|
| Positive samples | 8008 | 4514 | 25,701 | 173,343 | 128,591 | 368,882 |
| Low-redundancy | 2413 | 1276 | 3035 | 5587 | 2546 | 5358 |
| Species | Dataset | Positive Samples | Negative Samples | Total |
|---|---|---|---|---|
| E. coli | Original set | 6680 | 6881 | 13,561 |
| Training set | 6012 | 6193 | 12,205 | |
| Testing set | 668 | 688 | 1356 | |
| Drosophila | Original set | 19,133 | 18,449 | 37,582 |
| Training set | 17,220 | 16,593 | 33,813 | |
| Testing set | 1913 | 1856 | 3769 | |
| C. elegans | Original set | 3696 | 3763 | 7459 |
| Training set | 17,220 | 16,593 | 33,813 | |
| Testing set | 1913 | 1856 | 3769 | |
| Mus Musculus | Original set | 22,870 | — | 22,870 |
| Layer | Parameters | Output_Size of Protein A | Output_Size of Protein B |
|---|---|---|---|
| Input | Sentence_length = 1200 | (128,1200) | (128,1200) |
| Batch_size = 128 | |||
| Embedding layer | Input_dim = 23 | (128,1200,128) | (128,1200,128) |
| Output_dim = 128 | |||
| Convolution layer 1 | Filters = 10 | (128,1191,64) | (128,1191,64) |
| Filter_length = 10 | |||
| Activation = relu | |||
| MaxPooling | Pooling_length = 2 | (128,596,64) | (128,596,64) |
| Convolution layer 2 | Filters = 10 | (128,589,64) | (128,589,64) |
| Filter_length = 8 | |||
| Activation = relu | |||
| MaxPooling | Pooling_length = 2 | (128,295,64) | (128,295,64) |
| Convolution layer 3 | Filters = 10 | (128,291,64) | (128,291,64) |
| Filter_length = 5 | |||
| Activation = relu | |||
| MaxPooling | Pooling_length = 2 | (128,146,64) | (128,146,64) |
| LSTM layer | Output_size = 80 | (128,80) | (128,80) |
| Merge layer | Mode = concat | (128,160) | |
| Output | Activation = sigmoid | (128,1) | |
| Test Set | Accuracy | Recall | Precision | F-Score | MCC |
|---|---|---|---|---|---|
| 1 | 0.9853 | 0.9845 | 0.9849 | 0.9847 | 0.9706 |
| 2 | 0.9877 | 0.9876 | 0.9865 | 0.9871 | 0.9754 |
| 3 | 0.9916 | 0.9909 | 0.9913 | 0.9911 | 0.9831 |
| 4 | 0.9892 | 0.9911 | 0.9867 | 0.9889 | 0.9784 |
| 5 | 0.9941 | 0.9963 | 0.9915 | 0.9939 | 0.9883 |
| Hold-out | 0.9878 | 0.9891 | 0.9861 | 0.9876 | 0.9757 |
| Training/Testing | Accuracy | Recall | Precision | F-Score | MCC |
|---|---|---|---|---|---|
| 0.70/0.30 | 0.9846 | 0.9796 | 0.9883 | 0.9839 | 0.9693 |
| 0.75/0.25 | 0.9870 | 0.9864 | 0.9867 | 0.9865 | 0.9741 |
| 0.80/0.20 | 0.9836 | 0.9768 | 0.9889 | 0.9828 | 0.9672 |
| 0.85/0.15 | 0.9849 | 0.9821 | 0.9864 | 0.9843 | 0.9698 |
| Method | Accuracy | Average | |
|---|---|---|---|
| 188D | SVM | 0.9468 | 0.9645 |
| RF | 0.9701 | ||
| GBDT | 0.9767 | ||
| QLC | SVM | 0.9497 | 0.9658 |
| RF | 0.9701 | ||
| GBDT | 0.9775 | ||
| QNC | SVM | 0.9582 | 0.9686 |
| RF | 0.9695 | ||
| GBDT | 0.9782 | ||
| QNC + QLC | SVM | 0.9758 | 0.9751 |
| RF | 0.9716 | ||
| GBDT | 0.9778 | ||
| SAE | 0.9538 | 0.9538 | |
| DNN-PPI | 0.9878 | 0.9878 | |
| Dataset Name | Samples | DNN-PPI | SAE | GBDT | Pan et al. |
|---|---|---|---|---|---|
| 2010 HPRD | 8008 | 0.9789 | 0.9205 | 0.9663 | 0.8816 |
| DIP | 4514 | 0.9433 | 0.8773 | 0.9465 | 0.8872 |
| HIPPIE HQ | 25,701 | 0.9608 | 0.8623 | 0.9415 | 0.8301 |
| HIPPIE LQ | 173,343 | 0.9340 | 0.8105 | 0.9180 | — |
| inWeb_inbiomap HQ | 128,591 | 0.9307 | 0.8512 | 0.9284 | — |
| inWeb_inbiomap LQ | 368,882 | 0.9280 | 0.8187 | 0.9028 | — |
| Dataset | Samples | ACC |
|---|---|---|
| 2010 HPRD LR | 2413 | 0.9465 |
| DIP LR | 1276 | 0.9302 |
| HIPPIE HQ LR | 3035 | 0.9420 |
| HIPPIE LQ LR | 5587 | 0.9414 |
| inWeb_inbiomap HQ LR | 2546 | 0.9411 |
| inWeb_inbiomap LQ LR | 5358 | 0.9331 |
| Species | Recall | Precision | MCC | F-Score | Accuracy | SAE ACC | Guo et al. ACC |
|---|---|---|---|---|---|---|---|
| E. coli | 0.9416 | 0.9752 | 0.9194 | 0.9581 | 0.9594 | 0.9323 | 0.9528 |
| Drosophila | 0.9686 | 0.9995 | 0.9681 | 0.9837 | 0.9838 | 0.9348 | 0.9623 |
| C. elegans | 0.9810 | 0.9918 | 0.9732 | 0.9864 | 0.9866 | 0.9786 | 0.9732 |
| Training Set | Test Set | Accuracy |
|---|---|---|
| Benchmark dataset | Mus Musculus | 0.9835 |
| C. elegans | 0.5267 | |
| Drosophila | 0.5205 | |
| E. coli | 0.4754 | |
| C. elegans | Mus Musculus | 0.9243 |
| Benchmark dataset | 0.4886 | |
| Drosophila | 0.5230 | |
| E. coli | 0.4812 | |
| Drosophila | Mus Musculus | 0.9713 |
| Benchmark dataset | 0.4803 | |
| C. elegans | 0.5147 | |
| E. coli | 0.4924 | |
| E. coli | Mus Musculus | 0.9475 |
| Benchmark dataset | 0.4563 | |
| C. elegans | 0.4585 | |
| Drosophila | 0.4871 |
© 2018 by the authors. Licensee MDPI, Basel, Switzerland. This article is an open access article distributed under the terms and conditions of the Creative Commons Attribution (CC BY) license (http://creativecommons.org/licenses/by/4.0/).
Share and Cite
Li, H.; Gong, X.-J.; Yu, H.; Zhou, C. Deep Neural Network Based Predictions of Protein Interactions Using Primary Sequences. Molecules 2018, 23, 1923. https://doi.org/10.3390/molecules23081923
Li H, Gong X-J, Yu H, Zhou C. Deep Neural Network Based Predictions of Protein Interactions Using Primary Sequences. Molecules. 2018; 23(8):1923. https://doi.org/10.3390/molecules23081923
Chicago/Turabian StyleLi, Hang, Xiu-Jun Gong, Hua Yu, and Chang Zhou. 2018. "Deep Neural Network Based Predictions of Protein Interactions Using Primary Sequences" Molecules 23, no. 8: 1923. https://doi.org/10.3390/molecules23081923
APA StyleLi, H., Gong, X.-J., Yu, H., & Zhou, C. (2018). Deep Neural Network Based Predictions of Protein Interactions Using Primary Sequences. Molecules, 23(8), 1923. https://doi.org/10.3390/molecules23081923