Optimisation of Ethanol-Reflux Extraction of Saponins from Steamed Panax notoginseng by Response Surface Methodology and Evaluation of Hematopoiesis Effect

 and
and
Abstract
: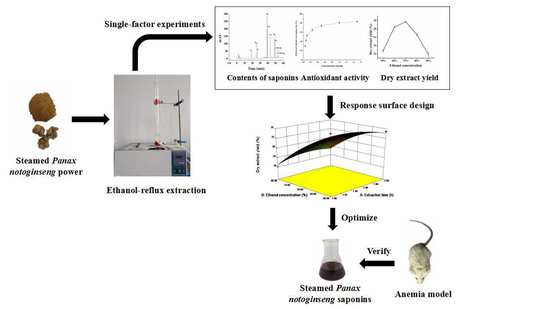
1. Introduction
2. Results and Discussion
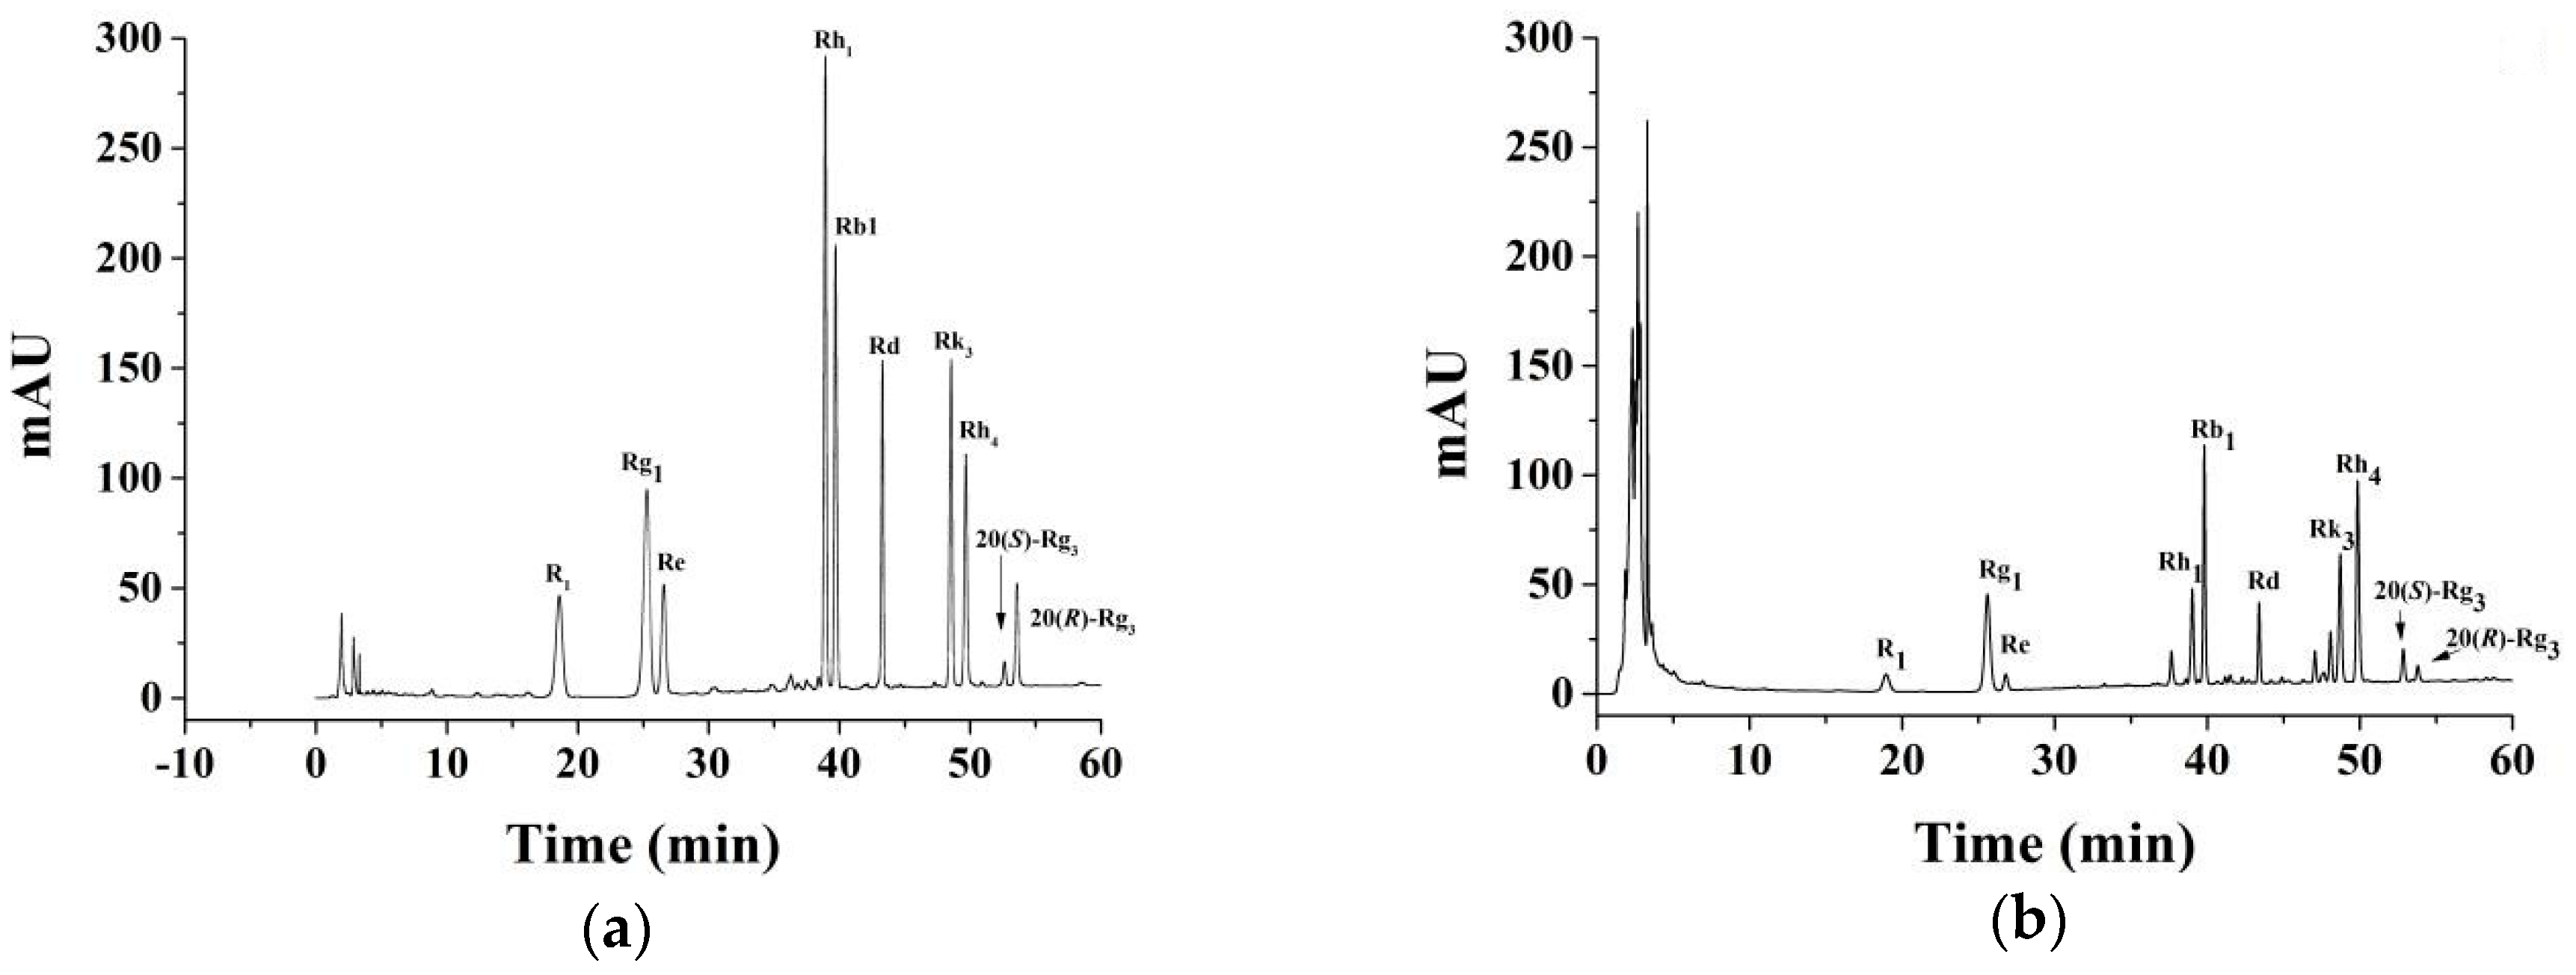
2.1. HPLC Analyses
2.2. Single-Factor Experimental Analysis
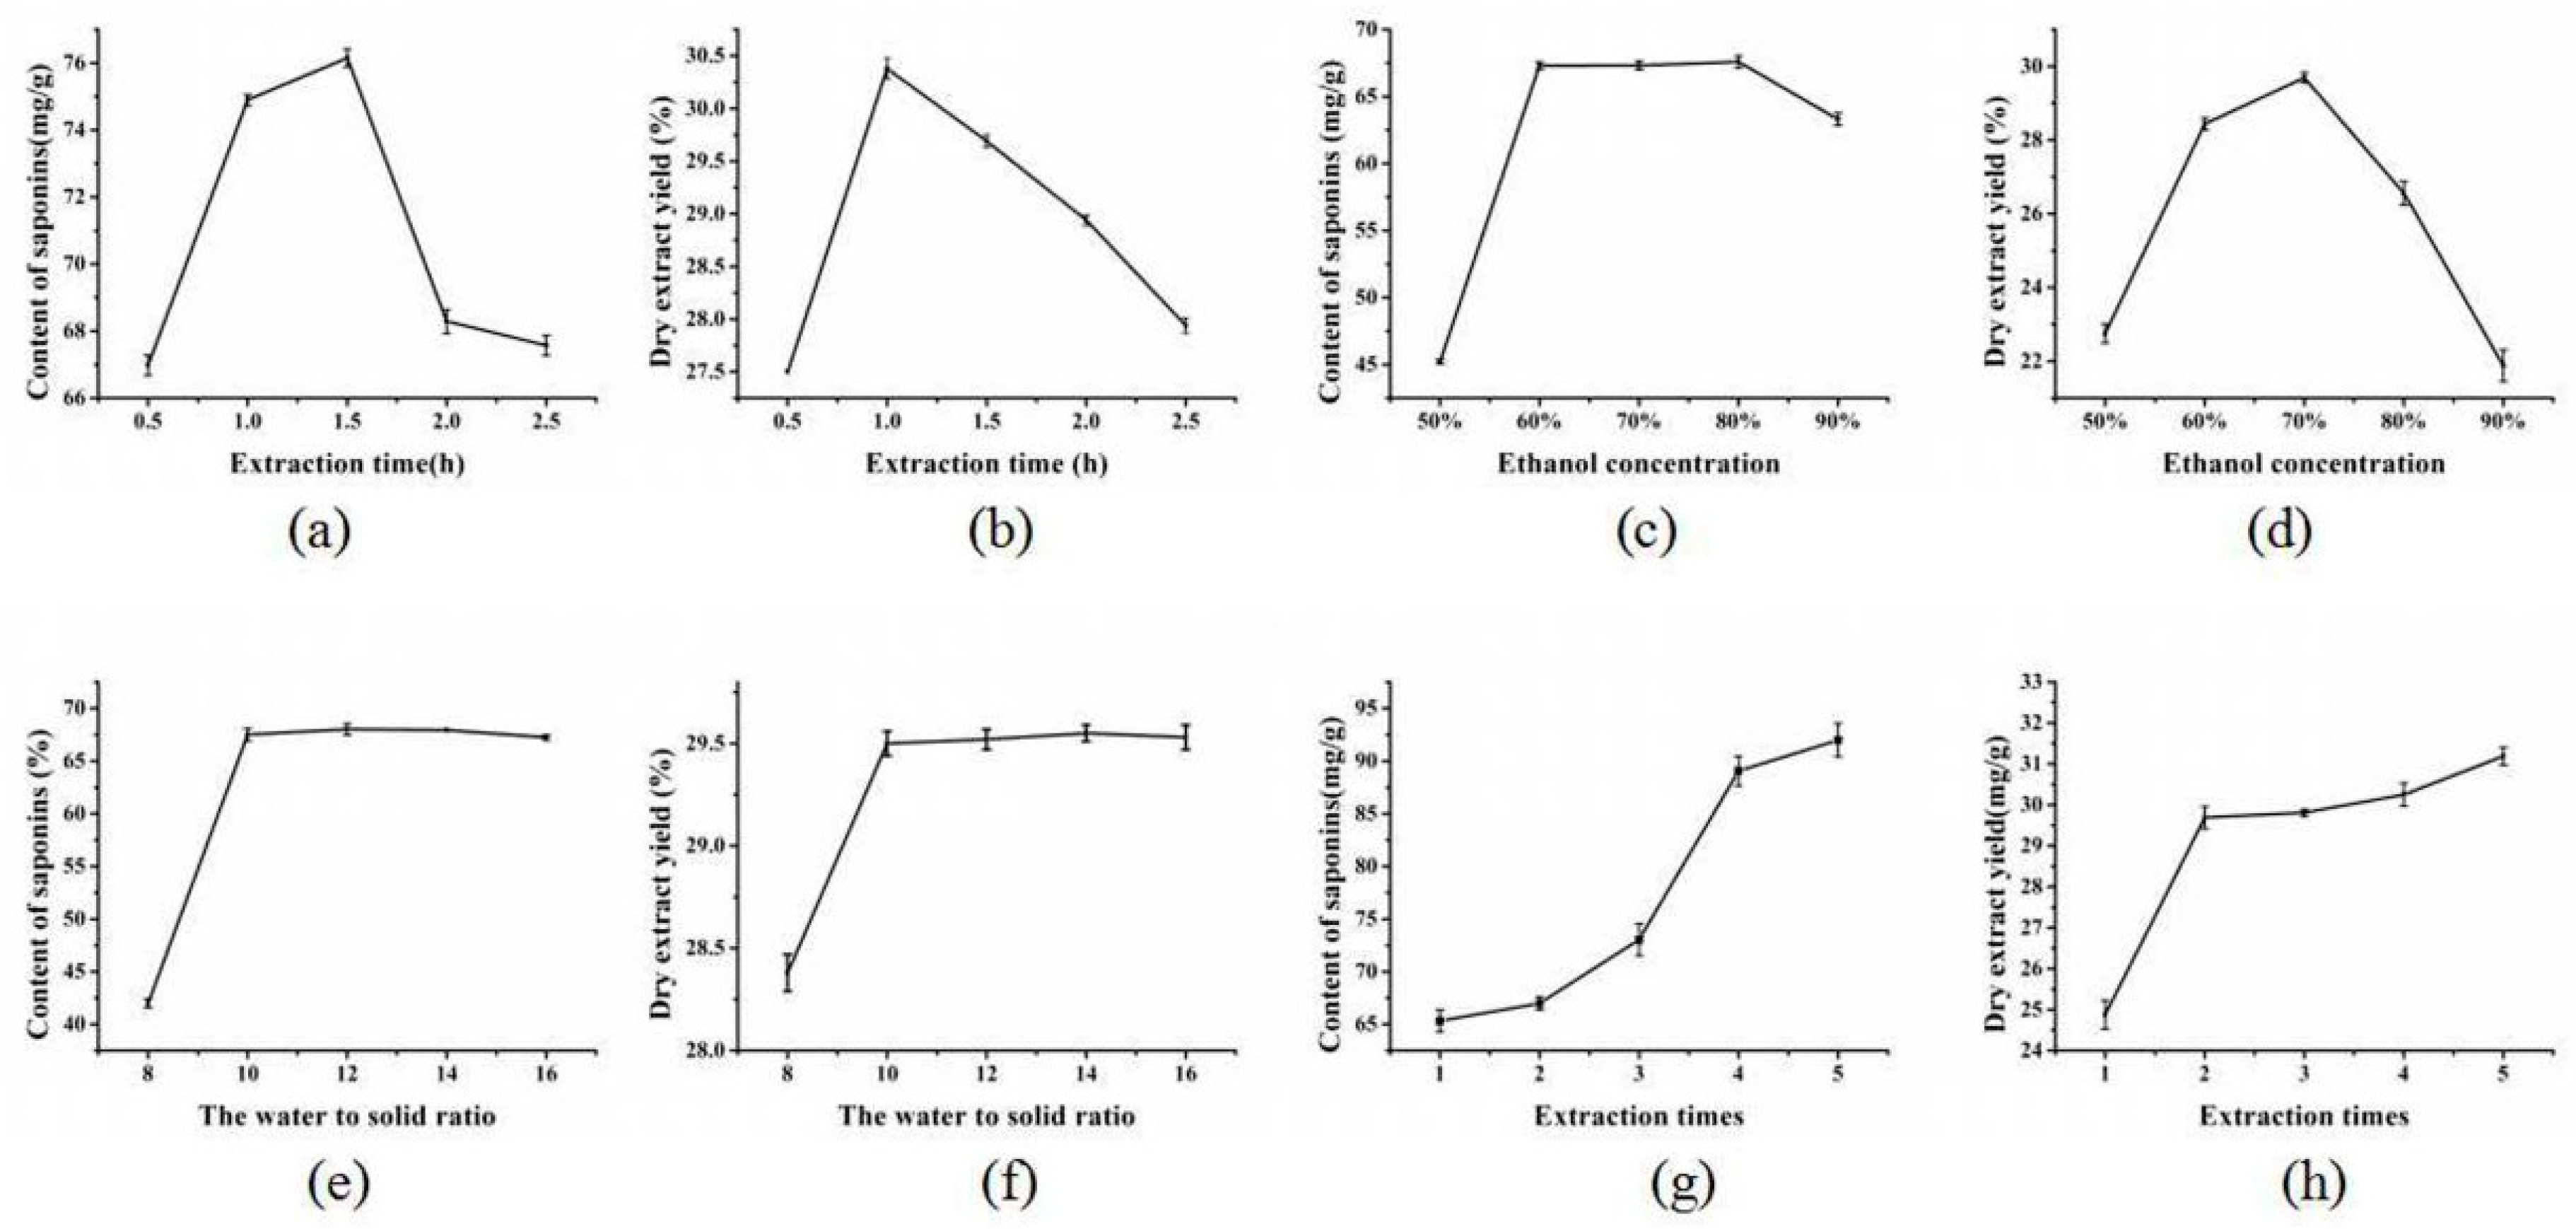
2.2.1. The Effect of Extraction Time on the Content and Yield of Saponins
2.2.2. The Effect of Ethanol Concentration on the Content and Yield of Saponins
2.2.3. The Effect of the Water to Solid Ratio on the Content and Yield of Saponins
2.2.4. The Effect of the Times of Extraction on the Content and Yield of Saponins
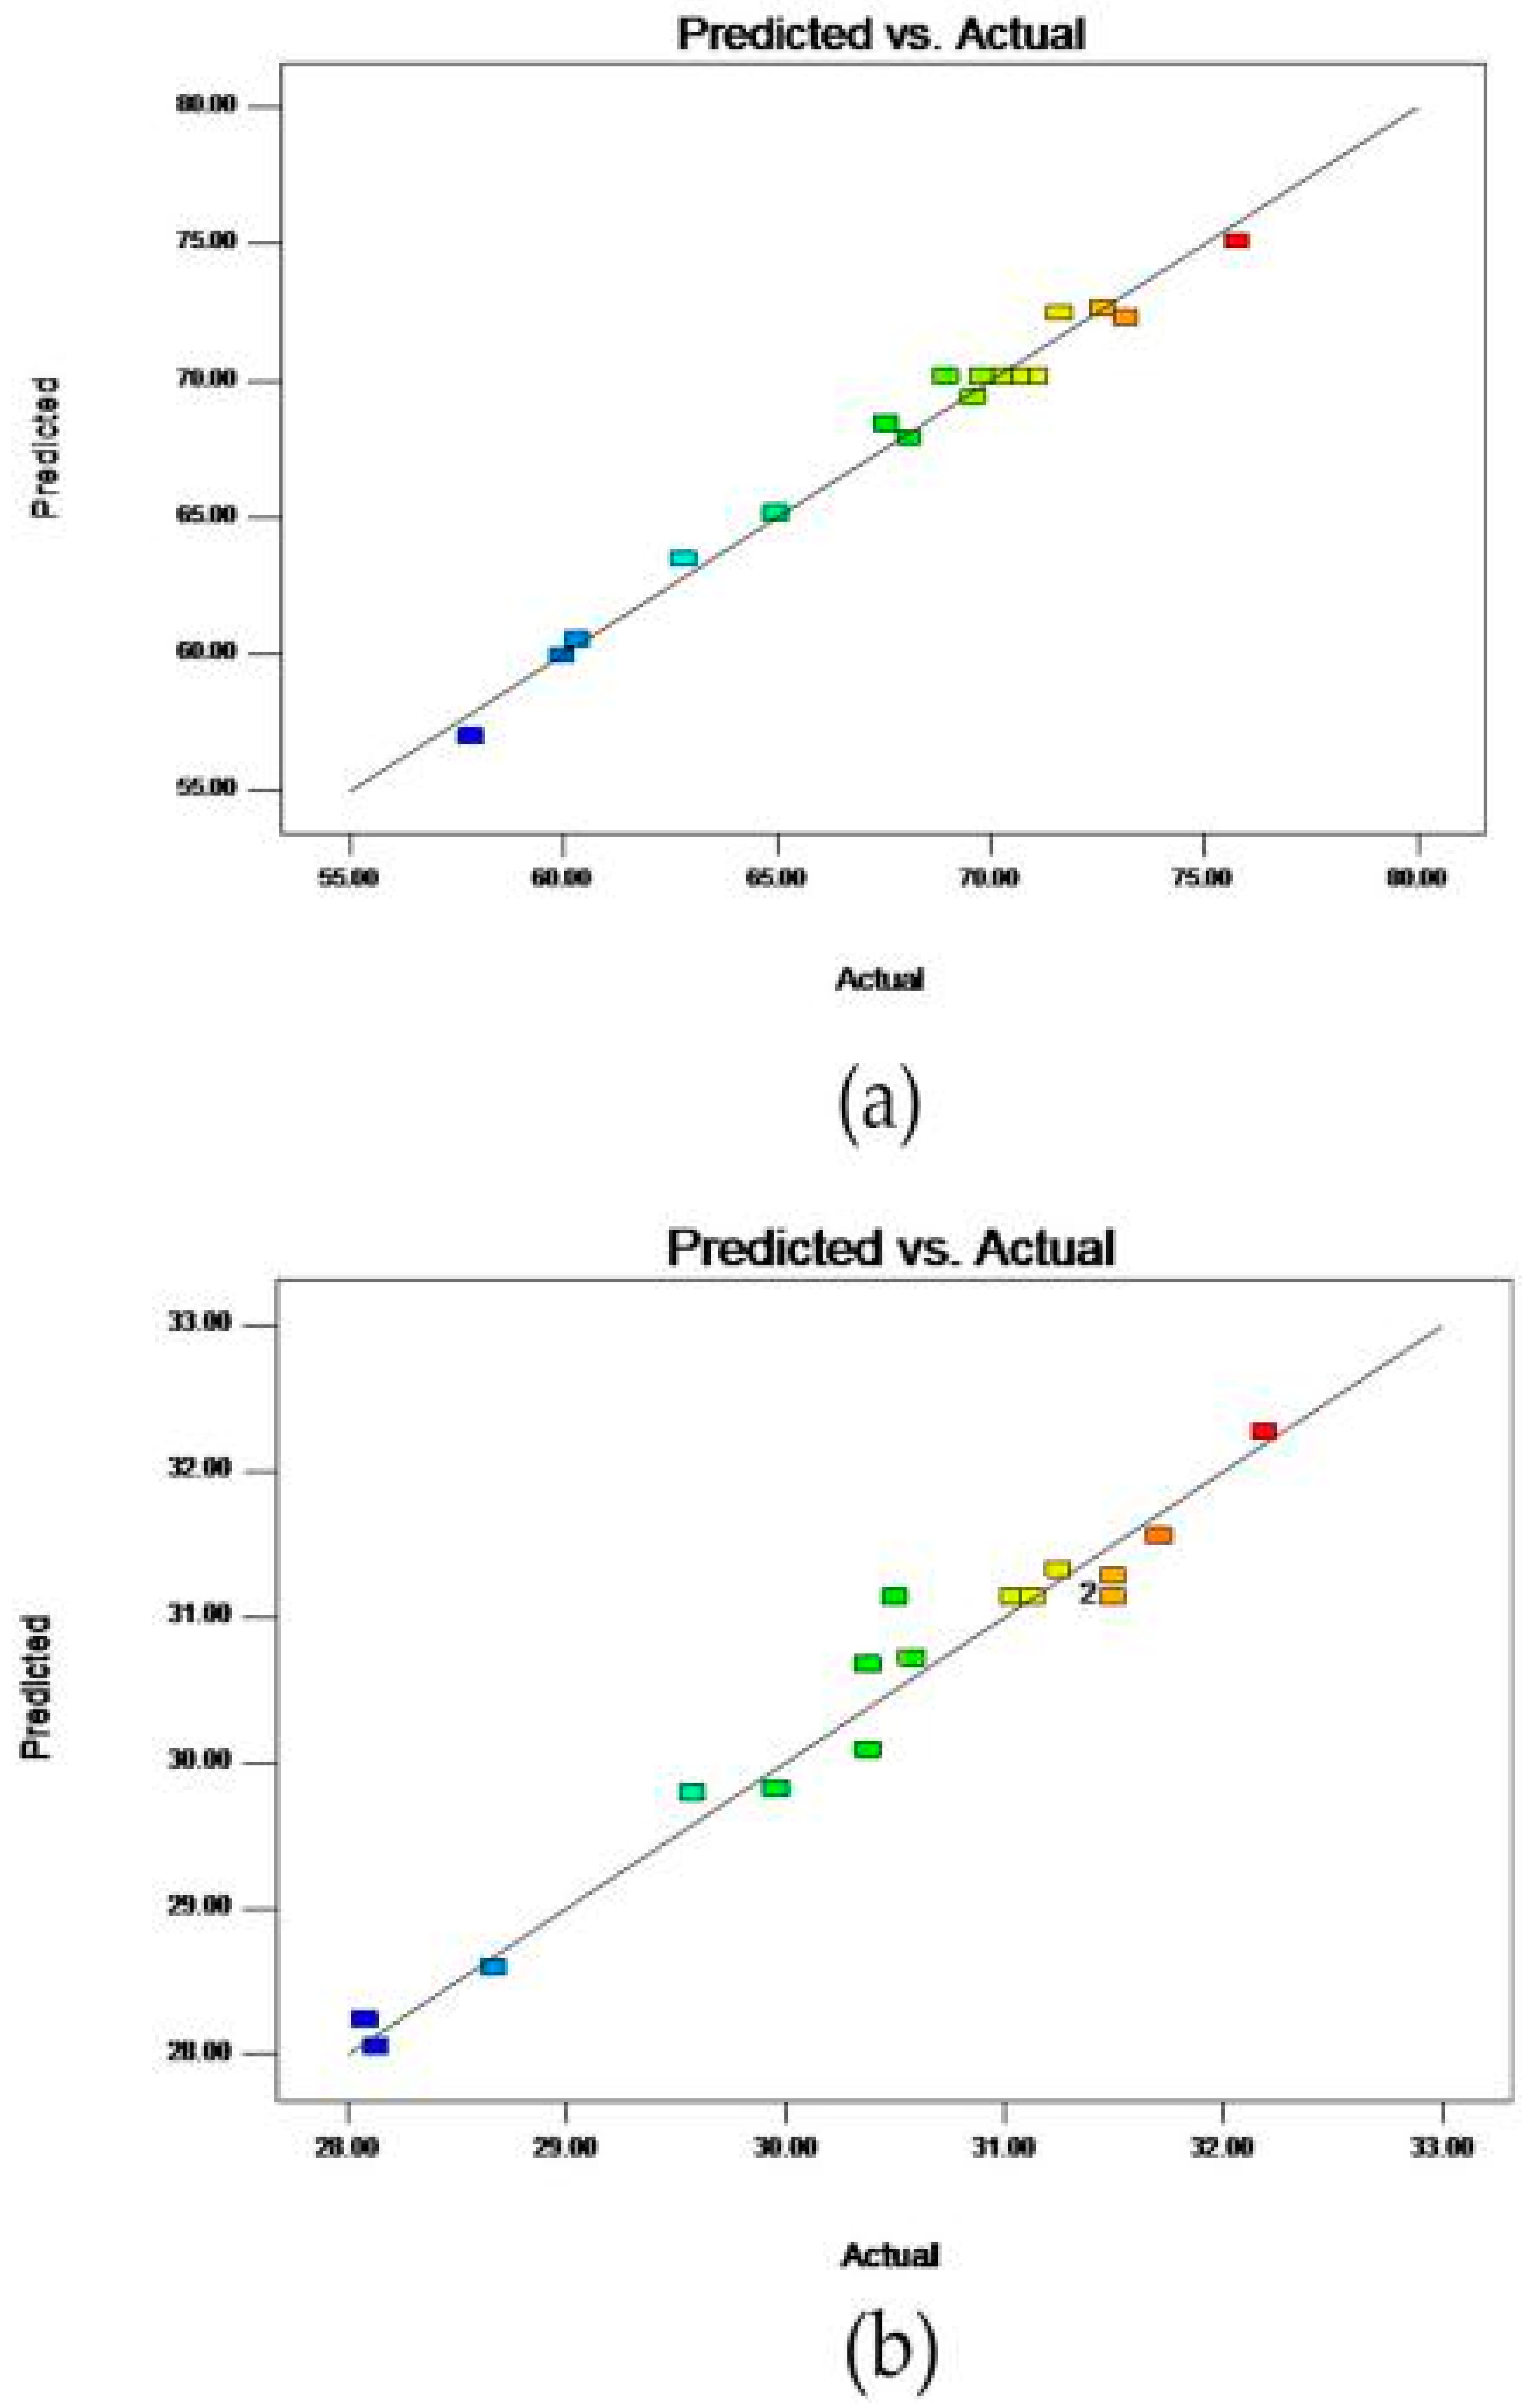
2.3. Fitting the Response Surface Models
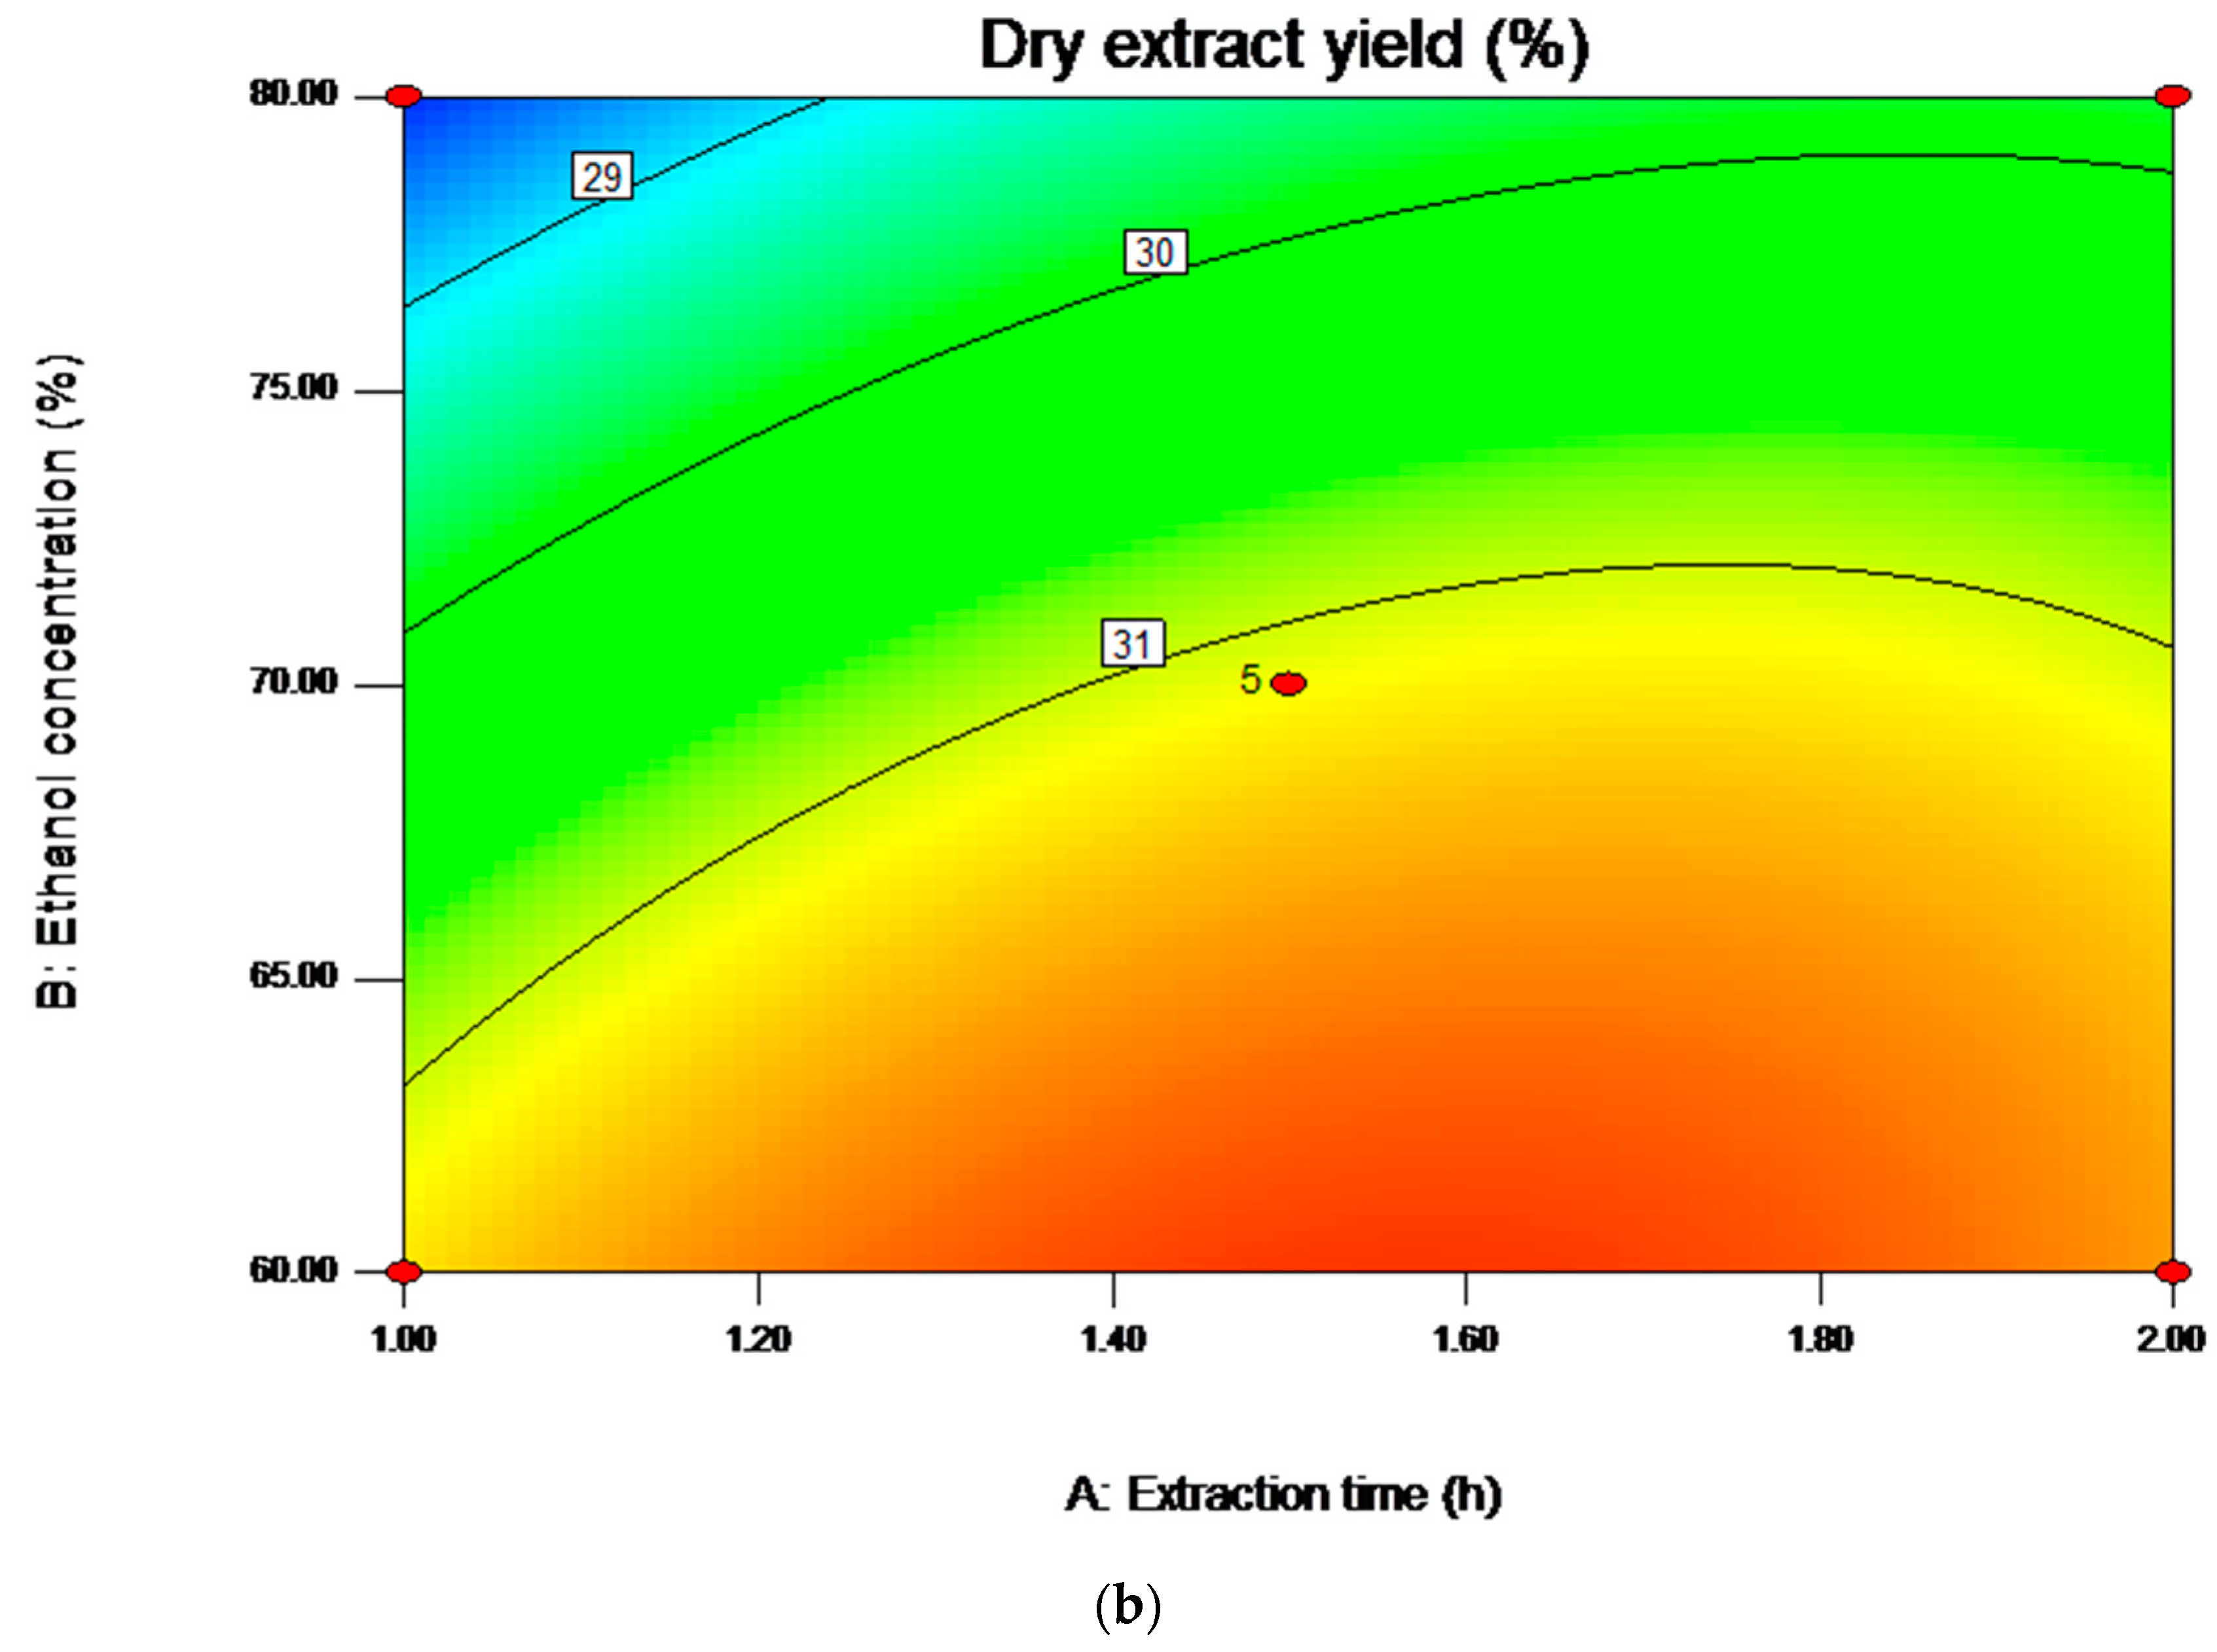
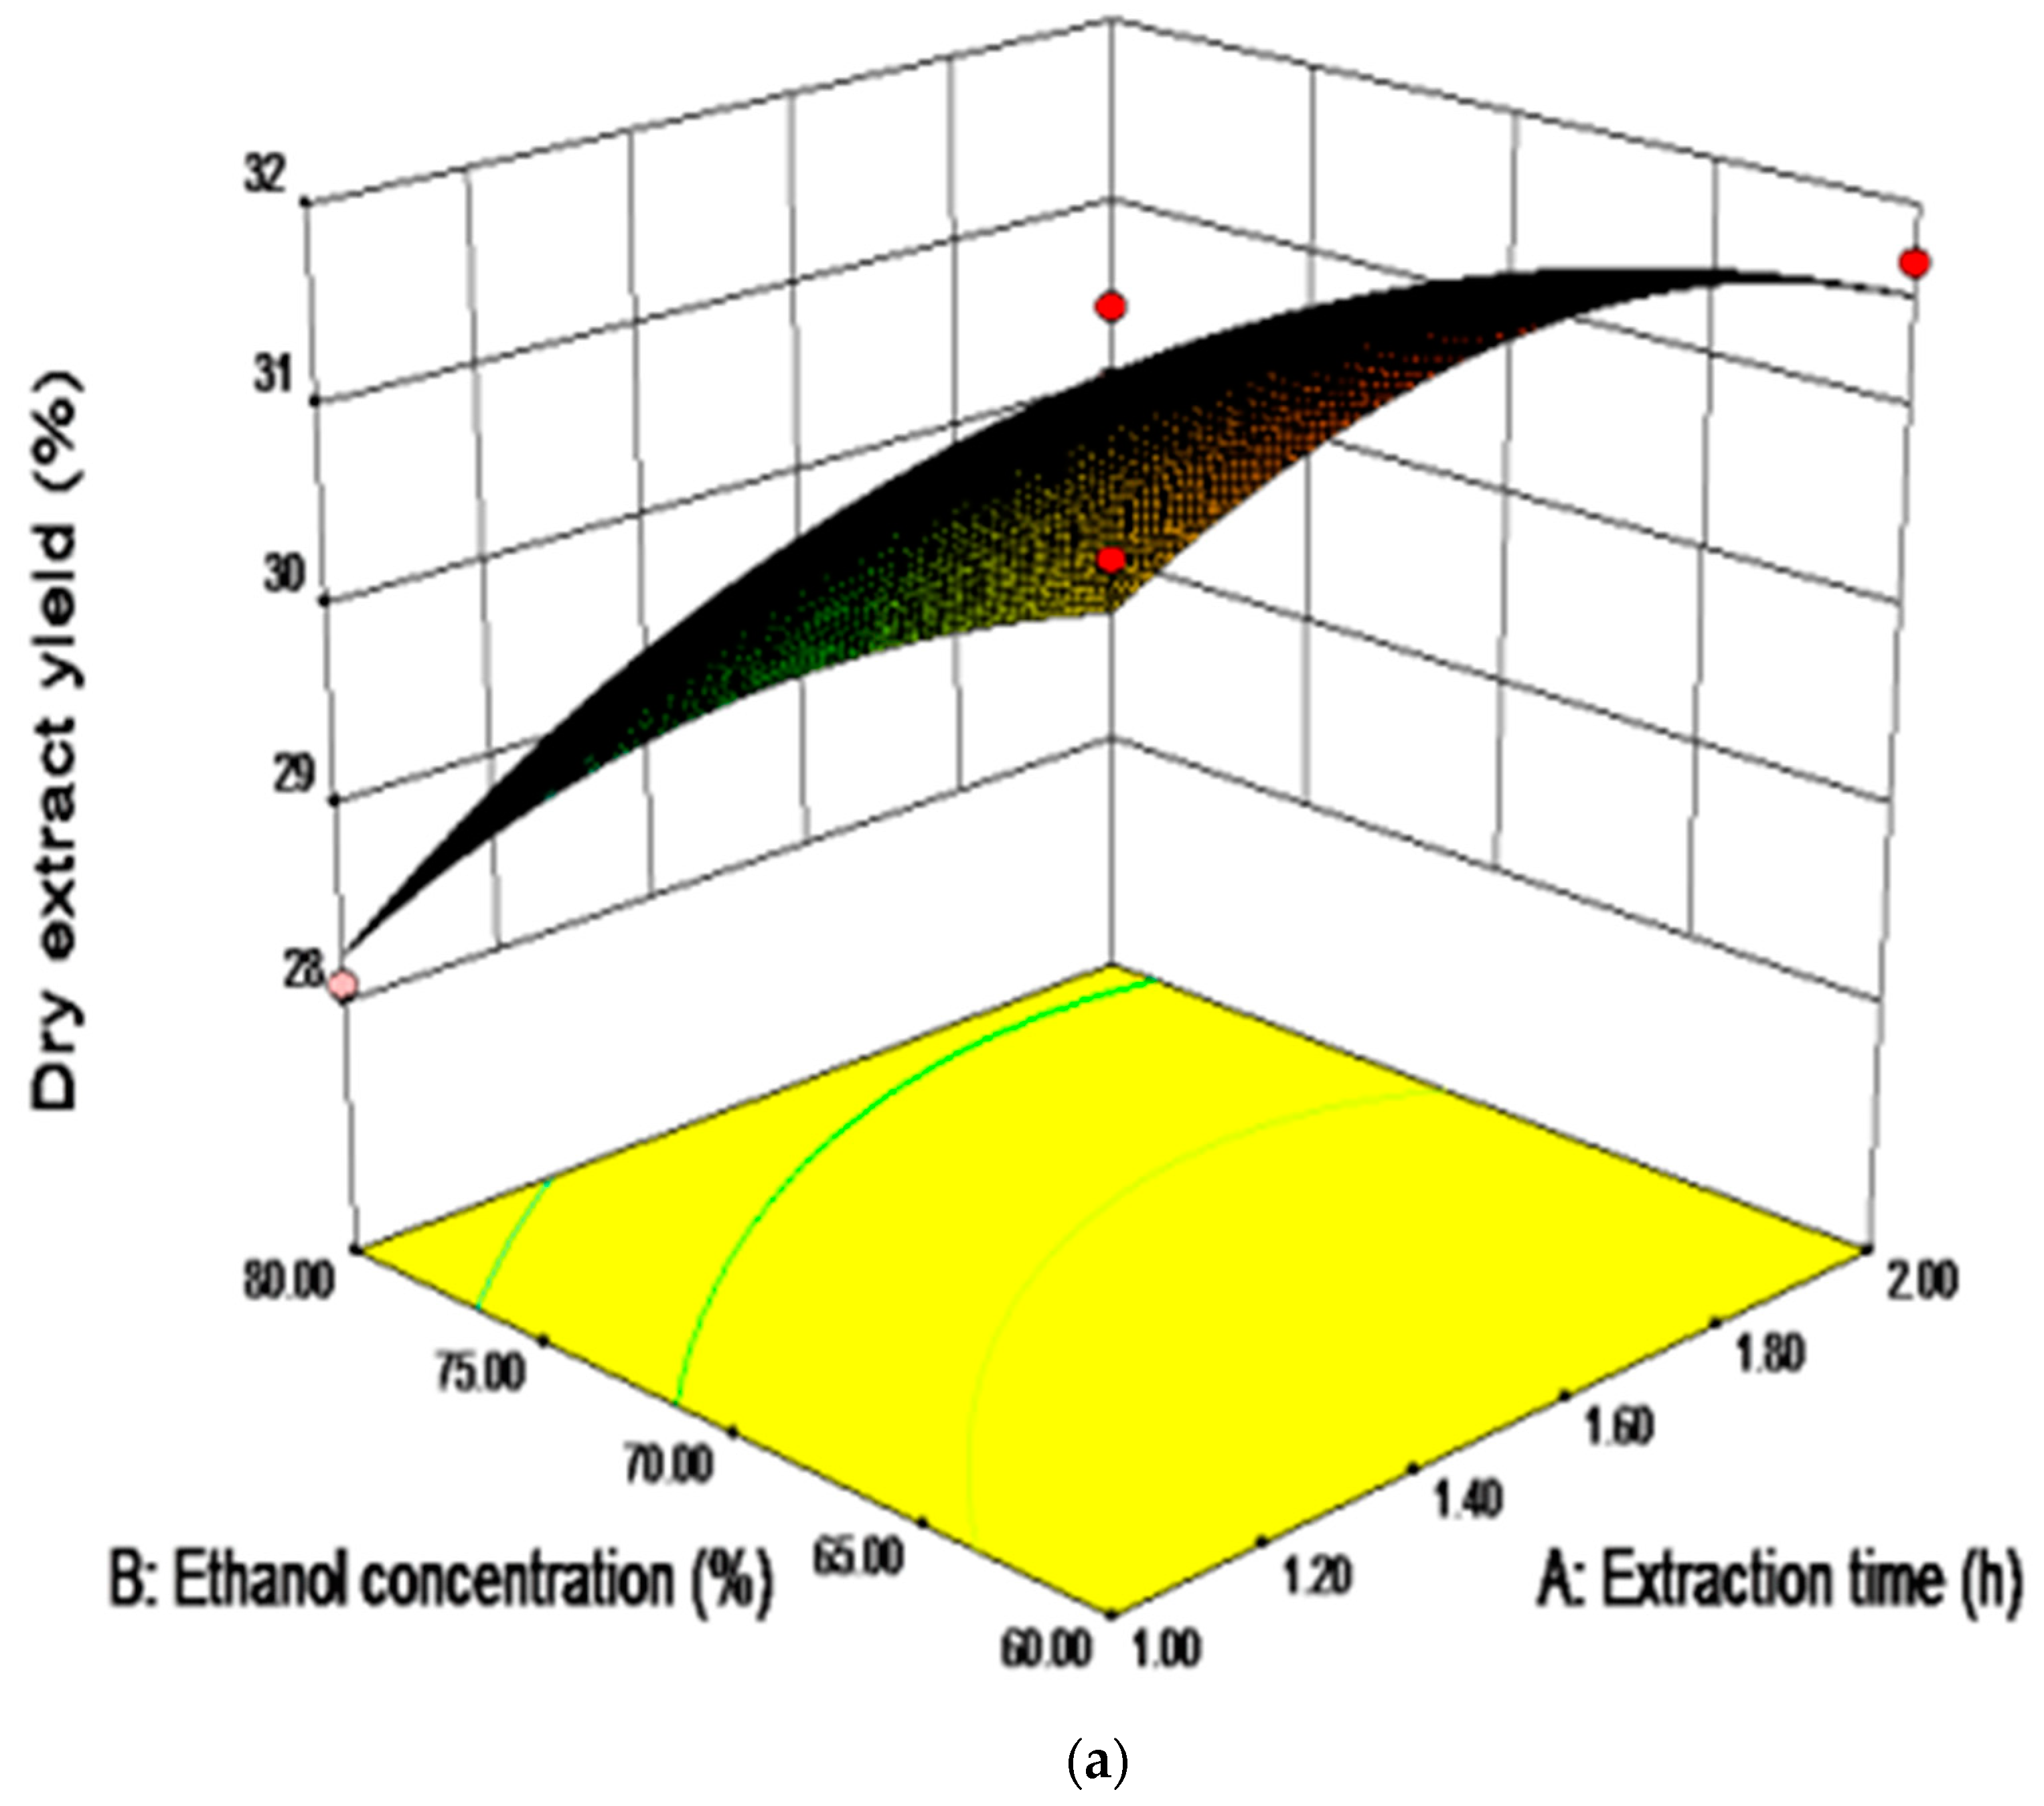
2.4. Analysis of Influence of Variables on the Yield of Saponins
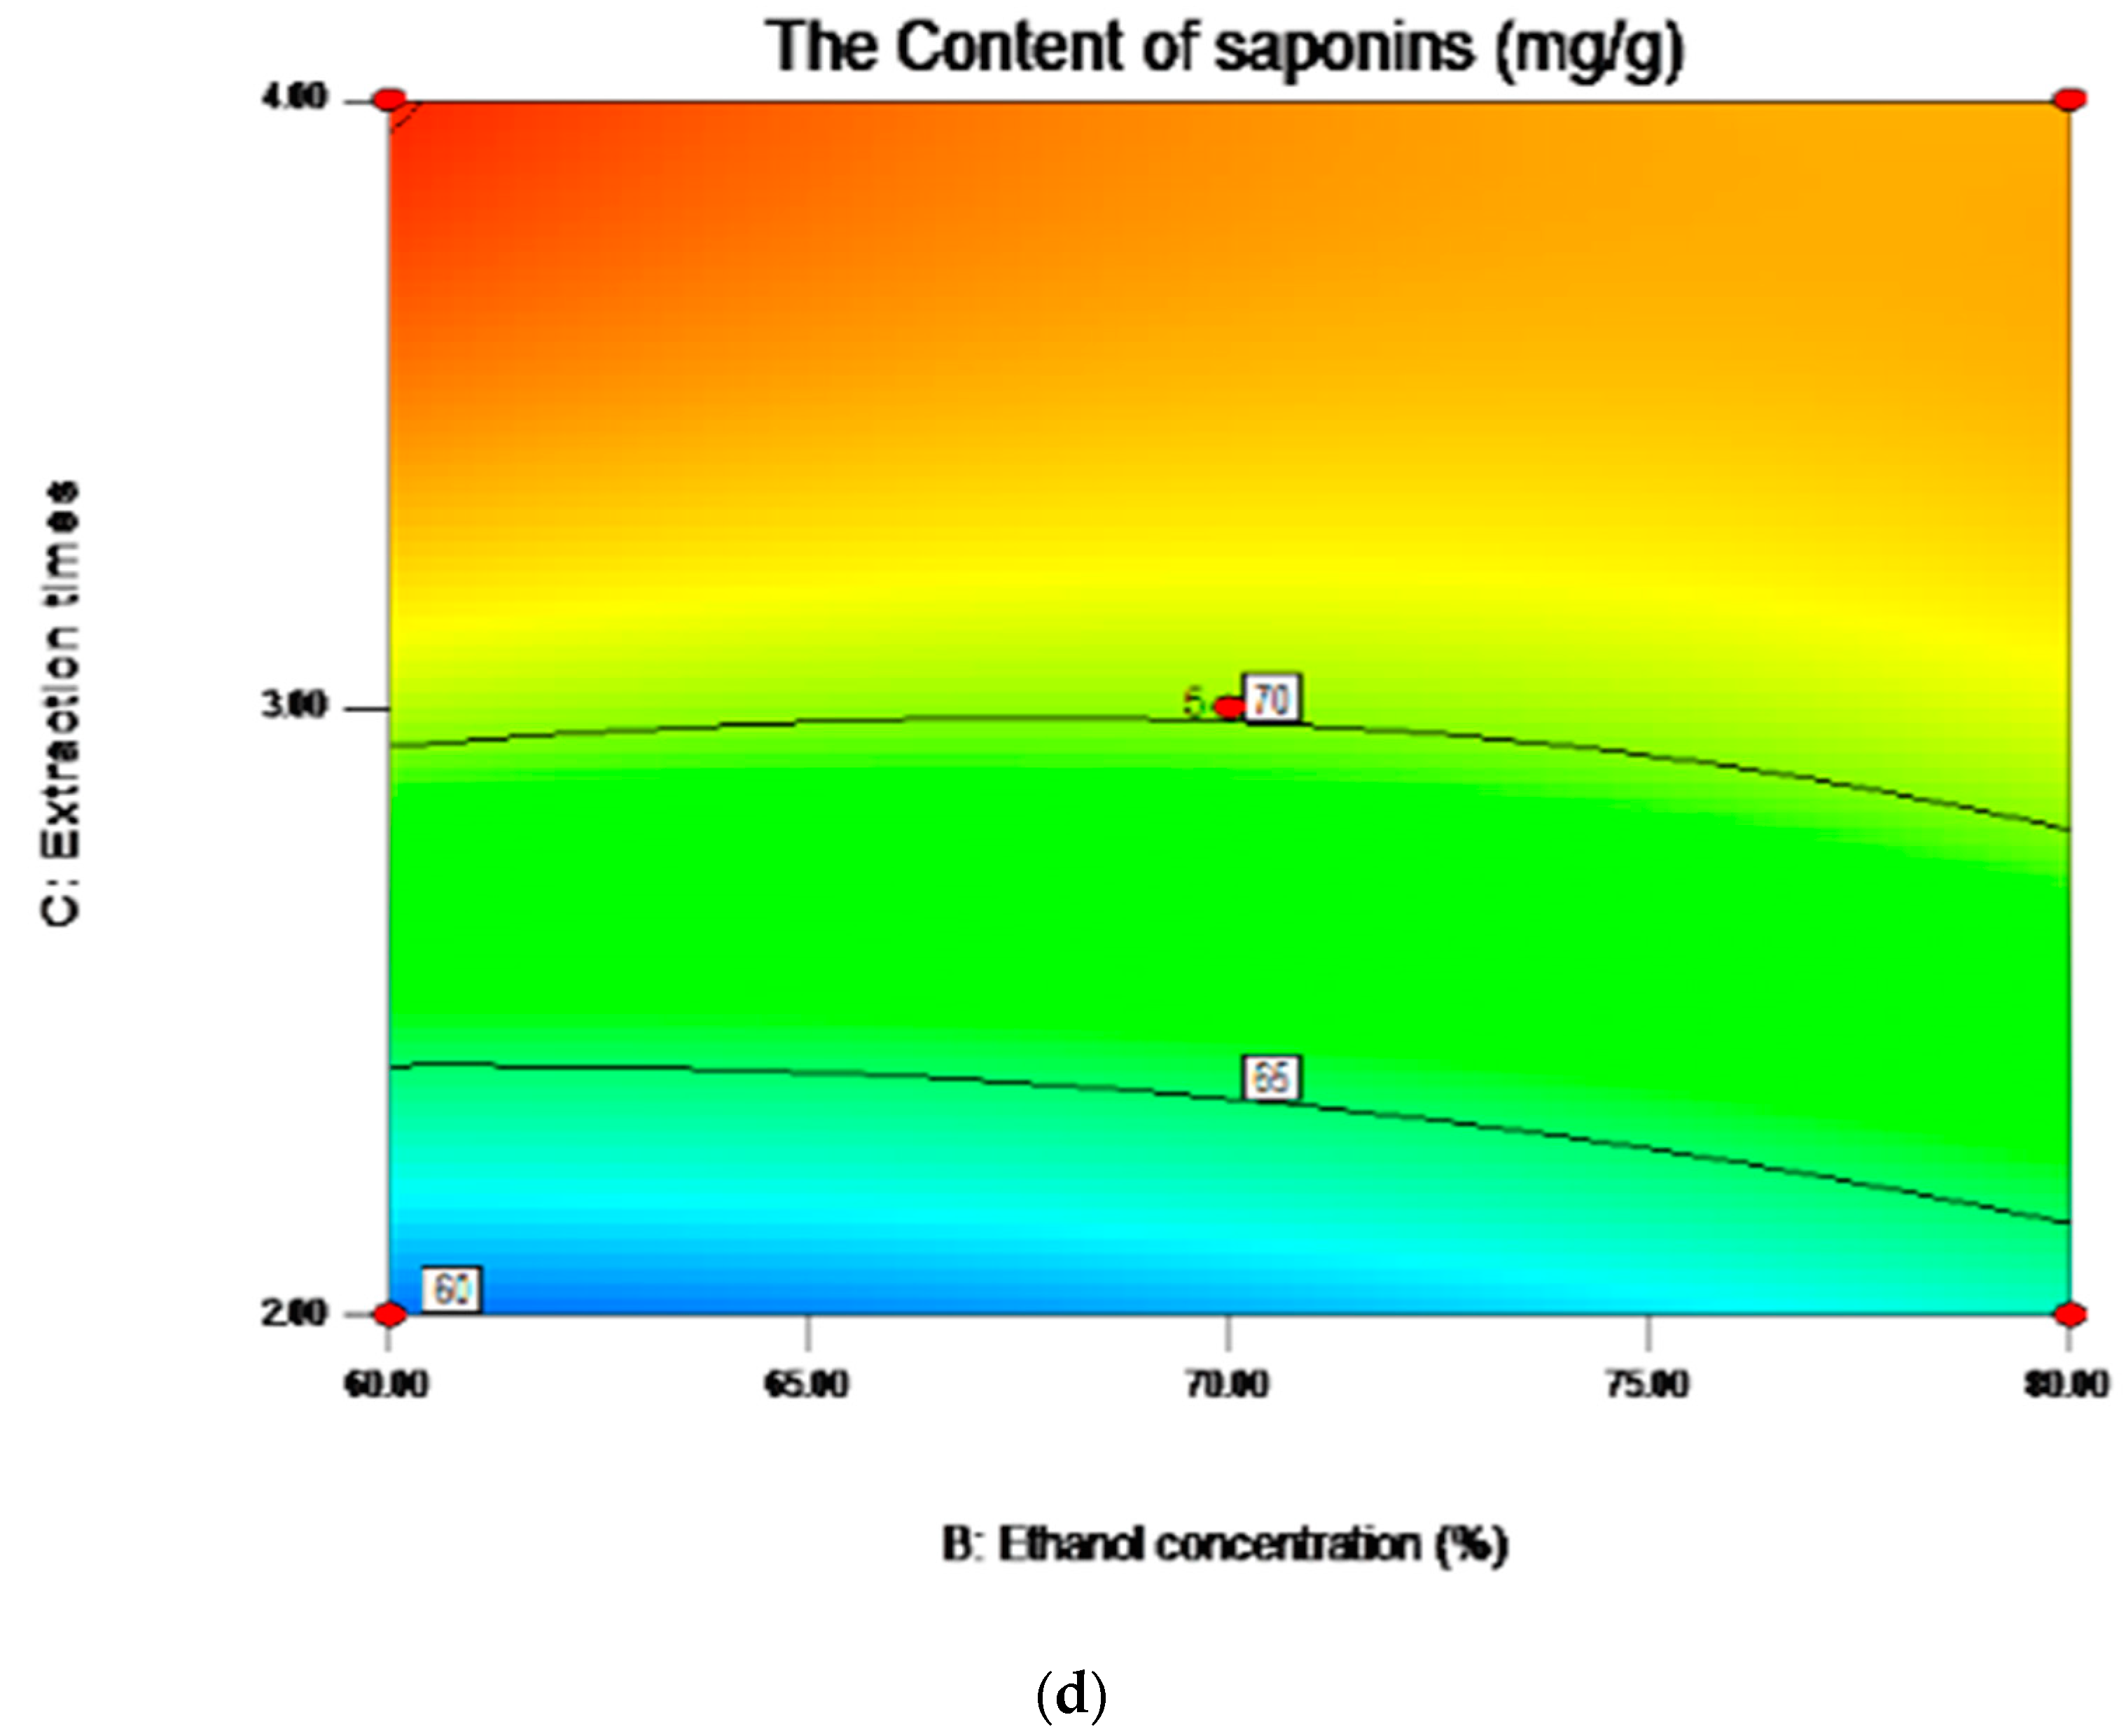
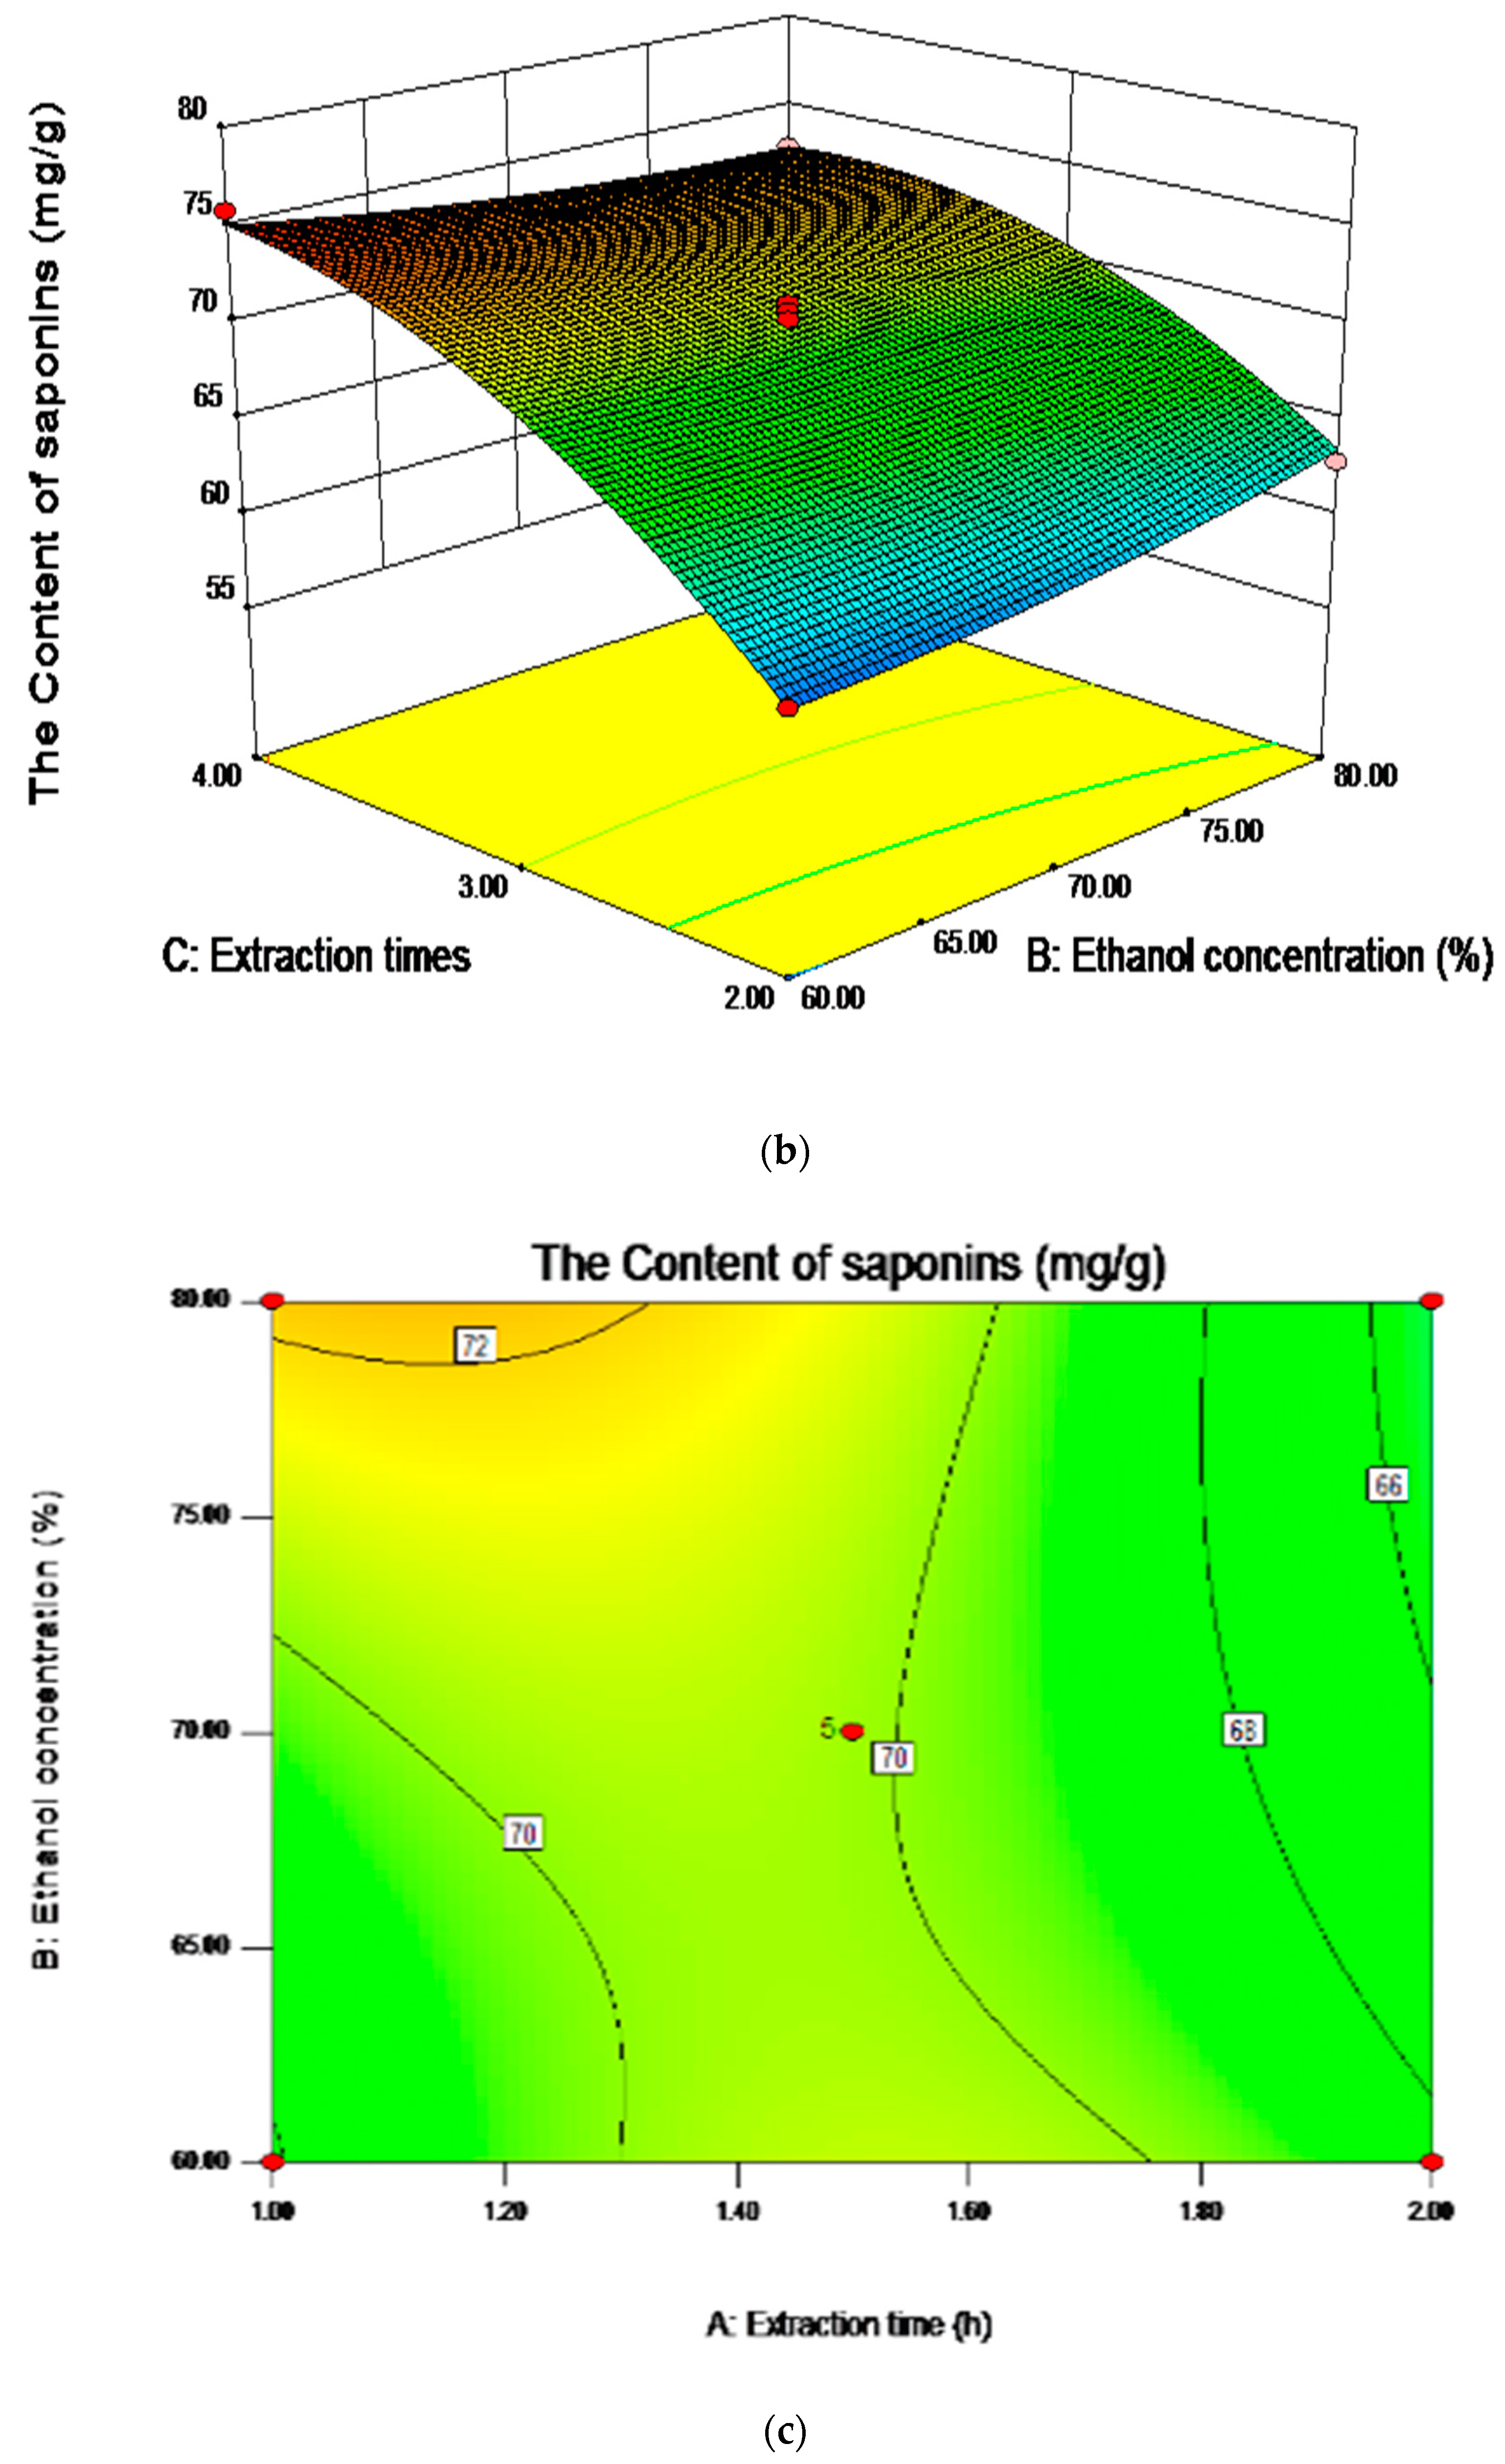
2.5. Analysis of Influence of Variables on the Content of Saponins
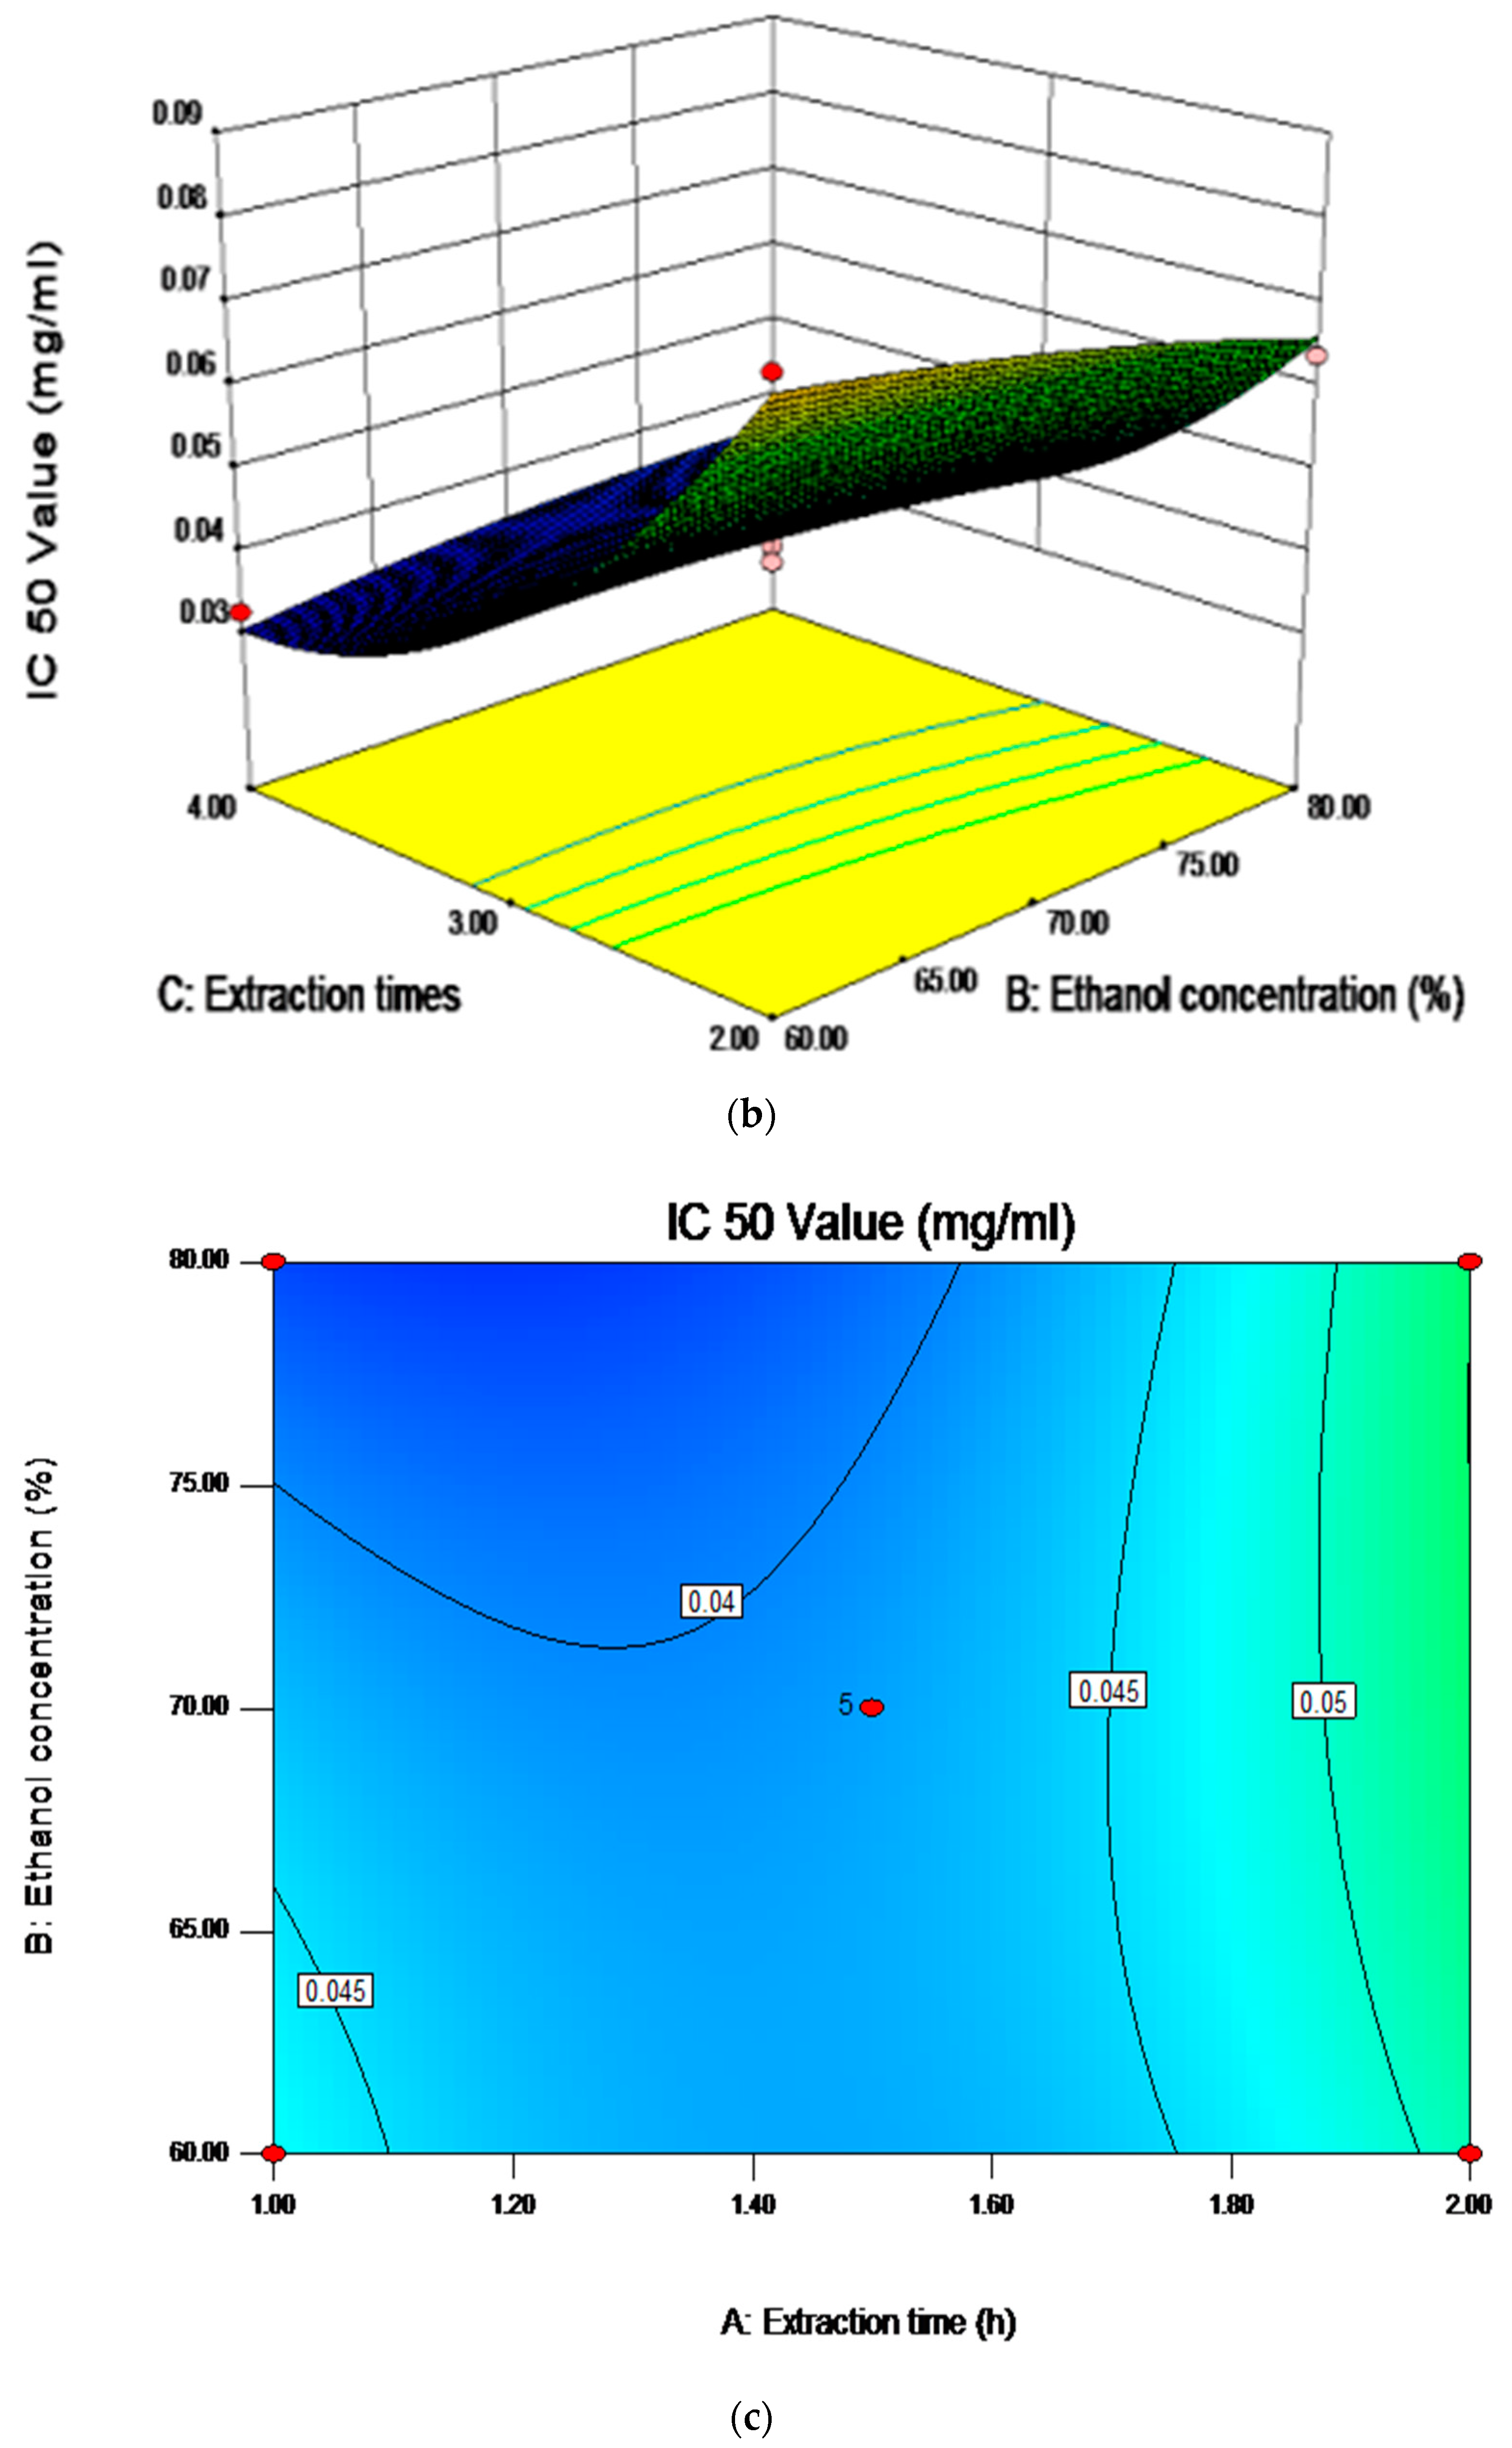
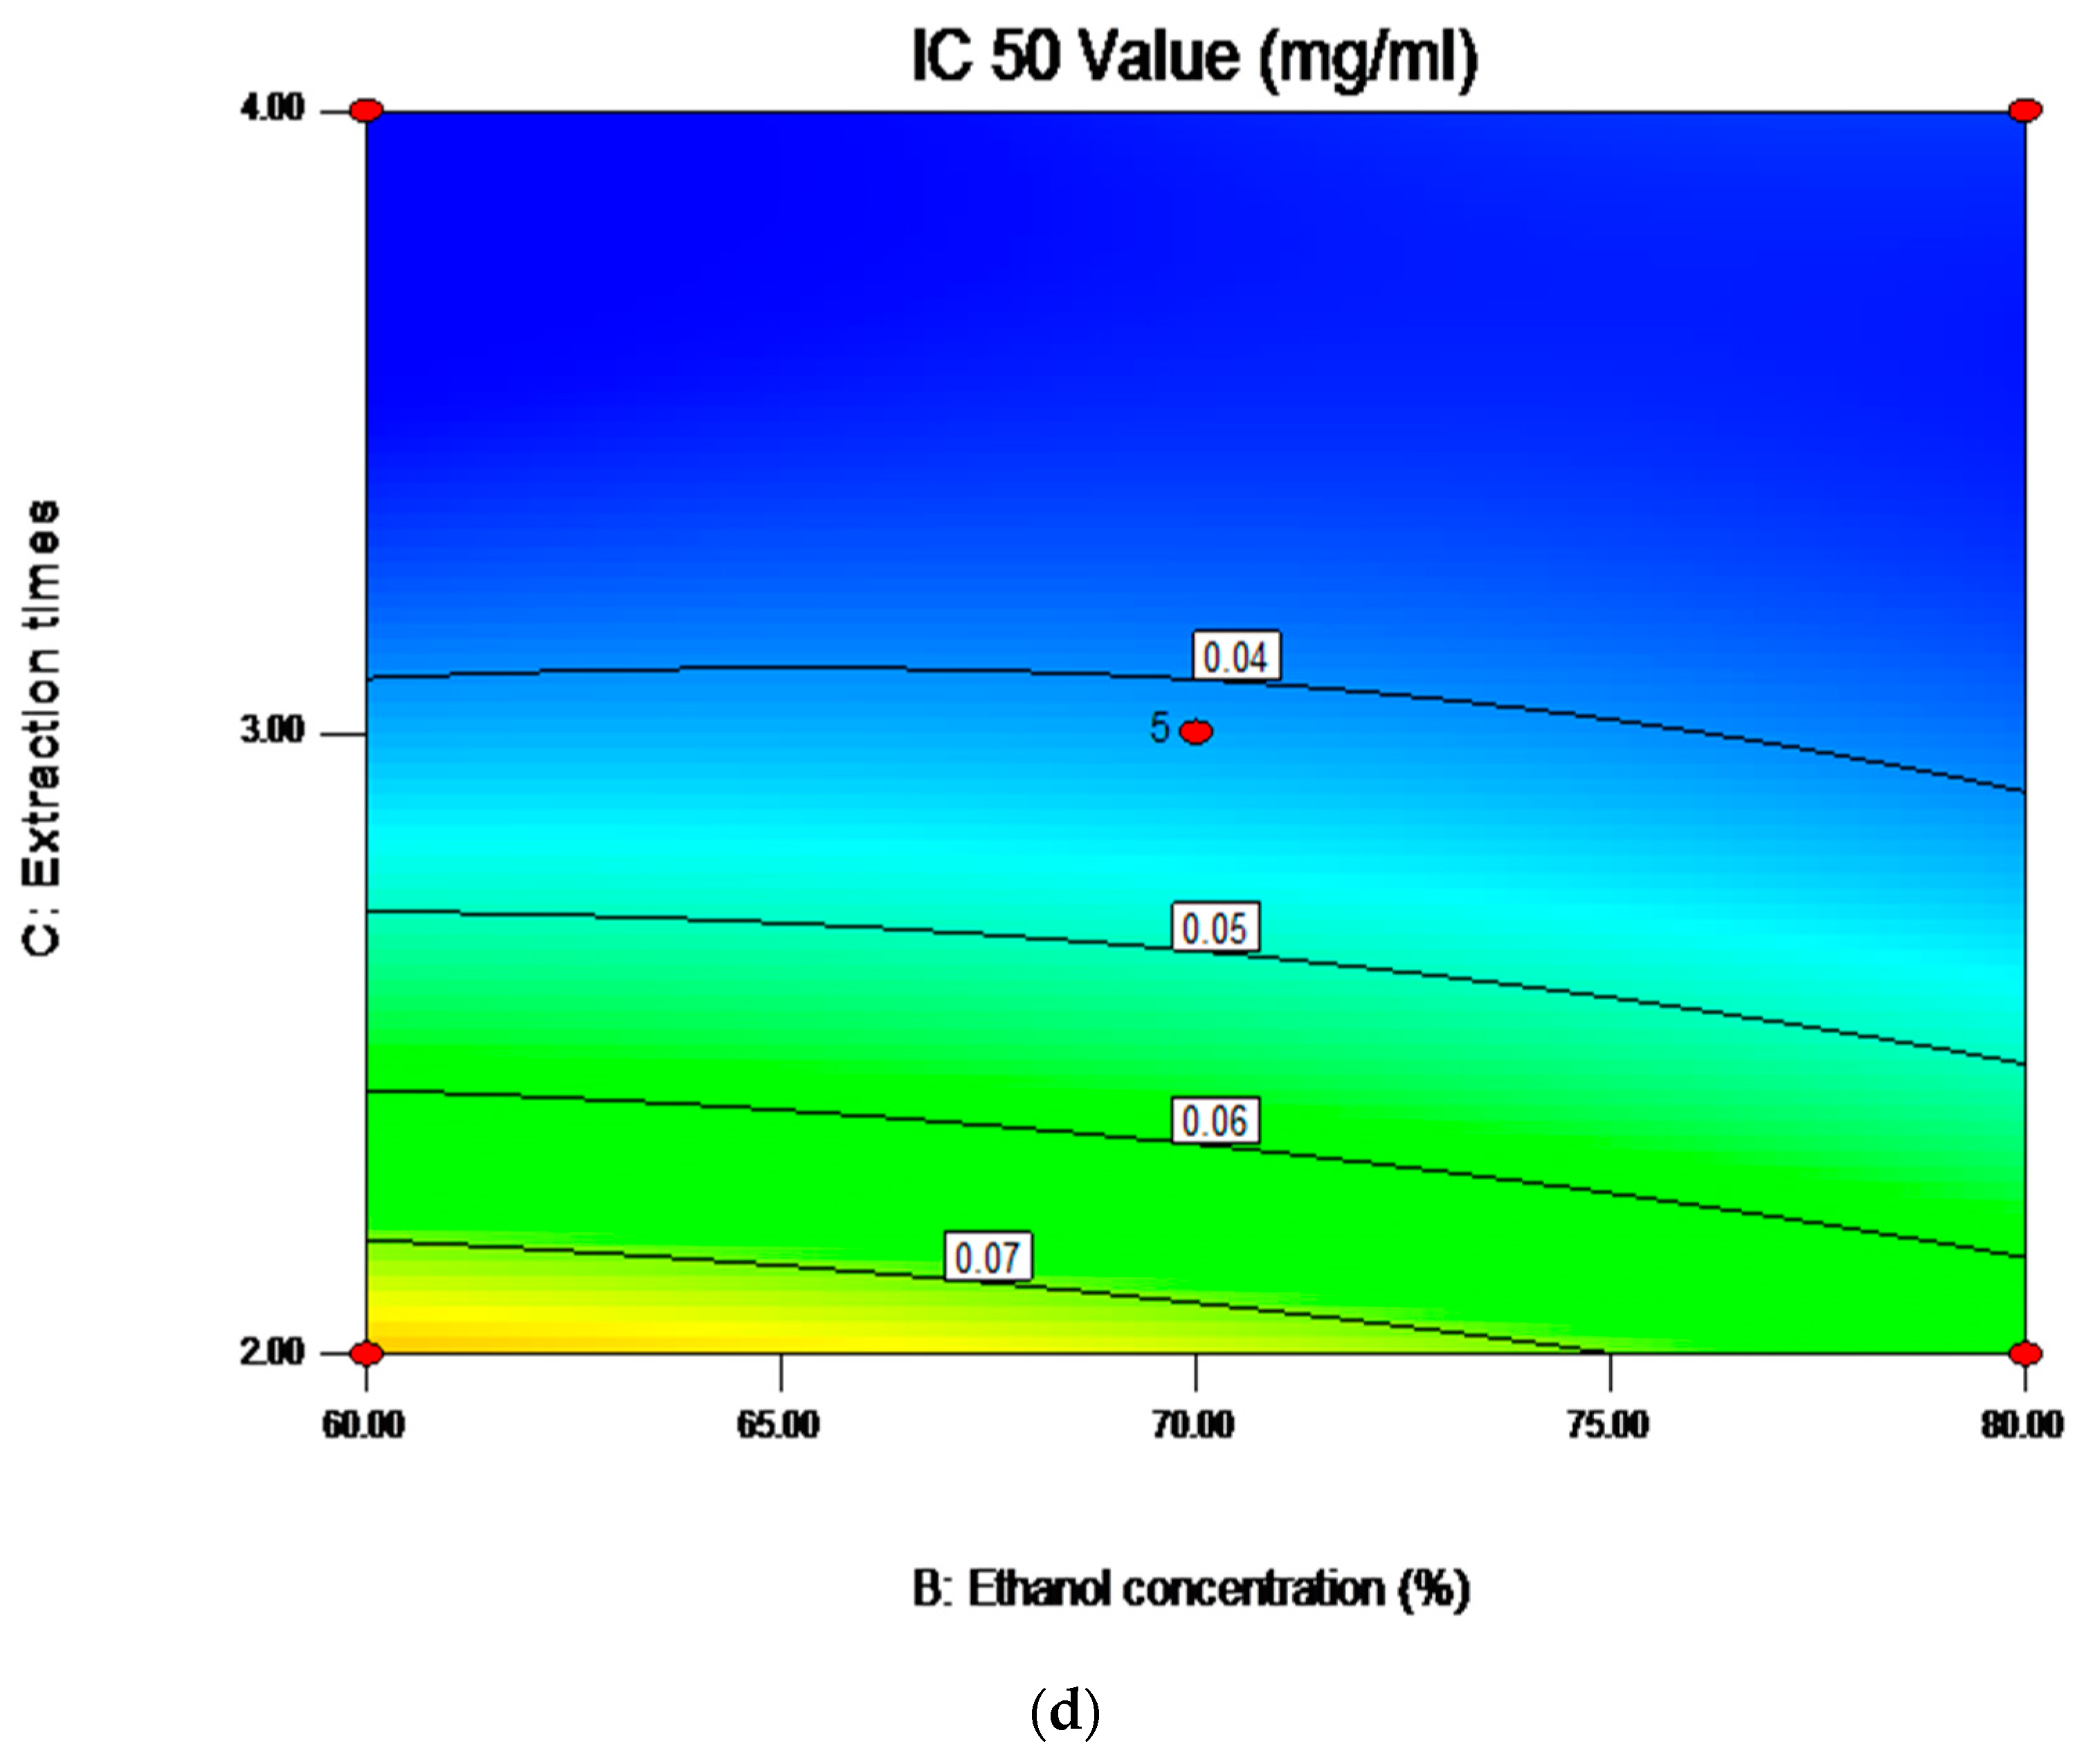
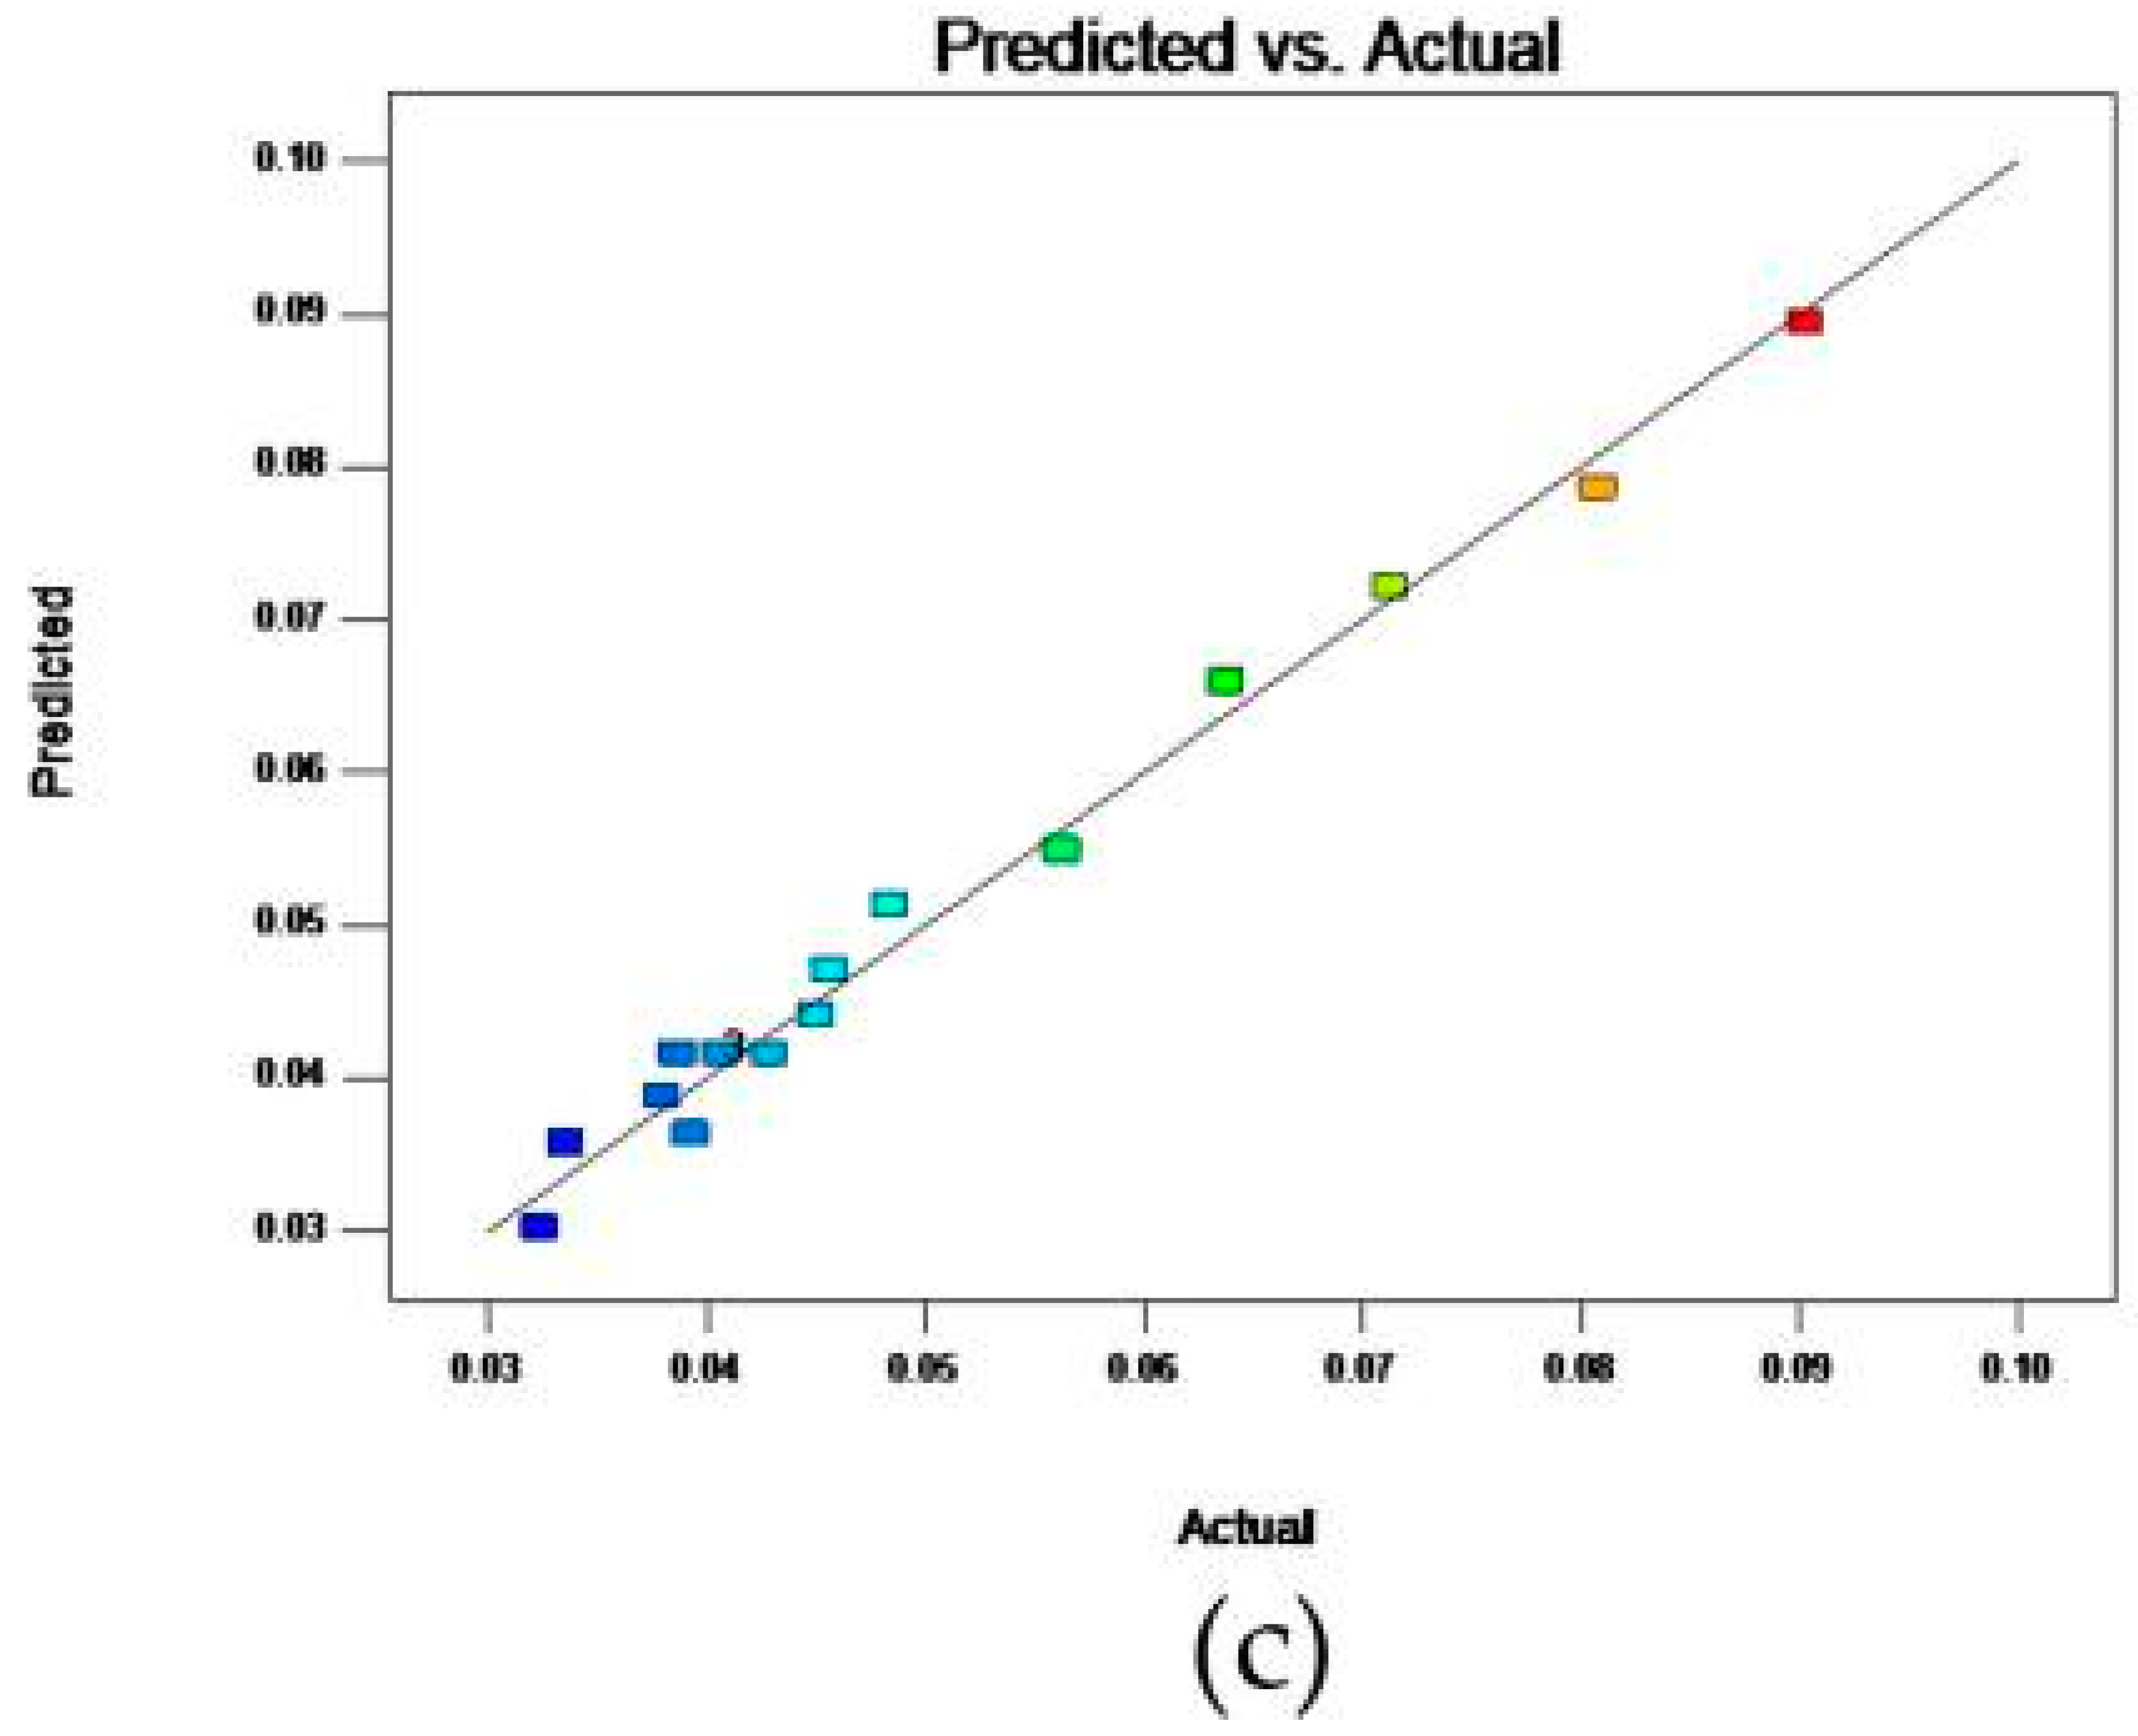
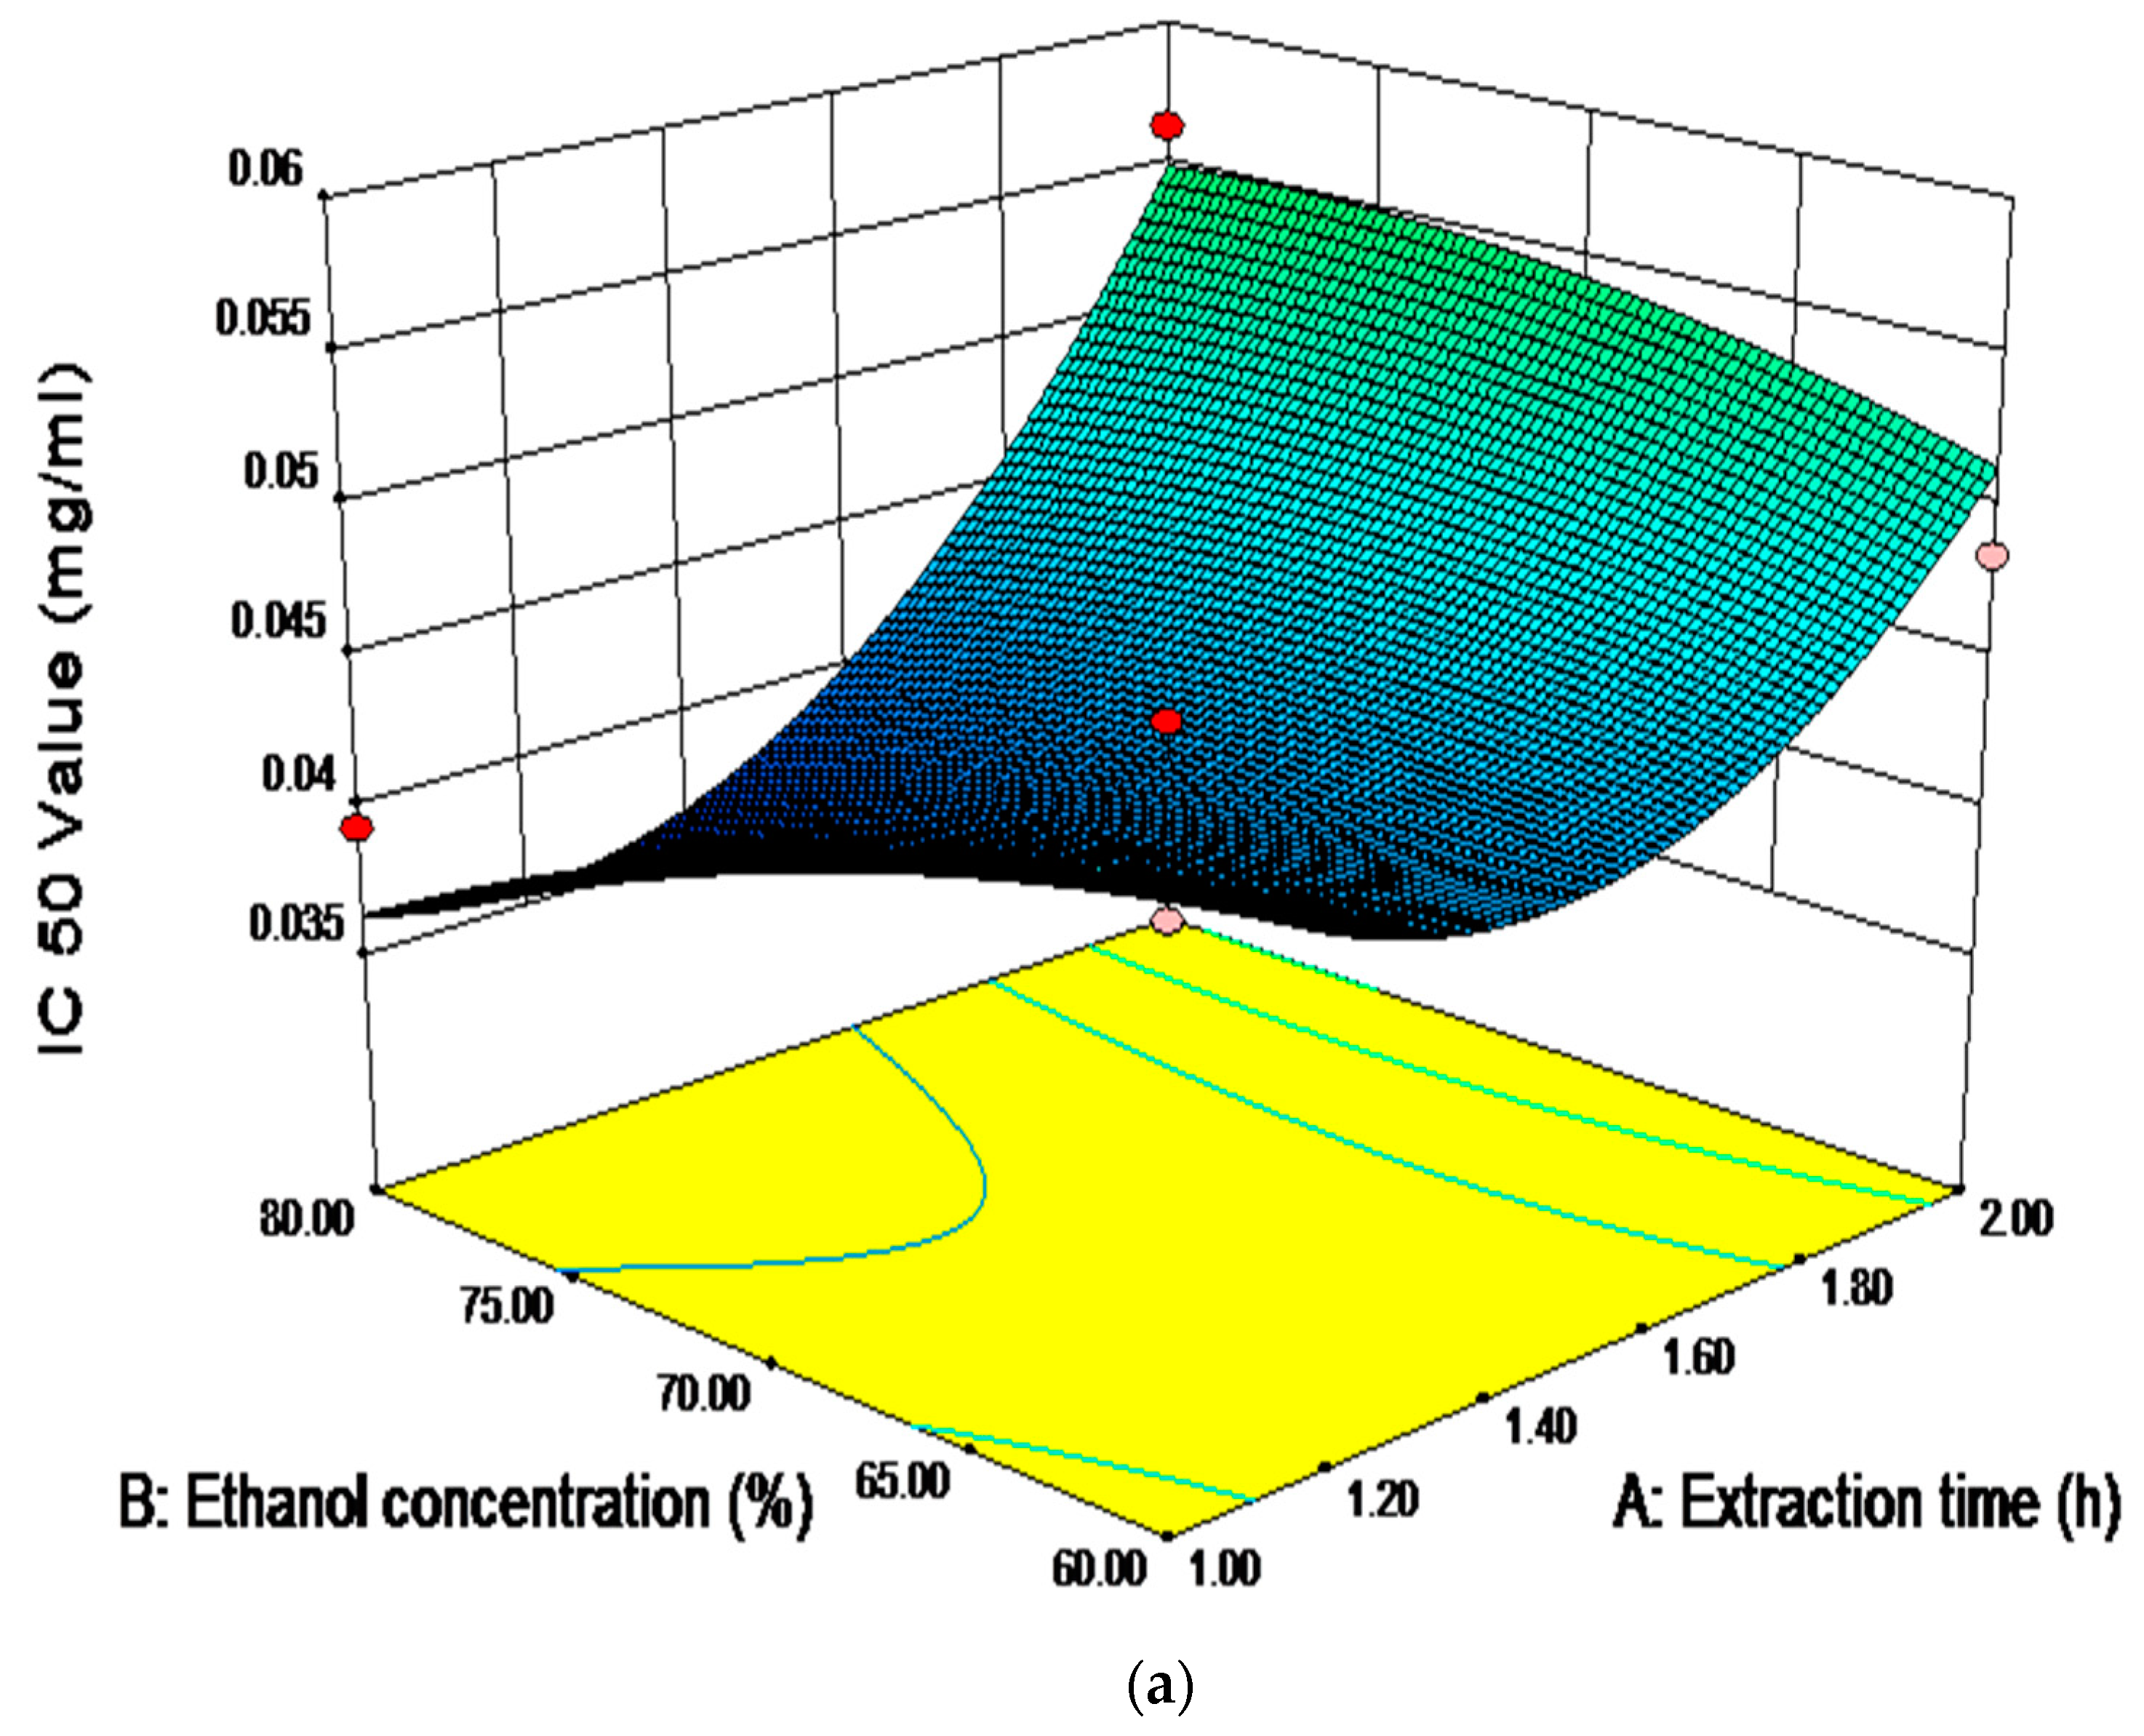
2.6. Analysis of Influence of Variables on the Antioxidant Activity
2.7. Optimization and Validation Procedures
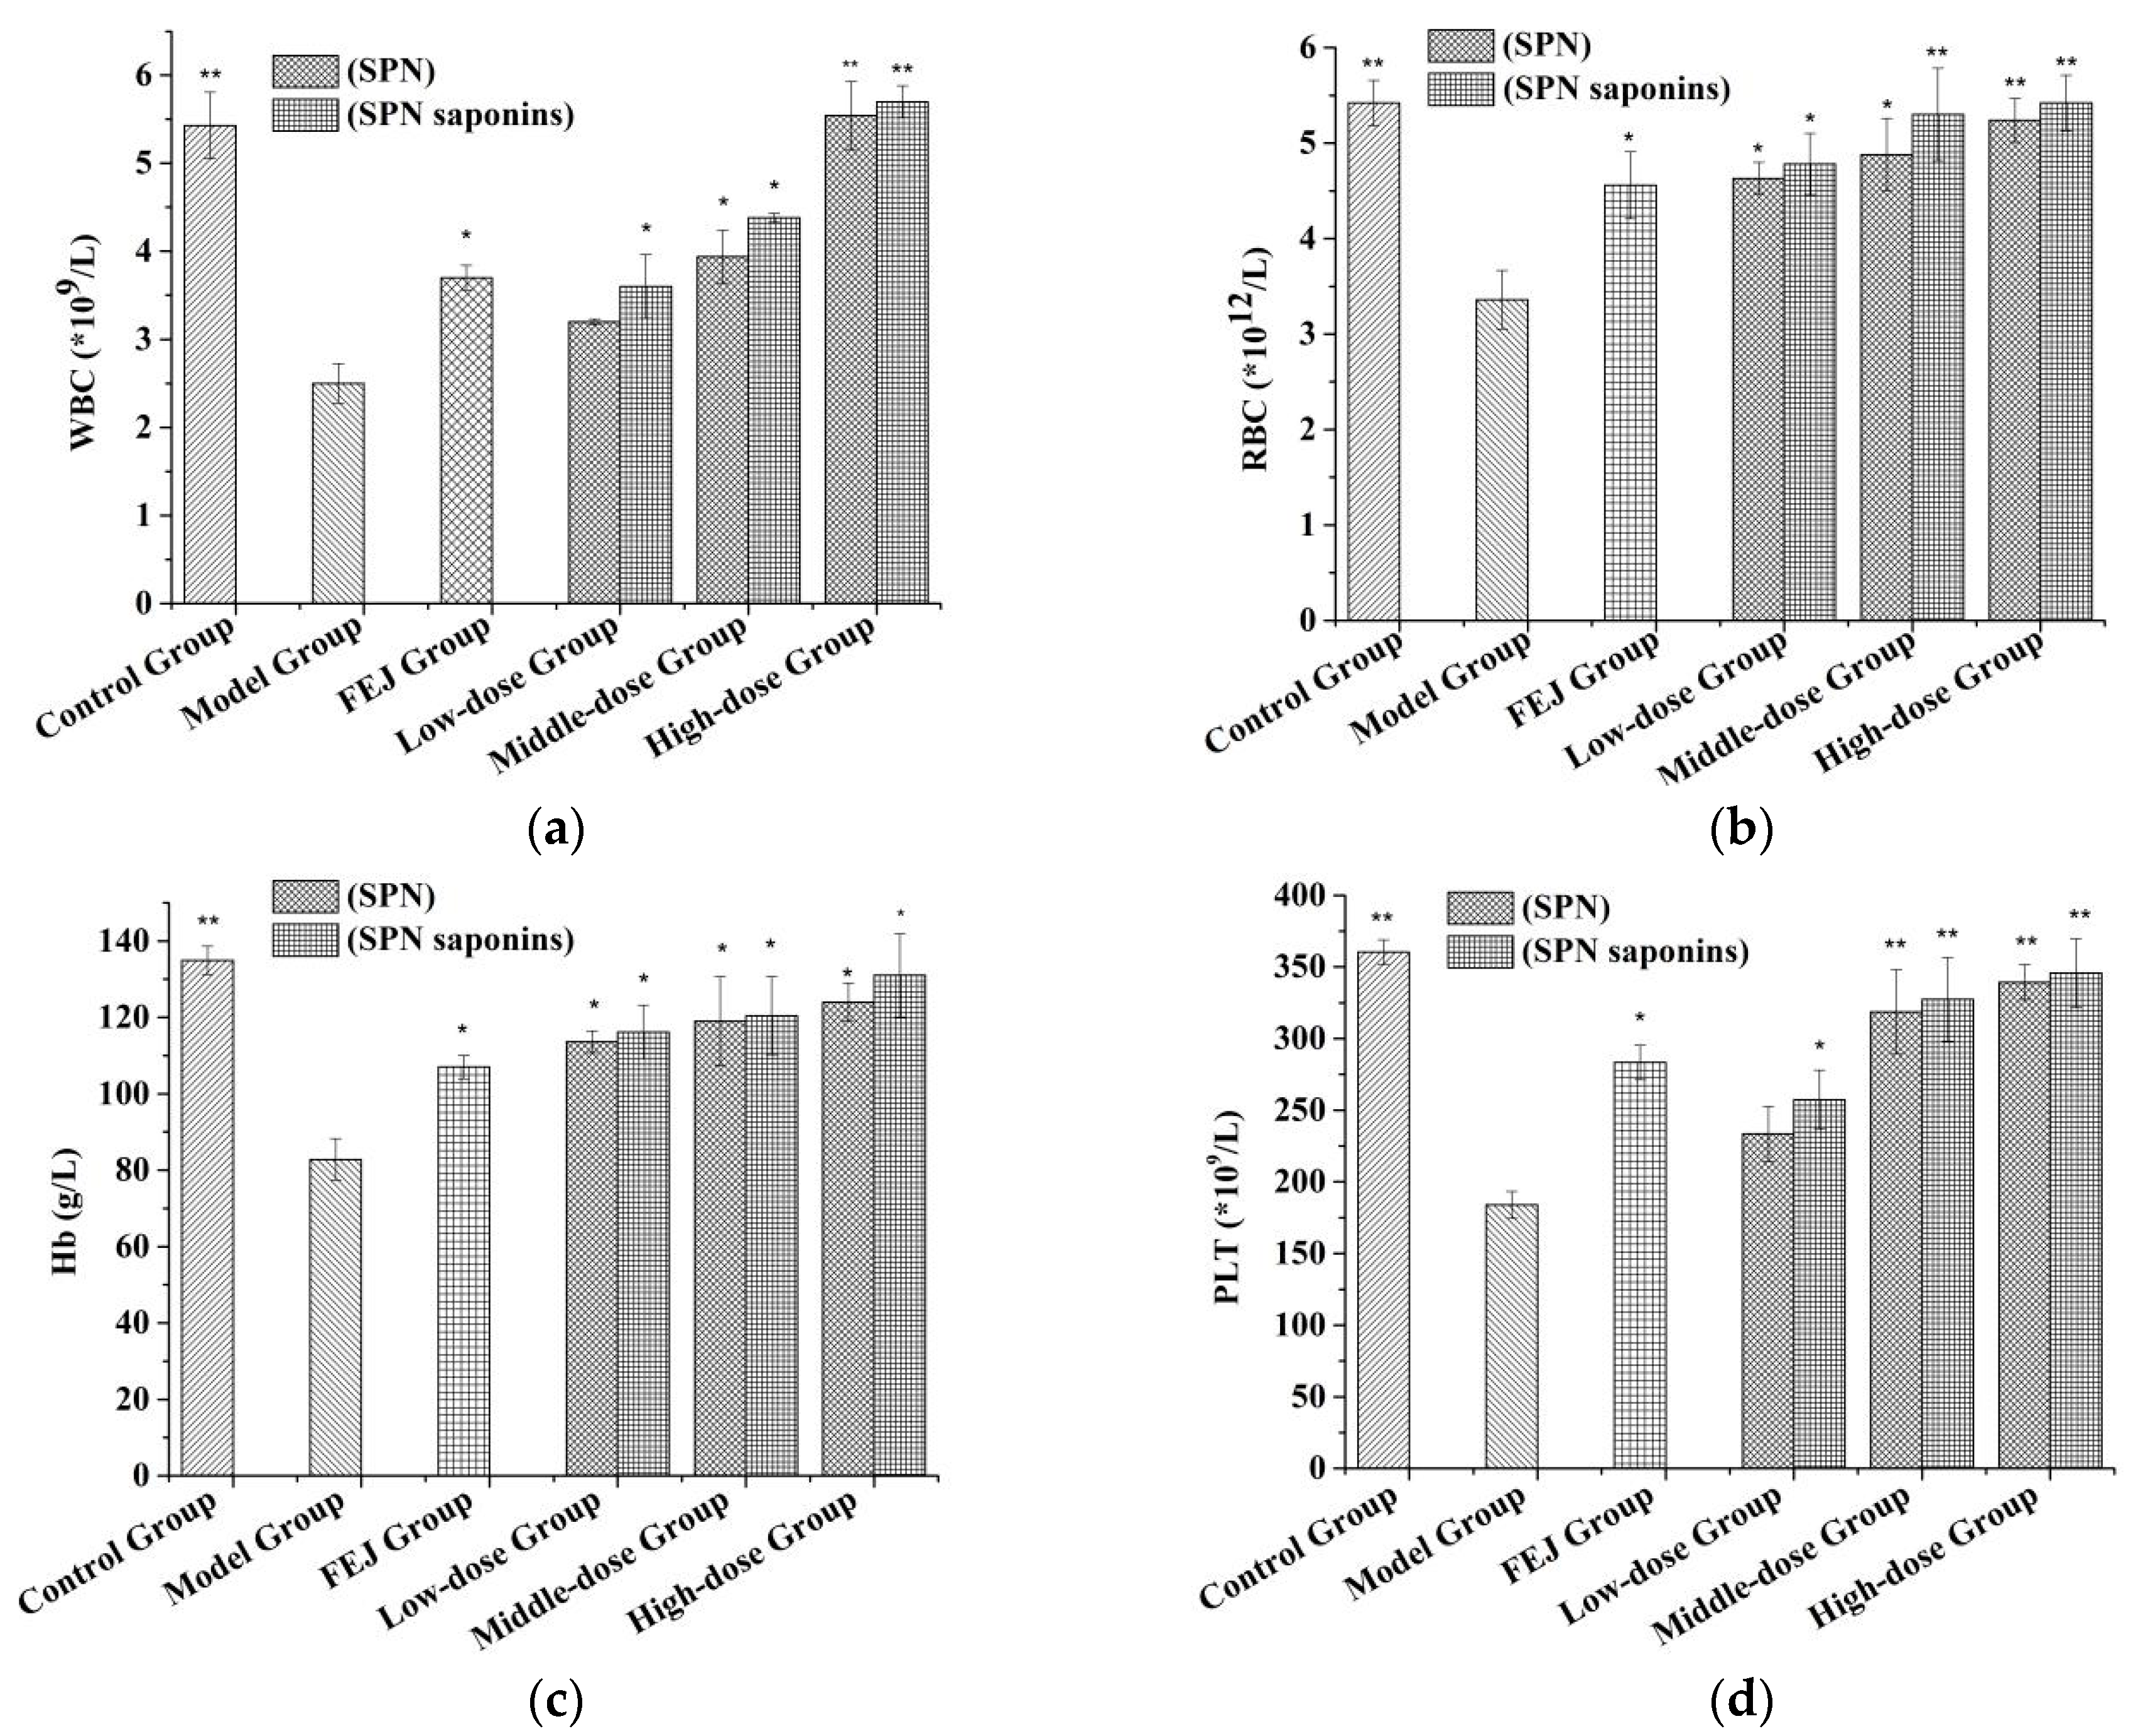
2.8. Blood Routine Test
3. Materials and Methods
3.1. Plant Material and Chemicals
3.2. Animals
3.3. Ethanol-Reflux Extraction Process
3.4. Determination of the Yield of Saponins.
3.5. Determination of the Content of Saponins
3.6. Measurement of Antioxidant Activity
3.7. BBD-RSM Experimental Design
3.8. Blood Routine Test
3.9. Statistical Analysis
4. Conclusions
Author Contributions
Acknowledgments
Conflicts of Interest
Abbreviations
| ANOVA | analysis of variance |
| AP | adequate precision |
| APH | acetylphenylhydrazine |
| BBD-RSM | Box-Behnken design response surface methodology |
| CTX | cyclophosphamide |
| Hb | hemoglobin |
| PLT | platelet |
| PN | Panax notoginseng |
| PRESS | prediction error sum of squares |
| R2 | regression coefficient |
| RBC | red blood cell |
| SPN | steamed Panax notoginseng |
| WBC | white blood cess |
References
- Wang, C.Z.; Eryn, M.E.; Sheila, W.; Wu, J.A.; Yuan, C.S. Phytochemical and analytical studies of Panax notoginseng (Burk.) F.H. Chen. J. Nat. Med. 2006, 60, 97–106. [Google Scholar] [CrossRef]
- Ng, T.B. Pharmacological activity of sanchi ginseng (Panax notoginseng). J. Pharm. Pharmacol. 2010, 58, 1007–1019. [Google Scholar] [CrossRef] [PubMed]
- Zhao, H.P.; Han, Z.P.; Li, G.W.; Zhang, S.J.; Luo, Y.M. Therapeutic potential and cellular mechanisms of Panax notoginseng on prevention of aging and cell senescence-associated diseases. A&D 2017, 8, 721–739. [Google Scholar] [CrossRef]
- Li, X.; Wang, G.; Sun, J.; Hao, H.; Xiong, Y.; Yan, B.; Zheng, Y.; Sheng, L. Pharmacokinetic and absolute bioavailability study of total Panax notoginsenoside, a typical multiple constituent traditional Chinese medicine (TCM) in rats. Biol. Pharm. Bull. 2007, 30, 847–851. [Google Scholar] [CrossRef] [PubMed]
- Liao, J.Q.; Wei, B.J.; Chen, H.W.; Liu, Y.M.; Wang, J. Bioinformatics investigation of therapeutic mechanisms of Xuesaitong capsule treating ischemic cerebrovascular rat model with comparative transcriptome analysis. Am. J. Transl. Res. 2016, 8, 2438–2449. [Google Scholar] [PubMed]
- Gu, C.; Lv, J.; Zhang, X.; Qiao, Y.; Yan, H.; Li, Y.; Wang, D.; Zhu, H.; Luo, H.; Yang, C.; Xu, M.; Zhang, Y. Triterpenoids with promoting effects on the differentiation cells from the steamed roots of Panax notoginseng. J. Nat. Prod. 2015, 78, 1829–1840. [Google Scholar] [CrossRef] [PubMed]
- Ge, F.; Huang, Z.J.; Yu, H.; Wang, Y.; Liu, D.Q. Transformation of Panax notoginseng saponins by steaming and Trichoderma longibrachiatum. Biotechnol. Biotechnol. Equip. 2015, 30, 165–172. [Google Scholar] [CrossRef]
- Sun, S.; Wang, C.Z.; Tong, R.B.; Li, X.L.; Anna, F.B.; Wang, Q.; He, T.C.; Du, W.; Yuan, C.S. Effects of steaming the root of Panax notoginseng on chemical composition and anticancer activities. Food Chem. 2010, 118, 307–314. [Google Scholar] [CrossRef]
- Toh, D.F.; Patel, D.N.; Chan, E.C.; Teo, A.; Neo, S.Y.; Koh, H.L. Anti-proliferative effects of raw and steamed extracts of Panax notoginseng and its ginsenoside constituents on human liver cancer cells. Chin. Med. 2011, 6. [Google Scholar] [CrossRef] [PubMed]
- Lau, A.J.; Toh, D.F.; Chua, T.K.; Pang, Y.K.; Woo, S.O.; Koh, H.L. Antiplatelet and anticoagulant effects of Panax notoginseng: comparison of raw and steamed Panax notoginseng with Panax ginseng and Panax quinquefolium. Ethnopharmacology 2009, 125, 380–386. [Google Scholar] [CrossRef] [PubMed]
- Xiong, Y.; Chen, L.J.; Man, J.H.; Hu, Y.P.; Cui, X.M. Chemical and bioactive comparison of Panax notoginseng root and rhizome in raw and steamed forms. J. Gins. Res. 2017, 1–9. [Google Scholar] [CrossRef]
- Xiong, Y.; Chen, L.J.; Hu, Y.P.; Cui, X.M. Uncovering active constituents responsible for different activities of raw and steamed Panax notoginseng roots. Front. Pharmacol. 2017, 8, 1–11. [Google Scholar] [CrossRef] [PubMed]
- Heydarian, M.; Jooyandeh, H.; Nasehi, B.; Noshad, M. Characterization of Hypericum perforatum, polysaccharides with antioxidant and antimicrobial activities: optimization based statistical modeling. Int. J. Biol. Macromol. 2017, 104, 287–293. [Google Scholar] [CrossRef] [PubMed]
- Li, W.; Zhao, L.C.; Sun, Y.S.; Lei, F.J.; Wang, Z.; Gui, X.B.; Wang, H. Optimization of pressurized liquid extraction of three major acetophenones from cynanchum bungei using a box-behnken design. Int. J. Mol. Sci. 2012, 13, 14533–14544. [Google Scholar] [CrossRef] [PubMed]
- Yolmeh, M.; Habibi Najafi, M.B.; Farhoosh, R. Optimisation of ultrasound-assisted extraction of natural pigment from annatto seeds by response surface methodology (RSM). Food. Chem. 2014, 155, 319–324. [Google Scholar] [CrossRef] [PubMed]
- Noshad, M.; Shahidi, F.; Mortazavi, S.A. Multi-Objective Optimization of osmotic-ultrasonic pretreatments and hot-air drying of quince using response surface methodology. Food Bioprocess Technol. 2012, 5, 2098–2110. [Google Scholar] [CrossRef]
- Wang, X.; Wu, Q.; Wu, Y.; Chen, G.; Yue, W.; Liang, Q. Response surface optimized ultrasonic-assisted extraction of flavonoids from Sparganii Rhizoma and evaluation of their in vitro antioxidant activities. Molecules 2012, 17, 6769–6783. [Google Scholar] [CrossRef] [PubMed]
- Gharibzahedi, S.M.T.; Mousavi, S.M.; Hamedi, M.; Khodaiyan, F.; Razavi, S.H. Development of an optimal formulation for oxidative stability of walnut-beverage emulsions based on gum arabic and xanthan gum using response surface methodology. Carbohydr. Polym. 2012, 87, 1611–1619. [Google Scholar] [CrossRef]
- Zhao, L.C.; Liang, J.; Li, W.; Cheng, K.M.; Xia, X.; Deng, X.; Yang, G.L. The use of response surface methodology to optimize the ultrasound-assisted extraction of five anthraquinones from Rheum palmatum L. Molecules 2011, 16, 5928–5937. [Google Scholar] [CrossRef] [PubMed]
- Chinese Pharmacopoeia Commission. Pharmacopoeia of the People’s Republic of China; Chinese Medical Science and Technology Press: Beijing, China, 2015; pp. 11–12. [Google Scholar]
- Chen, Y.; Xie, M.Y.; Gong, X.F. Microwave-assisted extraction used for the isolation of total triterpenoids saponins from Ganoderma atrum. J. Food. Eng. 2007, 81, 162–170. [Google Scholar] [CrossRef]
- Hu, T.; Guo, Y.Y.; Zhou, Q.F.; Zhong, X.K.; Zhu, L.; Piao, J.H.; Chen, J.; Jiang, J.G. Optimization of ultrasonic-assisted extraction of total saponins from Eclipta prostrasta L. using response surface methodology. J. Food Sci. 2012, 77, C975–C982. [Google Scholar] [CrossRef] [PubMed]
- Taubert, J.; Krings, U.; Berger, R.G. A comparative study on the disintegration of filamentous fungi. J. Microbiol. Meth. 2000, 42, 225–232. [Google Scholar] [CrossRef]
- Vongsangnak, W.; Jian, G.; Chauvatcharin, S.; Zhong, J.J. Towards efficient extraction of notoginseng saponins from cultured cells of Panax notoginseng. Biochem. Eng. J. 2004, 18, 115–120. [Google Scholar] [CrossRef]
- Gong, X.C.; Zhang, Y.; Pan, J.Y.; Qu, H.B. Optimization of the ethanol recycling reflux extraction process for saponins using a design space approach. PLoS ONE 2014, 9. [Google Scholar] [CrossRef] [PubMed]
- Pakrokh, G.P. The extraction process optimization of antioxidant polysaccharides from Marshmallow (Althaea officinalis L.) roots. Int. J. Biol. Macromol. 2015, 75, 51–57. [Google Scholar] [CrossRef] [PubMed]
- Yuan, Y.; Gao, Y.; Mao, L.; Zhao, J. Optimization of condition for the preparation of β-carotene nanoemulsions using response surface methodology. Food Chem. 2008, 107, 1300–1306. [Google Scholar] [CrossRef]
- Li, Q.H.; Fu, C.L. Application of response surface methodology for extraction optimization of germinant pumpkin seeds protein. Food Chem. 2005, 92, 701–706. [Google Scholar] [CrossRef]
- Ghasemlou, M.; Khodaiyan, F.; Jahanbin, K.; Gharibzahedi, S.M.; Taheri, S. Structural investigation and response surface optimisation for improvement of kefiran production yield from a low-cost culture medium. Food. Chem. 2002, 133, 383–389. [Google Scholar] [CrossRef] [PubMed]
- Nath, A.; Chattopadhyay, P.K. Optimization of oven toasting for improving crispness and other quality attributes of ready to eat potato-soy snack using response surface methodology. J. Food Eng. 2007, 80, 1282–1292. [Google Scholar] [CrossRef]
- Gan, C.Y.; Manaf, H.A.; Latiff, A.A. Optimization of alcohol insoluble polysaccharides (AIPS) extraction from the Parkia speciosa pod using response surface methodology (RSM). Carbohydr. Polym. 2010, 79, 825–831. [Google Scholar] [CrossRef]
- Zhao, G.R.; Xiang, Z.J.; Ye, T.X.; Juan, Y.J.; Guo, Z.X. Antioxidant activities of Salvia miltiorrhiza and Panax notoginseng. Food. Chem. 2006, 99, 767–774. [Google Scholar] [CrossRef]
- Yim, T.K.; Ko, K.M. Antioxidant and immunomodulatory activities of chinese tonifying herbs. Pharm. Biol. 2002, 40, 329–335. [Google Scholar] [CrossRef]
- Roberto, M.; Samantha, R.V.; Novella, B.; Roberto, L.S. Fenton-dependent damage to carbohydrates: free radical scavenging activity of some simple sugars. J. Agric. Food. Chem. 2003, 51, 7418–7425. [Google Scholar] [CrossRef]
- Shi, X.Q.; Shang, E.X.; Tang, Y.P.; Zhu, H.X.; Guo, J.M.; Huang, M.Y.; Li, W.X.; Duan, J.A. Interaction of nourishing and tonifying blood effects of the combination of Angelicae sinensis Radix and Astragali Radix studied by response surface method. Acta. Pharm. Sin. 2012, 47, 1375–1383. [Google Scholar]
Sample Availability: Samples of the reference standards mentioned in the paper are available from the authors. |


| Independent Variables | Unit | Symbol | Coded Levels | ||
|---|---|---|---|---|---|
| –1 | 0 | +1 | |||
| Extraction time | min | X1 | 60 | 90 | 120 |
| Ethanol concentration | % | X2 | 60 | 70 | 80 |
| Times of extraction | X3 | 2 | 3 | 4 | |
| Treatment Number | Extraction Time (h) | Ethanol Concentration (%) | Times of Extraction | Content of Saponins (mg/g) | Dry Extract Yield (%) | EC50 Value (mg/mL) |
|---|---|---|---|---|---|---|
| 1 | 1.00 | 80.00 | 3.00 | 73.16 ± 0.058 | 28.08 ± 0.038 | 0.0393 ± 0.0006 |
| 2 | 1.50 | 80.00 | 2.00 | 62.81 ± 0.069 | 28.13 ± 0.026 | 0.0638 ± 0.0005 |
| 3 | 1.50 | 70.00 | 3.00 | 68.96 ± 0.072 | 31.13 ± 0.019 | 0.0407 ± 0.0008 |
| 4 | 1.50 | 70.00 | 3.00 | 69.81 ± 0.135 | 31.50 ± 0.0017 | 0.0429 ± 0.0006 |
| 5 | 2.00 | 80.00 | 3.00 | 64.97 ± 0.046 | 29.58 ± 0.023 | 0.0563 ± 0.0005 |
| 6 | 2.00 | 70.00 | 2.00 | 57.83 ± 0.083 | 29.96 ± 0.026 | 0.0903 ± 0.0009 |
| 7 | 1.50 | 70.00 | 3.00 | 71.05 ± 0.122 | 31.04 ± 0.057 | 0.0429 ± 0.0004 |
| 8 | 2.00 | 60.00 | 3.00 | 67.55 ± 0.096 | 31.71 ± 0.049 | 0.0484 ± 0.0007 |
| 9 | 1.50 | 60.00 | 4.00 | 75.76 ± 0.073 | 32.19 ± 0.025 | 0.0324 ± 0.0005 |
| 10 | 1.00 | 70.00 | 4.00 | 71.62 ± 0.108 | 30.58 ± 0.027 | 0.0380 ± 0.0005 |
| 11 | 1.50 | 80.00 | 4.00 | 72.62 ± 0.125 | 30.38 ± 0.018 | 0.0336 ± 0.0006 |
| 12 | 1.00 | 60.00 | 3.00 | 68.08 ± 0.098 | 31.49 ± 0.043 | 0.0457 ± 0.0008 |
| 13 | 2.00 | 70.00 | 4.00 | 69.6 ± 0.062 | 31.25 ± 0.025 | 0.0450 ± 0.0009 |
| 14 | 1.00 | 70.00 | 2.00 | 60.32 ± 0.085 | 28.67 ± 0.036 | 0.0713 ± 0.0011 |
| 15 | 1.50 | 70.00 | 3.00 | 70.65 ± 0.094 | 31.50 ± 0.054 | 0.0429 ± 0.0006 |
| 16 | 1.50 | 60.00 | 2.00 | 59.96 ± 0.067 | 30.38 ± 0.075 | 0.0808 ± 0.0012 |
| 17 | 1.50 | 70.00 | 3.00 | 70.22 ± 0.083 | 30.50 ± 0.026 | 0.0387 ± 0.0008 |
| Treatment Number | R1 (mg/g) | Rg1 (mg) | Rb1 (mg/g) | Re (mg/g) | Rd (mg/g) | Rh1 (mg/g) | Rk3 (mg/g) | Rh4 (mg/g) | 20(R)-Rg3 (mg/g) | 20(S)-Rg3 (mg/g) |
|---|---|---|---|---|---|---|---|---|---|---|
| 1 | 4.71 ± 0.075 | 18.51 ± 0.163 | 17.29 ± 0.132 | 2.57 ± 0.036 | 6.76 ± 0.079 | 0.12 ± 0.025 | 6.78 ± 0.098 | 11.41 ± 0.125 | 1.87 ± 0.028 | 3.14 ± 0.053 |
| 2 | 3.72 ± 0.036 | 14.53 ± 0.172 | 15.54 ± 0.195 | 1.92 ± 0.063 | 5.63 ± 0.138 | 0.05 ± 0.009 | 6.70 ± 0.084 | 9.50 ± 0.112 | 2.87 ± 0.096 | 2.35 ± 0.107 |
| 3 | 5.25 ± 0.052 | 21.52 ± 0.164 | 17.94 ± 0.118 | 3.30 ± 0.082 | 6.55 ± 0.125 | 0.15 ± 0.019 | 4.02 ± 0.043 | 7.64 ± 0.124 | 0.77 ± 0.086 | 1.84 ± 0.097 |
| 4 | 5.55 ± 0.068 | 21.79 ± 0.155 | 17.41 ± 0.184 | 3.11 ± 0.065 | 5.78 ± 0.153 | 0.14 ± 0.008 | 4.57 ± 0.052 | 7.61 ± 0.098 | 1.34 ± 0.052 | 2.53 ± 0.025 |
| 5 | 3.91 ± 0.034 | 17.17 ± 0.125 | 16.28 ± 0.185 | 2.28 ± 0.083 | 5.64 ± 0.126 | 0.11 ± 0.007 | 5.69 ± 0.086 | 9.76 ± 0.153 | 1.47 ± 0.036 | 2.65 ± 0.026 |
| 6 | 1.12 ± 0.025 | 10.52 ± 0.126 | 14.09 ± 0.208 | 1.69 ± 0.057 | 5.17 ± 0.134 | 0.03 ± 0.002 | 6.85 ± 0.068 | 12.53 ± 0.209 | 2.39 ± 0.058 | 3.43 ± 0.053 |
| 7 | 5.46 ± 0.086 | 23.35 ± 0.126 | 18.85 ± 0.152 | 3.43 ± 0.084 | 6.10 ± 0.275 | 0.12 ± 0.011 | 4.12 ± 0.045 | 6.86 ± 0.095 | 0.83 ± 0.063 | 1.93 ± 0.087 |
| 8 | 4.83 ± 0.047 | 19.78 ± 0.165 | 15.98 ± 0.126 | 3.16 ± 0.096 | 5.15 ± 0.159 | 0.13 ± 0.023 | 5.40 ± 0.058 | 9.36 ± 0.089 | 1.27 ± 0.086 | 2.48 ± 0.082 |
| 9 | 5.63 ± 0.058 | 20.62 ± 0.396 | 18.05 ± 0.151 | 3.15 ± 0.113 | 6.72 ± 0.223 | 0.13 ± 0.008 | 6.25 ± 0.066 | 10.85 ± 0.103 | 1.58 ± 0.032 | 2.78 ± 0.096 |
| 10 | 4.85 ± 0.063 | 18.99 ± 0.154 | 17.51 ± 0.185 | 3.06 ± 0.079 | 6.53 ± 0.128 | 0.12 ± 0.007 | 6.04 ± 0.059 | 10.54 ± 0.108 | 1.25 ± 0.025 | 2.71 ± 0.057 |
| 11 | 4.15 ± 0.035 | 21.09 ± 0.157 | 17.87 ± 0.182 | 3.30 ± 0.102 | 5.56 ± 0.135 | 0.16 ± 0.005 | 5.88 ± 0.048 | 10.23 ± 0.099 | 1.53 ± 0.041 | 2.85 ± 0.035 |
| 12 | 4.93 ± 0.028 | 20.19 ± 0.065 | 17.37 ± 0.093 | 2.52 ± 0.094 | 5.76 ± 0.124 | 0.13 ± 0.009 | 5.00 ± 0.038 | 8.64 ± 0.075 | 1.22 ± 0.086 | 2.32 ± 0.026 |
| 13 | 5.06 ± 0.096 | 21.69 ± 0.182 | 17.87 ± 0.133 | 3.32 ± 0.087 | 5.84 ± 0.119 | 0.12 ± 0.006 | 4.73 ± 0.086 | 7.98 ± 0.082 | 0.94 ± 0.023 | 2.05 ± 0.345 |
| 14 | 2.22 ± 0.025 | 11.19 ± 0.168 | 14.28 ± 0.182 | 1.85 ± 0.058 | 5.25 ± 0.132 | 0.06 ± 0.002 | 6.93 ± 0.073 | 12.63 ± 0.096 | 2.45 ± 0.055 | 3.47 ± 0.182 |
| 15 | 5.50 ± 0.125 | 23.04 ± 0.154 | 18.40 ± 0.121 | 3.37 ± 0.106 | 6.48 ± 0.157 | 0.12 ± 0.011 | 4.17 ± 0.021 | 6.82 ± 0.135 | 0.81 ± 0.062 | 1.92 ± 0.069 |
| 16 | 1.90 ± 0.019 | 10.94 ± 0.096 | 14.60 ± 0.086 | 1.13 ± 0.048 | 5.15 ± 0.122 | 0.04 ± 0.002 | 7.27 ± 0.102 | 13.08 ± 0.152 | 2.39 ± 0.096 | 3.45 ± 0.122 |
| 17 | 5.15 ± 0.097 | 21.82 ± 0.193 | 18.14 ± 0.063 | 3.31 ± 0.115 | 5.90 ± 0.112 | 0.11 ± 0.005 | 4.65 ± 0.083 | 7.81 ± 0.096 | 0.96 ± 0.025 | 2.06 ± 0.083 |
| Source (Yield of Saponins) | Sum of Squares | DF | Mean Square | F Value | p-Value |
|---|---|---|---|---|---|
| Model | 27.03 | 9 | 3.00 | 24.33 | 0.0002 |
| X1 | 2.17 | 1 | 2.17 | 17.61 | 0.0041 |
| X2 | 14.88 | 1 | 14.88 | 120.54 | <0.0001 |
| X3 | 5.22 | 1 | 5.22 | 42.26 | 0.0003 |
| X12 | 0.80 | 1 | 6.49 | 6.49 | 0.0382 |
| X13 | 0.096 | 1 | 0.78 | 0.78 | 0.4060 |
| X23 | 0.032 | 1 | 0.26 | 0.26 | 0.6242 |
| X12 | 1.05 | 1 | 8.47 | 8.47 | 0.0227 |
| X22 | 1.24 | 1 | 10.07 | 10.07 | 0.0156 |
| X32 | 1.14 | 1 | 9.25 | 9.25 | 0.0188 |
| Residual | 0.86 | 7 | 0.12 | ||
| Lack of fit | 0.19 | 3 | 0.062 | 0.36 | 0.7837 |
| Pure error | 0.68 | 4 | 0.17 | ||
| Cor total | 27.89 | 16 | |||
| R2 | 0.9690 0.9292 1.16 16.965 | ||||
| R2adj | |||||
| CV | |||||
| AP | |||||
| Source (Content of Saponins) | Sum of Squares | DF | Mean Square | F-Value | p-Value |
|---|---|---|---|---|---|
| Model | 406.03 | 9 | 45.11 | 47.91 | <0.0001 |
| X1 | 21.88 | 1 | 21.88 | 23.24 | 0.0019 |
| X2 | 0.61 | 1 | 0.61 | 0.65 | 0.4472 |
| X3 | 296.22 | 1 | 296.22 | 314.61 | <0.0001 |
| X12 | 14.67 | 1 | 14.67 | 15.58 | 0.0056 |
| X13 | 0.055 | 1 | 0.055 | 0.059 | 0.8156 |
| X23 | 8.97 | 1 | 8.97 | 9.53 | 0.0177 |
| X12 | 22.69 | 1 | 22.69 | 24.10 | 0.0017 |
| X22 | 1.64 | 1 | 1.64 | 1.74 | 0.2288 |
| X32 | 37.24 | 1 | 37.24 | 39.55 | 0.0004 |
| Residual | 6.59 | 7 | 0.94 | ||
| Lack of fit | 3.99 | 3 | 1.33 | 2.05 | 0.2493 |
| Pure error | 2.60 | 4 | 0.65 | ||
| Cor total | 412.62 | 16 | |||
| R2 | 0.9840 0.9635 1.43 24.331 | ||||
| R2adj | |||||
| CV | |||||
| AP | |||||
| Source (Antioxidant Activity) | Sum of Squares | DF | Mean Square | F-Value | p-Value |
|---|---|---|---|---|---|
| Model | 4.448 × 10⁻³ | 9 | 4.942 × 10⁻⁴ | 61.06 | <0.0001 |
| X1 | 2.611 × 10⁻⁴ | 1 | 2.611 × 10⁻⁴ | 32.25 | 0.0008 |
| X2 | 2.556 × 10⁻⁵ | 1 | 2.556 × 10⁻⁵ | 3.16 | 0.1188 |
| X3 | 3.089 × 10⁻³ | 1 | 3.089 × 10⁻³ | 381.62 | <0.0001 |
| X12 | 5.112 × 10⁻⁵ | 1 | 5.112 × 10⁻⁵ | 6.32 | 0.0402 |
| X13 | 3.600 × 10⁻⁵ | 1 | 3.600 × 10⁻⁵ | 4.45 | 0.0729 |
| X23 | 8.281 × 10⁻⁵ | 1 | 8.281 × 10⁻⁵ | 10.23 | 0.0151 |
| X12 | 2.154 × 10⁻⁴ | 1 | 2.154 × 10⁻⁴ | 26.61 | 0.0013 |
| X22 | 7.645 × 10⁻⁶ | 1 | 7.645 × 10⁻⁶ | 0.94 | 0.3635 |
| X32 | 6.451 × 10⁻⁴ | 1 | 6.451 × 10⁻⁴ | 79.69 | <0.0001 |
| Residual | 5.666 × 10⁻⁵ | 7 | 8.094 × 10⁻⁶ | ||
| Lack of fit | 4.237 × 10⁻⁵ | 3 | 1.412 × 10⁻⁵ | 3.95 | 0.1087 |
| Pure error | 1.429 × 10⁻⁵ | 4 | 3.572 × 10⁻⁶ | ||
| Cor total | 4.505 × 10⁻³ | 16 | |||
| R2 | 0.9874 0.9713 5.67 27.165 | ||||
| R2adj | |||||
| CV | |||||
| AP | |||||
© 2018 by the authors. Licensee MDPI, Basel, Switzerland. This article is an open access article distributed under the terms and conditions of the Creative Commons Attribution (CC BY) license (http://creativecommons.org/licenses/by/4.0/).
Share and Cite
Hu, Y.; Cui, X.; Zhang, Z.; Chen, L.; Zhang, Y.; Wang, C.; Yang, X.; Qu, Y.; Xiong, Y. Optimisation of Ethanol-Reflux Extraction of Saponins from Steamed Panax notoginseng by Response Surface Methodology and Evaluation of Hematopoiesis Effect. Molecules 2018, 23, 1206. https://doi.org/10.3390/molecules23051206
Hu Y, Cui X, Zhang Z, Chen L, Zhang Y, Wang C, Yang X, Qu Y, Xiong Y. Optimisation of Ethanol-Reflux Extraction of Saponins from Steamed Panax notoginseng by Response Surface Methodology and Evaluation of Hematopoiesis Effect. Molecules. 2018; 23(5):1206. https://doi.org/10.3390/molecules23051206
Chicago/Turabian StyleHu, Yupiao, Xiuming Cui, Zejun Zhang, Lijuan Chen, Yiming Zhang, Chengxiao Wang, Xiaoyan Yang, Yuan Qu, and Yin Xiong. 2018. "Optimisation of Ethanol-Reflux Extraction of Saponins from Steamed Panax notoginseng by Response Surface Methodology and Evaluation of Hematopoiesis Effect" Molecules 23, no. 5: 1206. https://doi.org/10.3390/molecules23051206
APA StyleHu, Y., Cui, X., Zhang, Z., Chen, L., Zhang, Y., Wang, C., Yang, X., Qu, Y., & Xiong, Y. (2018). Optimisation of Ethanol-Reflux Extraction of Saponins from Steamed Panax notoginseng by Response Surface Methodology and Evaluation of Hematopoiesis Effect. Molecules, 23(5), 1206. https://doi.org/10.3390/molecules23051206