Article

Monitoring of the Apple Fruit Moth: Detection of Genetic Variation and Structure Applying a Novel Multiplex Set of 19 STR Markers

1
NIBIO, Norwegian Institute of Bioeconomy Research, Hoghskoleveien 7, N-1431 Aas, Norway
2
NIBIO, Norwegian Institute of Bioeconomy Research, Svanhovd, N-9925 Svanvik, Norway
*
Authors to whom correspondence should be addressed.
Molecules 2018, 23(4), 850; https://doi.org/10.3390/molecules23040850
Submission received: 23 February 2018 / Revised: 3 April 2018 / Accepted: 5 April 2018 / Published: 8 April 2018

Abstract

:
The apple fruit moth Argyresthia conjugella (Lepidoptera, Yponomeutidae) is a seed predator of rowan (Sorbus aucuparia) and is distributed in Europe and Asia. In Fennoscandia (Finland, Norway and Sweden), rowan fruit production is low every 2–4 years, and apple (Malus domestica) functions as an alternative host, resulting in economic loss in apple crops in inter-mast years. We have used Illumina MiSeq sequencing to identify a set of 19 novel tetra-nucleotide short tandem repeats (STRs) in Argyresthia conjugella. Such motifs are recommended for genetic monitoring, which may help to determine the eco-evolutionary processes acting on this pest insect. The 19 STRs were optimized and amplified into five multiplex PCR reactions. We tested individuals collected from Norway and Sweden (n = 64), and detected very high genetic variation (average 13.6 alleles, He = 0.75) compared to most other Lepidoptera species studied so far. Spatial genetic differentiation was low and gene flow was high in the test populations, although two non-spatial clusters could be detected. We conclude that this set of genetic markers may be a useful resource for population genetic monitoring of this economical important insect species.

1. Introduction

The apple fruit moth Argyresthia conjugella (Lepidoptera, Yponomeutidae; Zeller 1839) is a seed predator of rowan (Sorbus aucuparia). Argyresthia conjugella is small moth distributed in Europe and Asia [1,2], but the species has also been reported in North America [3]. The life cycle of Argyresthia conjugella is univoltine. This insect was detected as a crop pest for the first time in Norway in 1899 following an epidemic attack on apple [4]. Rowan also known as mountain-ash is a forest tree that grows up to 15 meters in height and belong to Rosaceae family. In Fennoscandia (Finland, Norway and Sweden), rowan fruit production shows large fluctuations and is low every 2–4 years [5]. In these inter-mast years, female apple fruit moths are forced to search for alternative hosts and nearby apple (Malus domestica) plantations are especially vulnerable [5,6,7]. Rowan and apple are both rosaceous plant and their fruits give off many of the same volatile compounds. These similarities may be the reason for the Argyresthia conjugella host switch from rowan to apple [6]. For this reason, the apple fruit moth is regarded as a serious insect pest of apple crops in Fennoscandia and can in extreme years devastate the entire apple crop [5]. In Norway, reduced pesticide use against Argyresthia conjugella was achieved by introducing a forecasting system that monitors rowan masting, the moth population, and its natural enemies [8]. Despite its economic importance, the genetic structure, diversity, genetic exchange and the eco-evolutionary processes, which act on this insect pest remain to be investigated [9].
Genetic diversity is influenced by several factors, such as gene flow, population fragmentation, inbreeding and geographical isolation. Adult butterflies and moths may have long distance migration [10,11], but this is not always the case [12,13,14]. Genetic drift alone may act on insect populations, resulting in genetically distinct populations, due to reproductive isolation, or interruption of gene flow among regions [15]. Further, reproductive isolation is impacted by the population size, individual dispersal, geographic isolation, and local ecological adaptation [16,17,18,19]. Dispersal is a key factor in both population dynamics and genetic exchange [20]. Continuous dispersal helps long-term survival of a species and can lower the genetic drift rate of local populations [21]. Gene flow and dispersal may be studied using genetic markers, such as short tandem repeats (STRs). STRs are highly polymorphic and reproducible co-dominant markers [22,23] and the efficiency and accuracy are superior to other dominant markers [9]. Short repeat motifs, long major allele, unbroken repeat, and localization in non-coding regions are associated with high STRs variability [24]. However, tri- and tetranucleotides are preferred for genetic monitoring due to higher reproducibility compared to dinucleotide STRs [25].
The development of STRs for Lepidoptera was known to be labor-intensive, expensive, and difficult, due to the proximity between STR sequences, repetitive sequences in the flanking regions and high frequencies of null alleles [26,27]. However, in the last few years, next-generation sequencing has provided a cheaper, faster, and efficient method for developing STR markers [28,29,30].
In our previous study [9], we used AFLP markers to investigate the genetic diversity of A. conjugella. Consequently, this study aimed to (i) identify tetranucleotide polymorphic STR markers using Illumina MiSeq sequencing; (ii) develop multiplex PCR combinations of these STR markers; (iii) test the cross-amplifications of the markers on related species (Argyresthia ivella, Argyresthia pruniella and Argyresthia curvella) and (iv) evaluate the statistical strength of the markers in a test population. The overall aim of this methodological study is to develop a quality set of genetic markers that can be used to study the genetic diversity and to understand the evolutionary process acting on Argyresthia conjugella. In turn, such knowledge may influence the management of this pest that has large impact on yield apple production.

2. Results

Illumina MiSeq sequencing of five Argyresthia conjugella individuals from various locations in Norway and Sweden gave a total of 21,638 contigs and singlets, of which 2918 showed variable repeats. We were able to develop suitable primers in 2374 STR fragments. Based on the sequences from the same five individuals, we selected the 40 tetranucleotides showing the highest variability. Next, we tested these 40 tetranucleotide markers on 15 individuals (not shown). From this result, we selected the 19 markers with highest PCR efficiency and genetic variation for further evaluation. The results obtained from PCR sequencing identified the STR repeat motifs (Supplementary Table S3 and Table 1). A population of 64 different Argyresthia conjugella individuals (Supplementary Table S1) were used for further analysis.
All 19 singleplex PCRs of the selected tetranucleotide markers were successfully amplified (singleplex PCRs were repeated two times with seven of the 64 Aryresthia conjugella individuals and confirmed the same amplification results). The 19 STR markers were then organized into five PCR multiplex panels, to make the genotyping faster and more cost-effective. The STR markers were designed and organized to adjust the PCR product size for the multiplex-PCR. PCR product for each locus was labeled with one of the four different fluorescent labels (6FAM, NED, PET and VIC) so that no two markers with the same fluorescent dye had overlapping allele size ranges. The multiplex PCR combinations were optimized (not shown), and examples of the chromatograms from the capillary electrophoresis runs are shown in Figure 1. An overview of the combinations of PCR primers, primer concentrations and fluorescent labels for the five resulting multiplex panels is given in Table 2. The multiplex panels showed that the 19 loci produced one major peak for each allele, except for one marker (Argcon-1452) where only 38 of 64 individuals could be genotyped due to difficult allele designations (Table 3).
The observed and expected heterozygosity obtained in the study varied from 0.1455 to 0.9074 and 0.4816 to 0.9399, respectively. The mean expected heterozygosity was He = 0.75, Nei’s genetic diversity index ranged from 0.4763 to 0.9399, and estimated FIS was 0.0486 to 0.6952 (Table 3).
We also tested the 19 STRs using DNA from three species from the same genus; Argyresthia ivella, Argyresthia pruniella, and Argyresthia curvella. Cross-amplification could only be detected for two of the 19 STRs (Argyresthia ivella: Arg1452 and, Argyresthia pruniella: Arg4899).
Bayesian clustering analysis with STRUCTURE software (see Materials and Methods) assigned the 64 Argyresthia conjugella individuals in two potential clusters that were not geographically restricted to specific regions (Figure 2 and Supplementary Table S1).
The STRs data were also analyzed using the analysis of molecular variance (AMOVA) and variance components were estimated (Table 4). As shown in Table 4, higher genetic variation was found within (97.76%) than among the geographic regions (2.24%). Low FST values (Table 5) were estimated among the three sampling locations (average 0.0224), while a substantially higher FST value (0.4034) was found between the two clusters indicated in Figure 2. In general, and when not considering the genetic clustering, estimated gene flow among the regions was found to be high (Nm = 10.91).

3. Discussion

We have developed 19 novel tetranucleotide STR markers to be used in multiplex PCRs for population genetic monitoring of the apple fruit moth, which is a threat to apple crops in Fennoscandia. To our knowledge, this is the first full set of tetranucleotide STR markers that have been developed for an insect species. Tetranucleotide STRs are usually less variable than dinucleotides [24], but are recommended for genetic monitoring due to higher reproducibility and performance [25]. When applying the 19 novel tetranucleotide STRs to a test population of 64 individuals, we found high genetic variation compared to other Lepidoptera species studied so far. In addition, substantial gene flow among geographical regions was detected in our limited test population. Non-spatial genetic structure could also be detected, and the two genetic clusters were not restricted to geographical areas.
Single PCR of many fluorescent-labeled STR markers is time consuming, costly and represents a risk of cross species amplifications. To overcome this, multiplex PCR provides a high throughput technique that will reduce the cost and increase species specificity [32,33]. Few other studies have applied STRs multiplex-PCRs to Lepidoptera species, although notable exceptions exist; 17 STRs from Thaumetopoea pityocampa, with three multiplex-PCRs [34]; and 21 STR markers from Epirrita autumnata, with six multiplex-PCRs [35]. The five multiplex PCRs in our study were successfully amplified and the 19 STRs were highly polymorphic. However, the STR marker Argcon-1452 showed a low success rate and may be excluded from large studies. Cross-amplifications to related species were detected in single cases for two different markers. However, the multiplex approach ensured the species specificity for our method.
In this study, we observed a very high number of alleles per locus (average = 13.6) compared to other Lepidoptera species; 2.2 in Helicoverpa zea [36], 3 in Hyphantria cunea [37], 4.1 in Helicoverpa armigera [36], 4.6 in Carposina sasakii [38], 4.7 in Epirrita autumnata [35], 4.7 in Plutella xylostella [39], 7.0 in Chilo suppressalis [40], 8.8 in Zeiraphera diniana [41], and 10.5 in Parnassius apollo [42]. The large number of STR markers detected (2374) in this study enabled the possibility of selection of the most highly polymorphic markers. In addition, our finding of high allelic variation may also be due to high genetic diversity among Argyresthia conjugella populations which have not been investigated before using STRs.
STRs analyses of Argyresthia conjugella showed very high expected heterozygosity (He = 0.75): higher than previously reported using AFLPs markers (He = 0.31 [9]). However, AFLPs and STR markers are not directly comparable. The expected heterozygosity of Argyresthia conjugella in our study, was slightly higher than in SSR analyses of Metrioptera roeselii ‘0.61’ [21], Leptomyrmex pallens ‘0.51’ [43] and Cerambyx cerdo ‘0.63’ [44]. However, the expected heterozygosity was much higher than was previously detected by SSRs in Plutella xylostella ‘0.35’ [11], Anopheles nuneztovari (Culicidae) ‘0.34’ [45], Glossina pallidipes ‘0.35’ [46], Bombus distinguendus ‘0.38’ [47] and Epirrita autumnata ‘0.43’ [35]. We may speculate if the high genetic variation may be caused by previous population fragmentation and/or multiple founders as a result of the life cycle, outbreak cycles, lower migration distance as well as the topography in Scandinavia and/or the use of insecticides on selected parts of the population.
Our genetic analyses showed two potential main clusters, but without any structure among the geographical regions. Two clusters were also found in our previous study of the apple fruit moth in Norway [9], but the clusters were associated with geographical locations separated by a mountain plateau. Genetic differentiation (FST) was found to be low in this study, indicating high gene flow among the geographical areas, which has also been reported in other Lepidoptera species (e.g., Plutella xylostella, Cydia pomonelle and Rhagoletis indifferens) [48,49,50,51]. In contrast, other studies (for Argyresthia conjugella, Boloria eunomia, Sesamia nonagriodes Diatraea saccharalis and Cydia pomonelle), have documented substantial genetic differentiation and low gene flow rate among geographical regions [9,52,53,54,55]. In our study, the samples from Sweden clustered together with the samples from Norway, which further supports the existence of substantial gene flow for the apple fruit moth in Scandinavia. Conclusively, both the genetic differentiation and the structural analyses supported the existence of high gene flow among the different regions.
Previously, genetic diversity of insect species has demonstrated the existence of genetic differentiation between insecticide susceptible and resistant populations [49,56]. The two clusters found in this study and as well in our previous study [9], may also be due to different management regimes.
The high gene flow detected in the study, may be helpful both in determining sources from which Argyresthia conjugella disperse and for monitoring insecticide resistance and may be a key factor for successful and stable control of insect pests.
In conclusion, we have developed 19 highly polymorphic tetranucleotide STR markers for Argyresthia conjugella, and the multiplex PCR sets for these STR markers will enable fast and wide population genetic studies of the species. These novel STRs may be used on larger scales to investigate the genetic diversity and population structure of this economical important insect species. Understanding the evolutionary process acting on Argyresthia conjugella may provide sufficient and efficient methods for management of this pest, which has large impact on yield in apple production.

4. Materials and Methods
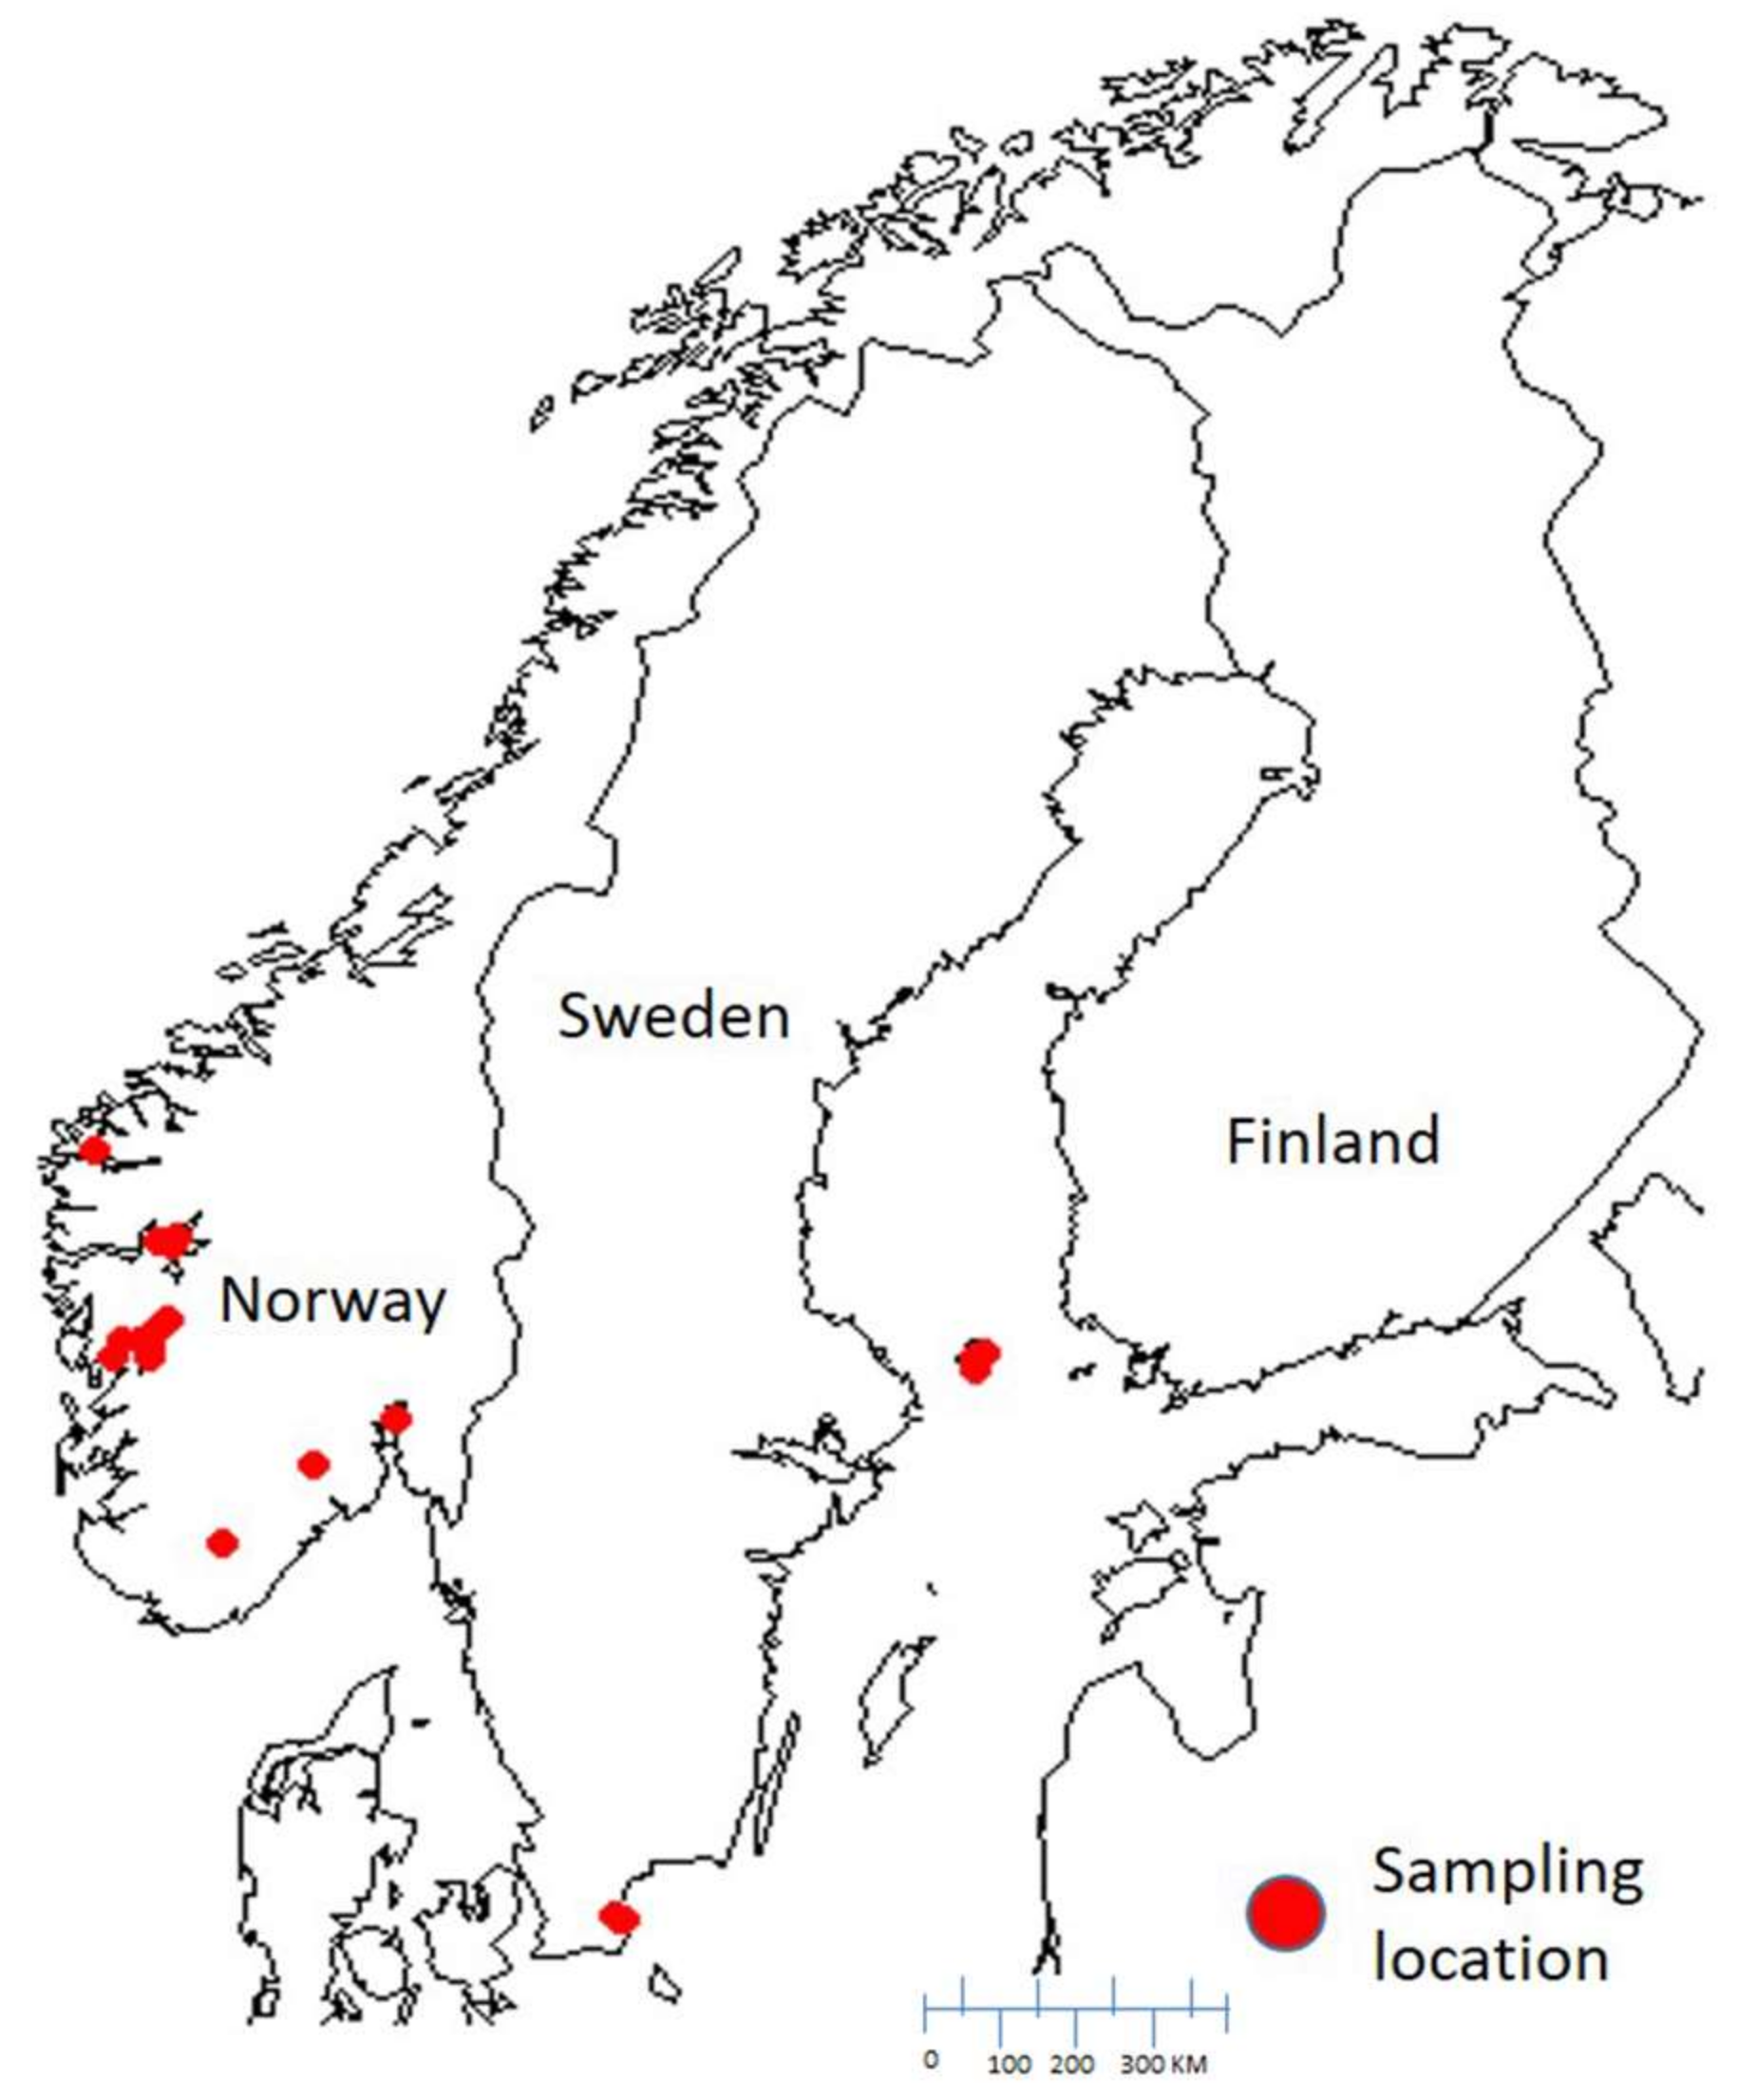
4.1. Sampling

In autumn 2015, Argyresthia conjugella larvae were collected from infested rowan berries. The berries were collected from multiple trees per field from 15 different locations. Argyresthia conjugella larvae were stored over rolls of corrugated cardboard, where larvae went into pupal diapause. A total of 64 individuals (females and males) were sampled from Eastern and Western regions in Norway, and one small population from Sweden (Figure 3). The samples were stored at −80 °C until DNA was extracted. The list of samples used in this study are provided in supplementary Table S1.

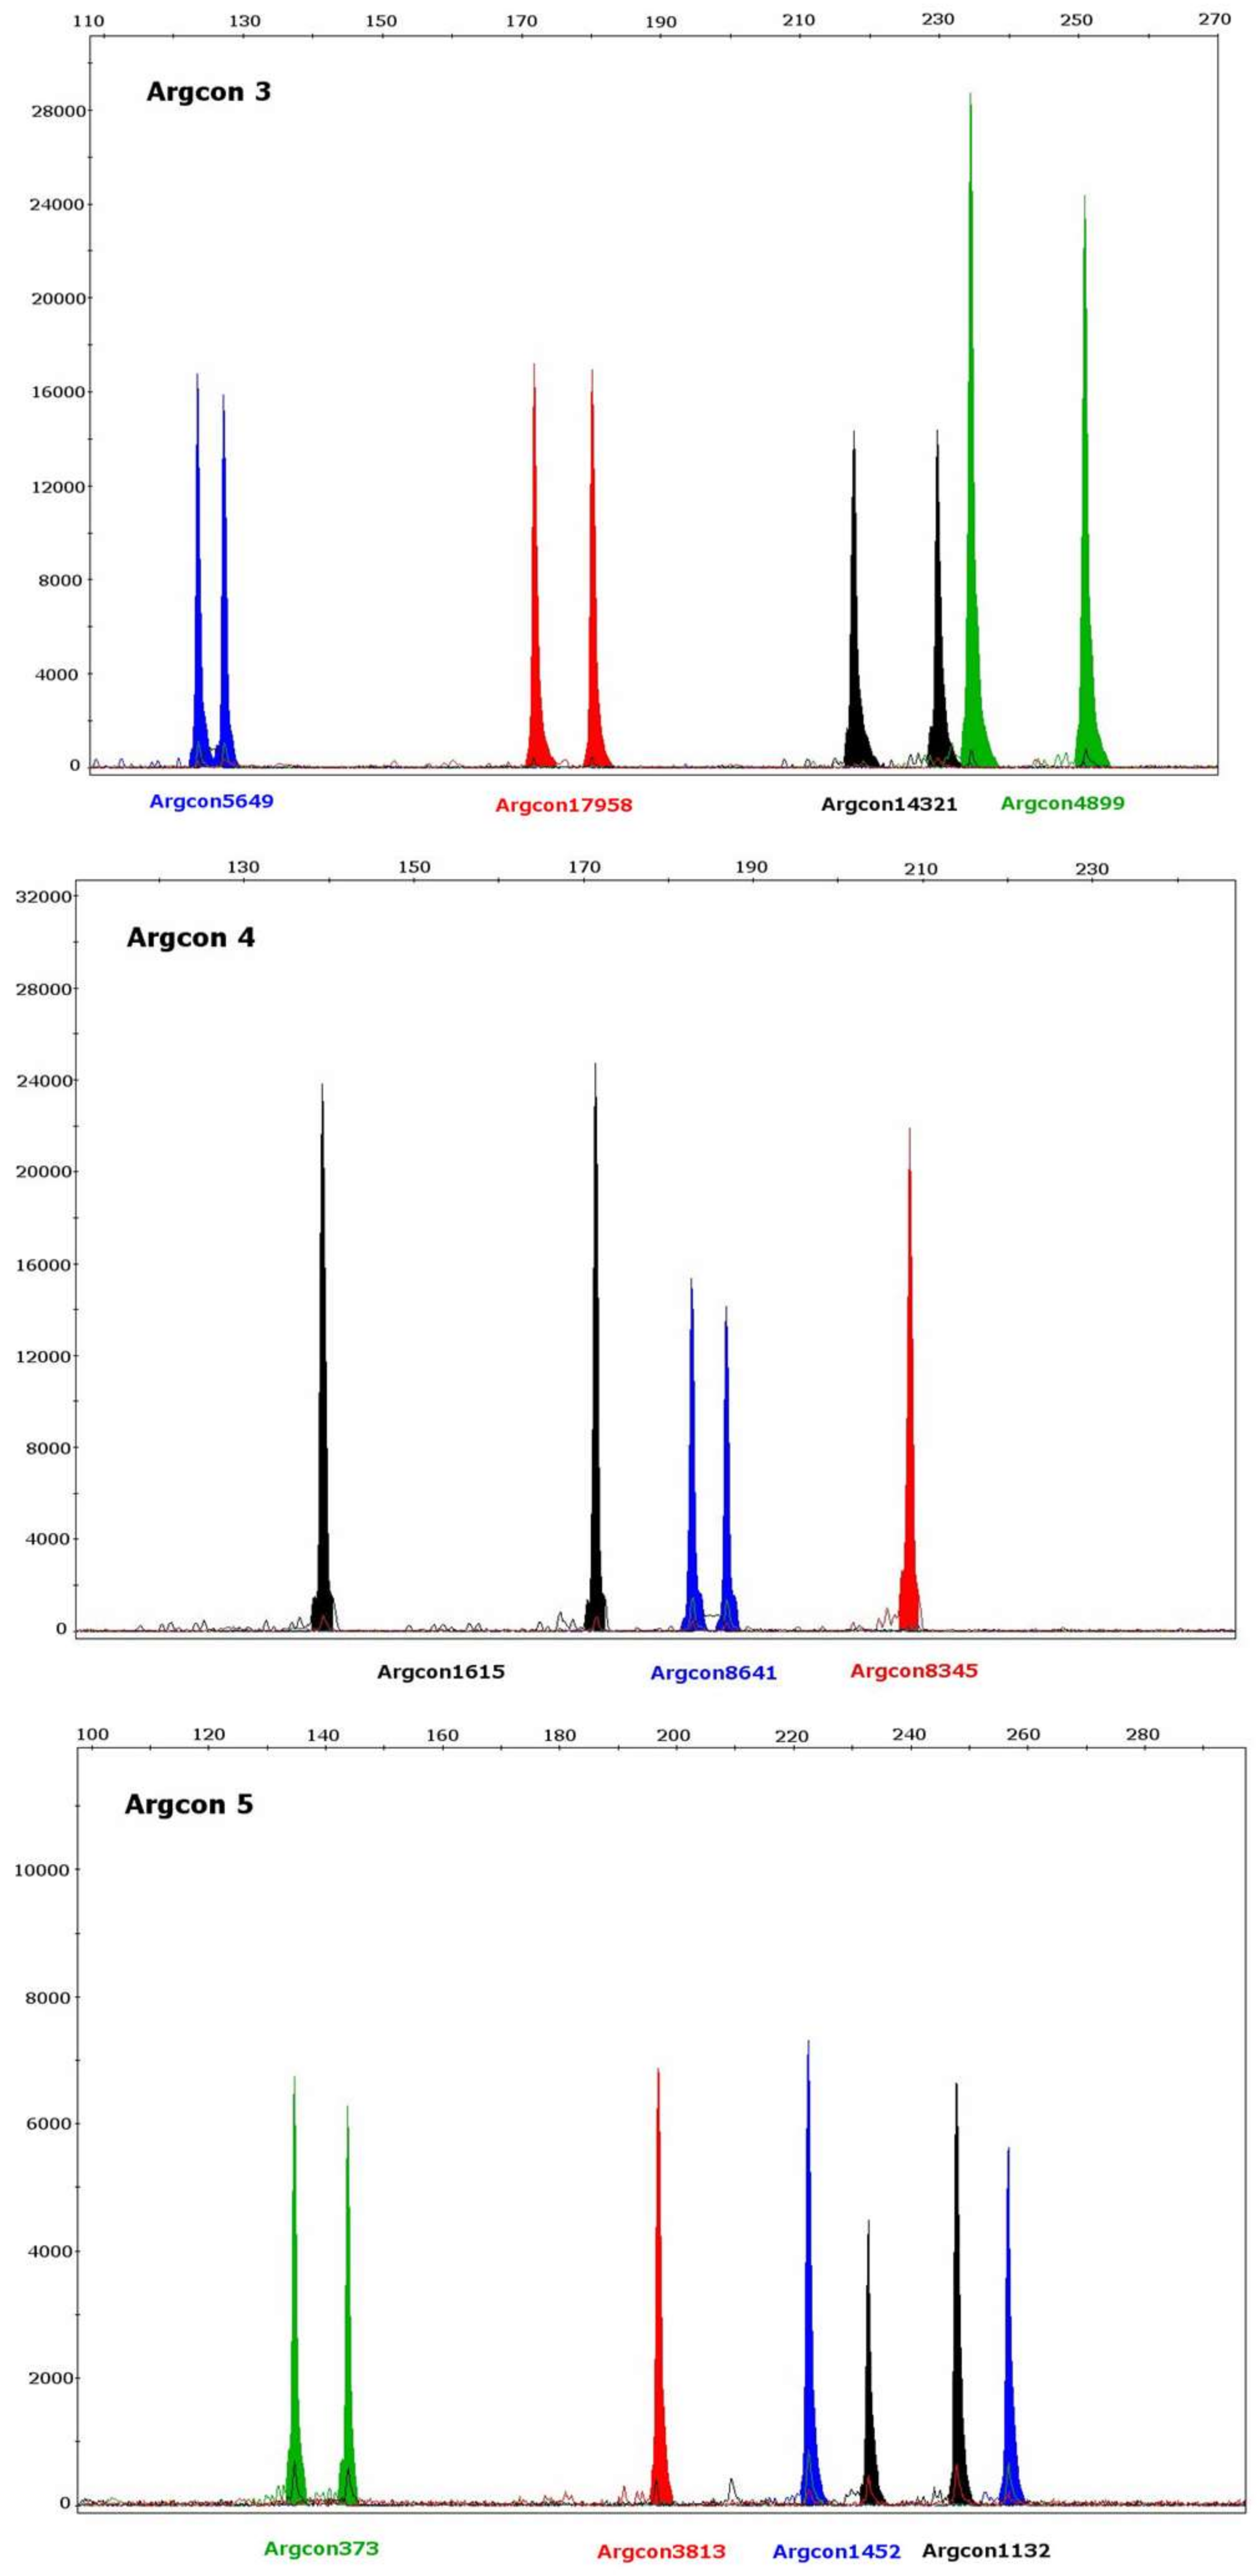
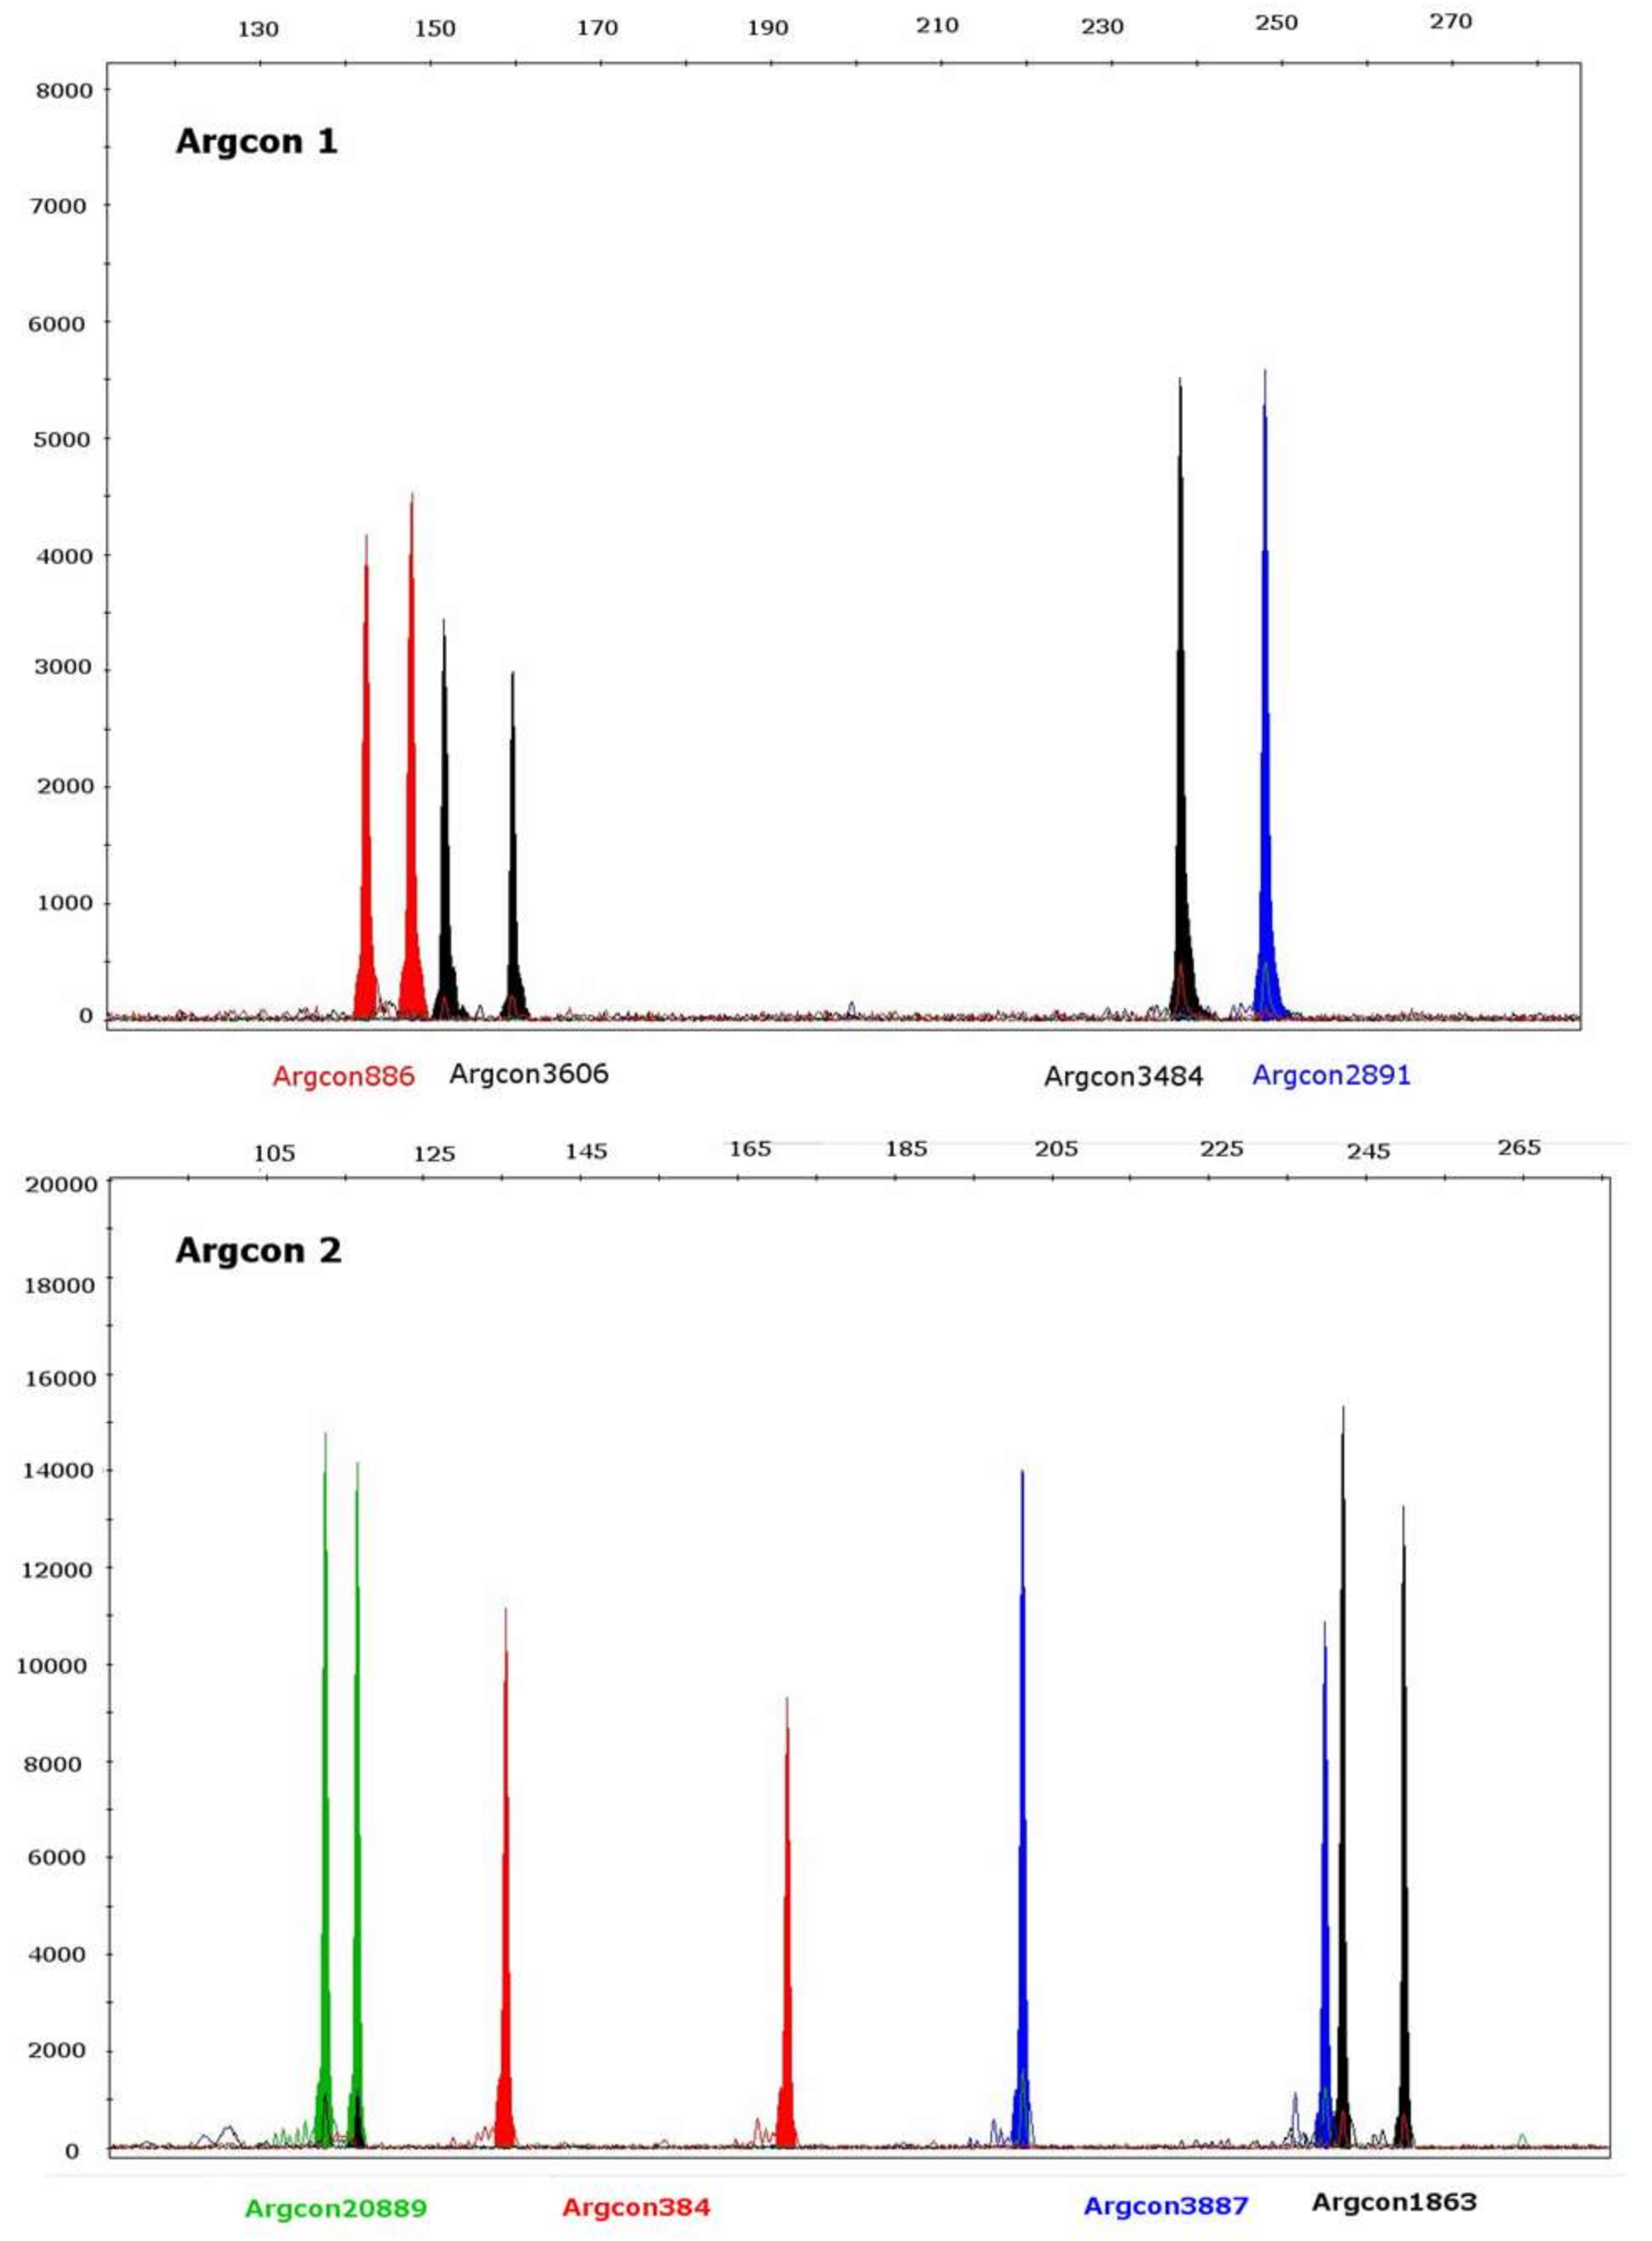
4.2. Identification of STRs

The extraction of DNA from Argyresthia conjugella samples was performed using DNeasy Blood and Tissue Kits (Qiagen, Tokyo, Japan) according to the manufacturer’s instructions.
Illumina MiSeq sequencing was used to identify STR markers. Briefly, the construction of the MiSeq libraries was done by using 5 individuals of Argyresthia conjugella that were equimolar and pooled together. Five μg genomic DNA was digested using ultrasonic bath end-repaired and A-tailed. DNA fragments were then ligated using Illumina adapters i501/i701. DNA fragment enrichment for STR availability was done using magnetic streptavidin beads and biotin-labeled GATA and GTAT repeat oligonucleotides. The enrichment STR library was analyzed using Illumina MiSeq sequencing using the 2 × 250 v2 format. The paired end reads were merged with FLASH 1.2.9 software [57]. Then, a de-novo assembly was performed with the merged paired end reads with MIRA 4.0.1 software [58]. This software classifies assembled sequences into contigs and singlets. Reads that have no overlap with any other reads become singlets (only 2 singlets were detected and do not contained a microsatellite insert). A total of 21,638 contigs were screened. Detection of polymorphic STR alleles was done by assembling the different contigs using Tandem Repeats Finder, v 4.09 software [59]. The library analyses showed 2918 contigs with variable microsatellites repeats that contained a minimum of six repeat units of tetranucleotide and trinucleotide and ten repeats of dinucleotide. We were able to develop suitable primers in 2374 fragments using primer 3 version 4.0 [60]. Among these sequences, 40 tetranucletide loci were selected to test the primer amplification efficiency across 15 Argyresthia conjugella individuals from various locations in Norway and Sweden. Of these tested markers, 19 highly polymorphic STRs were selected for further experiments.

4.3. PCR Amplification

PCR primers for the 19 loci were optimized using OligoPerfect™ Designer (Applied Biosystem, Foster City, CA, USA), with the following criteria: (i) length of PCR product should be as short as possible and between 90 and 300 bp; (ii) flanking regions should not contain a mononucleotide stretch of more than five bases; (iii) annealing temperature were optimized to fall between 56 °C and 63 °C; and (iv) difference in temperature between forward and reverse primer should not exceed 2 °C. The forward-primers were labeled with one of four fluorescent dyes (6FAM, VIC, NED or PET). The dye colors were assigned to the primers in a fashion that allowed for different dyes for the markers with assumed overlapping allele ranges. In addition, we added PIG-tailing sequences (GTTTCTT) to the reverse primers [31] in the 5′ end of the primer to facilitate accurate genotyping.
Single PCRs were initially performed on seven individuals for each of the 20 primer pairs, in a 10 µL reaction volume containing 1× PCR Gold buffer (ABI), 200 µM dNTP (Eurogentec, Liege, Belgium), 1.5 mM MgCl2 (ABI), 0.5 µM of each primer (Life technologies, Carlsbad, CA, USA), 1 U Amplitaq Gold DNA polymerase (ABI), 1× BSA (NEB) and 1 µL template (0.1 to 2.0 ng). PCR reactions were performed on a 2720 Thermal cycler and the conditions for the PCR was 10 min at 95 °C, 26 cycles of 30 s at 94 °C, 30 s at 58 °C, 1 min 72 °C and final extension for 45 min at 72 °C.
PCR products (1 µL) were then mixed with Genescan 500 LIZ (Applied Biosystems) size standard (0.24 µL) and Hi-Di formamide (10.00 µL), following a 2 min denaturation at 95 °C on a 2720 Thermal cycler. Capillary electrophoresis was carried out on an ABI 3730 DNA Analyzer (Applied Biosystems). The POP-7™ Polymer was used as a separation matrix and the sample injection time were set to 4 s/2 kv. PCR fragments were analyzed in GeneMapper 4.1 (Applied Biosystems). The singleplex PCR reactions were carried out to verify the successful amplifications of the markers. One of the STR-markers (Arg4244) did not successfully amplify and were left out of further multiplex-PCR development.
For multiplex development, different combinations of the STR-markers were tested until a combination of four markers amplified successfully with clear chromatograms and without artifact alleles/spikes/primer dimer. PCR product for each locus was labeled with one of the four different fluorescent labels (6FAM, NED, PET and VIC) in such a manner that no two markers with same fluorescent dye had overlapping allele size ranges. The concentration of the primers were adjusted so that the markers within a multiplex panel were equal in height (RFU), and the number of cycles for the PCR-reaction were adjusted to achieve optimal peak height of the alleles (between 8000–24,000 RFU).
For the final analysis, the 19 STRs were split into four tetraplex panels (multiplex I, II, III and V) and one triplex panel (IV). The PCR reactions were carried out in 10 µL reaction volume: 5 µL 2× multiplex PCR master mix (Qiagen Multiplex kit), 0.05 µg/µL BSA (NEB) and adjusted primer set concentrations (Table 2). PCR conditions for multiplex I, II and IV were 10 min at 95 °C, 24 cycles of 30 s at 94 °C, 30 s at 58 °C, 1 min 72 °C and final extension for 45 min at 72 °C. PCR conditions for multiplex III and V were 10 min at 95 °C, 25 cycles of 30 s at 94 °C, 30 s at 60 °C, 1 min 72 °C and final extension for 45 min at 72 °C. The fragment analyzes for the multiplex reactions were carried out as described by the singleplex reactions.
To check for possible contamination, negative controls were included for every seventh sample in all measurements in this study. Negative controls for both single and multiplex PCRs were carried out with all of the PCR master-mix components except the DNA template (water was added instead of DNA). The seven samples of Argyresthia conjugella used for the initial testing and optimization of the single- and multiplex runs were used as positive controls.

4.4. Species Specificity
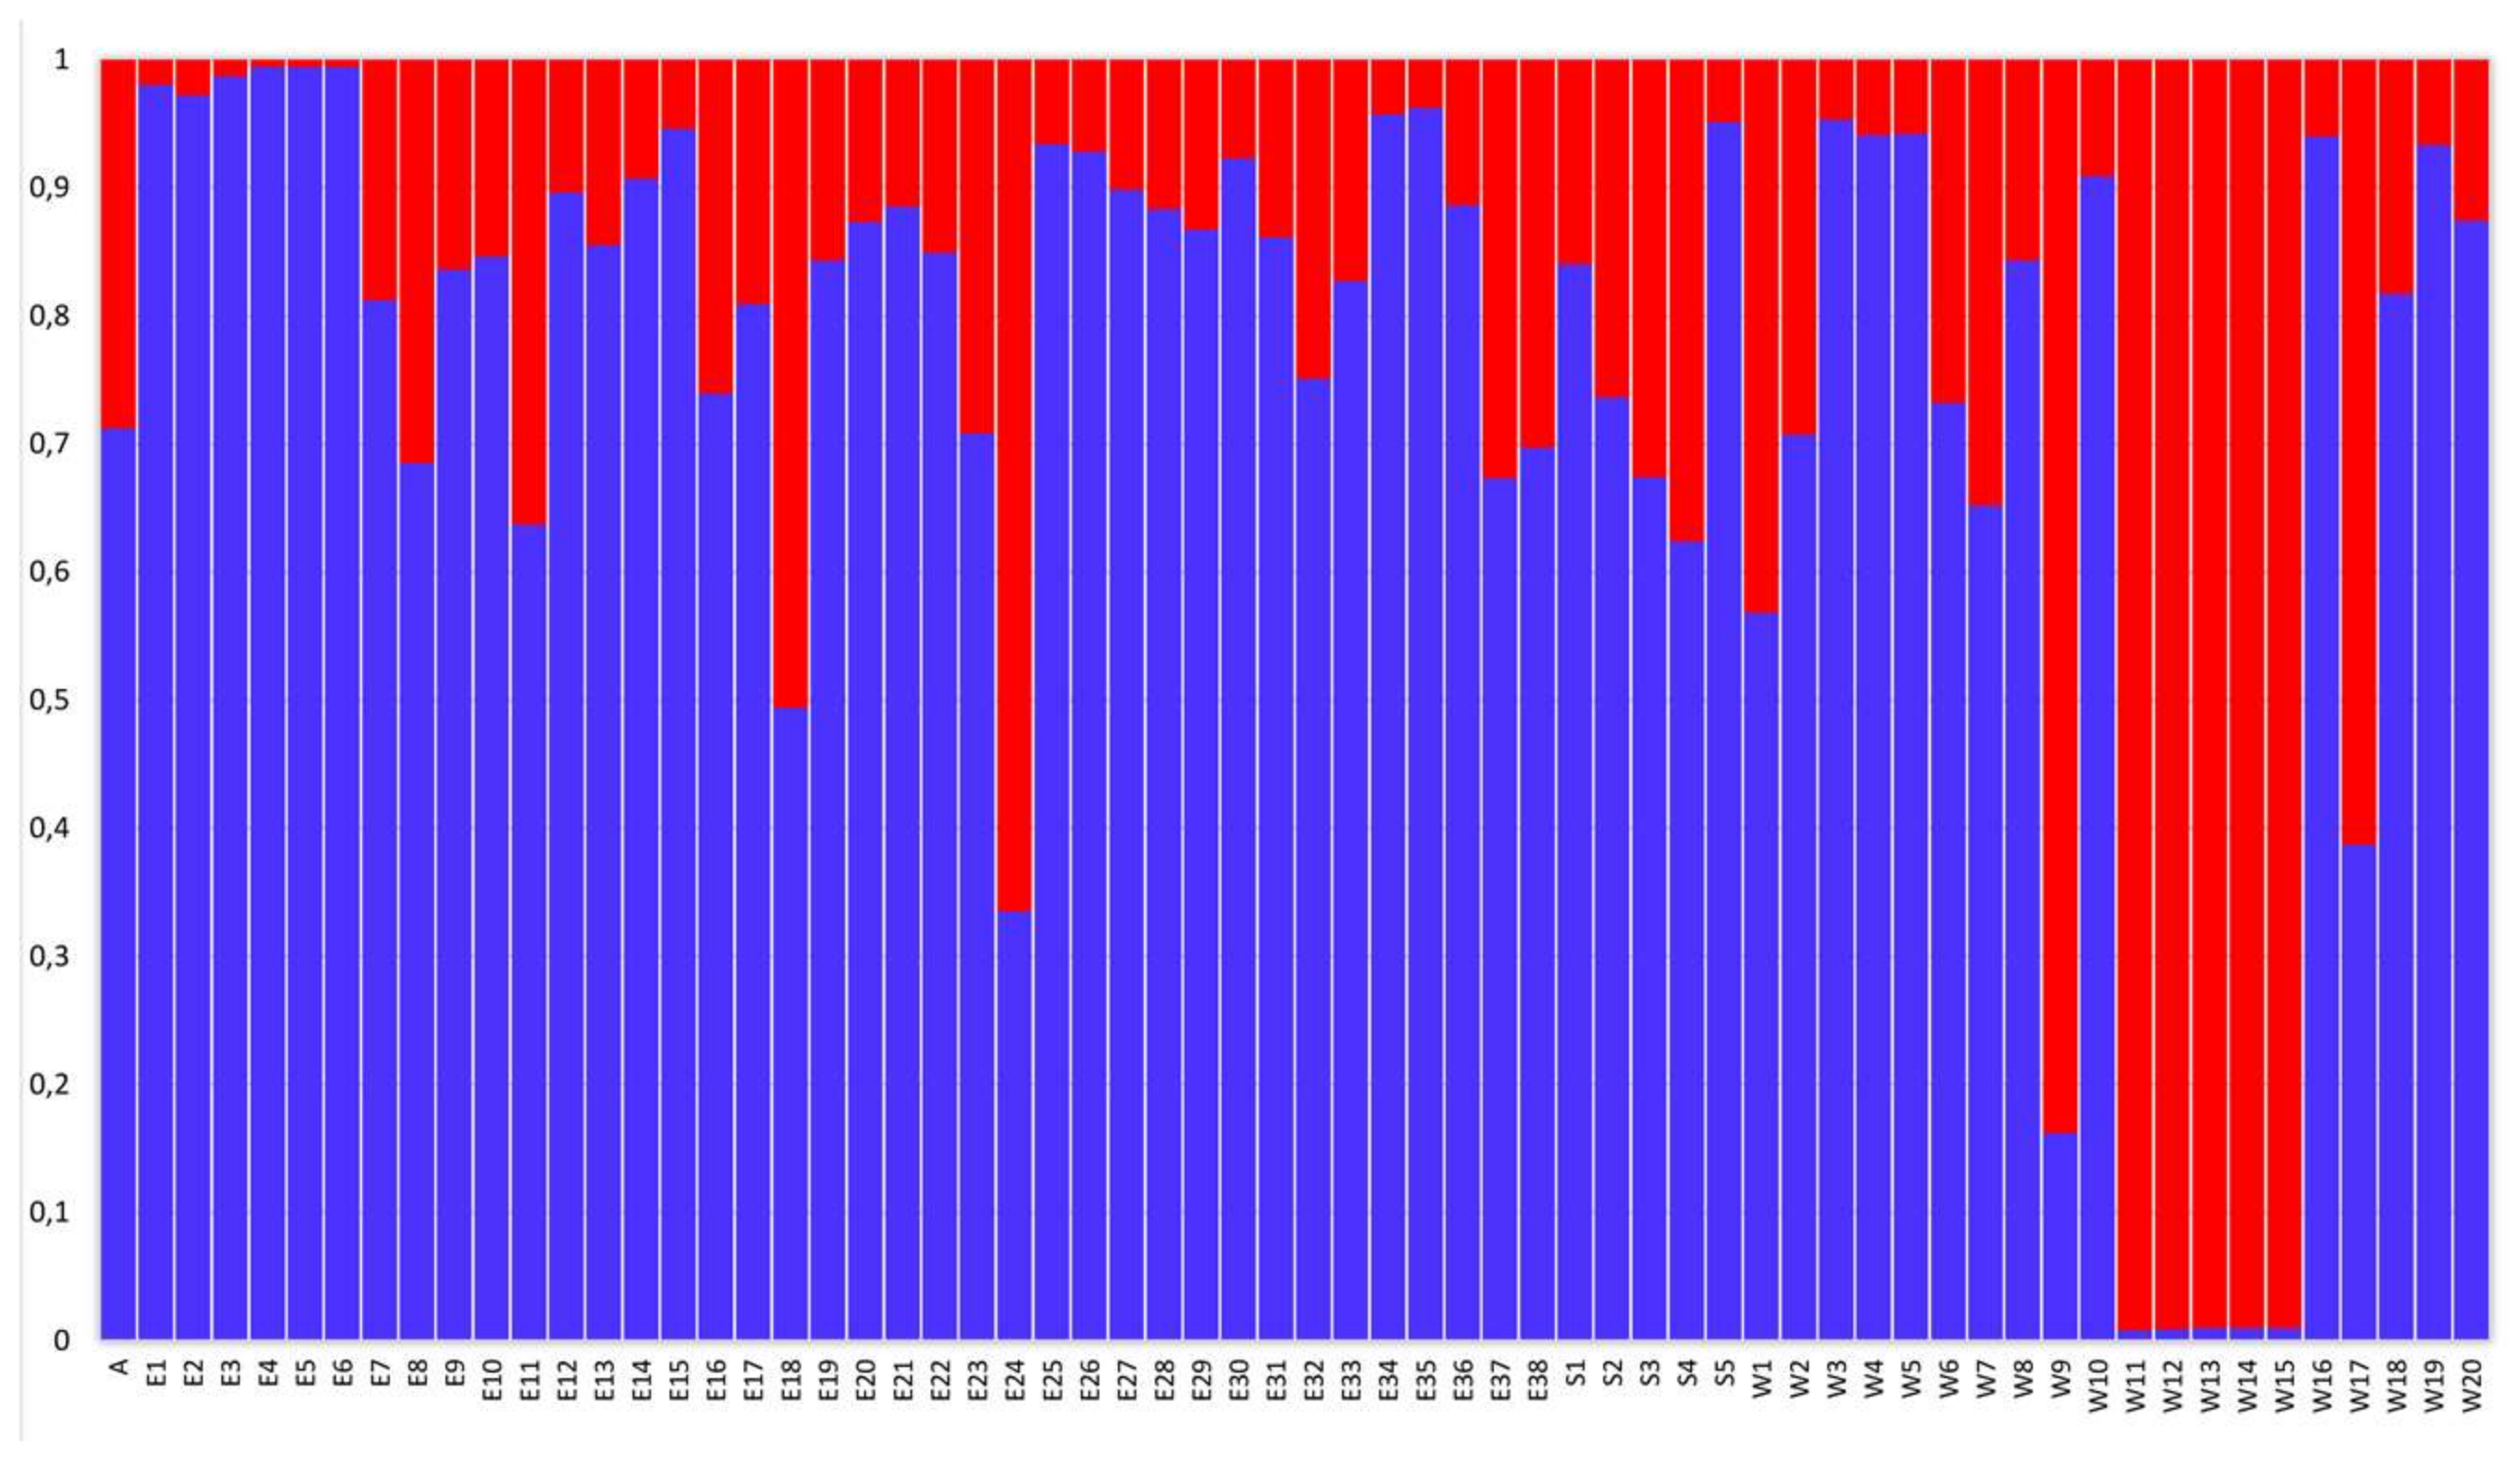
A test for cross-species amplification was carried out by testing the STRs on other closely related species of Argyresthia: A. ivella, A. pruniella and A. curvella. All the nineteen markers were tested against two DNA samples for each of the abovementioned species. The PCR and STRs analyses were performed as described for Argyresthia conjugella. The STR-markers were considered species specific if they did not amplify in any of the related species.

4.5. Data Analyses

We calculated the deviations from Hardy–Weinberg equilibrium (HWE) for each single locus of these polymorphic STRs studied. The number of alleles, allele frequencies, expected-observed heterozygosity and inbreeding coefficient (FIS) were calculated. These analyses were performed using Genepop 4.0 software [61]. We calculated Nei’s genetic diversity [62] using Popgene version 1.32 [63].
Bayesian clustering approach of genetic mixture analysis (Structure 2.3.4 software) was carried as developed by [64] to identify the number of genetically homogeneous clusters (K) (Figure S1). Plots of likelihoods, similarity coefficients and ΔKs [64] were made with Structure Harvester [65], as published by [9].
We performed an analysis of molecular variance (AMOVA) [66] to study the genetic diversity between clusters and among the different regions. Genetic differentiation and FST values were estimated using Arlequin software, version 2.000 [67], as published by [9]. Gene flow was calculated as published by [68].

Supplementary Materials

The following are available online. Table S1: List of 64 Argyresthia conjugella individuals used in the study, Table S2: Allele frequencies for the 19 STR markers, Table S3: DNA sequence analysis, Figure S1: DeltaK for samples from 64 individuals indicating the number of clusters in the program Structure.

Acknowledgments

The Norwegian Institute for Bioeconomy Research have financed this work. We thank Siv Grethe Aarnes for technical support and interesting discussions.

Author Contributions

All authors contributed to conceive and plan the study. Abdelhameed Elameen, Hans Geir Eiken, Ida Fløystad, Geir Knudsen, and Snorre B. Hagen genotyped the samples, analyzed the data and wrote the manuscript with input from all authors.

Conflicts of Interest

The authors declare no conflict of interest.

References

  1. Okamoto, H. On the life-history of the apple fruit-miner, Argyresthia conjugella Zeller. Trans. Sappore Nat. Hist. Soc. 1917, 6, 213–219. [Google Scholar]
  2. Sharma, J.; Khajuria, D.; Dogra, G. Studies on the apple fruit moth, Argyresthia conjugella Zeller (Yponomeutidae: Lepidoptera): Identification, distribution and extent of damage in India. Int. J. Pest Manag. 1988, 34, 189–192. [Google Scholar]
  3. Fletcher, J. Report of the Entomologist and Botanist, 1896; Department of Agriculture, Central Experimental Farm: Ottawa, ON, Canada, 1897.
  4. Schöyen, W. Beretning om skadeinsekter og plantesygdomme i 1897. Kristiania 1898, 45, 8. [Google Scholar]
  5. Kobro, S.; Søreide, L.; Djønne, E.; Rafoss, T.; Jaastad, G.; Witzgall, P. Masting of rowan Sorbus aucuparia L. and consequences for the apple fruit moth Argyresthia conjugella Zeller. Popul. Ecol. 2003, 45, 25–30. [Google Scholar]
  6. Bengtsson, M.; Jaastad, G.; Knudsen, G.; Kobro, S.; Bäckman, A.C.; Pettersson, E.; Witzgall, P. Plant volatiles mediate attraction to host and non-host plant in apple fruit moth, Argyresthia conjugella. Entomol. Exp. Appl. 2006, 118, 77–85. [Google Scholar] [CrossRef]
  7. Knudsen, G.K.; Tasin, M. Spotting the invaders: A monitoring system based on plant volatiles to forecast apple fruit moth attacks in apple orchards. Basic Appl. Ecol. 2015, 16, 354–364. [Google Scholar] [CrossRef]
  8. Edland, A.; Meyer, B. Prognosar om angrep av rognebaermoll (Argyresthia conjugella Zeller) pa eple. Gartneryrket 1978, 2013, 563–564. [Google Scholar]
  9. Elameen, A.; Eiken, H.G.; Knudsen, G.K. Genetic diversity in apple fruit moth indicate different clusters in the two most important apple growing regions of Norway. Diversity 2016, 8, 10. [Google Scholar] [CrossRef]
  10. Diéguez-Uribeondo, J.; Fregeneda-Grandes, J.M.; Cerenius, L.; Pérez-Iniesta, E.; Aller-Gancedo, J.M.; Tellería, M.T.; Söderhäll, K.; Martín, M.P. Re-evaluation of the enigmatic species complex Saprolegnia diclina and Saprolegnia parasitica based on morphological, physiological and molecular data. Fungal Genet. Biol. 2007, 44, 585–601. [Google Scholar] [CrossRef] [PubMed]
  11. Roux, O.; Gevrey, M.; Arvanitakis, L.; Gers, C.; Bordat, D.; Legal, L. ISSR-PCR: Tool for discrimination and genetic structure analysis of Plutella xylostella populations native to different geographical areas. Mol. Phylogenet. Evol. 2007, 43, 240–250. [Google Scholar] [CrossRef] [PubMed]
  12. Ribeiro, D.B.; Batista, R.; Prado, P.I.; Brown, K.S.; Freitas, A.V. The importance of small scales to the fruit-feeding butterfly assemblages in a fragmented landscape. Biodivers. Conserv. 2012, 21, 811–827. [Google Scholar] [CrossRef]
  13. Tufto, J.; Lande, R.; Ringsby, T.H.; Engen, S.; Sæther, B.E.; Walla, T.R.; DeVries, P.J. Estimating brownian motion dispersal rate, longevity and population density from spatially explicit mark–recapture data on tropical butterflies. J. Anim. Ecol. 2012, 81, 756–769. [Google Scholar] [CrossRef] [PubMed]
  14. Legal, L.; Dorado, O.; Machkour-M’Rabet, S.; Leberger, R.; Albre, J.; Mariano, N.A.; Gers, C. Ecological constraints and distribution of the primitive and enigmatic endemic Mexican butterfly Baronia brevicornis (Lepidoptera: Papilionidae). Can. Entomol. 2015, 147, 71–88. [Google Scholar] [CrossRef]
  15. Laffin, R.; Langor, D.; Sperling, F. Population structure and gene flow in the white pine weevil, Pissodes strobi (Coleoptera: Curculionidae). Ann. Entomol. Soc. Am. 2004, 97, 949–956. [Google Scholar] [CrossRef]
  16. Gómez, A. Molecular ecology of rotifers: From population differentiation to speciation. Hydrobiologia 2005, 546, 83–99. [Google Scholar] [CrossRef]
  17. Margaritopoulos, J.T.; Voudouris, C.C.; Olivares, J.; Sauphanor, B.; Mamuris, Z.; Tsitsipis, J.A.; Franck, P. Dispersal ability in codling moth: Mark–release–recapture experiments and kinship analysis. Agric. For. Entomol. 2012, 14, 399–407. [Google Scholar] [CrossRef]
  18. Voudouris, C.C.; Franck, P.; Olivares, J.; Sauphanor, B.; Mamuris, Z.; Tsitsipis, J.; Margaritopoulos, J. Comparing the genetic structure of codling moth Cydia pomonella (L.) from Greece and France: Long distance gene-flow in a sedentary pest species. Bull. Entomol. Res. 2012, 102, 185–198. [Google Scholar] [CrossRef] [PubMed]
  19. Fan, Z.; Jiang, G.-F.; Liu, Y.-X.; He, Q.-X.; Blanchard, B. Population explosion in the yellow-spined bamboo locust Ceracris kiangsu and inferences for the impact of human activity. PLoS ONE 2014, 9, e89873. [Google Scholar] [CrossRef] [PubMed]
  20. Azevedo, F.; Coutinho, R.; Kraenkel, R. Spatial dynamics of a population with stage-dependent diffusion. Commun. Nonlinear Sci. Numer. Simul. 2015, 22, 605–610. [Google Scholar] [CrossRef]
  21. Kaňuch, P.; Berggren, Å.; Cassel-Lundhagen, A. Genetic diversity of a successful colonizer: Isolated populations of Metrioptera roeselii regain variation at an unusually rapid rate. Ecol. Evol. 2014, 4, 1117–1126. [Google Scholar] [CrossRef] [PubMed]
  22. Wang, X.-R.; Szmidt, A.E. Molecular markers in population genetics of forest trees. Scand. J. For. Res. 2001, 16, 199–220. [Google Scholar] [CrossRef]
  23. Squirrell, J.; Hollingsworth, P.; Woodhead, M.; Russell, J.; Lowe, A.; Gibby, M.; Powell, W. How much effort is required to isolate nuclear microsatellites from plants? Mol. Ecol. 2003, 12, 1339–1348. [Google Scholar] [CrossRef] [PubMed]
  24. Willems, T.; Gymrek, M.; Highnam, G.; Mittelman, D.; Erlich, Y.; Consortium, G.P. The landscape of human STR variation. Genome Res. 2014, 24, 1894–1904. [Google Scholar] [CrossRef] [PubMed]
  25. Linacre, A.; Gusmao, L.; Hecht, W.; Hellmann, A.; Mayr, W.; Parson, W.; Prinz, M.; Schneider, P.; Morling, N. ISFG: Recommendations regarding the use of non-human (animal) DNA in forensic genetic investigations. Forensic Sci. Int. Genet. 2011, 5, 501–505. [Google Scholar] [CrossRef] [PubMed]
  26. Meglecz, E.; Petenian, F.; Danchin, E.; D’Acier, A.C.; Rasplus, J.Y.; Faure, E. High similarity between flanking regions of different microsatellites detected within each of two species of Lepidoptera: Parnassius apollo and Euphydryas aurinia. Mol. Ecol. 2004, 13, 1693–1700. [Google Scholar] [CrossRef] [PubMed]
  27. Zhang, D.-X. Lepidopteran microsatellite DNA: Redundant but promising. Trends Ecol. Evol. 2004, 19, 507–509. [Google Scholar] [CrossRef] [PubMed]
  28. Jiang, R.H.; de Bruijn, I.; Haas, B.J.; Belmonte, R.; Löbach, L.; Christie, J.; van den Ackerveken, G.; Bottin, A.; Bulone, V.; Díaz-Moreno, S.M. Distinctive expansion of potential virulence genes in the genome of the Oomycete fish pathogen Saprolegnia parasitica. PLoS Genet. 2013, 9, e1003272. [Google Scholar] [CrossRef] [PubMed] [Green Version]
  29. Zalapa, J.E.; Cuevas, H.; Zhu, H.; Steffan, S.; Senalik, D.; Zeldin, E.; McCown, B.; Harbut, R.; Simon, P. Using next-generation sequencing approaches to isolate simple sequence repeat (SSR) loci in the plant sciences. Am. J. Bot. 2012, 99, 193–208. [Google Scholar] [CrossRef] [PubMed]
  30. Reineke, A.; Assaf, H.; Kulanek, D.; Mori, N.; Pozzebon, A.; Duso, C. A novel set of microsatellite markers for the European grapevine moth Lobesia botrana isolated using next-generation sequencing and their utility for genetic characterization of populations from Europe and the Middle East. Bull. Entomol. Res. 2015, 105, 408–416. [Google Scholar] [CrossRef] [PubMed]
  31. Brownstein, M.J.; Carpten, J.D.; Smith, J.R. Modulation of non-templated nucleotide addition by Taq DNA polymerase: Primer modifications that facilitate genotyping. Biotechniques 1996, 20, 1004–1010. [Google Scholar] [PubMed]
  32. Li, Y.; Cooke, D.E.; Jacobsen, E.; van der Lee, T. Efficient multiplex simple sequence repeat genotyping of the Oomycete plant pathogen Phytophthora infestans. J. Microbiol. Methods 2013, 92, 316–322. [Google Scholar] [CrossRef] [PubMed]
  33. Ge, M.-K.; Sun, E.-T.; Jia, C.-N.; Kong, D.-D.; Jiang, Y.-X. Genetic diversity and differentiation of Lepidoglyphus destructor (Acari: Glycyphagidae) inferred from Inter-Simple Sequence Repeat (ISSR) fingerprinting. Syst. Appl. Acarol. 2014, 19, 491–498. [Google Scholar] [CrossRef]
  34. Sauné, L.; Abella, F.; Kerdelhué, C. Isolation, characterization and PCR multiplexing of 17 microsatellite loci in the pine processionary moth Thaumetopoea pityocampa (Lepidoptera, Notodontidae). Conserv. Genet. Resour. 2015, 7, 755–757. [Google Scholar] [CrossRef]
  35. Aarnes, S.G.; Fløystad, I.; Schregel, J.; Vindstad, O.P.L.; Jepsen, J.U.; Eiken, H.G.; Ims, R.A.; Hagen, S.B. Identification and evaluation of 21 novel microsatellite markers from the autumnal moth (Epirrita autumnata) (Lepidoptera: Geometridae). Int. J. Mol. Sci. 2015, 16, 22541–22554. [Google Scholar] [CrossRef] [PubMed] [Green Version]
  36. Leite, N.; Corrêa, A.; Alves-Pereira, A.; Campos, J.; Zucchi, M.; Omoto, C. Cross-species amplification and polymorphism of microsatellite loci in Helicoverpa armigera and Helicoverpa zea (Lepidoptera: Noctuidae) in Brazilian cropping systems. Genet. Mol. Res. 2016, 15. [Google Scholar] [CrossRef] [PubMed]
  37. Cao, L.; Wen, J.; Wei, S.; Liu, J.; Yang, F.; Chen, M. Characterization of novel microsatellite markers for Hyphantria cunea and implications for other Lepidoptera. Bull. Entomol. Res. 2015, 105, 273–284. [Google Scholar] [CrossRef] [PubMed]
  38. Wang, Y.-Z.; Cao, L.-J.; Zhu, J.-Y.; Wei, S.-J. Development and characterization of novel microsatellite markers for the peach fruit moth Carposina sasakii (Lepidoptera: Carposinidae) using next-generation sequencing. Int. J. Mol. Sci. 2016, 17, 362. [Google Scholar] [CrossRef] [PubMed]
  39. Endersby, N.; McKechnie, S.; Vogel, H.; Gahan, L.; Baxter, S.; Ridland, P.; Weeks, A. Microsatellites isolated from diamondback moth, Plutella xylostella (L.), for studies of dispersal in Australian populations. Mol. Ecol. Resour. 2005, 5, 51–53. [Google Scholar] [CrossRef]
  40. Ishiguro, N.; Tsuchida, K. Polymorphic microsatellite loci for the rice stem borer, Chilo suppressalis (walker) (Lepidoptera: Crambidae). Appl. Entomol. Zool. 2006, 41, 565–568. [Google Scholar] [CrossRef]
  41. Delamaire, S.; Esselink, G.D.; Samiei, L.; Courtin, C.; Magnoux, E.; Rousselet, J.; Smulders, M.J. Isolation and characterization of six microsatellite loci in the larch budmoth Zeiraphera diniana (Lepidoptera: Tortricidae). Eur. J. Entomol. 2010, 107, 267. [Google Scholar] [CrossRef]
  42. Petenian, F.; Meglécz, E.; Genson, G.; Rasplus, J.Y.; Faure, E. Isolation and characterization of polymorphic microsatellites in Parnassius apollo and Euphydryas aurinia (Lepidoptera). Mol. Ecol. Resour. 2005, 5, 243–245. [Google Scholar] [CrossRef]
  43. Berman, M.; Austin, C.M.; Miller, A.D. Characterization of the complete mitochondrial genome and 13 microsatellite loci through next-generation sequencing for the new Caledonian spider-ant Leptomyrmex pallens. Mol. Biol. Rep. 2014, 41, 1179–1187. [Google Scholar] [CrossRef] [PubMed]
  44. Drag, L.; Kosnar, J.; Cizek, L. Development and characterization of ten polymorphic microsatellite loci for the great Capricorn beetle (Cerambyx cerdo) (Coleoptera: Cerambycidae). Conserv. Genet. Resour. 2013, 5, 907–909. [Google Scholar] [CrossRef]
  45. Elisa Posso, C.; González, R.; Cárdenas, H.; Gallego, G.; Duque, M.C.; Suarez, M.F. Random amplified polymorphic DNA analysis of Anopheles nuneztovari (Diptera: Culicidae) from western and Northeastern Colombia. Memórias do Instituto Oswaldo Cruz 2003, 95, 469–476. [Google Scholar] [CrossRef]
  46. Ciosi, M.; Masiga, D.K.; Turner, C.M.; Valenzuela, J.G. Laboratory colonisation and genetic bottlenecks in the tsetse fly Glossina pallidipes. PLoS Negl. Trop. Dis. 2014, 8, e2697. [Google Scholar] [CrossRef] [PubMed]
  47. Charman, T.G.; Sears, J.; Green, R.E.; Bourke, A.F. Conservation genetics, foraging distance and nest densityof the scarce great yellow bumblebee (Bombus distinguendus). Mol. Ecol. 2010, 19, 2661–2674. [Google Scholar] [CrossRef] [PubMed]
  48. Sarhan, A. Isolation and characterization of five microsatellite loci in the Glanville fritillary butterfly (Melitaea cinxia). Mol. Ecol. Resour. 2006, 6, 163–164. [Google Scholar] [CrossRef]
  49. Franck, P.; Reyes, M.; Olivares, J.; Sauphanor, B. Genetic architecture in codling moth populations: Comparison between microsatellite and insecticide resistance markers. Mol. Ecol. 2007, 16, 3554–3564. [Google Scholar] [CrossRef] [PubMed]
  50. Maxwell, S.A.; Thistlewood, H.; Keyghobadi, N. Population genetic structure of the western cherry fruit fly Rhagoletis indifferens (Diptera: Tephritidae) in British Columbia, Canada. Agric. For. Entomol. 2014, 16, 33–44. [Google Scholar] [CrossRef]
  51. Fuentes-Contreras, E.; Espinoza, J.L.; Lavandero, B.; Ramírez, C.C. Population genetic structure of codling moth (Lepidoptera: Tortricidae) from apple orchards in central Chile. J. Econ. Entomol. 2008, 101, 190–198. [Google Scholar] [CrossRef] [PubMed]
  52. Pichon, A.; Arvanitakis, L.; Roux, O.; Kirk, A.A.; Alauzet, C.; Bordat, D.; Legal, L. Genetic differentiation among various populations of the diamondback moth, Plutella xylostella Lepidoptera Yponomeutidae. Bull. Entomol. Res. 2006, 96, 137–144. [Google Scholar] [CrossRef] [PubMed]
  53. De La Poza, M.; Farinós, G.P.; Beroiz, B.; Ortego, F.; Hernández-Crespo, P.; Castañera, P. Genetic structure of Sesamia nonagrioides (lefebvre) populations in the Mediterranean area. Environ. Entomol. 2008, 37, 1354–1360. [Google Scholar] [CrossRef] [PubMed]
  54. Timm, A.E.; Geertsema, H.; Warnich, L. Gene flow among Cydia pomonella (Lepidoptera: Tortricidae) geographic and host populations in South Africa. J. Econ. Entomol. 2006, 99, 341–348. [Google Scholar] [CrossRef] [PubMed]
  55. Thaler, R.; Brandstätter, A.; Meraner, A.; Chabicovski, M.; Parson, W.; Zelger, R.; Dalla Via, J.; Dallinger, R. Molecular phylogeny and population structure of the codling moth (Cydia pomonella) in Central Europe: Li. AFLP analysis reflects human-aided local adaptation of a global pest species. Mol. Phylogenet. Evol. 2008, 48, 838–849. [Google Scholar] [CrossRef] [PubMed]
  56. Chen, H.; Wang, H.; Siegfried, B.D. Genetic differentiation of western corn rootworm populations (Coleoptera: Chrysomelidae) relative to insecticide resistance. Ann. Entomol. Soc. Am. 2012, 105, 232–240. [Google Scholar] [CrossRef]
  57. Magoc, T.; Salzberg, S.L. FLASH: Fast length adjustment of short reads to improve genome assemblies. Bioinformatic 2011, 27, 2957–2963. [Google Scholar] [CrossRef] [PubMed]
  58. Chevreux, B.; Wetter, T.; Suhai, S. Genome Sequence Assembly Using Trace Signals and Additional Sequence Information. In Computer Science and Biology, Proceedings of the German Conference on Bioinformatics, Hannover, Germany, 4–6 October 1999; Department of Bioinformatics: Braunschweig, Germany, 1999; Volume 99, pp. 45–56. [Google Scholar]
  59. Benson, G. Tandem repeats finder: A program to analyze DNA sequences. Nucleic Acids Res. 1999, 27, 573. [Google Scholar] [CrossRef] [PubMed]
  60. Untergasser, A.; Cutcutache, I.; Koressaar, T.; Ye, J.; Faircloth, B.C.; Remm, M.; Rozen, S.G. Primer3—New capabilities and interfaces. Nucleic Acids Res. 2012, 40, e115. [Google Scholar] [CrossRef] [PubMed]
  61. Raymond, M.; Rousset, F. Genepop (version 1.2): Population genetics software for exact tests and ecumenicism. J. Hered. 1995, 86, 248–249. [Google Scholar] [CrossRef]
  62. Nei, M. Analysis of gene diversity in subdivided populations. Proc. Natl. Acad. Sci. USA 1973, 70, 3321–3323. [Google Scholar] [CrossRef] [PubMed]
  63. Yeh, F.; Yang, R.; Boyle, T.; Ye, Z.; Xiyan, J. Popgene32, Microsoft Windows-Based Freeware for Population Genetic Analysis, Version 1.32; Molecular Biology and Biotechnology Centre, University of Alberta: Edmonton, AB, Canada, 2000. [Google Scholar]
  64. Evanno, G.; Regnaut, S.; Goudet, J. Detecting the number of clusters of individuals using the software structure: A simulation study. Mol. Ecol. 2005, 14, 2611–2620. [Google Scholar] [CrossRef] [PubMed]
  65. Earl, D.A. STRUCTURE HARVESTER: A website and program for visualizing STRUCTURE output and implementing the Evanno method. Conserv. Genet. Resour. 2012, 4, 359–361. [Google Scholar] [CrossRef]
  66. Excoffier, L.; Smouse, P.E.; Quattro, J.M. Analysis of molecular variance inferred from metric distances among DNA haplotypes: Application to human mitochondrial DNA restriction data. Genetics 1992, 131, 479–491. [Google Scholar] [PubMed]
  67. Schneider, S.; Roessli, D.; Excoffier, L. Arlequin: A software for population genetics data analysis. Genetic and Biometry Laboratory. Department of Anthropology, University of Geneva, Switzerland. User Manu. Ver 2000, 2, 2496–2497. [Google Scholar]
  68. Whitlock, M.C.; McCauley, D.E. Indirect measures of gene flow and migration: Fst ≠ 1/(4nm + 1). Heredity 1999, 82, 117–125. [Google Scholar] [CrossRef] [PubMed]
Sample Availability: Limited sample material may be available from the authors upon request.
Figure 1. Chromatograms from capillary electrophoresis showing panels of the five multiplex PCRs (Argon 1 to Argon 5) for the 19 tetranucleotide STRs from the apple fruit moth (Argyresthia conjugella).
Molecules 23 00850 g001aMolecules 23 00850 g001b
Figure 2. Population genetic structure analyses of 64 Argyresthia conjugella individuals using STRUCTURE. The insects are sorted according to Id number as in Supplementary Table S1 (W: Norway: Western region, E: Norway: Eastern region and S: Sweden).
Molecules 23 00850 g002
Figure 3. The geographical locations of the sampling areas. The sampling of Argyresthia conjugella was based on their exact global position coordinates (GPS).
Molecules 23 00850 g003
Table 1. Overview of the 19 tetranucleotide short tandem repeats (STRs) identified in the apple fruit moth (Argyresthia conjugella). Asterisk = number of repeats from sequencing.
LocusSize Range (bp)
Illumina MiSeq
n = 5
Size Range (bp)
ABI3730 Capillary Electrophoresis
n = 64
Repeat Motif
(Illumina MiSeq) *
Argcon37397–15398–246(TTGT)22
Argcon384121–196129–207(AACA)10
Argcon886119–137129–201(TTTC)7
Argcon1132205–247210–268(AGAA)7
Argcon1452214–247208–292(TCTT)9
Argcon1615120–164129–169(TTTG)10
Argcon1863231–246235–249(ACAT)7
Argcon2891239–251237–258(TATC)7
Argcon3484230–251230–258(TTGT)8
Argcon3606143–160151–183(ACAT)9
Argcon3813179–199188–216(TTCT)7
Argcon3887185–261188–340(AAGA)9
Argcon4899217–273214–386(TTCT)9
Argcon5649105–140111–151(AAAC)7
Argcon8345196–256204–260(TTTC)8
Argcon8461120–242122–306(TTTC)16
Argcon14321199–228205–233(TATC)8
Argcon17958154–192164–284(GTTT)9
Argcon2088997–143104–156(TTTC)12
Table 2. Five multiplex PCR panels (I to V) for the 19 STRs from Argyresthia conjugella. Primer combinations, primer concentrations and fluorescent dye for the STRs used in each multiplex reaction.
Multiplex PanelLocusPrimer Sequences (5′-3′) aPCR Concentration, DyeGene-Bank Accession No.
IArgcon_3606F: AGTGAACCTACTGAGCGTCC0.05 µM, NEDMF156559
R: GTTTCTTCCCTTATGGGAAAAGGCGTG
Argcon_3484F: GGGCAGCTGTTTCCCAATTC0.10 µM, NEDMF156558
R: GTTTCTTCTCCTCGTGCATTTTTGGG
Argcon_2891F: AGAACTGGGCCTCACGATAC0.10 µM, FAMMF156557
R: GTTTCTTGTTATCGGCATTCCACAAGGG
Argcon_886F: ACCCGACCTGAACATATCCG0.10 µM, PETMF156552
R: GTTTCTTCCATCGTTGGCACTTACGAG
IIArgcon_20889F: TGTGTCTAGTTTCTTGTATTTGTTGC0.10 µM, VICMF156568
R: GTTTCTTTAGTGTGGGCTAAGGGATGC
Argcon_384F: CATGTCTCCTCTTTGCAGCG0.15 µM, PETMF156551
R: GTTTCTTGTAAGGGAGTGTCGTGTTGC
Argcon_1863F: CGCCCCGGATTCTCAACTAC0.20 µM, NEDMF156556
R: GTTTCTTTCACCCCTCTCTGTATTCGTC
Argcon_3887F: CATTGTTGACAGCTCGGCAC0.25 µM, FAMMF156561
R: GTTTCTTGTGAGCCTTTCGGATTTGGG
IIIArgcon_14321F: TGTTTTGTTCAATCTGTATTACTTGTC0.15 µM, NEDMF156566
R: GTTTCTTACAGGGGGACAATCCAATCTAC
Argcon_5649F: AGCCCTACGACTCCATCAAC0.10 µM, FAMMF156563
R: GTTTCTTGCTAAACTATCCGTCGGCAC
Argcon_17958F: GCTCAGTGTATCAGGTACGAG0.20 µM, PETMF156567
R: GTTTCTTCGCTGTTCTACATGGAGCTG
Argcon_4899F: TCATGGTTTGGCATGTCGAG0.10 µM, VICMF156562
R: GTTTCTTAGTTCAAATCCGTCCTAAAAGC
IVArgcon_1615F: CCCCTTATTTGAGCAGTTGAGC0.05 µM, NEDMF156555
R: GTTTCTTGCAACATTATTTCGTCCGCAG
Argcon_8345F: GCTCAAACGGTTGTCCCTAC0.20 µM, PETMF156564
R: GTTTCTTGTATGCTACGGTTACAGGGC
Argcon_8461F: ACTTTACTGGCCTAGGTGCG0.15 µM, FAMMF156565
R: GTTTCTTCCAGGTGAAACATCGTGAGG
VArgcon_373F: AGTACCTCGTCGATACGCAC0.05 µM, VICMF156550
R: GTTTCTTAGGGGTGTCAGGATGTGATG
Argcon_3813F: GCTGTCGTAAACCCTTCCAC0.10 µM, PETMF156560
R: GTTTCTTGGCCCCATTGGTTCCATAAC
Argcon_1452F: AATAACAGTGGCACACCACG0.15 µM, FAMMF156554
R: GTTTCTTTATGCGGATTCCAAACGCAG
Argcon_1132F: TGTCTATGGAAGCCCCGATG0.15 µM, NEDMF156553
R: GTTTCTTGTTCCAAGATTTGCCGCTCC
a F forward, R reverse (5′ end GTTTCTT-tail on all R-primers [31]).
Table 3. Basic statistics of 19 STRs loci developed for Argyresthia conjugella in a survey of 64 individuals from Norway and Sweden.
LocusNANGHOHENeiFISHWE
p Values a
Argcon289110630.33330.60600.60120.44550.0087 **
Argcon36067640.60000.61360.60890.01460.9709
Arg348411640.37500.78260.77650.51710.0016 **
Arg8866640.51560.48010.4763−0.08250.0093 **
Arg388726590.44640.94840.93990.52500.0007 **
Arg208898640.60940.63800.63310.03740.0004 **
Arg18637550.14550.48160.47720.69520.0001 **
Arg38416620.70970.75780.75170.05590.0002 **
Arg564911640.45310.81080.80440.43670.0753 *
Argcon489920590.57140.84650.83900.31890.0001 **
Argcon143218640.60940.74640.74060.17720.1467
Argcon1795817640.72310.76590.76000.04860.0035 **
Argcon846124580.90740.90840.9000−0.00820.2887
Argcon161514570.57890.88710.87930.34160.0076 **
Argcon834518620.54840.85810.85120.35570.0012 **
Argcon145216380.58330.92210.90930.35850.0127 *
Argcon37321620.85480.93400.92650.07740.0016 **
Argcon113211620.61290.68080.67530.09240.0187 *
Argcon38138630.33870.55070.54630.38000.9939
Mean13.660.20.55350.74840.74190.2615
St, Dev0.18240.15170.150.0221
NA: number of different alleles per locus, NG: number of genotypes detected in the 64 Argyresthia conjugella individuals from each locus, HO: observed heterozygosity, HE: expected heterozygosity, Nei: genetic diversity estimated (Nei 1975), FIS: inbreeding value, HWE: significance of departure from Hardy-Weinberg equilibrium, * < 0.05, ** < 0.01; a Based on assay of 64 Argyresthia conjugella individuals from each locus.
Table 4. Analysis of molecular variance (AMOVA) of Argyresthia conjugella among the three sampling regions using 259 alleles.
Source of Variationd.f.Sum of SquaresVariance ComponentsPercentage of Variation
Among regions143.9440.364342.17
Among populations with regions448.28720.786122.24
Within regions57949.6497 15.4780195.60
Total62997.93716.26421
Table 5. Pair-wise FST values among the three sampling locations of Argyresthia conjugella in the study.
RegionsEast NorwaySwedenWest Norway
East Norway0.00000
Sweden0.015770.00000
West Norway0.025220.013730.0000

