Abstract
Real-time reverse transcription quantitative PCR has become a common method for studying gene expression, however, the optimal selection of stable reference genes is a prerequisite for obtaining accurate quantification of transcript abundance. Suitable reference genes for RT-qPCR have not yet been identified for Chinese prickly ash (Zanthoxylum bungeanum Maxim.). Chinese prickly ash is the source of an important food seasoning in China. In recent years, Chinese prickly ash has also been developed as a medicinal plant. The expression stabilities of ten genes (18S, 28S, EF, UBA, UBQ, TIF, NTB, TUA, RPS, and TIF5A) were evaluated in roots, stems, leaves, flowers and fruits at five developmental stages and also under stress from cold, drought, and salt. To do this we used three different statistical algorithms: geNorm, NormFinder and BestKeeper. Among the genes investigated, UBA and UBQ were found to be most stable for the different cultivars and different tissues examined, UBQ and TIF for fruit developmental stage. Meanwhile, EF and TUA were most stable under cold treatment, EF and UBQ under drought treatment and NTB and RPS under salt treatment. UBA and UBQ for all samples evaluated were most stably expressed, but 18S, TUA and RPS were found to be generally unreliable as reference genes. Our results provide a basis for the future selection of reference genes for biological research with Chinese prickly ash, under a variety of conditions.
1. Introduction
The genus Zanthoxylum belongs to the family Rutaceae and has a long history of cultivation in China where it is valued both as a food plant and also for its traditional medicinal properties [1]. The species Z. bungeanum Maxim. (ZBM) is native to eastern China and is used primarily as a peppery spice [2]. This is one of the eight main spices used in China and is an essential ingredient for hot pots [3]. A number of pharmacological studies have shown that ZBM extracts can also be used in the treatment of inflammatory diseases including ascariosis, diarrhea and dysentery [4].
Popularly known as ‘Chinese prickly ash’, the widely-cultivated ZBM includes two cultivars, Green Huajiao and Red Huajiao—thus named for the color of their fruits. These are especially used as a spice in indigenous kitchens in China [5]. The most important production centers for Chinese prickly ash are Shaanxi, Gansu and Sichuan provinces.
The study of reference gene selection for Chinese prickly ash can provide a basis for the quantitative analysis and for qualitative analysis of the related plant species. Housekeeping genes, such as Actin-depolymerizing factor (ACT), glyceraldehyde-3-phosphate dehydrogenase (GAPDH), α-Tubulin (TUB) [6] and elongation factor 1-alpha (EF), have often been used as reference genes [7]. The most common method for measuring mRNA expression level is reverse transcription quantitative real-time PCR (RT-qPCR). To obtain optimal evaluations of RT-qPCR data it is essential that the expression of the reference genes be stable [8]. Hence, reference gene expression level must be stable under a diversity of conditions. These conditions should include: at a range of stages of organ development, across a range of different plant tissues and under exposure to as wide a range as possible of stress conditions. Last, reference gene selection is critical for normalization. For plants, a large number of genes have been proposed as exhibiting sufficient stability to render them suitable as reference genes [9,10,11]. Choosing reliable reference genes as internal controls to normalize gene expression in qRT-PCR is extremely important for reducing errors and for determining accurate expressions of target genes [12].
In the present study with ZBM, the expression stabilities of 10 candidate reference genes were evaluated under a range of conditions and treatments. BestKeeper, geNorm and NormFinder were used to analyze the expression stabilities of these genes. The results not only identify useful reference gene resources in the genus Zanthoxylum but also offer a guide for related research with other plant species.
2. Results
Ten candidate reference genes (18S, 28S, EF, UBA, UBQ, TIF, NTB, TUA, RPS, and TIF5A) were assessed to normalize their expression stabilities in Chinese prickly ash using RT-qPCR. Cycle threshold values (Ct) were used to determine the expression levels of the 10 candidate reference genes in all samples. The expression stabilities of the ten candidate reference genes were analyzed using geNorm (version 3.5 Applied Biosystems, Foster City, CA, USA), NormFinder (version 0.953, Foster City, CA, USA) and BestKeeper (version 1, Foster City, CA, USA). A total of 10 candidate reference genes representing different classes were selected for the experiment. The gene symbols, descriptions, primer sequences, amplicon sizes, GeneBank accession numbers, amplification efficiencies (E) and correlation coefficients (R2) are listed in Table 1. After amplification of pooled cDNA, all primer pairs of the 10 reference genes yielded a single PCR product of the expected size. There was no evidence of primer dimer formation or of non-specific amplification (Figure 1). Meanwhile, the presence of single peaks in the melt curve analyses confirmed the specificity of amplicons and also indicated the melting temperatures (Figure 2). Among the genes investigated, UBA and UBQ were found to be most stable for the different cultivars and different tissues examined, UBQ and TIF for fruit developmental stage. Meanwhile, EF and TUA were most stable under cold treatment, EF and UBQ under drought treatment and NTB and RPS under salt treatment. UBA and UBQ for all samples evaluated were most stably expressed, but 18S, TUA and RPS were found to be generally unreliable as reference genes.

Table 1.
Primer and related information for the 10 candidate reference genes 18S, 28S, EF, UBA, UBQ, TIF, NTB, TUA, RPS, and TIF5A for quantitative RT-PCR analysis in Zanthoxylum bungeanum Maxim.
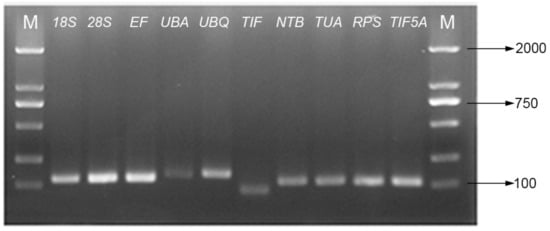
Figure 1.
Agarose gel analysis of primers specificities in amplification of candidate genes.
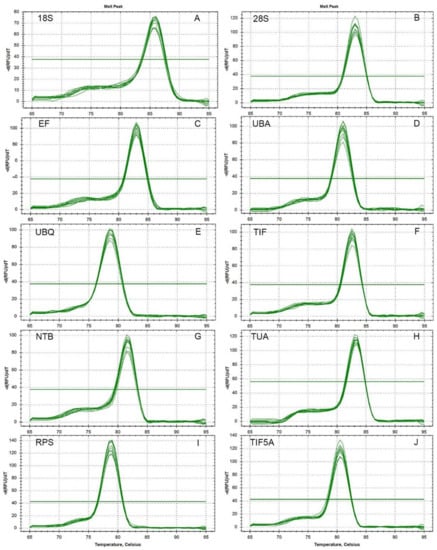
Figure 2.
Melt curves of the 10 reference genes, 18S, 28S, EF, UBA, UBQ, TIF, NTB, TUA, RPS, and TIF5A.
After 40 cycles of amplification, a melting curve analysis of each primer set was carried out using RT-qPCR. Single peaks indicate the expected amplicons were detected with SYBR Green. As indicated by the agarose gel electrophoreses, each of the ten primer pairs amplified a single band of the expected size from the various cDNA templates. The correlation coefficients (R2) ranged from 0.992 to 0.999 and the PCR amplification efficiencies between 92.8 and 108.4% (The theoretical range is 90% to 110%) were obtained from the standard curves generated using a five-fold serial dilution of cDNA.
The Ct values were monitored under seven conditions. These included: all samples; different cultivars; different tissues; different developmental stages of fruits; with/without cold stress; with/without drought stress and with/without salt stress. The mean Ct values of the 10 potential reference genes ranged from 21.29 to 33.58 (Table 2). In all tested samples, the mean Ct values showed a minimum of 21.29 ± 0.79 and a maximum of 31.48 ± 1.00 for the highest and lowest expression levels for 18S and TIF, respectively. 18S and 28S also showed minimum and maximum average Ct values, respectively, in all experimental groups, while UBA had maximum average Ct value of 33.58 ± 0.35.
Table 2.
Ct values of the ten reference genes (18S, 28S, EF, UBA, UBQ, TIF, NTB, TUA, RPS, and TIF5A) as calculated for Zanthoxylum bungeanum.
The coefficient of variation (CV) of the Ct values was used to evaluate the expression levels of candidate reference genes in the experiments. Low CV values indicate low variability (i.e., high stability) [12]. The CV of the 10 reference genes among all samples ranged between 0.55 and 8.61%. NTB was the least variable reference gene with a CV of 0.55% among the 10 candidate reference genes studied, RPS was the most variable with a CV of 8.61%. On the basis of the CV values, the stability ranking of all candidate reference genes was: TIF < NTB < EF< TIF5A < 28S < UBQ < UBA < 18S < RPS < TUA (Table 2).
2.1. geNorm Analysis
To evaluate gene expression stability, the geNorm analysis uses the reference gene expression stability measurement (M) value (calculated as the level of pairwise variation for each reference gene with all other control genes and as the SD of the logarithmically transformed expression ratios). High M values indicate low stability [13].
The plants were exposed to a range of treatments to generate data for the geNorm analysis. The Cq values were processed linearly using the ΔCq method. Next, the Cq values were converted to relative quantity values using the formula 2 − ΔCq (where ΔCq is Cq minus the minimum Cq value). The various reference genes had a range of different stabilities. geNorm calculates the value of Vn/n + 1 between normalization factors, which is then used to determine the number of reference genes required for optimal normalization. Vn/n + 1 values < 0.15 indicates that the introduction of additional genes will not contribute significantly to normalization [13]. The V2/3 values for total (0.146), different cultivars (0.116), different tissues (0.121), different fruits (0.090), cold treatments (0.084), drought treatments (0.075) and salt treatments (0.050) were all lower than 0.15 (Figure 3). This indicates two reference genes are sufficient for accurate normalization of all samples.
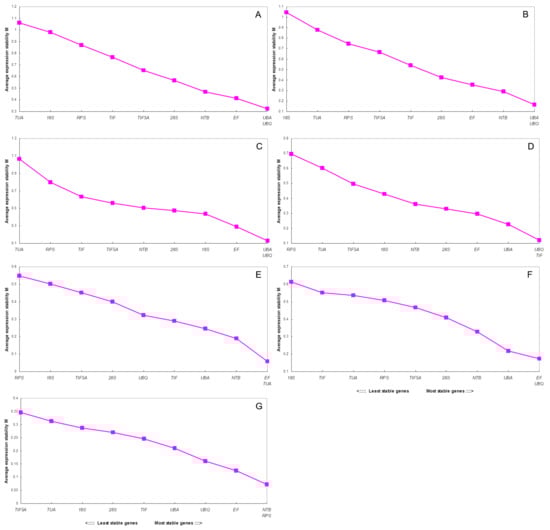
Figure 3.
Average expression stability values (M) of 10 candidate reference genes (18S, 28S, EF, UBA, UBQ, TIF, NTB, TUA, RPS, and TIF5A) by GeNorm analysis:(A) all samples; (B) different cultivars; (C) different tissues; (D) different developmental stages of fruits; (E) under cold stress; (F) under drought stress and (G) under salt stress.
In different cultivars, the most stable genes were UBA and UBQ. The M value obtained for these two genes was 0.165 (Figure 3B), and the V value was 0.116 (Figure 4). Meanwhile, in different tissues, these two genes also showed stability, M and V were 0.126 (Figure 3C) and 0.121 (Figure 4), respectively. In the cold treatments, EF and TUA were identified as the most stable genes, with an M value of 0.059 (Figure 3E) and V value of 0.084 (Figure 4). GeNorm indicates EF and UBQ as reliable reference genes in the drought stress treatment. Here, the M and V values of these two genes were 0.173 (Figure 3F) and 0.075 (Figure 4), respectively.
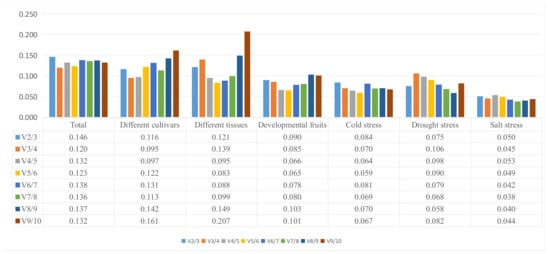
Figure 4.
Determination of best reference gene number calculated by geNorm pairwise variation (Vn/Vn + 1).
For fruits of different developmental stages, UBQ and TIF were considered the most stable genes, with an M value of 0.120 (Figure 3D) and a V value of 0.090 (Figure 4). In the salt-stress treatment, NTB and RPS were identified as the most stable genes in geNorm, with an M value of 0.073 (Figure 3G) and a V value of 0.050 (Figure 4). In the total materials, UBA and UBQ were the best reference genes, again according to geNorm, the M value obtained for these two genes was 0.323 (Figure 3A) and the V value was 0.146 (Figure 4). For different tissues, the most stable genes were EF and 18S but geNorm indicates 18S, TUA and RPS as unreliable reference genes for most experiments. More interestingly, the same reference genes seem to have different stabilities under different treatments. Thus, RPS was the most stable gene for salt stress and the least stable for cold stress.
Table 3 shows the results for all samples based on geNorm. The M values of EF (0.790) and UBQ (0.819) were <1.5. These were the lowest values from the gene expression analyses for all samples. In contrast, UBQ (0.731) and UBA (0.764) were the most stable genes among cultivars (i.e., having the lowest M values). In different tissues, EF (0.764) and 18S performed well in terms of gene expression stability. These results indicate that 28S (0.31) and UBQ (0.536) would be suitable for normalizing gene expression in developing fruits. For abiotic stress, gene expression stability was very different. We found TUA (0.407), TIF5A (0.507) and RPS (0.267) were the most stable genes under low-temperature stress, drought stress and salt stress, respectively.
Table 3.
Ranking of the candidate reference genes according to their stability value using geNorm.
2.2. NormFinder Analysis
NormFinder was used to identify the optimal normalization gene for any particular experimental design. As with geNorm, the data from a qRT-PCR should first be transformed [13]. The gene stability rankings are shown in Table 4. Distribution of the Cq-values of the ten candidate reference genes across all samples in qPCR analyses (Figure 5).
Table 4.
Stability analysis of candidate reference genes, as assayed with NormFinder software.
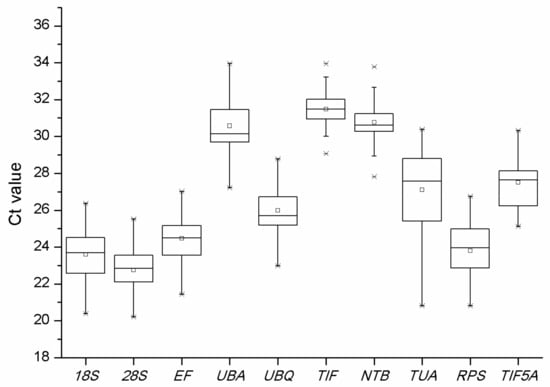
Figure 5.
Distribution of the Cq-values of the ten candidate reference genes (18S, 28S, EF, UBA, UBQ, TIF, NTB, TUA, RPS, and TIF5A) across all samples in qPCR analyses.
According to the NormFinder analysis, the two most stable reference genes for all samples (Total) were UBA (0.001) and NTB (0.001), while UBA and NTB were the most stable genes for different cultivars. The two most stable reference genes for different tissues samples were TIF5A and UBA. In different fruits samples, UBA and TIF ranked as the most stable reference genes, while RPS was the least stable reference gene in the group. UBA and TUA were considered the most stable reference genes by NormFinder in the cold treatments. TIF5A and UBQ were each ranked first for stability in the drought treatments and in the salt treatments, respectively.
However, in most samples, the stability ranking of candidate reference genes created with NormFinder was slightly different from that with GeNorm. For example, UBA and NTB were identified as the most stable reference genes for all samples and different cultivars in the NormFinder analysis but the stability rankings of UBA and UBQ were identified as the most stable with the GeNorm analysis.
2.3. BestKeeper Analysis
BestKeeper is an Excel™-based tool that uses pairwise correlation: to determine the stability of housekeeping genes, to identify differentially regulated target genes and to confirm sample integrity. BestKeeper can be used to analyze the stability of candidate reference genes, based on the CV and SD of the Cq values. It uses the average Cq value of each duplicate reaction [14].
The CV and the standard deviation (SD) of the candidate reference genes were used to evaluate reference gene stability in each experiment. Here, genes with low CV and SD values are the most stable [15]. The most stable reference genes present the lowest CV and SD (CV ± SD). Values of SD of less than 1 are considered an acceptable range of variation [16].
BestKeeper differs from the geNorm and the NormFinder analyses in that it can take as input for the analysis the raw Cq values. As with the NormFinder results, the CV ± SD rankings of the candidate genes increase from top to bottom, indicating a gradual stability decrease. For instance, NTB had a CV ± SD value of 0.55 ± 0.17 and is ranked as the most stable gene in drought stress, while, 18S is listed as the least stable gene, with a CV ± SD value of 2.22 ± 0.56 (Table 5).
Table 5.
Expression stability values of the ten candidate reference genes (18S, 28S, EF, UBA, UBQ, TIF, NTB, TUA, RPS, and TIF5A) calculated using BestKeeper.
3. Discussion
In general, an ideal reference gene is one that is stably expressed under a very wide range of experimental conditions and among a wide range of tissues. In this study, no one reference gene was consistently expressed across all samples evaluated. For example, UBA and UBQ were suitable as reference genes among different cultivars, different tissues and all samples, but these two genes were not stably expressed under abiotic stresses, like EF and TUA for the cold treatment, EF and UBQ for the drought treatment, NTB and RPS for the salt treatment. Meanwhile, UBQ and TIF were stably expressed among the fruit developmental stages.
From comparative analyses of previously published studies of reference gene identification for fruit developmental in other plants, we found two reference genes in this study had previously been chosen as optimal reference genes for fruit developmental in other plants. In bamboo, UBQ is the most stable among a range of tissues, while NTB is suitable among a range of tissues and over a range of developmental stages [17]. Our study draws similar conclusions, UBA and UBQ for all samples evaluated were stably expressed, and NTB is also very stable in the cold treatment. Abiotic stresses, such as drought, salinity and extreme temperatures, always limit plant growth and yield [11]. In our study, expression levels of the 10 candidate genes all decreased under the various abiotic stresses and, hence, the stability of gene expression reduced. Among different cultivars, UBA is the most stable gene but under drought or salt stresses, UBA is only the sixth and the fifth most stable gene, respectively. In this study, geNorm, NormFinder and BestKeeper were adopted to evaluate the stability of gene expression, and the results showed some difference among the three methods. If a candidated gene showed good stability under two of the methods, it was considered as stable inference gene.
A few genes have been used repeatedly as reference genes in a range of plant species. These include EF, UBC, EXP, GAPDH and F-box protein [6,7,18,19,20,21]. Recent studies suggest these genes are not always expressed stably in other species or under a different experimental conditions [7]. For example, EXP and UBQ have been shown to perform poorly and be less stable under ABA treatment [2]. GADPH and F-box protein have not been considered suitable reference genes for RT-qPCR data normalization [22].
In the roots, stems, leaves, flowers and seeds of mature plants, elongation factor-1alpha (EF) has been suggested as a useful reference gene for RT-qPCR in Plukenetia volubilis L. [23]. However, in this study, this gene did not appear to be the best, as some variation in expression appeared among the treatments. In Descurainia sophia, 18S was the most stable reference gene in all samples tested [24]. This gene has also been used as the reference gene for target gene expression analysis in papaya under a range of experimental conditions [25]. Nevertheless, in our study, the 18S gene with M of 1.1381 did not prove a good reference gene for RT-qPCR data normalization.
Through comparative analyses of our experimental results, the performance of these housekeeping genes among different species is very variable, and is also variable in the same species but under different experimental treatments. The results presented here not only identify optimal reference genes for qPCR analysis in Zanthoxylum bungeanum, but also offer guidelines for identification of reference genes in other plant species.
4. Materials and Methods
4.1. Materials
4.1.1. Plant Materials
Leaves of five cultivars of Z. bungeanum were collected—Fengxiandahongpao, Fuguhuajiao, Hanchengdahongpao, Xinongwuci and Hanyuanhuajiao. Fruits of Fengxiandahongpao were collected at five developmental stages—young fruit, enlarging fruit, green mature fruit, half-red fruit and full-red fruit. Five organs/tissues of “Fengxiandahongpao” were collected from three trees including: roots, stems, leaves, flowers and fruits. In addition, three kinds of stress treatment were imposed on carried out with one-year-old Chinese Prickly ash seedlings, which were salt stress, drought stress and cold stress. Each sampling was repeated three times.
Materials were harvested from the Experimental Station of Zanthoxylum bungeanum, Northwest A&F University in Fengxian, Shaanxi, China. The fruit samples were quickly shelled and cut into small pieces, these were immersed in liquid nitrogen and stored at −80 °C. The leaves were frozen directly in liquid nitrogen and then stored at −80 °C pending RNA extraction.
4.1.2. Stress Treatments
Uniform, one-year-old Chinese Prickly ash seedlings were used as experimental material. The ZBM plants were subjected to three abiotic stress treatments: (1) salt stress, (2) drought stress and (3) cold stress. For salt stress plants were transferred from 50% Murashige and Skoog medium (½MS) to fresh ½MS supplemented with 1.2% NaCl. For drought stress, drought was simulated using 15% PEG 6000 added to ½MS. For cold stress: roots were watered with ½MS in daylight and then placed in a 4 °C controlled temperature environment. The samples of all treatments were collected after 0, 4, 24 and 48 h.
4.2. Methods
4.2.1. Total RNA Extraction and cDNA Synthesis
Total RNA was extracted from all samples and purified using the TaKaRa MiniBEST Plant RNA Extraction Kit (TaKaRa, Beijing, China) according to the manufacturer’s instructions. Total RNA purity and concentration were determined using a NanoDrop 20000 (Thermo Scientific, Pittsburgh, PA, USA). Only RNA samples with OD260/280 ratios between 1.8 and 2.2, and OD260/230 ratios higher than 2.0 were used for cDNA synthesis.
4.2.2. Primer Design and qPCR
The candidate genes were selected from the research of the related families and some traditional reference genes [6]. Based on the genome sequencing of Citrus sinensis [26] and Zanthoxylum transcriptional data, 10 candidate reference genes were selected (18S, 28S, EF, UBA, UBQ, TIF, NTB, TUA, RPS, and TIF5A). The sequences were downloaded from NCBI and then compared on the NCBI website, selecting the conserved sequence for primer design. Ten pairs of primers were designed using Primer Premier 5.0 (Palo Alto, CA, USA).
The sequences of all primers used in study are listed in Table 1. To test the stability of reference gene expression, qRT-PCR was used to measure the transcript levels. The qRT-PCR assays were carried out on a CFX96 Real-Time PCR Detection System (Bio-Rad, Hercules, CA, USA). A standard curve was produced using serial dilutions of a cDNA from Zanthoxylum bungeanum. This was used to evaluate the efficiency of each primer set. Each 10 μL reaction used 5 μL of 2× SYBR Premix Ex Taq Ⅱ (TaKaRa), 1 μL of cDNA, 0.5 μL of each primer with a final concentration of 1 μM, and 3 μL ddH2O. qRT-PCR amplifications were carried out using the program: 95 °C for 30 s followed by 40 cycles of 94 °C for 5 s, 54 °C for 30 s, and 72 °C for 45 s. The PCR products were then analyzed on 1% (m/v) agarose gel.
5. Conclusions
In this study, ten candidate reference genes were selected, to evaluate their expression stabilities by qRT-PCR under three abiotic treatments, among different plant tissues, between different cultivars and among fruits at different stages of development. To do this, we used the geNorm, NormFinder and BestKeeper statistical algorithms. We show that the following genes were stably expressed: UBA and UBQ for the different cultivars, UBA and UBQ for the different tissues, UBQ and TIF for fruit development, EF and TUA for the cold treatment, EF and UBQ for the drought treatment, NTB and RPS for the salt treatment and UBA and UBQ for all samples.
Acknowledgments
The authors thank Jing Ye for his excellent technical assistance.
Author Contributions
Anzhi Wei conceived the project. Xitong Fei designed the experiments and performed the experiment. Xitong Fei wrote the paper. Xitong Fei, Qianqian Shi, Tuxi Yang, Zhaoxue Fei and Anzhi Wei discussed the results and commented on the manuscript.
Conflicts of Interest
The authors declare no conflict of interest.
References
- Feng, S.J.; Yang, T.X.; Liu, Z.S.; Chen, L.; Hou, N.; Wang, Y.; Wei, A. Genetic diversity and relationships of wild and cultivated Zanthoxylum germplasms based on sequence-related amplified polymorphism (SRAP) markers. Genet. Resour. Crop Evol. 2015, 62, 1193–1204. [Google Scholar] [CrossRef]
- Li, J.; Hui, T.; Wang, F.; Li, S.; Cui, B.; Cui, Y.; Peng, Z. Chinese red pepper (Zanthoxylum bungeanum Maxim.) leaf extract as natural antioxidants in salted silver carp (Hypophthalmichthys molitrix) in dorsal and ventral muscles during processing. Food Control 2015, 56, 9–17. [Google Scholar] [CrossRef]
- Huang, D.M.; Zhao, G.H.; Chen, Z.D.; Kan, J.Q. The food culture of Chinese prickly ash. China Condiment 2006, 1, 75–81. [Google Scholar]
- Wei, S.; Zhang, H.; Wang, Y.; Wang, L.; Li, X.; Wang, Y.; Zhang, H.; Xu, X.; Shi, Y. Ultrasonic nebulization extraction-heating gas flow transfer-headspace single drop microextraction of essential oil from pericarp of Zanthoxylum bungeanum Maxim. J. Chromatogr. A 2011, 29, 4599–4605. [Google Scholar] [CrossRef] [PubMed]
- Zhang, J.; Jiang, L. Acid-catalyzed esterification of Zanthoxylum bungeanum seed oil with high free fatty acids for biodiesel production. Bioresour. Technol. 2008, 99, 8995–8998. [Google Scholar] [CrossRef] [PubMed]
- Mafra, V.; Kubo, K.S.; Alves-Ferreira, M.; Ribeiro-Alves, M.; Stuart, R.M.; Boava, L.P.; Rodrigues, C.M.; Machado, M.A. Reference genes for accurate transcript normalization in citrus genotypes under different experimental conditions. PLoS ONE 2012, 7, e31263. [Google Scholar] [CrossRef] [PubMed]
- Bu, J.; Zhao, J.; Liu, M. Expression Stabilities of Candidate Reference Genes for RT-qPCR in Chinese Jujube (Ziziphus jujuba Mill.) under a Variety of Conditions. PLoS ONE 2016, 11, e0154212. [Google Scholar] [CrossRef] [PubMed]
- Zhang, C.; Huang, J.; Li, X. Identification of appropriate reference genes for RT-qPCR analysis in Ziziphus jujuba Mill. Sci. Hortic. 2015, 197, 166–169. [Google Scholar] [CrossRef]
- Duan, M.; Wang, J.; Zhang, X.; Yang, H.; Wang, H.; Qiu, Y.; Song, J.; Guo, Y.; Li, X. Identification of Optimal Reference Genes for Expression Analysis in Radish (Raphanus sativus L.) and Its Relatives Based on Expression Stability. Front. Plant Sci. 2017, 8, 1605. [Google Scholar] [CrossRef] [PubMed]
- Liu, Q.; Qi, X.; Yan, H.; Huang, L.; Nie, G.; Zhang, X. Reference Gene Selection for Quantitative Real-Time Reverse-Transcriptase PCR in Annual Ryegrass (Lolium multiflorum) Subjected to Various Abiotic Stresses. Molecules 2018, 23. [Google Scholar] [CrossRef] [PubMed]
- Cai, J.; Li, P.; Luo, X.; Chang, T.; Li, J.; Zhao, J.; Xu, Y. Selection of appropriate reference genes for the detection of rhythmic gene expression via quantitative real-time PCR in Tibetan hulless barley. PLoS ONE 2018, 13, e0190559. [Google Scholar] [CrossRef] [PubMed]
- Han, P.-P.; Qin, L.; Li, Y.-S.; Liao, X.-S.; Xu, Z.-X.; Hu, X.-J.; Xie, L.-H.; Yu, C.-B.; Wu, Y.-F.; Liao, X. Identification of suitable reference genes in leaves and roots of rapeseed (Brassica napus L.) under different nutrient deficiencies. J. Integr. Agric. 2017, 16, 809–819. [Google Scholar] [CrossRef]
- Andersen CL, J.J.; Ørntoft, T.F. Normalization of real-time quantitative reverse transcription-PCR data: A Model-based variance estimation approach to identify genes suited for normalization, applied to bladder and colon cancer data sets. Cancer Res. 2004, 64, 5245–5250. [Google Scholar] [CrossRef] [PubMed]
- Michael, W.; Pfaffl, A.T.C.P.; Neuvians, T.P. Determination of stable housekeeping genes, differentially regulated target genes and sample integrity: BestKeeper-Excel-based tool using pair-wise correlations. Biotechnol. Lett. 2004, 26, 509–515. [Google Scholar]
- Xiao, X.M.J.; Wang, J.; Wu, X.; Li, P.; Yao, Y. Validation of suitable reference genes for gene expression analysis in the halophyte Salicornia europaea by real-time quantitative PCR. Front. Plant Sci. 2014, 788. [Google Scholar] [CrossRef] [PubMed]
- Vandesompele, J.D.P.K.; Pattyn, F.; Poppe, B.; Van Roy, N.; De Paepe, A. Accurate normalization of real-time quantitative RT-PCR data by geometric averaging of multiple internal control genes. Genome Biol. 2002. [Google Scholar] [CrossRef]
- Fan, C.; Ma, J.; Guo, Q.; Li, X.; Wang, H.; Lu, M. Selection of Reference Genes for Quantitative Real-Time PCR in Bamboo (Phyllostachys edulis). PLoS ONE 2013, 8, 1–8. [Google Scholar] [CrossRef]
- Shivhare, R.; Lata, C. Selection of suitable reference genes for assessing gene expression in pearl millet under different abiotic stresses and their combinations. Sci. Rep. 2016, 6, 23036. [Google Scholar] [CrossRef] [PubMed]
- Hong, S.Y.; Seo, P.J.; Yang, M.S.; Xiang, F.; Park, C.M. Exploring valid reference genes for gene expression studies in Brachypodium distachyon by real-time PCR. BMC Plant Biol. 2008, 8, 112. [Google Scholar] [CrossRef] [PubMed]
- Pollier, J.; Vanden Bossche, R.; Rischer, H.; Goossens, A. Selection and validation of reference genes for transcript normalization in gene expression studies in Catharanthus roseus. Plant Physiol. Biochem. 2014, 83, 20–25. [Google Scholar] [CrossRef] [PubMed]
- Li, M.Y.; Wang, F.; Jiang, Q.; Wang, G.L.; Tian, C.; Xiong, A.-S. Validation and Comparison of Reference Genes for qPCR Normalization of Celery (Apium graveolens) at Different Development Stages. Front. Plant Sci. 2016, 7, 313. [Google Scholar] [CrossRef]
- Maroufi, A. Selection of reference genes for real-time quantitative PCR analysis of gene expression in Glycyrrhiza glabra under drought stress. Biol. Plant. 2016, 60, 645–654. [Google Scholar] [CrossRef]
- Niu, L.; Tao, Y.B.; Chen, M.S.; Fu, Q.; Li, C.; Dong, Y.; Wang, X.; He, H.; Xu, Z.F. Selection of Reliable Reference Genes for Gene Expression Studies of a Promising Oilseed Crop, Plukenetia volubilis, by Real-Time Quantitative PCR. Int. J. Mol. Sci. 2015, 16, 12513–12530. [Google Scholar] [CrossRef] [PubMed]
- Xu, X.; Liu, X.; Chen, S.; Li, B.; Wang, X.; Ni, H. Selection of relatively exact reference genes for gene expression studies in flixweed (Descurainia sophia) by quantitative real-time polymerase chain reaction. Pestic. Biochem. Physiol. 2016, 127, 59–66. [Google Scholar] [CrossRef] [PubMed]
- Zhu, X.; Li, X.; Chen, W.; Chen, J.; Lu, W.; Chen, L.; Fu, D. Evaluation of new reference genes in papaya for accurate transcript normalization under different experimental conditions. PLoS ONE 2012, 7, e44405. [Google Scholar] [CrossRef] [PubMed]
- Xu, Q.; Chen, L.L.; Ruan, X.; Chen, D.; Zhu, A.; Chen, C.; Bertrand, D.; Jiao, W.; Hao, B.; Lyon, M.P.; et al. The draft genome of sweet orange (Citrus sinensis). Nat. Genet. 2013, 45, 59–66. [Google Scholar] [CrossRef] [PubMed]
Sample Availability: Samples of the compounds are available from the authors. |
© 2018 by the authors. Licensee MDPI, Basel, Switzerland. This article is an open access article distributed under the terms and conditions of the Creative Commons Attribution (CC BY) license (http://creativecommons.org/licenses/by/4.0/).