Article

Identification of Ubiquinones in Honey: A New View on Their Potential Contribution to Honey’s Antioxidant State

by
Katrina Brudzynski
1,* and
Liset Maldonado-Alvarez
2
1
Department Drug Discovery and Development, Bee-Biomedicals Inc., St. Catharines, ON L2S 3A1, Canada
2
Department of Biochemistry, McMaster University, Hamilton, ON L8S 4L8, Canada
*
Author to whom correspondence should be addressed.
Molecules 2018, 23(12), 3067; https://doi.org/10.3390/molecules23123067
Submission received: 12 November 2018 / Revised: 21 November 2018 / Accepted: 21 November 2018 / Published: 23 November 2018
(This article belongs to the Special Issue Biological Activities of Honeybee Products)

Abstract

:
Honey is composed of macromolecules arranged into multicomponent colloidal particles dispersed in a supersaturated sugar solution. The core part of colloidal particles in honey is made up of high-molecular weight protein-polyphenol complexes. We designed a multi-step extraction process to gain better insight into the phenolic compounds strongly bound to proteins in honey. Honeys were sequentially extracted by solvents of reduced polarities and the extraction process was monitored by LC-ESI-MS/MS. Unexpectedly, the results revealed ubiquinone-like compounds that partitioned to both, soluble supernatants and protein-bound insoluble residues from which they were released after the pronase-digestion of proteins. The accurate mass measurement and MS/MS fragmentation patterns using UPHLC-MS/MS coupled to quadrupole orbitrap confirmed their identification as ubiquinones. Distribution of ubiquinone-bound proteins was further investigated by the fractionation of honey protein-polyphenol complexes by size-exclusion chromatography followed by LC-ESI-MS analysis. Mass spectra revealed the presence of ubiquinones (UQs) in fractions of high polyphenol to protein ratio. The dominant mass peaks observed in these fractions were identified as UQ-3, UQ-5, and UQ-7. Since the quinone group of UQs is involved in redox reaction, we discuss the possibility that UQs may contribute to the antioxidant/proxidant activity of these complexes.

1. Introduction

Protein-polyphenol complexes are an integral part of honey colloids [1,2,3]. Honey proteins, through the interaction with other proteins and polyphenols, are able to form high molecular weight complexes and aggregates. The driving force in the protein-polyphenol complexation is a hydrophobic force/effect which is responsible for the formation of colloidal particle. Due to the hydrophobic effect, the hydrophilic proteins exposed to the outside of particle interact with aqueous sugar solution while burying nonpolar, hydrophobic molecules, such as polyphenols and other terpenoids with ring structures, inside the colloid [4,5]. Assembly into transient or irreversible protein-polyphenol complexes depends on whether the interaction between these molecules leads to formation non-covalent or covalent bonds. The type of the bond, in turn, is determined by the polyphenol basic structure, the degree of hydroxylation, glycosylation on one hand and acylation, conjugation with other phenolics, and polymerization on the other hand, respectively [2,5,6,7].
Relatively little is known about the chemical nature of honey phenolics that are covalently bound to proteins. The aim of this study was to identify phenolic compounds able to form strong complexes with honey proteins. To get some insight into their structure, we employed liquid–liquid sequential extraction of honey with solvents of reduced polarities. Polar solvents such as are ethanol, methanol, acetone, and ethyl acetate in different proportion to water are commonly used to extract non-covalently bound phenolics [8,9,10]. Nonpolar phenolic polymers can be extracted with less polar solvents like acetone, hexane, chloroform, or dichloromethane [8]. In contrast, the covalent binding to proteins might render phenolic compounds non-extractable by conventional solvents. In such a case, enzymatic or alkaline hydrolysis of proteins is required to release phenolics that remained bound after liquid–liquid extraction. With this in mind, we developed a simple method of extraction of phenolics from protein-polyphenol complexes in honey. The phenolic compositions of the free and bound fractions were analyzed by LC-ESI-MS methods. However, unexpectedly, the extraction procedure provided unknown isoprenoid quinones that partitioned into soluble (supernatants) and particulate, protein-bound fractions. Mass spectra and exact mass measurements identified these compounds as ubiquinone UQ-3, UQ-5 and UQ-7.

2. Results and Discussion

2.1. Extraction and Separation of Ubiquinone-Like Compounds

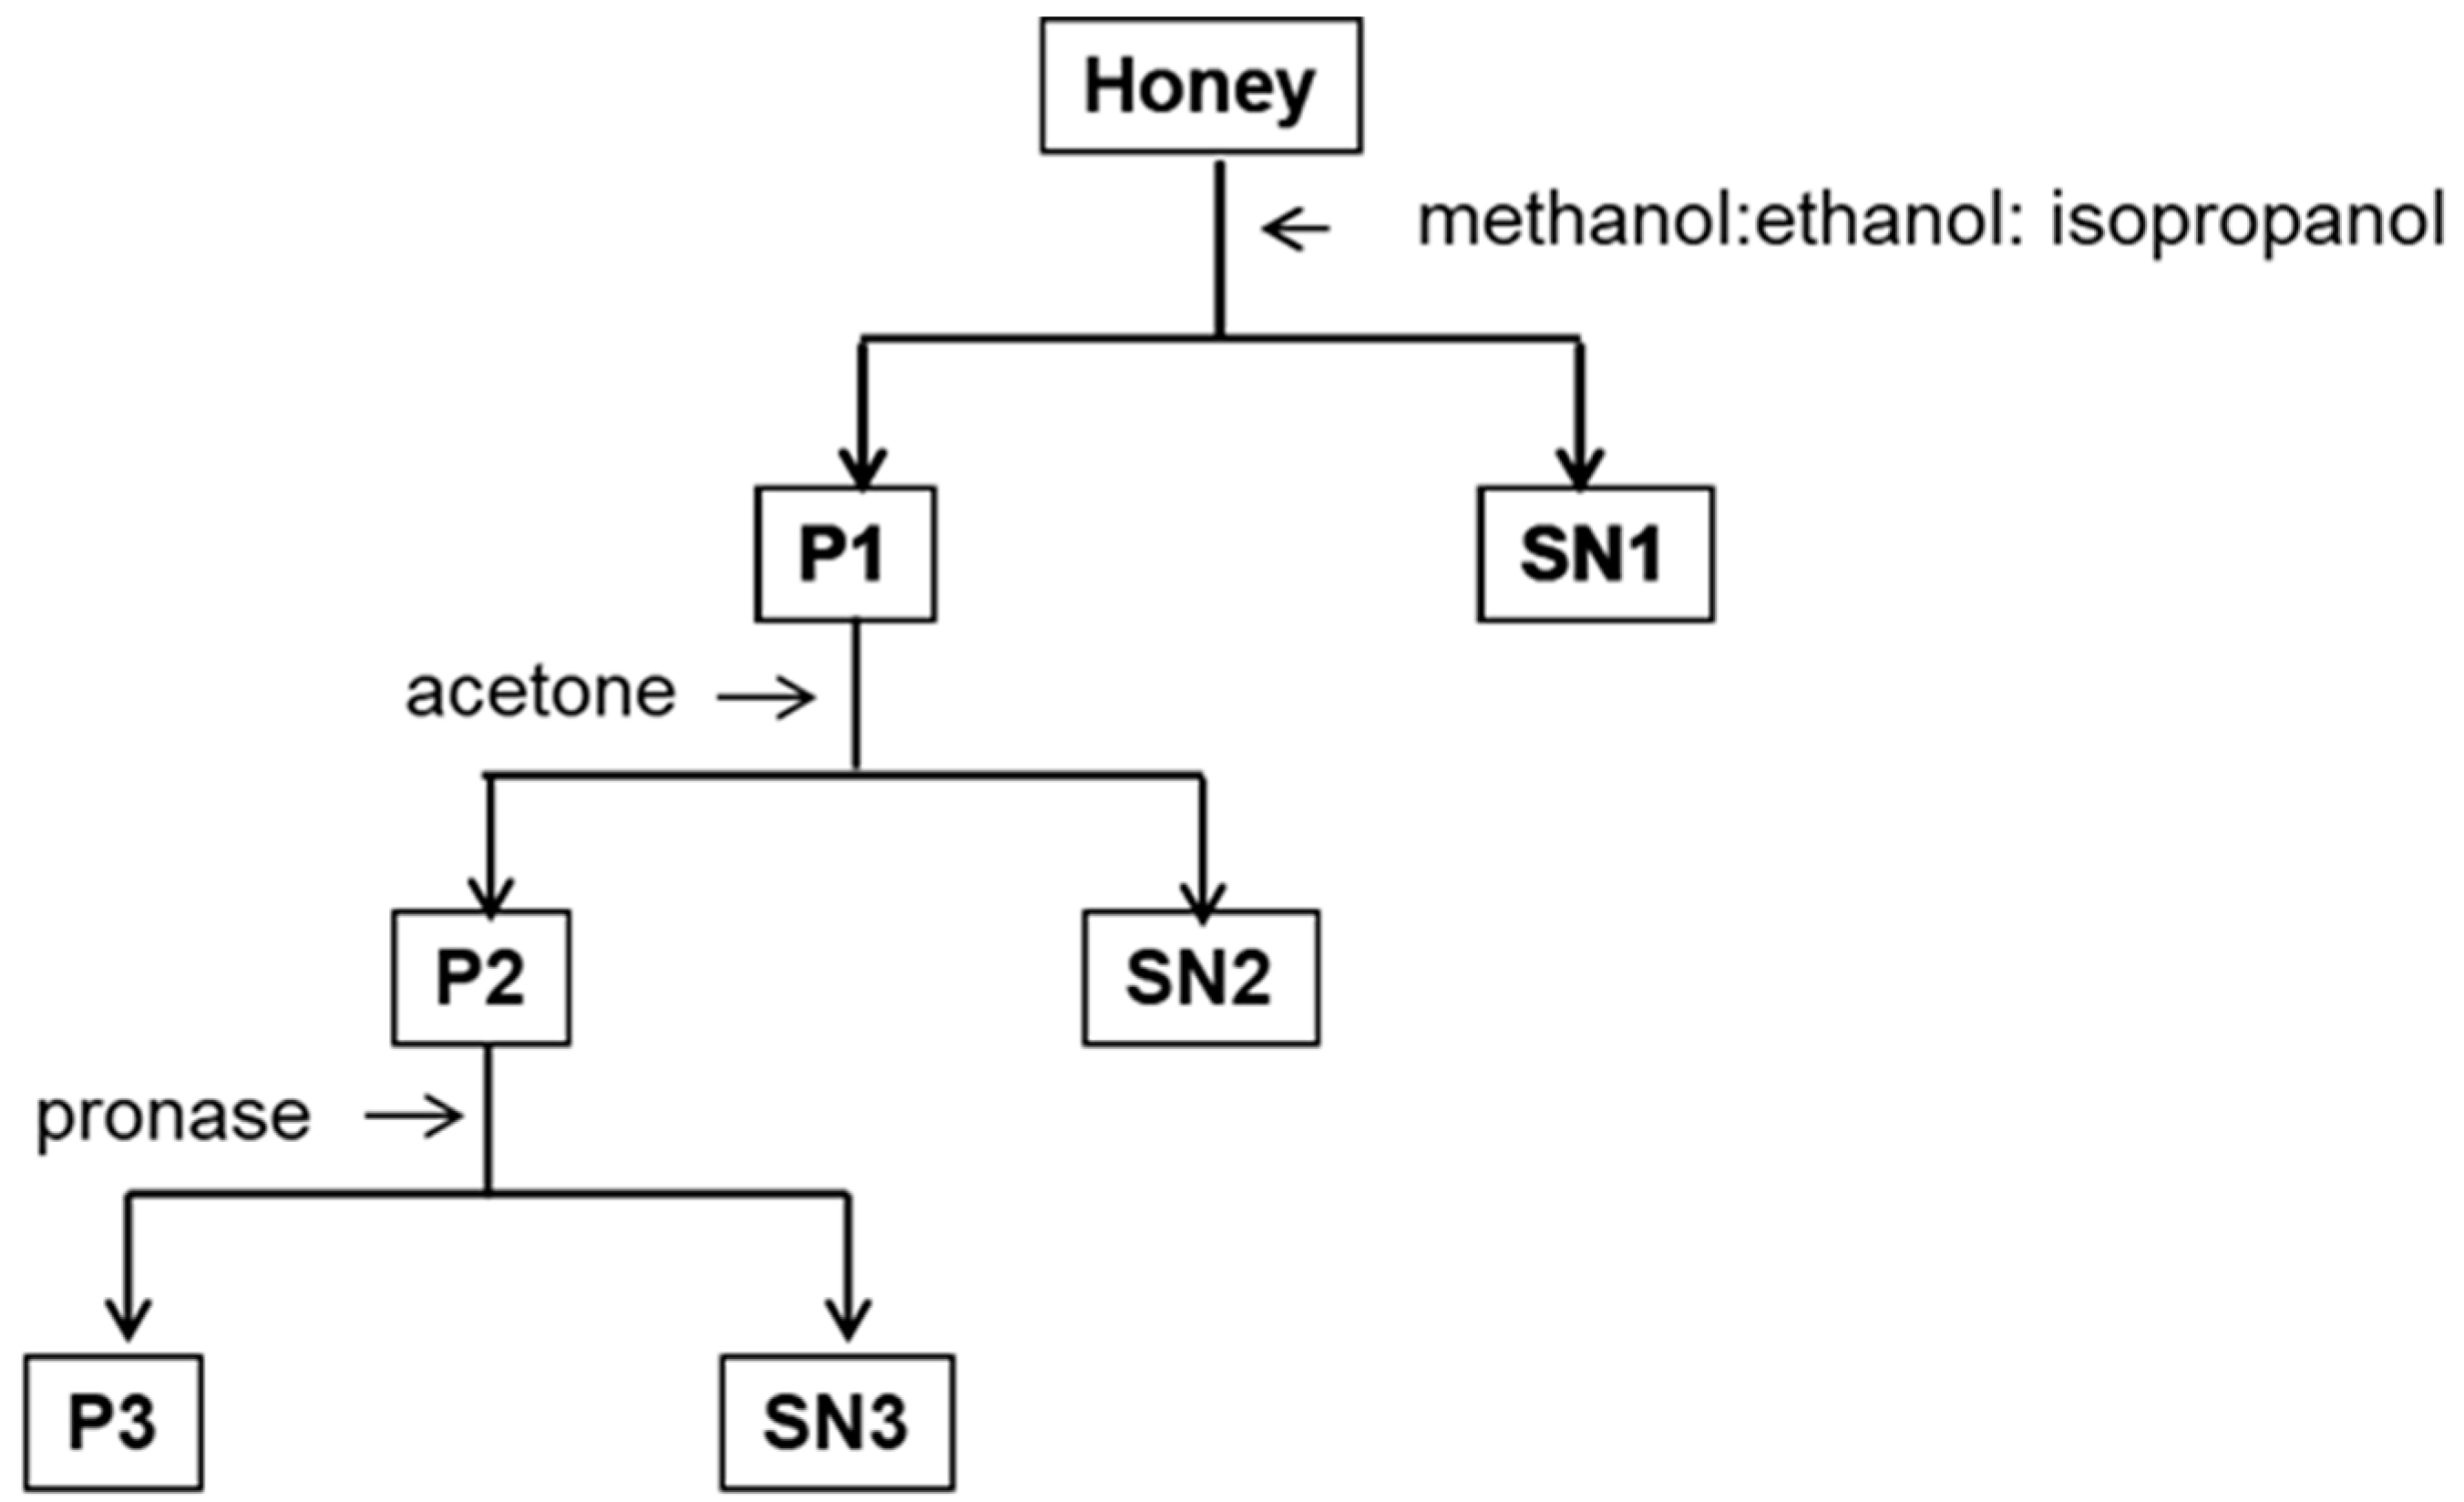
Honey high molecular complexes were precipitated using a mixture of methanol: ethanol: isopropanol (1:1:1), followed by acetone extraction and finally, followed by pronase digestion of the water-insoluble pellet. The use of solvents of reduced polarity aimed to increase the yield of extraction of phenolic compounds of different chain length and hydrophobicity. Obtained supernatants, SN1, SN2, and SN3 were lyophilized, dissolved in methanol and cleanup by solid-phase extraction. The composition of the extracted compounds was analyzed by LC-ESI-MS (Figure 1).
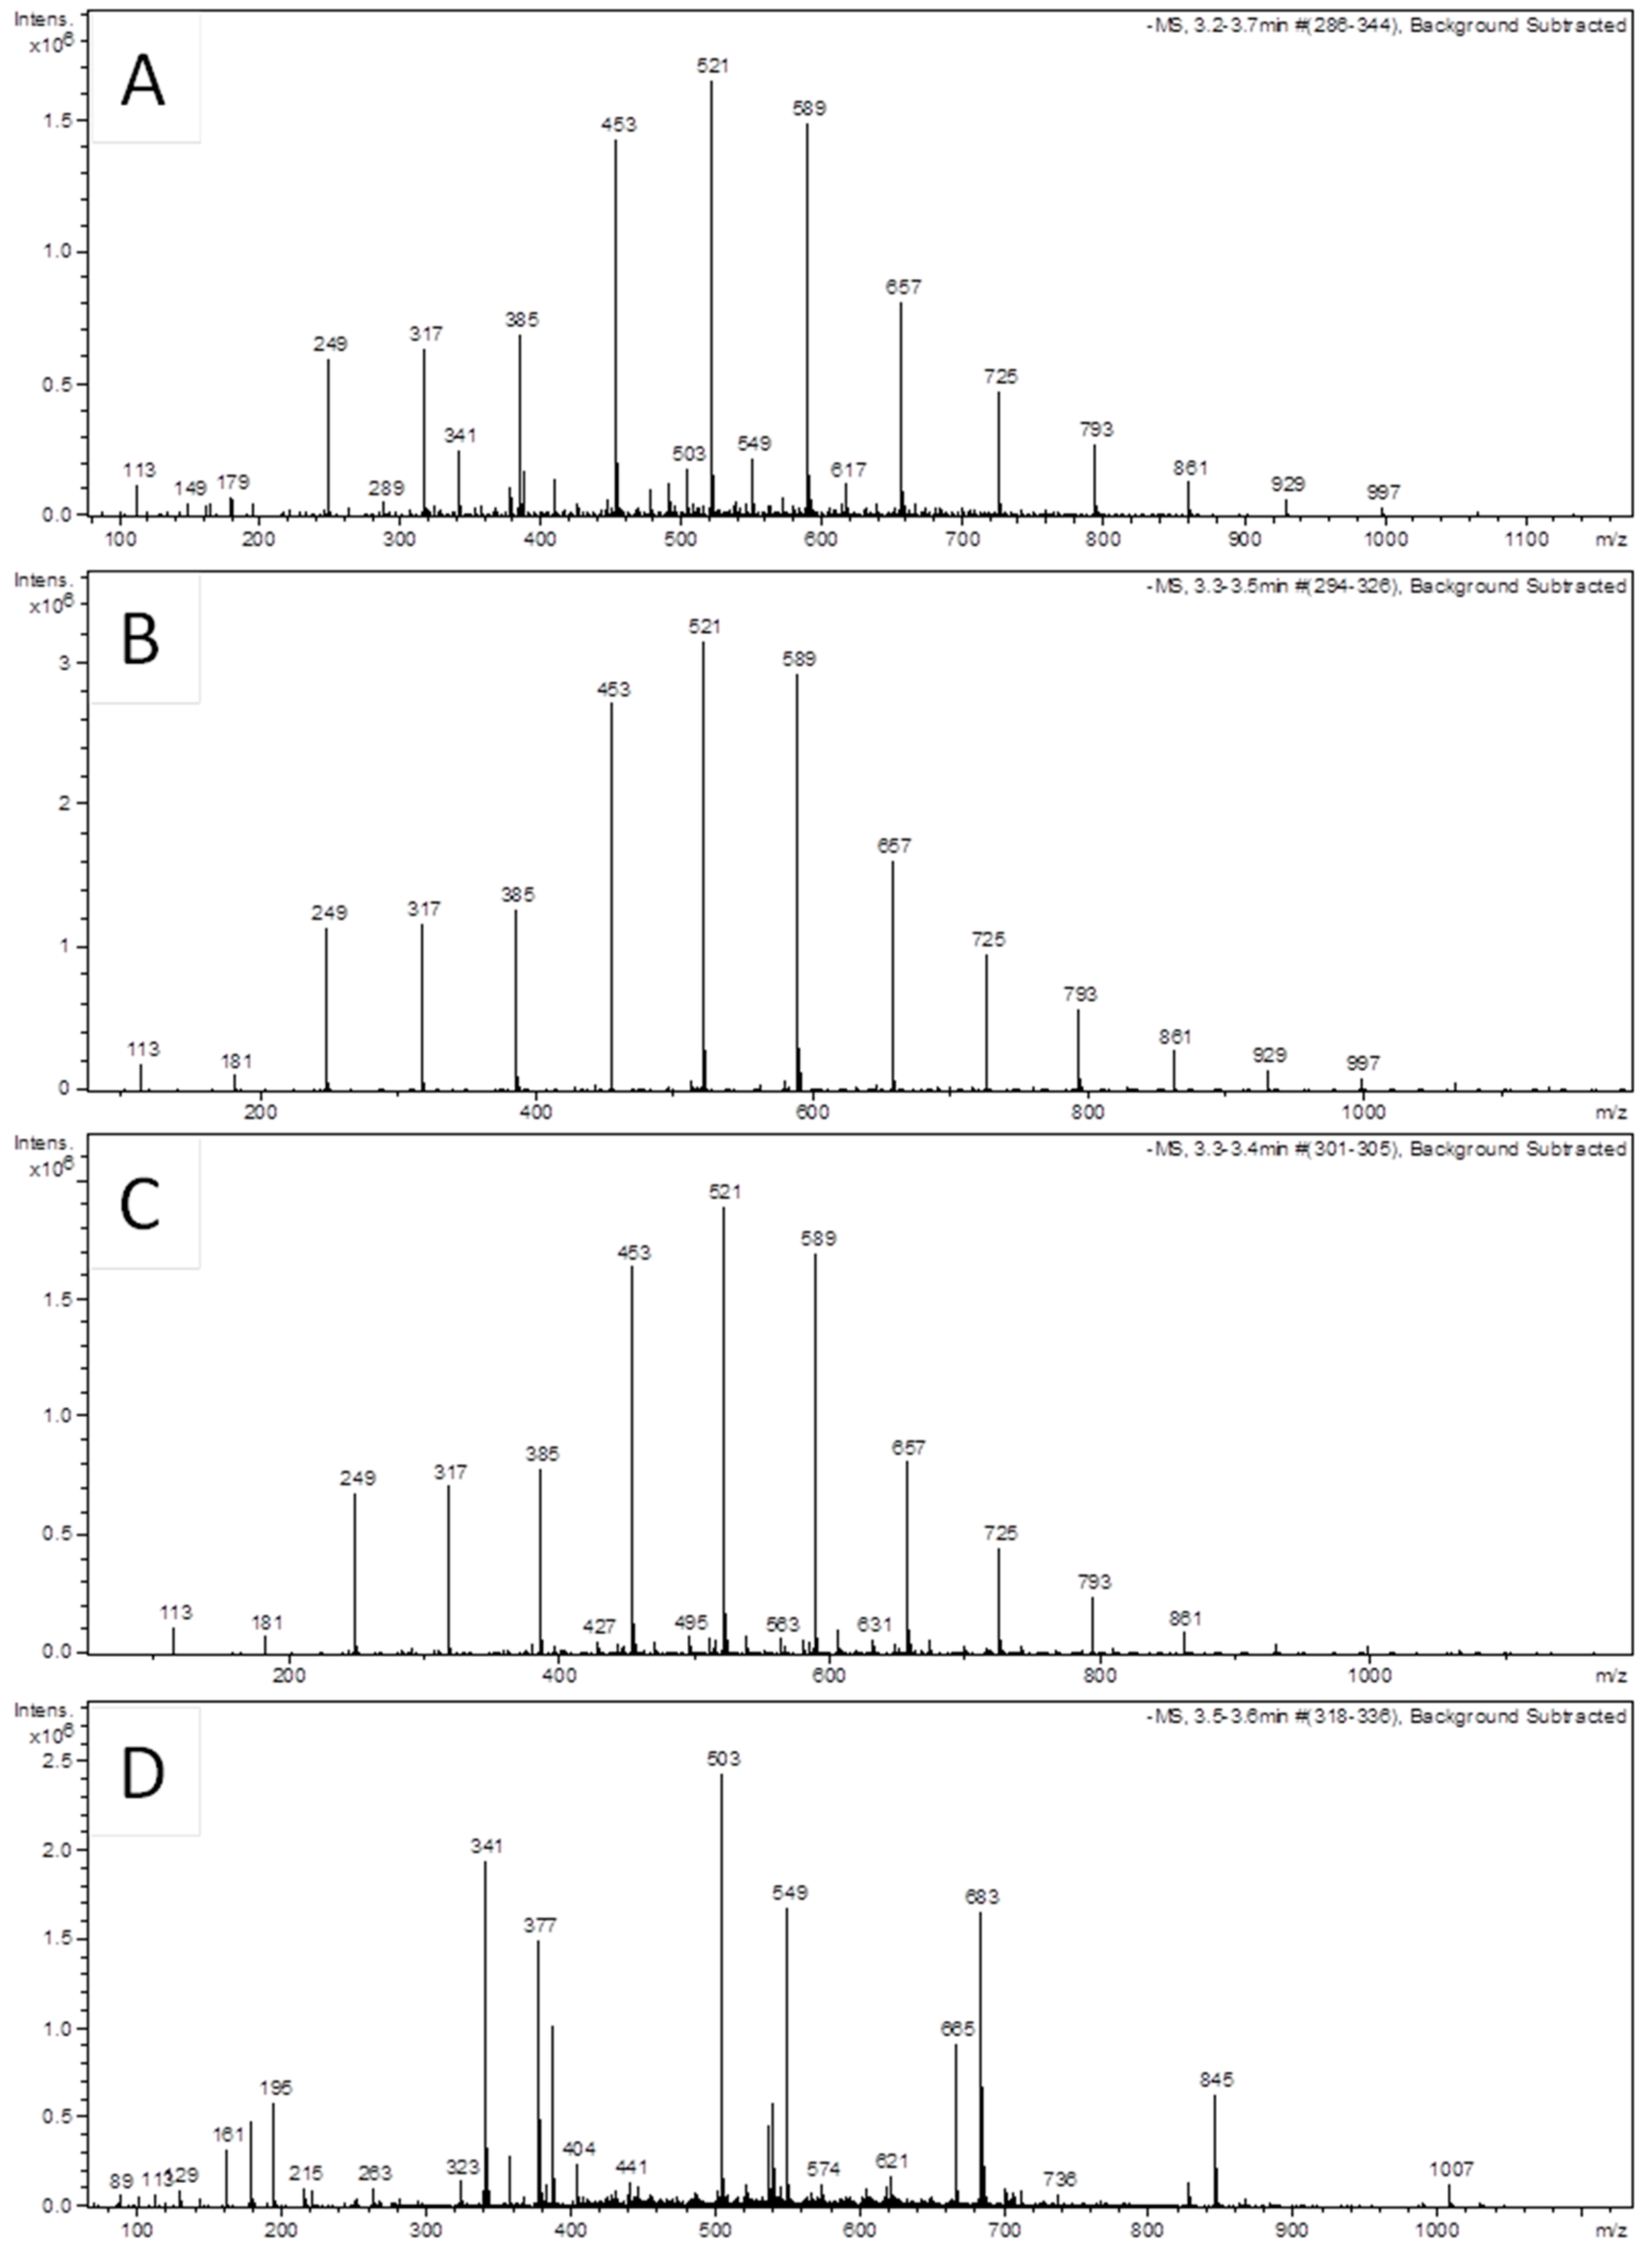
Unexpectedly, the extraction of honey with a mixture of three alcohols and then with acetone removed substantial amounts of unknown phenolic compounds that gave a sequential pattern of mass peaks differing by 68 Da, corresponding to isoprenyl group (Figure 2). Under our LC-ESI-MS conditions (Materials and Methods), these compounds were eluted at RT 3.3–3.4 min out of 25 min total time. Twelve ion peaks observed in the full scan mass spectra, conducted in negative ionization mode, ranged from [M − H] m/z 181 to m/z 997 (Figure 2, Table 1). Mass spectra of SN 1 and 2 were virtually indistinguishable from one another, indicating that both solvents led to solubilization and removal of lipid-like compounds with polyprenyl chain (Figure 2). In contrast, under the same LC-ESI-MS conditions, the supernatant obtained from honey precipitation with 80% alcohol only, gave mass spectrum at this RT (3.3–3.5 min) devoid of the peculiar polymeric compound (Figure 2D). The characteristic fragmentation pattern where the main mass ions sequentially differed by an isoprene unit of 68 Da is representative of isoprenoid quinones such as menaquinones and ubiquinones. Upon electron impact, both isoprenoid quinones produce product ions consistent with the formula [M − 69] − (n × 68) [11]. By comparing the mass peaks obtained in this study with the PubChem data on isoprenoid quinones, we found that all mass ions shown on our mass spectra (Figure 2), starting from [M − H] m/z 181 up to m/z 997, were perfectly matched with that of ubiquinones (Table 1).

2.2. UHPLC-ESI-MS/MS Analysis and Identification of Ubiquinones

To definitively identify these polyprenyl compounds as ubiquinones, the acetone extracts of honey H177, H220 and H208, were analyzed using high resolution UPHLC-ESI-MS/MS, in positive ionization mode, coupled to quadrupole orbitrap. From the full scan mass spectra that generated distinct peaks on the total ion chromatogram (Figure 2), we selected four peaks and used them as a quarry for the extracted ion chromatograms (EICs). The selected ions for the EIC corresponded to the following [M + H]+: m/z 386, m/z 523, m/z 659 and m/z 794. Knowing that the ubiquinone chemical structure consists of 2, 3-dimetoxy-5-methyl-6-polyprenyl-1, 4-benzoquinone where a polyisoprene chain can range from 1 to 12 isoprene units, we presented calculated, theoretical masses of UQ 1 to 12 (Table 1). For the UQ identification, we combined the high resolutions EIC mass spectra with the exact mass measurements by orbitrap to get mass ions accuracy within 5 ppm error of expected theoretical formula. This strategy enabled us to positively identify the following peaks; m/z 386.246 as UQ-3, m/z 523.3782 as UQ-5, m/z 659.5829 as UQ-7 and m/z 794.5476 as UQ-9 in honeys H208, H220 and H177 (Table 1). All these UQs generated a base peak at m/z 198.2090 in MS/MS spectra which is considered a diagnostic for ubiquinones (Table 1).

2.3. Partitioning of Ubiquinones between Free and Protein-Bound Fractions

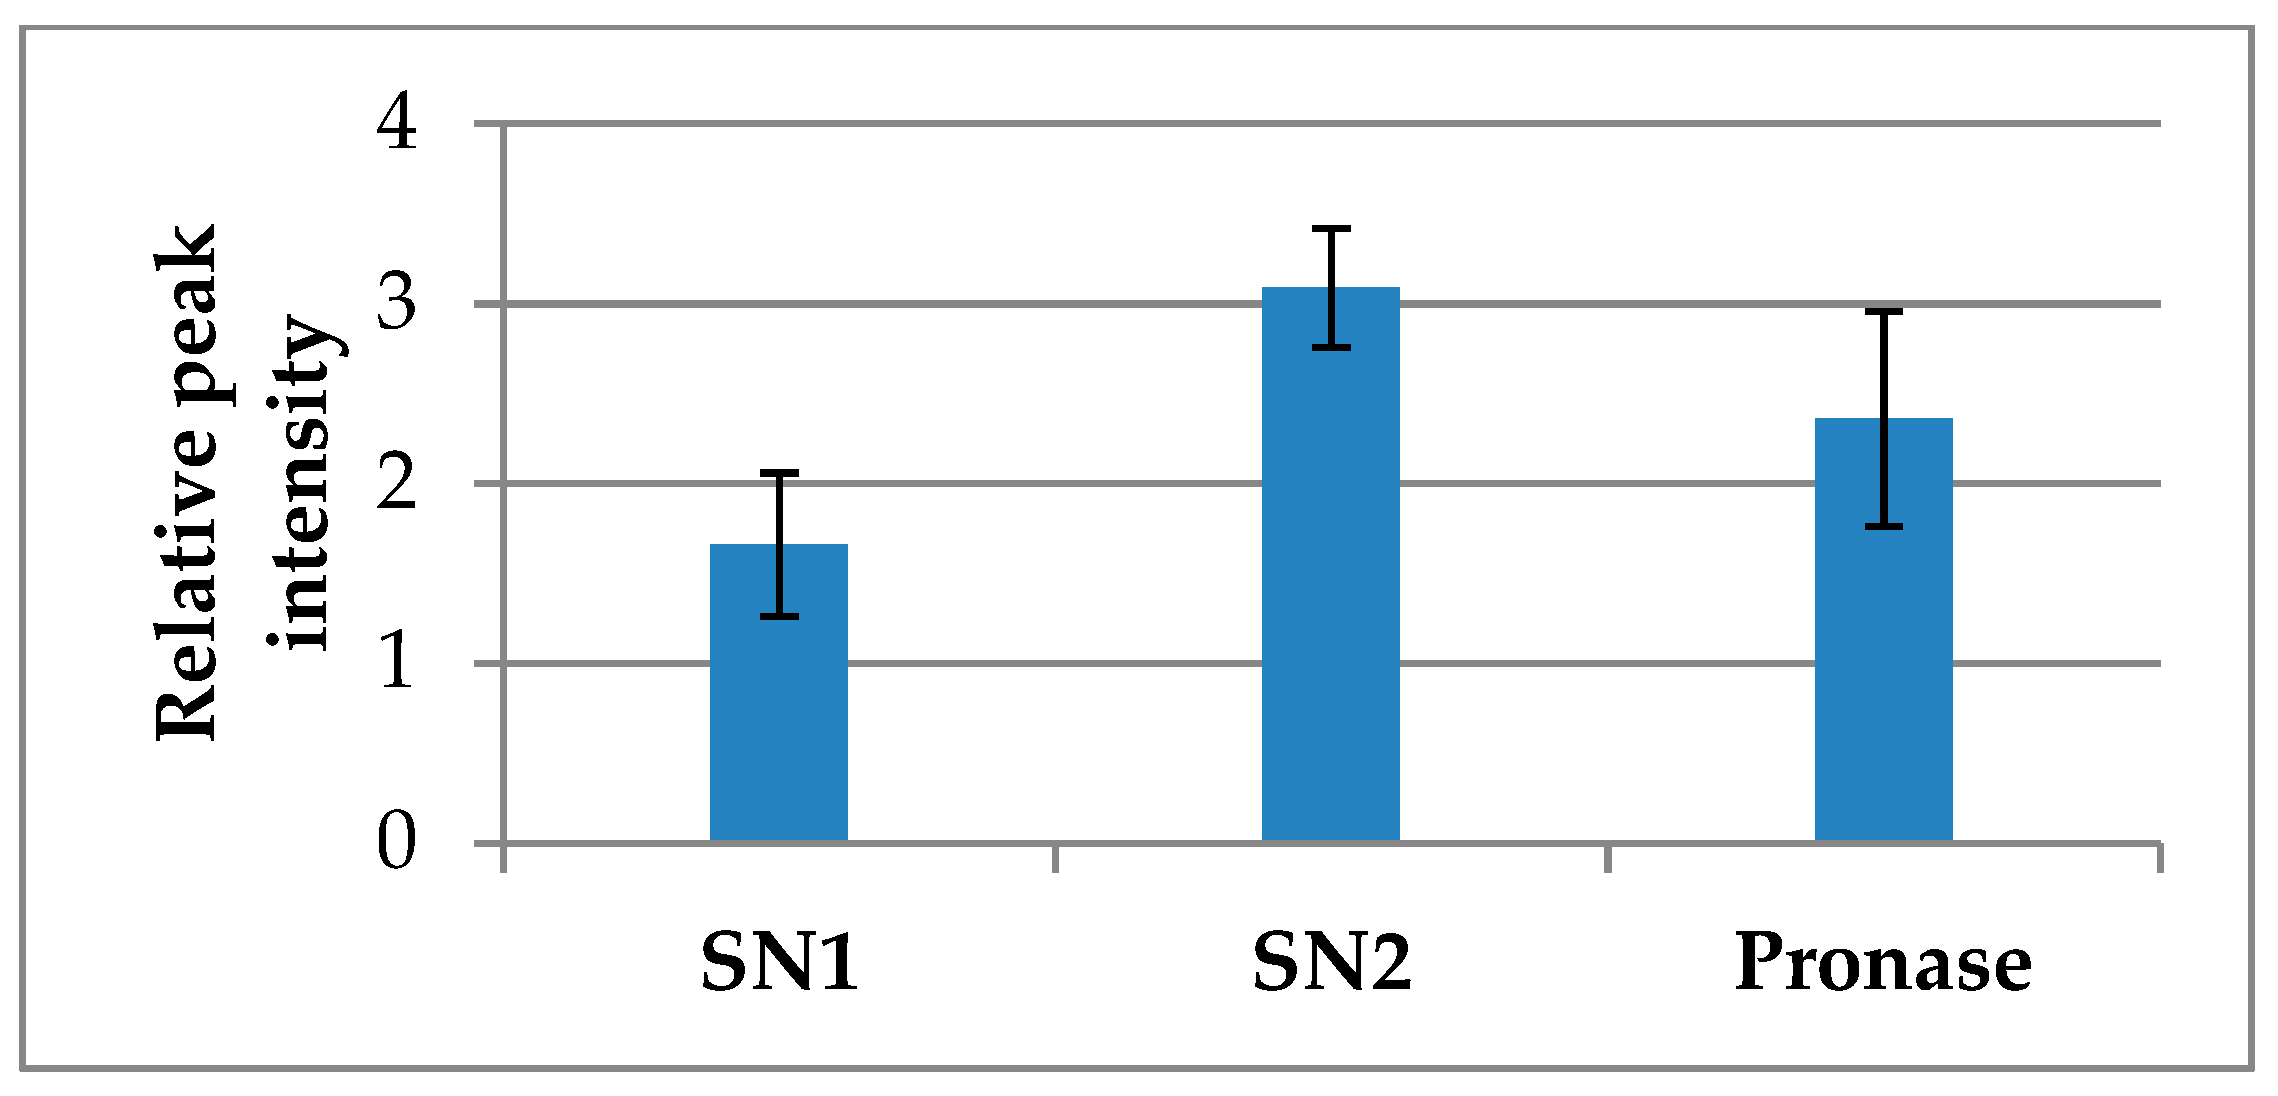
While ubiquinones were easily extracted from honey with the mixture of three alcohols and acetone, the substantial amount of UQ was freed only after pronase digestion of the insoluble pellet left after centrifugation (Figure 3). Pronase digestion was carried out after the extensive wash of the pellet with acetone, removal of acetone under a stream of nitrogen gas and re-suspension of the pellet residue in a pronase buffer. After protein hydrolysis, undigested residue was removed by centrifugation and the supernatant was cleaned-up by solid-phase extraction on C18 cartridges, eluted with 100% methanol, concentrated by lyophilization and finally analyzed by LC-ESI-MS. The dominant peak m/z 521 observed in all SNs was used to assess the abundance/yield of ubiquinones obtained after each solvent extraction and by pronase digestion in three honeys. Comparison of the mean relative intensity of peak m/z 521 in each supernatant showed that the significant portion of UQ remained with the protein complexes after extraction with organic solvents (Figure 3).
The partitioning of UQs suggested the existence of two groups of UQ that bound to proteins with different strength. Considering ubiquinones structure consisting of a hydrophilic head group and hydrophobic isoprenoid side chain, it could be inferred that this molecule binds protein in non-covalent way via both hydrogen bonds and hydrophobic interactions. Such transient, reversible associations can be easily disrupted by polar solvents and allow UQs partitioning into supernatants SN1 and SN2.
In contrast, quinone groups of ubiquinones could form covalent adducts with proteins via interaction with protein ε-NH2 or SH groups. We have previously revealed quinone-protein conjugates in SDS-PAGE gels by using nitro blue tetrazolium stain [12], a stain that has been developed for the specific detection of quinone-adducted proteins [13]. The quinone-protein specific staining was increasingly visible on SDS-PAGE among “polyphenol-type” protein-polyphenol complexes, which we isolated from honeys using size-exclusion chromatography [12].
We therefore asked whether “polyphenol-type” protein-polyphenol complexes indeed contain UQ.

2.4. Extraction of Ubiquinones from Polyphenol-Protein Complexes

We have previously reported that honey protein-polyphenol complexes could be crudely resolved by size-exclusion chromatography (SEC) into two groups differing in molecular size, protein to polyphenol ratio and the antioxidant capacity [12]. Although the molecular size range is difficult to determine accurately from SEC, we estimated the size of these two groups of high molecular weight complexes to be within 230–180 kDa and 110–85 kDa range. Based on the protein and polyphenol concentrations and their ratio, the first group was found to be enriched in protein (“protein-type” complexes) while lower molecular size complexes (110–85 kDa) were enriched in polyphenols (“polyphenol-type” complexes) [12].
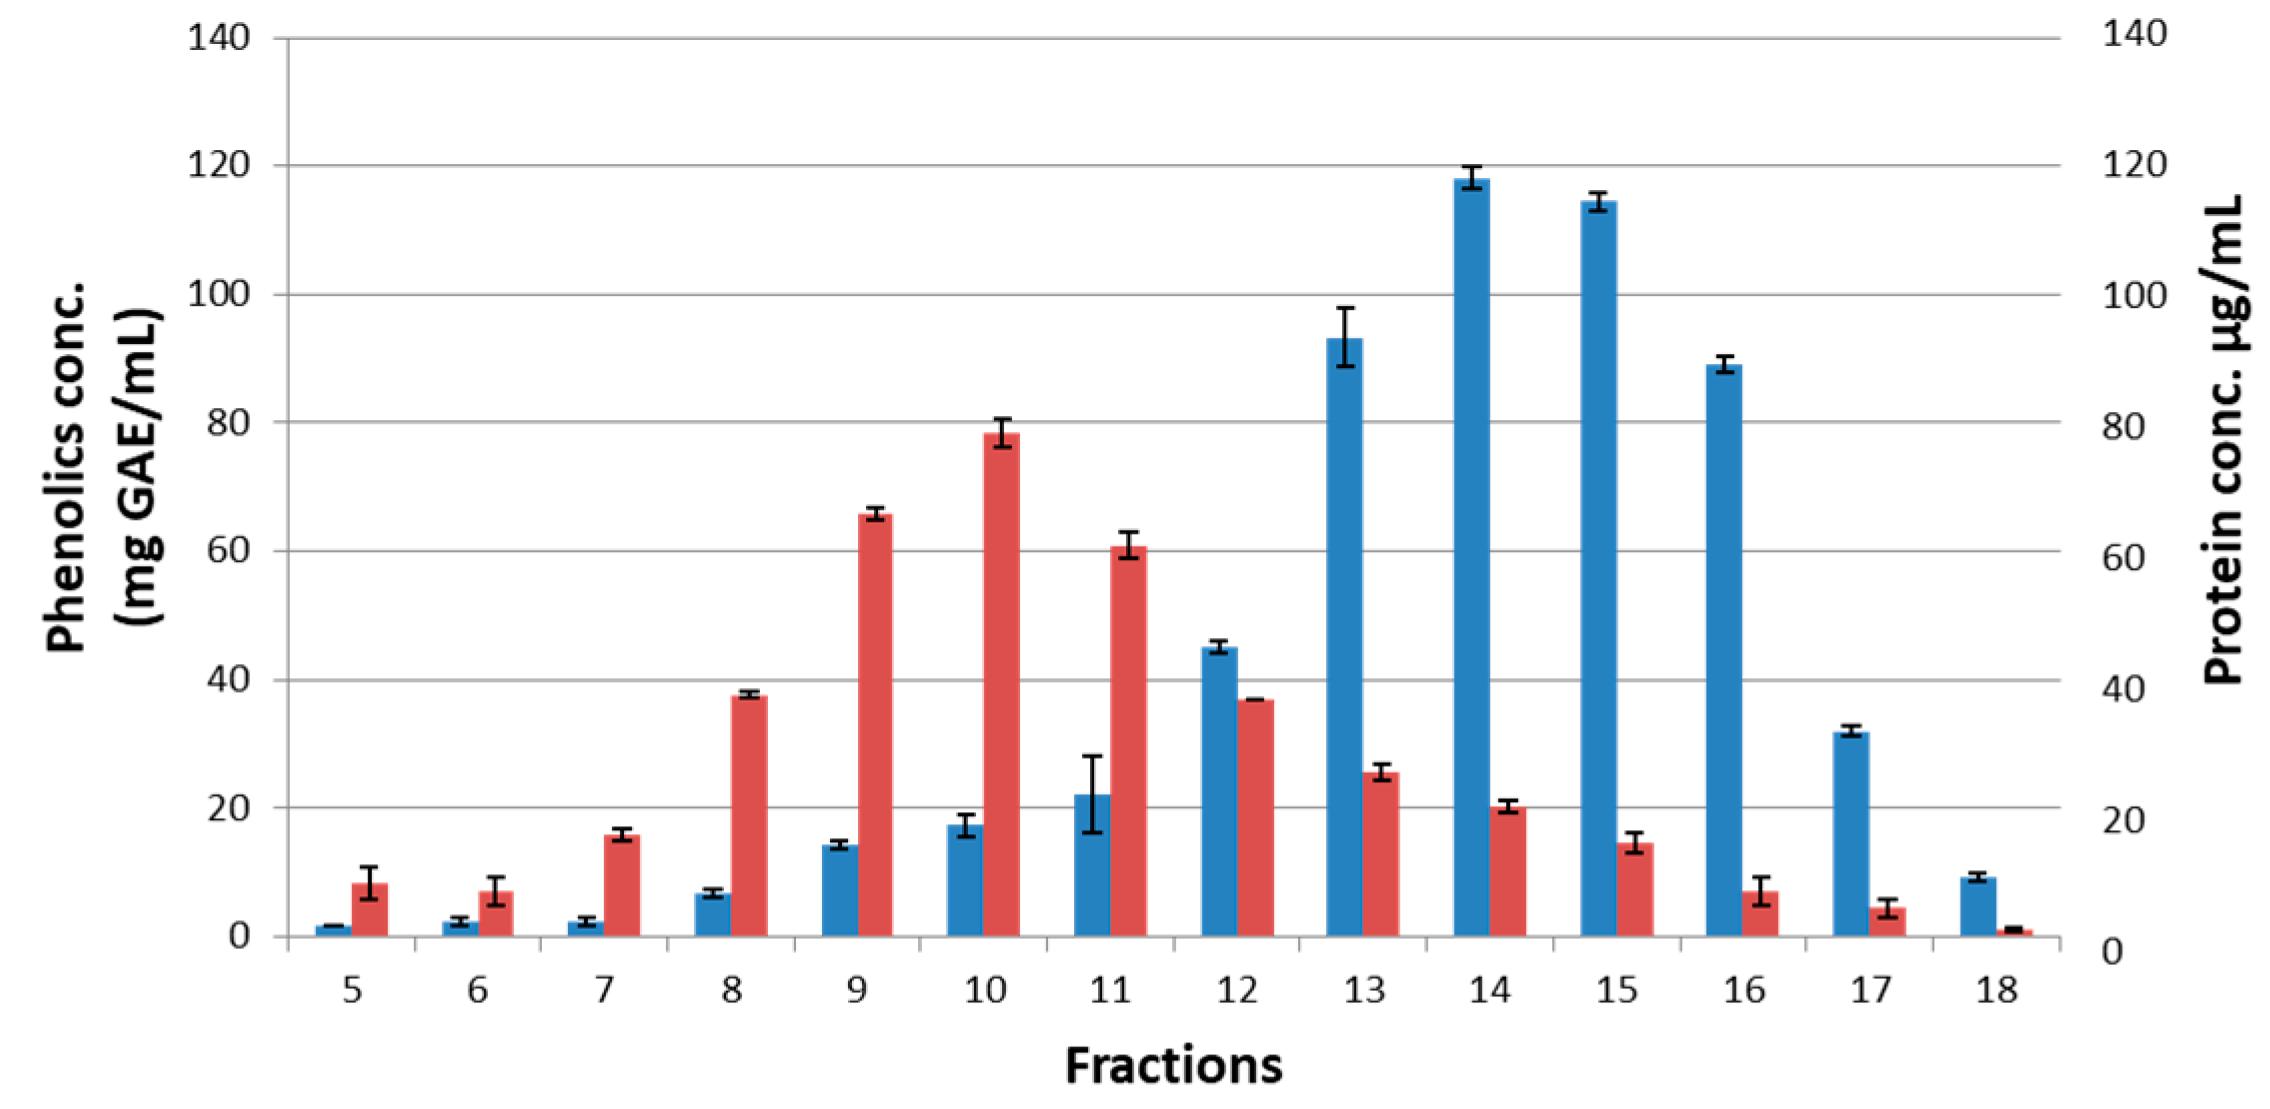
To determine whether ubiquinones could be found among the “polyphenol-type” complexes, honeys H208, H177 and H220 were chromatographed on Sepharose 4B to separate fractions differing in the protein to polyphenol ratio. Each fraction was analyzed for the protein and polyphenol contents using Bradford protein assay and Folin-Ciocalteu method, respectively. Fractions 8–12 showed higher protein concentrations than fractions F13 to F17 (two-tailed t-test, t(8) = 4.6. p < 0.002), while fractions F13 to F17 showed higher phenolic concentrations than fractions F8-F12 (t(8) = 4.07, p < 0.003). Fractions F15 to F17 rich in polyphenols were selected for the LC-ESI-MS analysis (Figure 4).
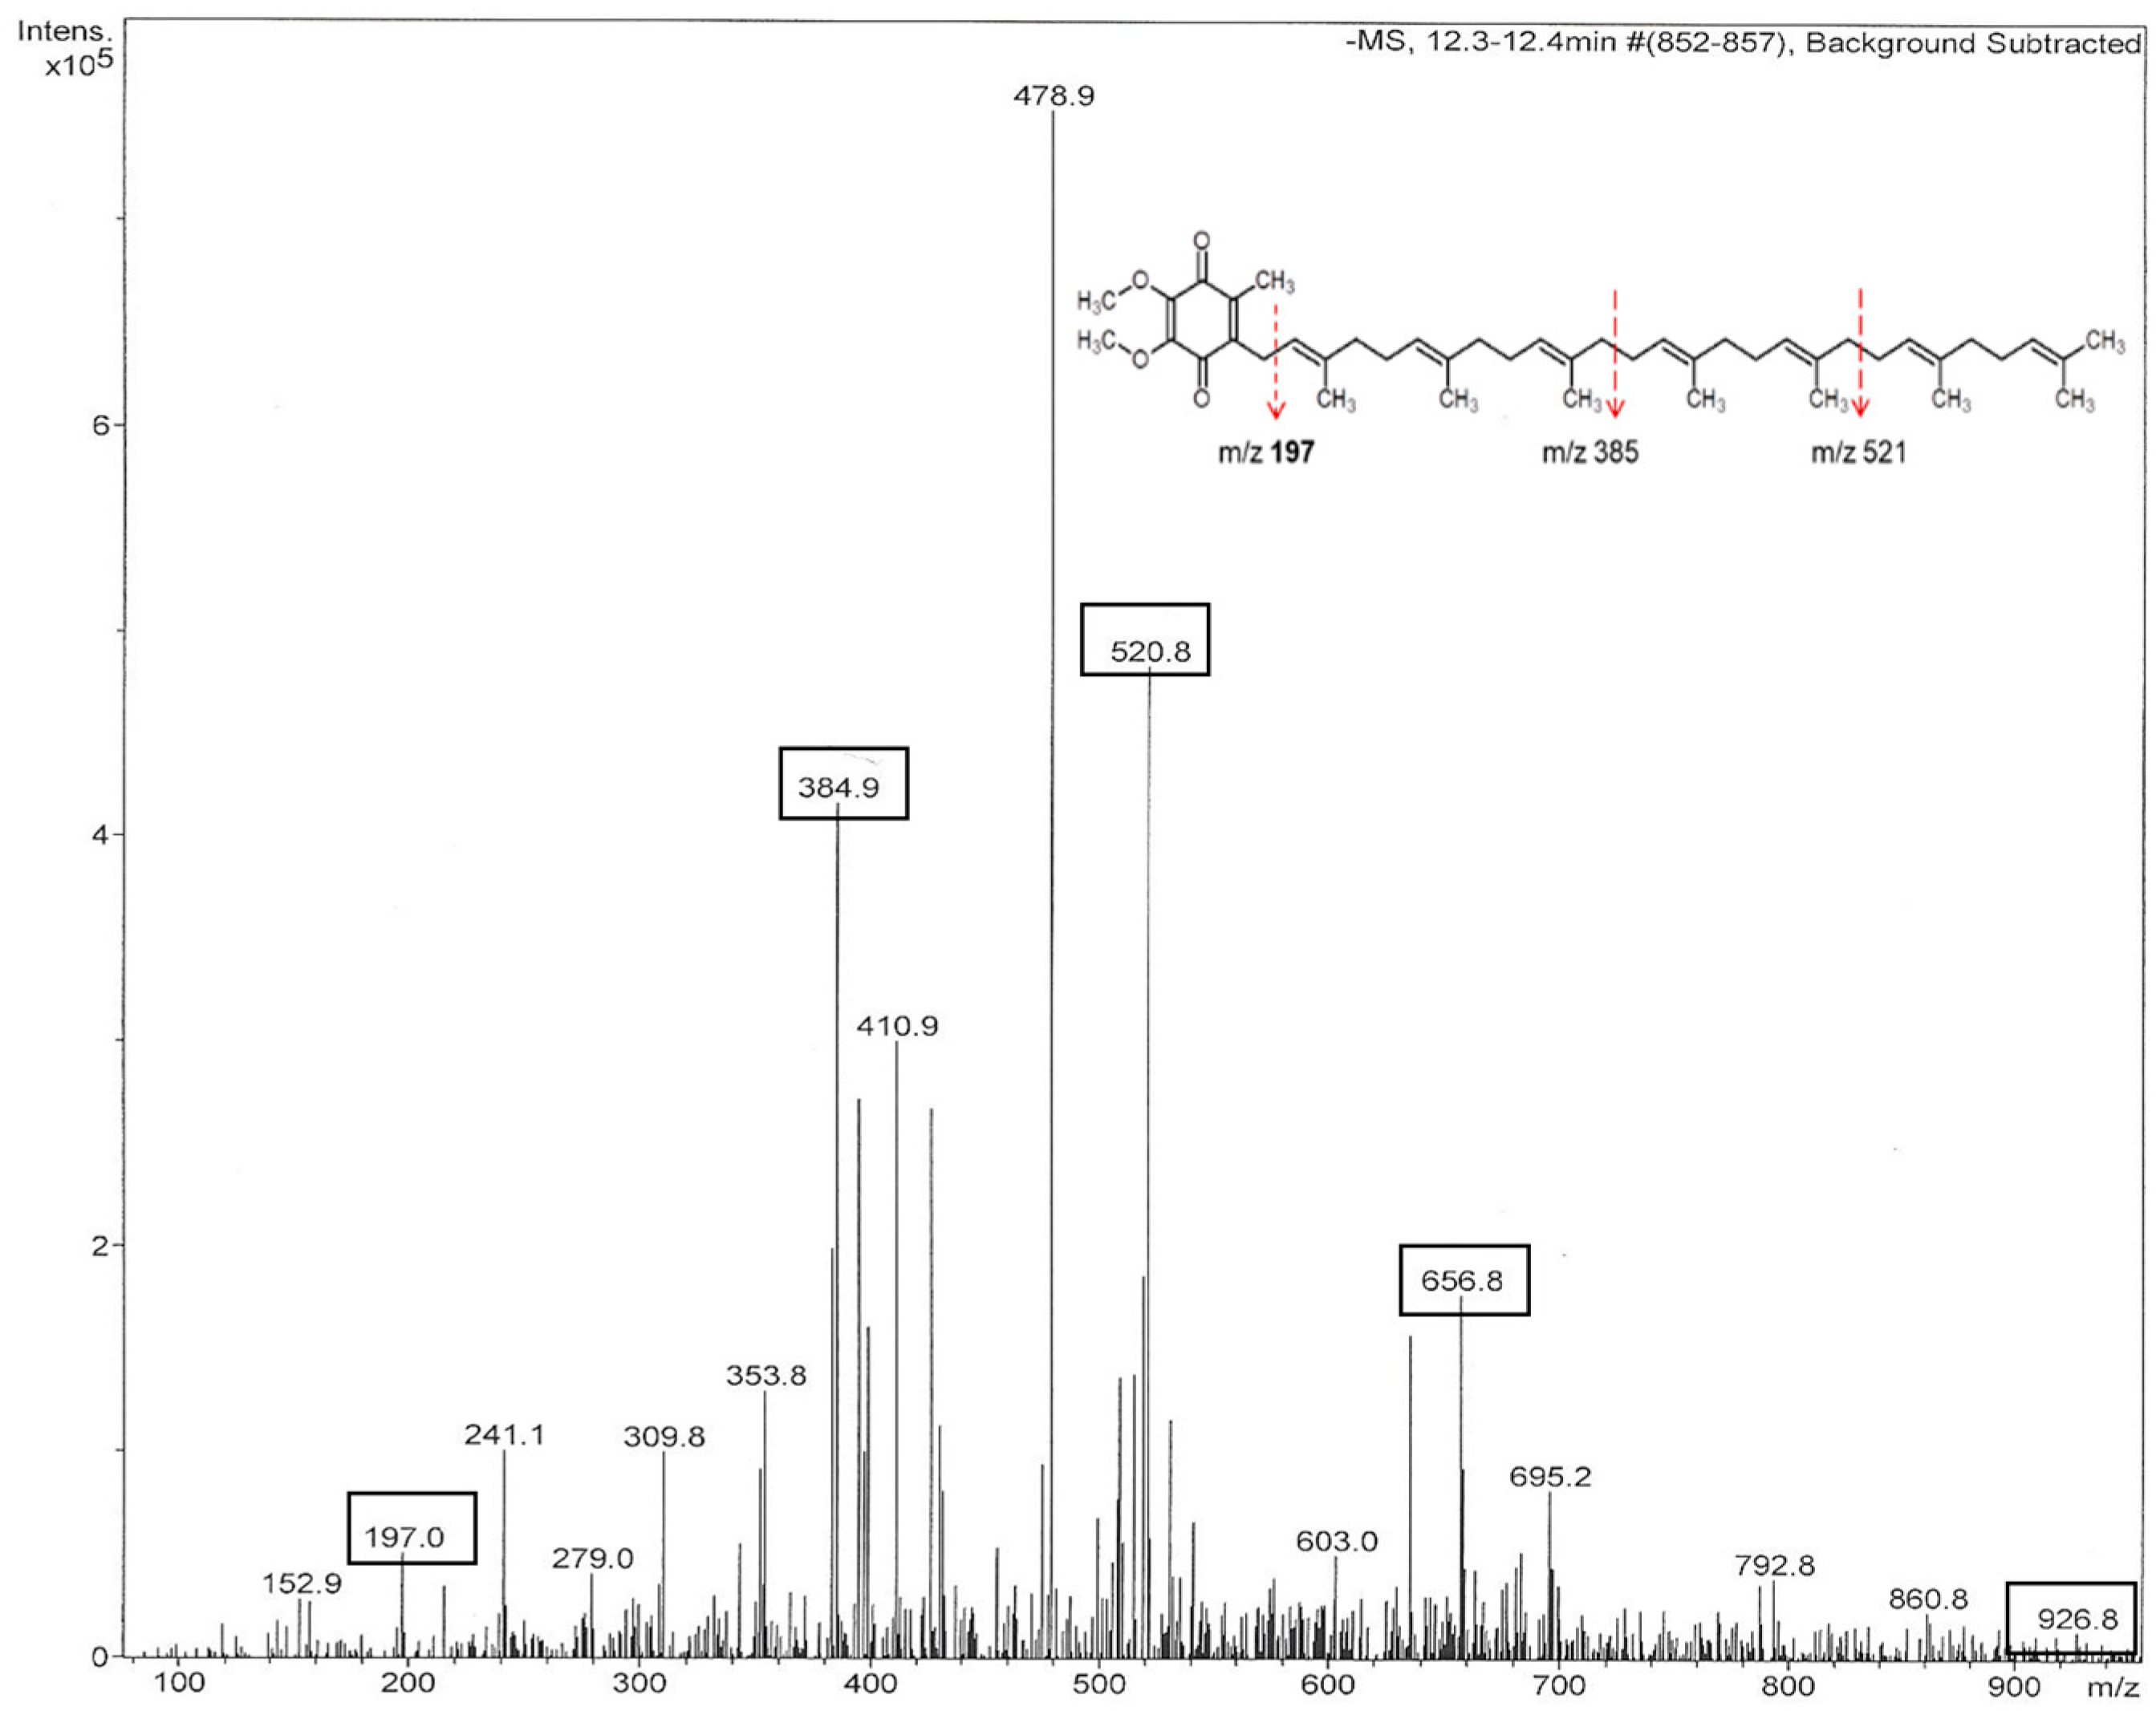
Mass spectra of the fractions F15 to F17 obtained in the negative ionization mode showed strong signals of the [M − H] at m/z 384.9, m/z 520.8, m/z 656.8 and occasionally, m/z 928.9 (Figure 5). These peaks were consistently eluted at a retention time 12.1–12.4 min (Table 2). Interestingly, the peak mass ions differed by two mass units of isoprene suggesting that they might be formed by cleavage of the ubiquinone with the longer polyprenyl side chain, such as that of m/z 928.9.
The high intensity of the m/z 384.9 in mass spectra of the tested fractions might be related to degree of polymerization of polyprenyl side chain rather than to the relative abundance of this compound in the fractions, since the relative intensity of the peak is inversely correlated with the number of isoprene units in polyprenyl side-chain. The product ion at m/z 197.1 represents benzoquinone nucleus, 2,3-dimetoxy- 5,6-dimethyl- 1,4 benzoquinone (Figure 5, insert) that is produced from the successive reduction of terminal isoprene units of polyprenyl chain. The fragment ion m/z 197.1, a peak signifying ubiquinones, was consistently observed in mass spectra of all tested fractions (Figure 5 and Table 2). Mass spectra of fractions F15 to F17 indicate the presence of ubiquinones UQ-3, UQ-5, UQ-7 and UQ-9 in the polyphenol-enriched protein-polyphenol complexes in honey.
Our findings indicated that ubiquinones have emerged as significant components of protein bound-compounds in honey. We therefore, raised the question as to their functional significance. We perceive at least two possible outcomes based on known facts on the function of UQ in living organisms:
In prokaryotic and eukaryotic cells, ubiquinones are indispensable components of the large respiratory protein complexes spanning the inner mitochondrial membrane (or plasma membranes of bacteria) responsible for energy production. This involves the transfer of electrons produced in the redox reaction of quinone group of ubiquinones and its coupling with the pumping of H+ across the membrane. The latter process generates a proton gradient (proton motive force) which is used by ATP synthase to synthesize ATP [14,15]. Thus, these large respiratory protein-ubiquinone complexes comprise an operational bioenergetic system producing energy via quinone’s redox ability. Would a similar bioenergetic phenomenon be observed in honey? In other words, would polyphenol-type protein-polyphenol complexes containing ubiquinones continue to be involved in electron transfer in honey?
Secondly, we have shown previously that polyphenol type complexes possessed higher antioxidant activity, measured by ORAC method, than protein-type complexes [16]. The ORAC values of fractions rich in polyphenols (F13 to F15) was significantly higher and showed a strong correlation with the total phenolic content, R2 = 0.860, p < 0.0001. The presence of the redox-active ubiquinones in the former type complexes could imply ubiquinone’s contribution to this antioxidant activity. In support, the literature evidence indicate that ubiquinol, the reduced form of ubiquinone, has the ability to scavenge superoxide and lipid peroxyl radicals in several in vitro systems and therefore has ability to serve as an antioxidant [15,17,18].
Our findings prompt us toward new research directions into the role ubiquinones and menaquinones in honey and their potential to influence the honey’s antioxidant/ proxidant state.

3. Materials and Methods

3.1. Honeys

Honeys were donated by Canadian beekeepers and included apiary (raw) samples (Charlie-Bee Honey, Beamsville, ON, Canada; Honey Q Corp. Sunderland, ON, Canada; Dutchman’s Gold Honey, Carlisle, ON, Canada). Three honeys used in this study, H177, H208, and H220 originated from buckwheat (Fagopyrum esculentum). Honeys H177, H208, and H220 were collected during the 2010, 2013, and 2016 seasons. Upon their arrival to the laboratory, honeys were given ID numbers, aliquoted to the separate, dark-color jars and stored at −20 °C. Each honey was extensively characterized as to the color, moisture, water content, Brix, and specific gravity (Table 3) as recommended by the Harmonized Methods of the International Honey Commission [19].

3.2. Sample Preparation

Honey samples were diluted to 50% (w/v) with warm (45–50 °C) Milli-Q water and the resulting solution was filtered using glass microfiber Centrex units (Schleicher & Schuell Inc., Keene, NH, USA) followed by filtration through a 0.45 μm syringe membrane filter (VWR, Radnor, PA, USA).

3.3. Extraction Procedures

The 50% honey aqueous solution (500 µL) was extracted with the 500 uL mixture of three alcohols, 80% ethanol, 80% methanol and 70% isopropanol (1:1:1), incubated for 30 min at room temperature, in the dark, and centrifuged at 6400 rpm/10 min. to collect a supernatant (SN1) and the pellet. The pellet was suspended in 200 µL of Milli-Q water and extracted with 800 µL of ice-cold acetone overnight at 4 °C. After centirfugation, the precipitate, separated from supernatant (SN2), was rinsed 3 times with 200 µL of acetone followed by centrifugation. The rinsed pellet was evaporated to dryness under a stream of nitrogen gas to remove acetone residue. The dried precipitate was suspended in 900 µL of Milli-Q water by vortexing and mixed with 100 µL of pronase (5 mg/mL, w/v) in 10 mM sodium acetate buffer containing 5 mM CaCl2, pH 7.5. The sample was incubated for 24 h at 37 °C in the dark. The reaction mixture was centrifuged and the supernatant was then applied to SPE column and eluted with 100% methanol (SN3, Pronase). The supernatants SN1, SN2, and SN3 were lyophilized. Lyophilization was conducted using a benchtop freeze-dryer system at −50 °C and vacuum at 380 mBar (Thermo Savant Micro Moduly, Marshall Sci., Hampton, NH, USA). Samples were reconstituted in 20 µL methanol. 5 µL of the sample was injected and analyzed by LC-ESI-MS (Bruker HCT Ultra LC/MS, Billerica, MA, USA).

3.4. Solid Phase Extraction (SPE)

Solid phase extraction was used in this study for a purpose to remove interfering substances and impurities from samples before the determination of ubiquinones in supernatants by LC-ESI-MS (UPHLC-MS/MS) or the total phenolic content by the Folin–Ciocalteau method. Waters Oasis HLB 3cc Extraction Cartridges (Oasis HLB, Waters Corp, Milford, MA USA) were used according to the manufacturer manual.

3.5. LC-ESI-MS Analysis

LC-ESI-MS analysis was performed with a Bruker HCT Ultra LC/MS instrument using a ZORBAX Eclipse XDB-C18, 4.6 × 50 mm column (Agilent). The injection volume was 5 μL. The mobile phase consisted of solvent A (0.1% formic acid in water) and solvent B (0.1% formic acid in methanol). Chromatographic separation was 25-min. The gradient program was as followed: 0–3 min, 22% B; 10 min, 100% B; 12 min 100% B; 13 min, 22% B; 16 min, 22% B. ESI was run with negative ion polarity with a capillarity exit voltage of −128.5 Volts. The elution was monitored at 254 nm. The method of ionization was electrospray ionization (ESI). The LC-ESI-MS was operated on a negative ion mode with a mass range of 100–1000 m/z.

3.6. Ultra-Performance Liquid Chromatography (UPLC)

Fractions from size-exclusion chromatography purified by SPE were subjected to chromatographic separation using an ACQUITY UPLC (Waters, Milford, MA, USA) containing a Waters Acquity BEH C18 column (150 mm × 2.1 mm, 1.8 μm) with a flow rate of 0.5 mL/min at 30 °C. The injection volume was 5 μL. The mobile phase consisted of solvent A (0.1% formic acid in water) and solvent B (0.1% formic acid in acetonitrile). Chromatographic separation was 6 min. The gradient was 0 min, 8% B; 1 min, 8% B; 4.3 min, 25% B; 5 min, 8% B; 6 min, 8% B. The method of ionization was electrospray ionization (ESI). The UPLC-ESI-MS was operated on a positive ion mode with a mass range of 100–1000 m/z. The cone voltage was set to 30 V, the source temperature at 147 °C; the desolvation gas flow was 483 L/h at a temperature of 300 °C. The detection was diode-array detection that was set up at 248 nm to optimize the detection of benzoquinones. The data acquisition and processing was obtained using Thermo Xcalibur 2.2 software (Thermo Fisher Scientific, Waltham, MA, USA).

3.7. The Exact Mass Measurement

The exact mass measurements were done using Q-Exactive mass spectrometer. The LC-MS platform consisted of a Dionex Ultimate 3000 UHPLC system and a Q-Exactive mass spectrometer equipped with a HESI II source (Thermo Scientific). Control of the system and data handling was performed using Thermo XCalibur 2.2 software and Chromeleon 7.2 software. Separation by liquid chromatography was conducted on an Acquity BEH C18 column (50 mm × 2.1 mm, 1.7 μm particle size). The pump was run at a flow rate of 200 μL/min. Solvent A was water containing 0.1% formic acid; solvent B was acetonitrile containing 0.1% formic acid. The gradient was 0 min, 8% B; 6 min, 95% B; 8 min, 95% B; 9 min, 8% B; 15 min, 8% B. Autosampler temperature was maintained at 10 °C and injection volume was 15 μL. Data collection was done in positive ionization mode with MS1 scan range m/z 100–1000, resolution 70,000, AGC target of 3e6 and a maximum injection time of 200 ms, MS2 data was collected using a TOP5 method, 1 m/z isolation window, 20, 30 stepped NCE, 17,500 resolution, AGC target 1e5 and a maximum injection time of 50 ms.

3.8. Size-Exclusion Chromatography (SEC)

A Sepharose 4B (Sigma-Aldrich, St. Louis, MO, USA) column (24 cm × 1.6 cm) was equilibrated with distilled water at 1 mL/min prior to use. A 50% (w/v) honey solution in 0.15 M NaCl was centrifuged at 13,000 rpm for 15 min and one milliliter of the SN was loaded onto the column. The fractions (3 mls) were eluted with distilled water (1 mL/min) and monitored at 280 nm. A standard curve for molecular weight determination was generated using a protein kit (Gel Filtration HMW Calibration kit, GE Healthcare, Chicago, IL, USA) containing ferritin (440 kDa), catalase (240 kDa), aldolase (158 kDa) and albumin (66 kDa) with obtained with linearity ranging from R2 = 0.92 to 0.98 in several repetitions.

3.9. Determination of Protein Concentration

Protein content was determined using the Pierce BCA Protein Assay Kit (Thermo Scientific) in a 96-well format based on Bradford protein assay [20]. The method was performed as described in the manufacturer manual. Protein determination was conducted by addition of 200 μL of Bradford dye reagent (brilliant blue G, 0.1 mg/mL; ethanol, 5% (v/v); phosphoric acid, 10% (v/v) and water) to 40 μL of samples, pre-diluted 100 times. The plate was incubated in the dark with shaking for 1.5 h at 37 °C. Following incubation, the absorbance was measured at A595nm using the Synergy HT Multi-Detection Microplate Reader (BioTek Instruments, Inc, Winooski, VT, USA). Protein content was calculated from the albumin (2000–62.5 µg/mL) standard curve (R2 = 0.99) and was expressed as µg/mL. Measurements were done in triplicate.

3.10. Determination of Polyphenol Concentration

The total phenolic content in the SEC fractions was determined with the Folin–Ciocalteu reagent [21]. Briefly, 790 µL of distilled water, 10 µL of high molecular weight solution, and 50 µL of Folin–Ciocalteu reagent were mixed. After exactly 1 min, 150 µL of 20% aqueous sodium carbonate was added, and the mixture was mixed and allowed to stand at room temperature in the dark for 120 min. Detection was achieved at 760 nm. Gallic acid was used as standard (R2 = 0.9998). Measurements were done in triplicate.

4. Conclusions

In this study we identified two pools of ubiquinones in honey based on how strongly they bound proteins in protein-polyphenol complexes. The ubiquinone group that transiently bound to proteins was readily extracted using polar solvents. The covalently bound UQ required protein proteolytic degradation in order to be released. Ubiquinone distribution among protein-polyphenol complexes separated by size-exclusion chromatography followed by LC-ESI-MS, have shown that ubiquinone UQ-3, 5 and 7 were consistently associated with polyphenol-enriched complexes. Due to the role ubiquinones have in electron transfer and energy production, we discuss the possibility of ubiquinones’ contribution to the antioxidant/proxidant state of honey.

Author Contributions

Conceptualization, K.B; Methodology, formal analysis, investigation, L.M.-A and K.B; Writing—original and draft preparation, K.B.; Funding acquisition, K.B.

Funding

This research was funded in part by Ontario Centres of Excellence, grant number BM 50849.

Acknowledgments

We thank Timothy Jones, Mass spectrometry Facility, Brock University and Robert Flick, University of Toronto, BioZone, Department of Chemical Engineering, for mass spectra analyses.

Conflicts of Interest

The authors declare no conflict of interest.

References

  1. Paine, H.S.; Gertler, S.; Lothrop, R.E. The colloidal constituents of honey. Industr. Engng. Chem. 1934, 26, 73–81. [Google Scholar] [CrossRef]
  2. Brudzynski, K.; Maldonado-Alvarez, L. Polyphenol-protein complexes and their consequences for the redox activity, structure and function of honey. A current view and new hypothesis—A review. Pol. J. Food Nutr. Sci. 2015, 65, 71–80. [Google Scholar] [CrossRef]
  3. Brudzynski, K.; Miotto, D.; Kim, L.; Sjaarda, C.; Maldonado-Alvarez, L.; Fukś, H. Active macromolecules of honey form colloidal particles essential for honey antibacterial activity and hydrogen peroxide production. Sci. Rep. 2017, 7, 7637. [Google Scholar] [CrossRef] [PubMed]
  4. Charlton, A.J.; Baxter, N.J.; Lokman Khan, M.; Moir, A.J.G.; Haslam, E.; Davies, A.P.; Williamson, M.P. Polyphenol/peptide binding and precipitation. J. Agric. Food Chem. 2002, 50, 1593–1601. [Google Scholar] [CrossRef] [PubMed]
  5. Siebert, K.J.; Troukhanova, N.V.; Lynn, P.Y. Nature of polyphenols-protein interactions. J. Agric. Food Chem. 1996, 44, 80–85. [Google Scholar] [CrossRef]
  6. Haslam, E. Polyphenol-protein interactions. Biochem. J. 1974, 139, 285–288. [Google Scholar] [CrossRef] [PubMed]
  7. Le Bourvellec, C.; Renard, C.M. Interactions between polyphenols and macromolecules: Quantification methods and mechanisms. Crit. Rev. Food Sci. Nutr. 2012, 52, 213–248. [Google Scholar] [CrossRef] [PubMed]
  8. Stalikas, C.D. Extraction, separation, and detection methods for phenolic acids and flavonoids. J. Sep. Sci. 2007, 30, 3268–3295. [Google Scholar] [CrossRef] [PubMed] [Green Version]
  9. Pyrzynska, K.; Biesaga, M. Analysis of phenolic acids and flavonoids in honey. Trends Analyt Chem. 2009, 28, 893–902. [Google Scholar] [CrossRef]
  10. Dai, J.; Mumper, R.J. Plant phenolics: Extraction, analysis and their antioxidant and anticancer properties. Molecules 2010, 15, 7313–7352. [Google Scholar] [CrossRef] [PubMed]
  11. Collins, M.; Jones, D. Distribution of isoprenoid quinone structural types in bacteria and their taxonomic implications. Microbiol. Rev. 1981, 45, 316–354. [Google Scholar] [PubMed]
  12. Brudzynski, K.; Sjaarda, C.; Maldonado-Alvarez, L. A new look on polyphenol-protein complexation during honey storage: Is this a random or organized event with the help of dirigent-like proteins? PLoS ONE 2013, 8, 72897. [Google Scholar] [CrossRef] [PubMed]
  13. Paz, M.A.; Flückiger, R.; Boak, A.; Kagan, H.M.; Gallop, P.M. Specific detection of quinoproteins by redox-cycling staining. J. Biol. Chem. 1991, 266, 689–692. [Google Scholar] [PubMed]
  14. Trumpower, B.L. New concepts on the role of ubiquinones in the mitochondrial respiratory chain. J. Bioenerg. Biomembr. 1981, 13, 1–24. [Google Scholar] [CrossRef] [PubMed]
  15. Nowicka, B.; Kruk, J. Occurance, biosynthesis and function of isoprenoid quinones. Biochem. Biophys. Acta 2010, 1797, 1587–1605. [Google Scholar] [PubMed]
  16. Brudzynski, K.; Miotto, D. The recognition of high molecular weight melanoidins as the main components responsible for radical-scavenging capacity of unheated and heat-treated Canadian honeys. Food Chem. 2011, 125, 570–575. [Google Scholar] [CrossRef]
  17. Maroz, A.; Anderson, R.F.; Smith, R.A.; Murphy, M.P. Reactivity of ubiquinone and ubiquinol with superoxide and the hydroperoxyl radical: Implications for in vivo antioxidant activity. Free Radic. Biol. Med. 2009, 46, 105–109. [Google Scholar] [CrossRef] [PubMed]
  18. Marbois, B.N.; Clarke, C.F. The COQ7 Gene encodes a protein in Saccharomyces cerevisiae necessary for ubiquinone biosynthesis. J. Biol. Chem. 1996, 271, 2995–3004. [Google Scholar] [CrossRef] [PubMed]
  19. Bogdanov, S. Harmonized Methods of the International Honey Commission; Swiss Bee Research Centre, FAM: Liebefeld, Switzerland, 2002. [Google Scholar]
  20. Bradford, M.M. A rapid and sensitive method for the quantitation of microgram quantities of protein utilizing the principle of protein-dye binding. Anal. Biochem. 1976, 72, 248–254. [Google Scholar] [CrossRef]
  21. Singleton, V.L.; Rossi, J.A. Colorimetry of total phenolics with phosphomolybdic-phosphotungstic acid reagents. Am. J. Enol. Vitic. 1965, 16, 144–158. [Google Scholar]
Sample Availability: Samples of the compounds are not available from the authors.
Figure 1. A general outline of liquid–liquid extraction of honey.
Molecules 23 03067 g001
Figure 2. Mass spectra of ubiquinone-like isoprenoid compounds extracted from honey with different solvents and after protein degradation with pronase. (A) A full scan mass spectrum of extractives in SN1 removed by a mixture of methanol: ethanol: isopropanol, (B) extractives in SN2 after acetone extractions and (C) extractives in SN3 after pronase digestion. (D) Mass spectrum of extractives present in the supernatant after precipitation of honey with 80% ethanol only.
Molecules 23 03067 g002
Figure 3. Partitioning of ubiquinones between free (supernatants, SN1 and SN2) and protein-bound fractions released by protease digestion (Pronase).
Molecules 23 03067 g003
Figure 4. The total phenolic and protein contents in fractions obtained from size-exclusion chromatography of honey H177 on Sepharose 4B.
Molecules 23 03067 g004
Figure 5. Mass spectrum of fraction F15 of buckwheat honey H177 conducted in the negative ionization mode. The insert provides a general structure of ubiquinone UQ-7, m/z 656.6 and its fragmentation patterns. The product ion spectrum includes m/z 520.8, m/z 384.9 and m/z 197.0.
Molecules 23 03067 g005
Table 1. Major mass ions of ubiquinones detected during solvent extraction of honey.
CompoundMol. MassDetected Mass [M − H] (m/z)Theoretical Mass (Da)FormulaAccurate Mass [M + H]+ (m/z)
SN1SN2SN3
UQ-12999.603997997-998.809C69H106O4
UQ-11931.484929929-930.747C64H98O4
UQ-10863.34861861861862.6839C59H90O4
UQ-9794.6793793793794.621C54H82O4794.5476
UQ-8726.6725725725727.56599C49H75O4
UQ-7658.5657657657658.496C44H66O4659.5829
UQ-6590.899589589589590.432022C39H58O4591.4408
UQ-5522.758521521521522.370911C34H50O4523.3782
UQ-4454.308453453453454.308C29H42O4
UQ-3386.532385385385386.246C24H34O4386.246
UQ-2318.413317317317318.183C19H26O4
UQ-1250.29249249249250.121C14H18O4
UQ-0182.17-181181182.05790C9H10O4
Table 2. Main mass ions [M − H] of ubiquinones observed in protein-polyphenol complexes.
UQ TypeDetected [M − H], m/zDiagnostic Fragment
H208 F15H208 F16H220 F16H220 F17H177 H15H177 F16H229 F15m/z
UQ-3384.9384.9384.9384.9385385384.9197.1
UQ-5520.8520.8--521521520.9197.1
UQ-7656.8656.8656.8656.8657657656.8197.1
UQ-11928.8---929861928.9197.1
Table 3. Some physical–chemical properties of tested honeys.
HoneyColorSourceWater ActivityRefractive IndexMoisture (%)BrixSpecific Gravity
H208MediumBuckwheat/golden rod0.5801.490018.679.81.4129
H177Darkbuckwheat0.5721.496416.282.31.4295
H220Darkbuckwheat0.6011.498815.883.41.4370