Article

Non-Linear Enthalpy-Entropy Correlation for Nitrogen Adsorption in Zeolites

by
Montserrat R. Delgado
and
Carlos O. Arean
*
Department of Chemistry, University of the Balearic Islands, E-07122 Palma, Spain
*
Author to whom correspondence should be addressed.
Molecules 2018, 23(11), 2978; https://doi.org/10.3390/molecules23112978
Submission received: 16 October 2018 / Revised: 8 November 2018 / Accepted: 12 November 2018 / Published: 15 November 2018
(This article belongs to the Section Physical Chemistry)

Abstract

:
The thermodynamics of dinitrogen adsorption in faujasite-type zeolites, Na-Y, Ca-Y and Sr-Y, were investigated by means of variable-temperature infrared spectroscopy, a technique that affords determination of the standard adsorption enthalpy (ΔH0) and entropy (ΔS0) from an analysis of the IR spectra recorded over a range of temperatures. The results obtained, taken together with previously reported values for N2 adsorption on protonic zeolites, revealed a non-linear correlation between ΔH0 and ΔS0. Implications of such a correlation for gas separation and purification by adsorption in porous solids are highlighted.

1. Introduction

By virtue of their (relatively) high thermal stability, large gas adsorption capacity, and low cost, zeolites (and related porous solids) are currently used in industrial processes, such as oxygen and nitrogen production from air, upgrading (sweetening) of natural gas, and purification of hydrogen obtained from steam reforming of hydrocarbons or from syngas [1,2,3,4,5], to quote only a few examples. Future applications of zeolites as selective gas adsorbents can also be envisaged, such as in carbon capture and sequestration (CCS) from the flue gas of coal-fuelled power stations and for improving indoor air quality inside submarines and manned spacecraft [6,7,8,9,10,11].
In addition to their stability and low cost, an intrinsic advantage of zeolites over other gas adsorbents, such as activated carbons and porous polymers [12,13], is the facility with which cation exchange can be carried out on zeolites, which provides a means to tune the strength of the electrostatic field at the cation sites that constitutes a major factor determining gas-solid interaction energy. It should be noted, however, that thermodynamic (equilibrium) gas separation, storage and delivery are ruled by both adsorption enthalpy (ΔH0) and entropy (ΔS0), which together determine the Gibbs free energy of the process. Moreover, an enthalpy-entropy correlation, frequently referred to as compensation [14,15], could be non-linear, as found some time ago in the case of hydrogen adsorption in zeolites [16,17]. Herein we give corresponding values for nitrogen, as measured by variable-temperature IR (VTIR) spectroscopy. An abridged outline of this experimental method is given below, to facilitate understanding for non-specialized readers.

2. Outline of the VTIR Method

Variable-temperature infrared (VTIR) spectroscopy is an instrumental technique [18,19] that allows one to obtain, not only the spectroscopic signature of a gas-solid adsorption complex, but also the magnitude of the standard enthalpy (ΔH0) and entropy (ΔS0) involved in the adsorption process, provided that adsorption brings about a change in a characteristic IR absorption mode of the gas molecule, or gives origin to such a vibration mode. Whenever that is the case, let Equation (1) below describe the gas adsorption equilibrium:
S(s)+ M(g)S-M(ads)
For an ideal system, the integrated intensity of the characteristic IR absorption band being monitored should be proportional to surface coverage, θ, of the adsorption sites. Hence, that intensity (absorbance) gives information of the activity (in the thermodynamic sense) of both the adsorbed species and the empty sites (1 − θ). Simultaneously, the gas equilibrium pressure, p, gives the activity of the gas phase. Therefore, by measuring IR absorbance and equilibrium pressure at any given temperature, the equilibrium constant, K, at that temperature can be determined; and the variation of K with T (along a series of IR spectroscopic measurements taken over a temperature range) is related to ΔH0 and ΔS0 through the well-known van’t Hoff equation:
K(T) = exp(−ΔH0/RT) exp(ΔS0/R)
Assuming Langmuir-type adsorption, combination of Equation (2) with Equation (3) leads to Equation (4) below:
θ = K(T)p/[1 + K(T)p]
ln {θ/[(1 − θ)p]} = (−ΔH0/RT) + (ΔS0/R)
Equation (4) can also be written as:
ln {A/[(AMA)p]} = (−ΔH0/RT) + (ΔS0/R)
where A stands for the actual IR intensity being measured and AM is the maximum absorbance at full surface coverage (θ = 1). It is thus clear that, after recording IR absorption and equilibrium pressure over a temperature range, a van’t Hoff plot of Equation (4) or (5) gives direct access to the corresponding values of ΔH0 and ΔS0 which characterize the thermodynamics of the gas-solid adsorption process. Details of the assumptions made, and hence on the applicability of Equations (4) and (5) can be found elsewhere [19,20].

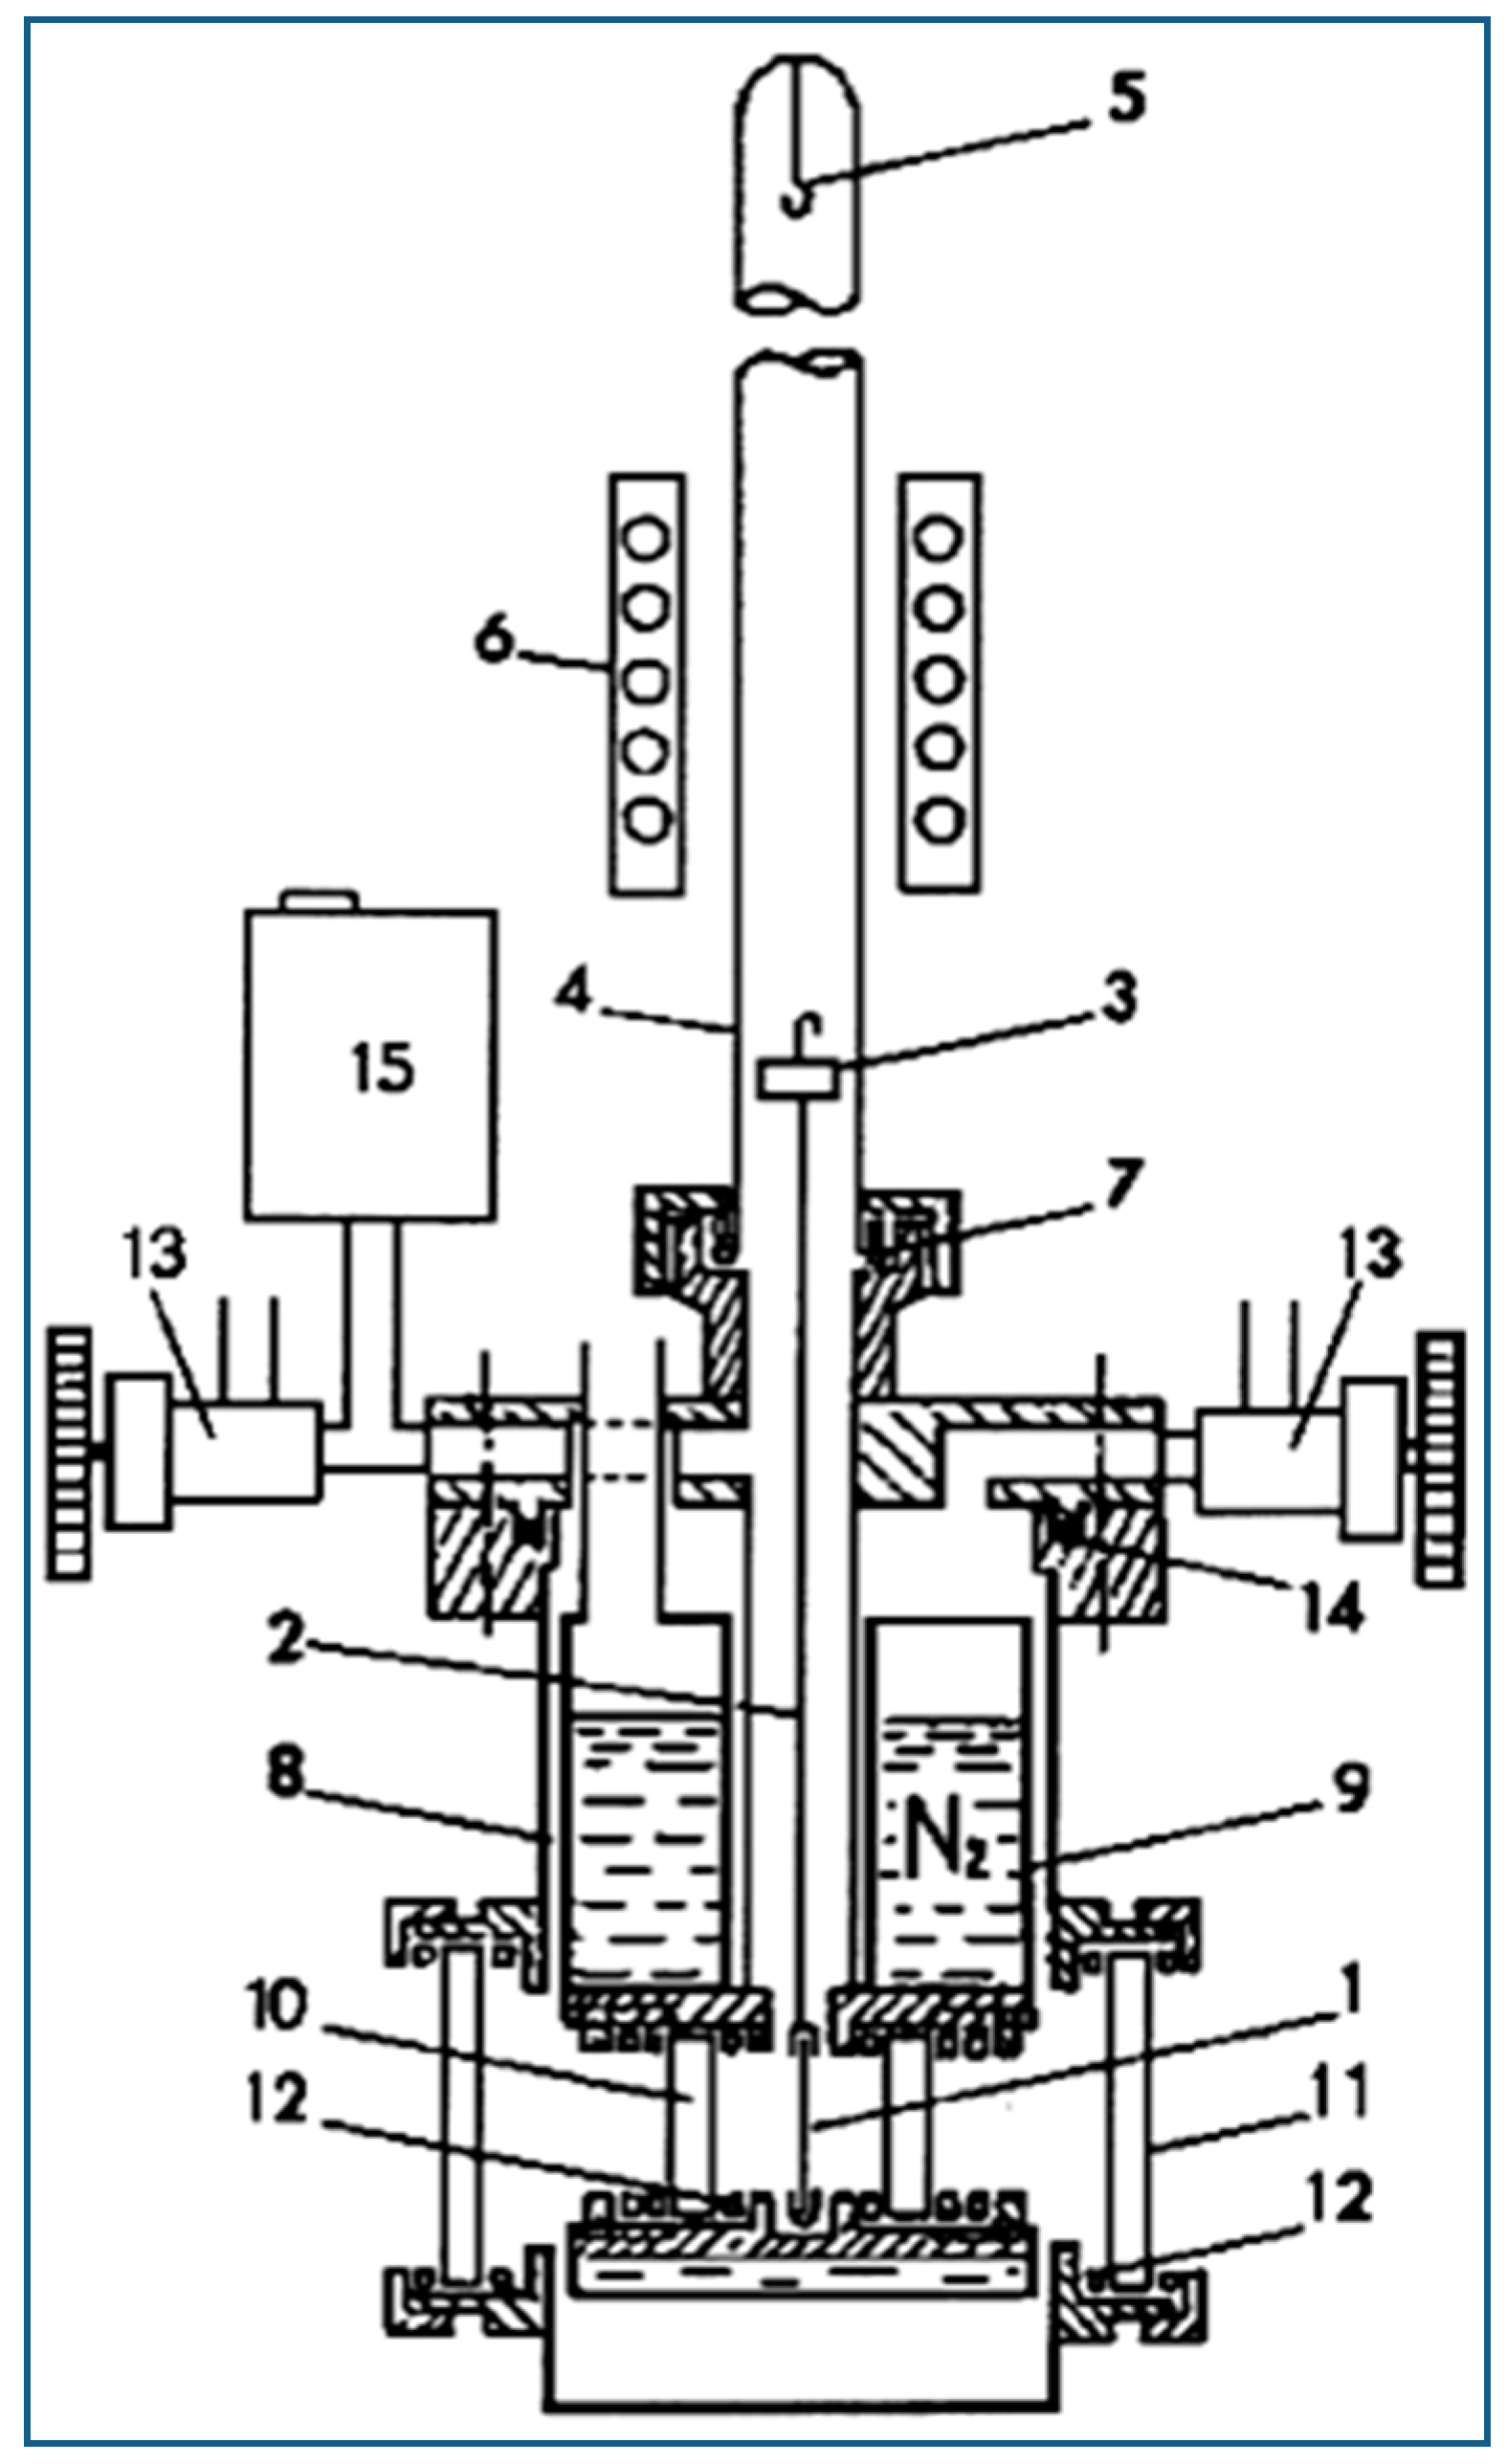
3. Experimental Protocol

The Na-Y, Ca-Y and Sr-Y zeolites used herein were obtained by repeated ion exchange of portions of the same parent NH4-Y sample (Zeolyst, Si:Al = 2.55) with a 0.5 M solution of the corresponding (Na, Ca and Sr) nitrate; total ion exchange was checked by IR spectroscopy. Powder X-ray diffraction showed (in all cases) good crystallinity and absence of any diffraction line not corresponding to the FAU structure type.
For VTIR spectroscopic measurements, thin self-supported wafers of the zeolite samples were prepared and activated (outgassed) in a dynamic vacuum (residual pressure smaller than 10 −4 mbar) for 5 h at 650 K inside an IR cell [21,22] (shown in the Figure 1) that allowed in situ sample activation, gas dosage and variable-temperature IR spectroscopy to be carried out. After sample activation, the cell was cooled with liquid nitrogen and dosed with an amount of nitrogen gas small enough to prevent formation of geminal Mn+(N2)2 adsorbed species (M = Na, Ca, Sr), which would otherwise complicate determination of the corresponding IR absorbance [23]. The cell was then closed, and series of VTIR spectra were recorded (upon gradual warming up of the IR cell) while simultaneously registering temperature and gas equilibrium pressure. For this purpose, the cell was equipped with a platinum resistance thermometer (Tinsley) and a capacitance pressure gauge (MKS, Baratron). Transmission FT-IR spectra were recorded, at 2 cm−1 resolution, using a Bruker Vertex 80v spectrometer. Sixty-four scans were accumulated for each spectrum.

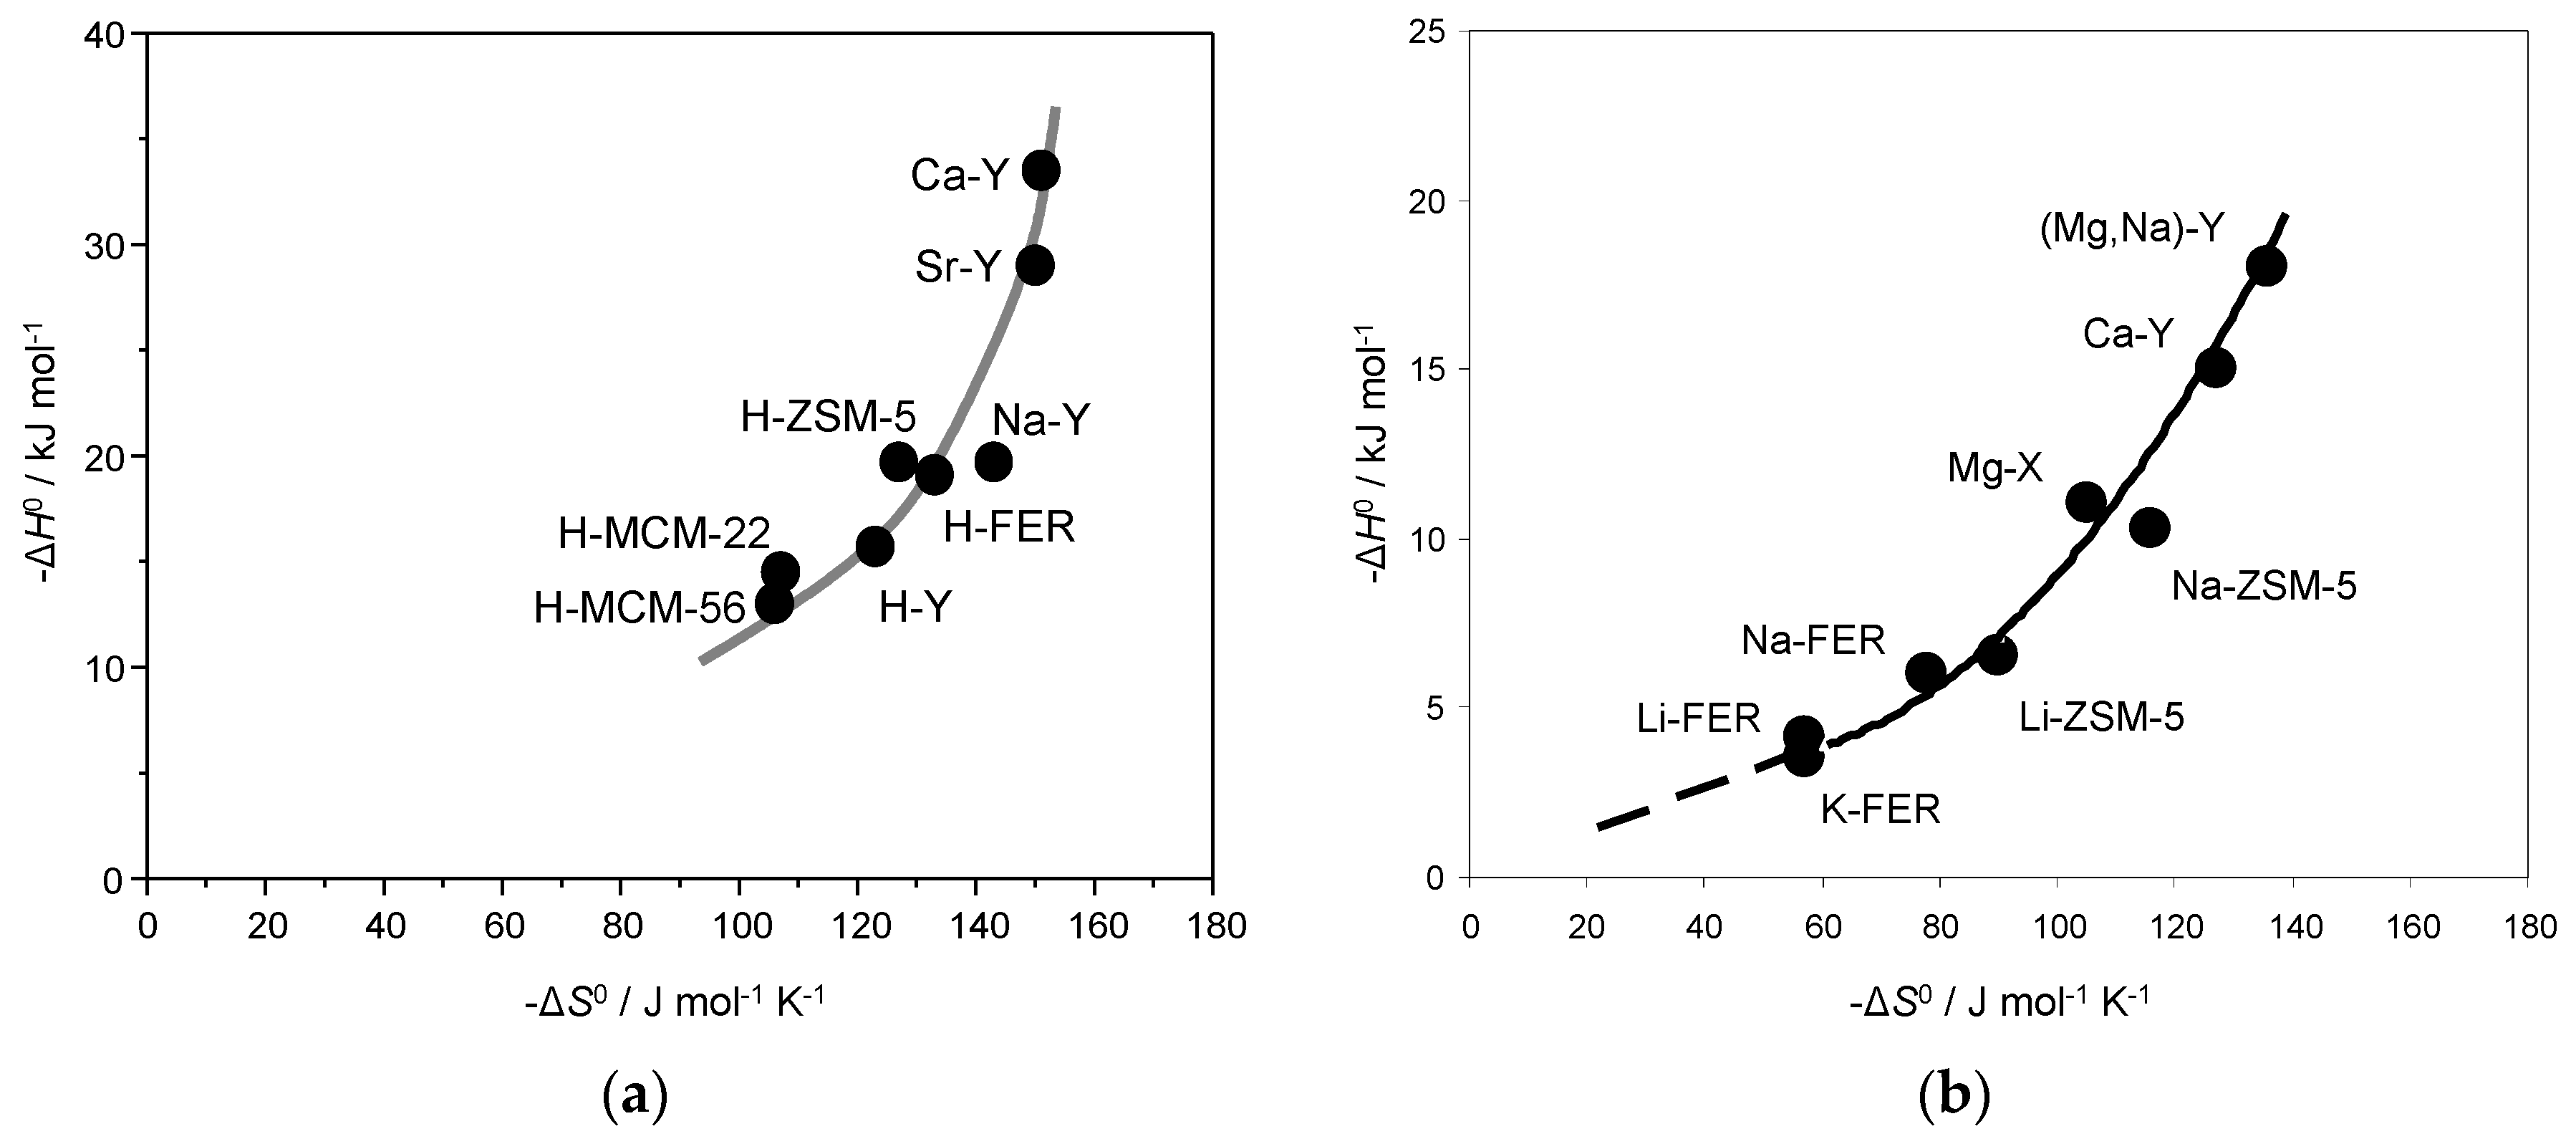
4. Results and Discussion

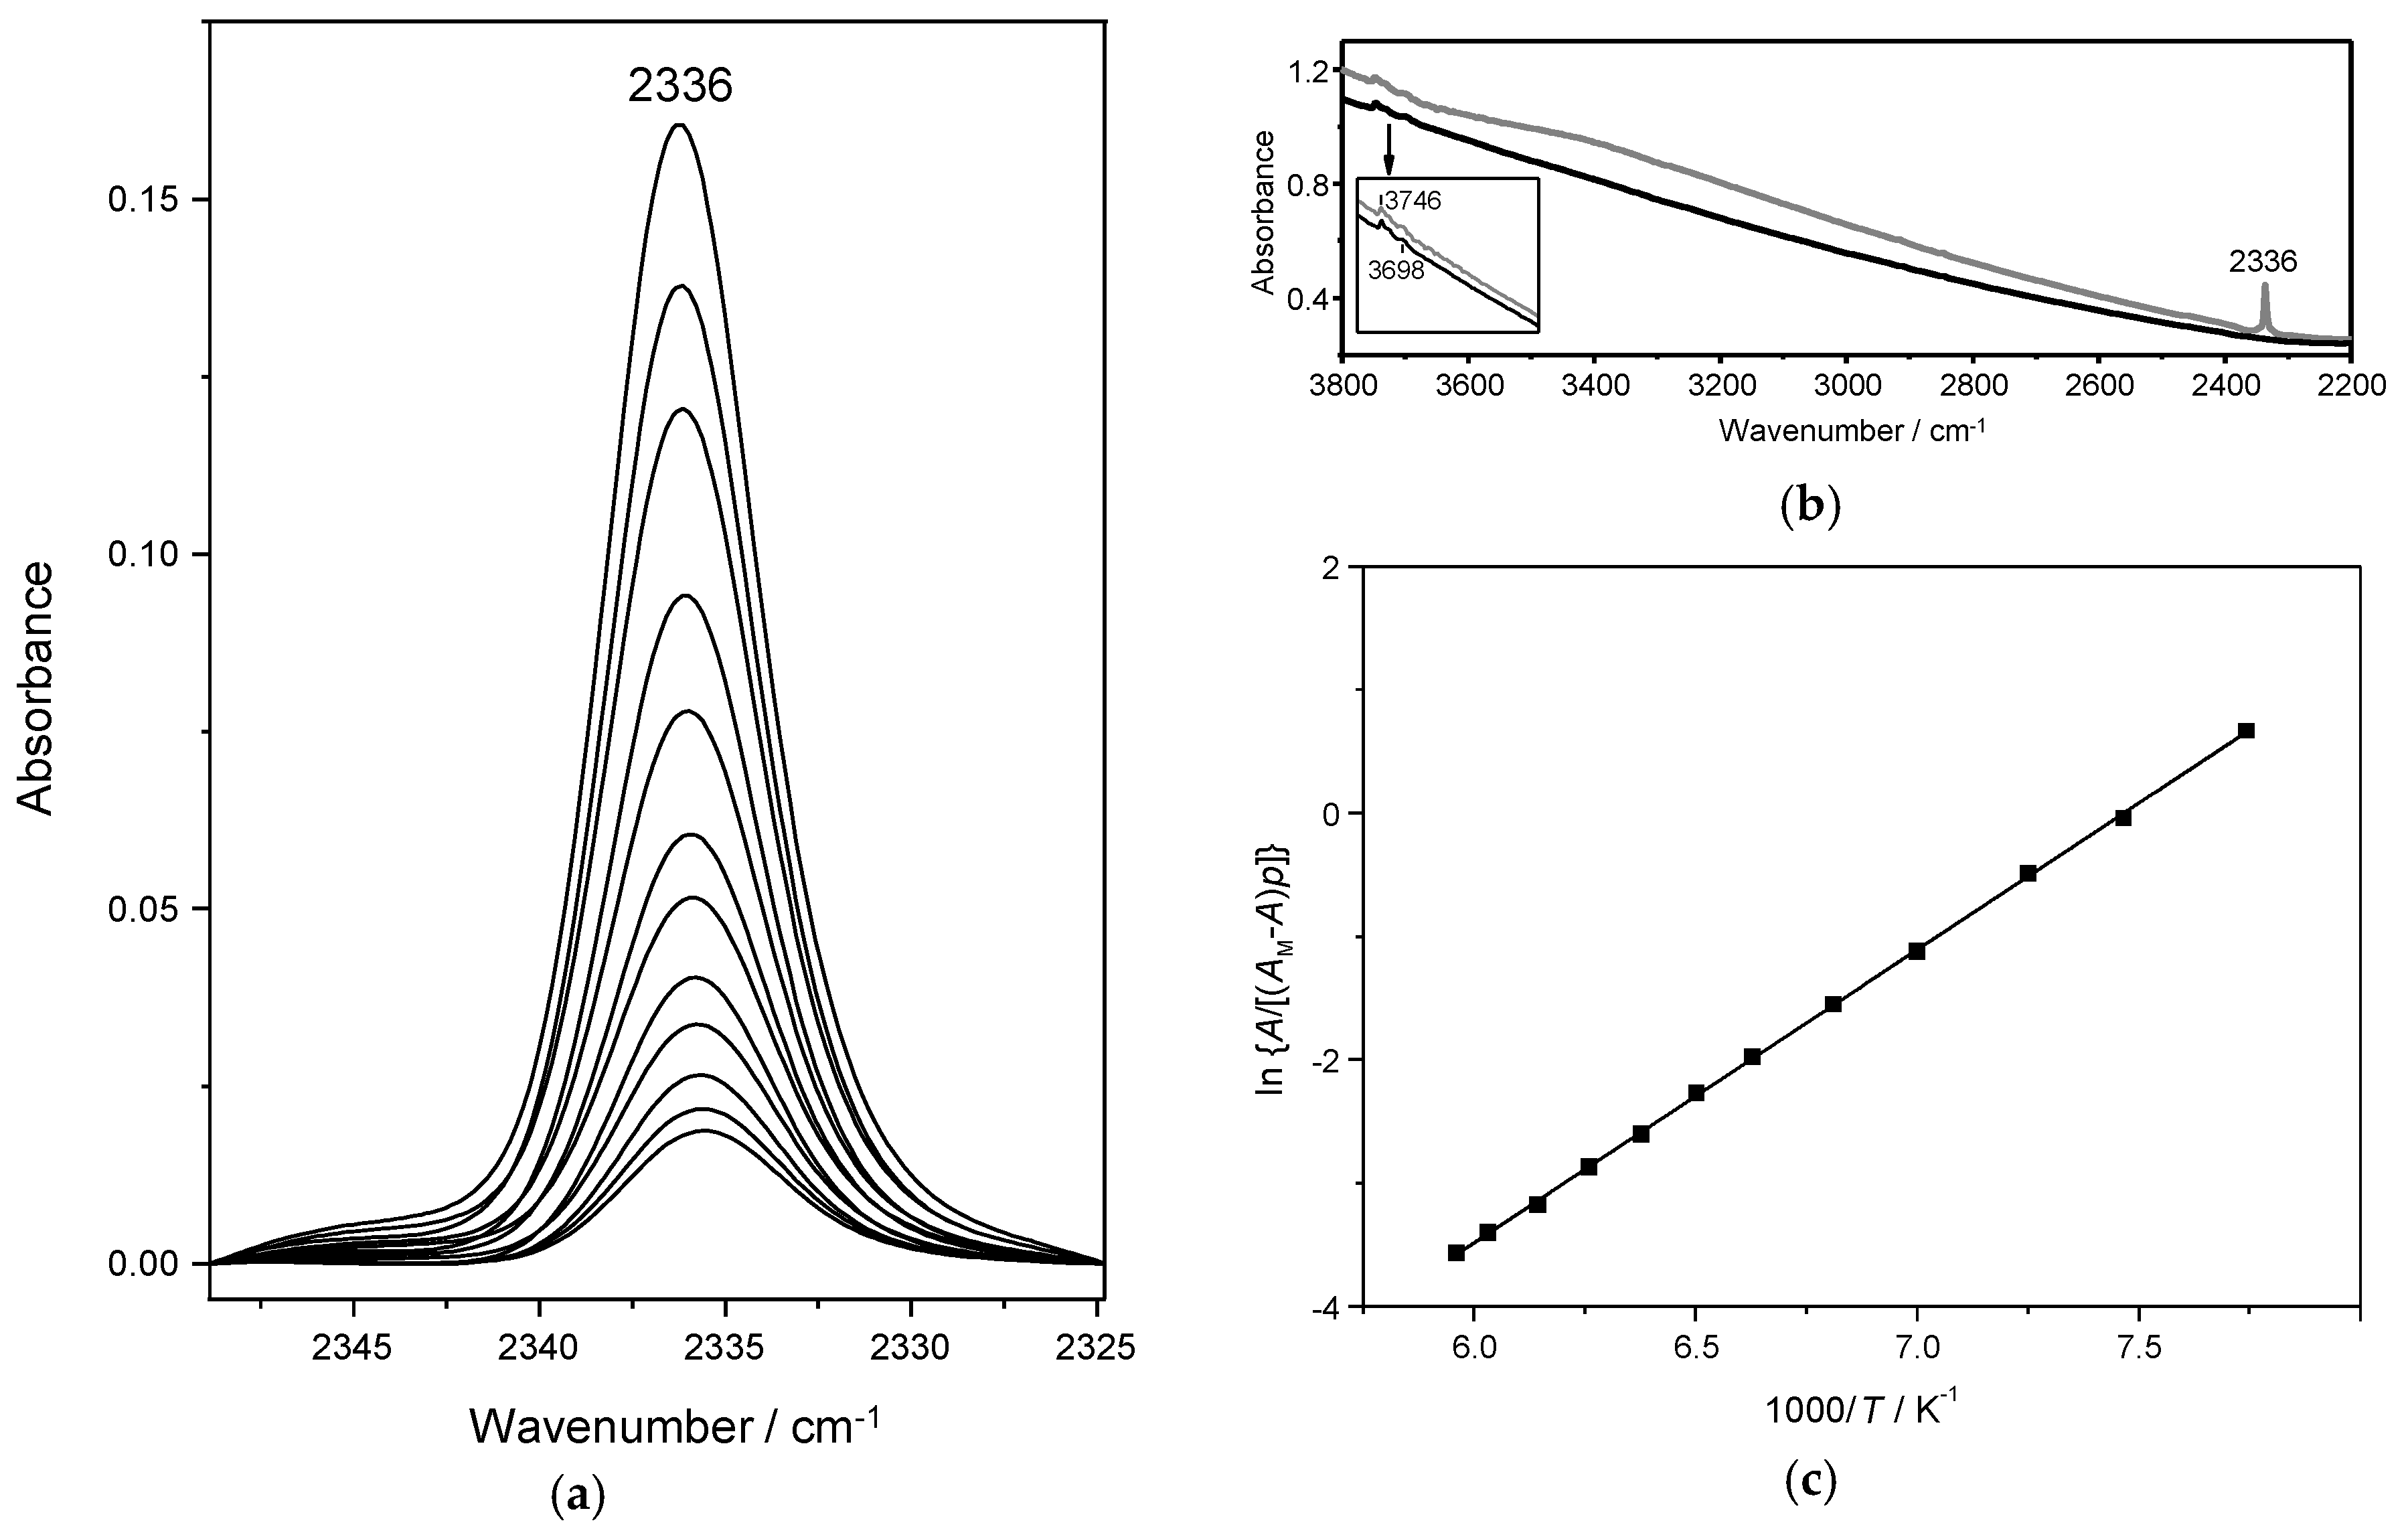
4.1. Dinitrogen Adsorption in Na-Y

Figure 2a shows FT-IR spectra recorded, over a range of temperature, for N2 (fixed dose) adsorbed in Na-Y. A single IR absorption band is seen, which peaks at 2336 cm−1. According to abundant literature reports [24,25,26,27], this band is assigned to the N–N stretching mode of the N2 molecule interacting end-on with a Na+ cation (situated on the internal wall of the zeolite supercage). Such an interaction leads to polarization of the adsorbed molecule and brings about activation in the IR of the N–N stretching vibration, which is only Raman active in the gas phase; at a frequency of 2330 cm−1 [25]. Concomitantly, a small hypsochromic shift was expected [28,29], which resulted to be of 6 cm−1 in the present case.
For further information, Figure 2b shows a full IR spectrum covering the region of 2200 to 3800 cm−1 both, before (black line) and after dosing with nitrogen (grey line). In the N–N stretching region, no other IR absorption band is seen aside from that one at 2336 cm−1 already discussed above. In the O–H stretching region two faint bands can be seen, at 3746 and 3698 cm−1. The former one is typical of silanols, while the latter is likely to arise from a trace of extra-framework aluminium giving rise to Lewis acid sites (LAS). None of these IR absorption bands seems to be significantly affected by nitrogen, at the temperature and pressure range at which VTIR spectra were recorded. Note also that no IR absorption band is present in the range of 3650–3550 cm−1, where framework Si(OH)Al groups (Brønsted acid sites) would be expected to show up [26] in the case of incomplete cation exchange (of the parent ammonic form of the zeolite). Very similar features in the O–H stretching region were also shown by the zeolite samples Ca-Y and Sr-Y.
After computer integration of the IR absorption bands shown in Figure 2a, the corresponding van’t Hoff plot, Figure 2c, of the left-hand side of Equation (5) versus 1/T was obtained. From this linear plot, the values of ΔH0 and ΔS0 ruling the thermodynamics of the gas-solid adsorption process resulted in −19.7 kJ mol−1 and −143 J mol−1 K−1 respectively. Error limits are estimated to be smaller than ±2 kJ mol−1 for enthalpy and ±10 J mol−1 K−1 for entropy.

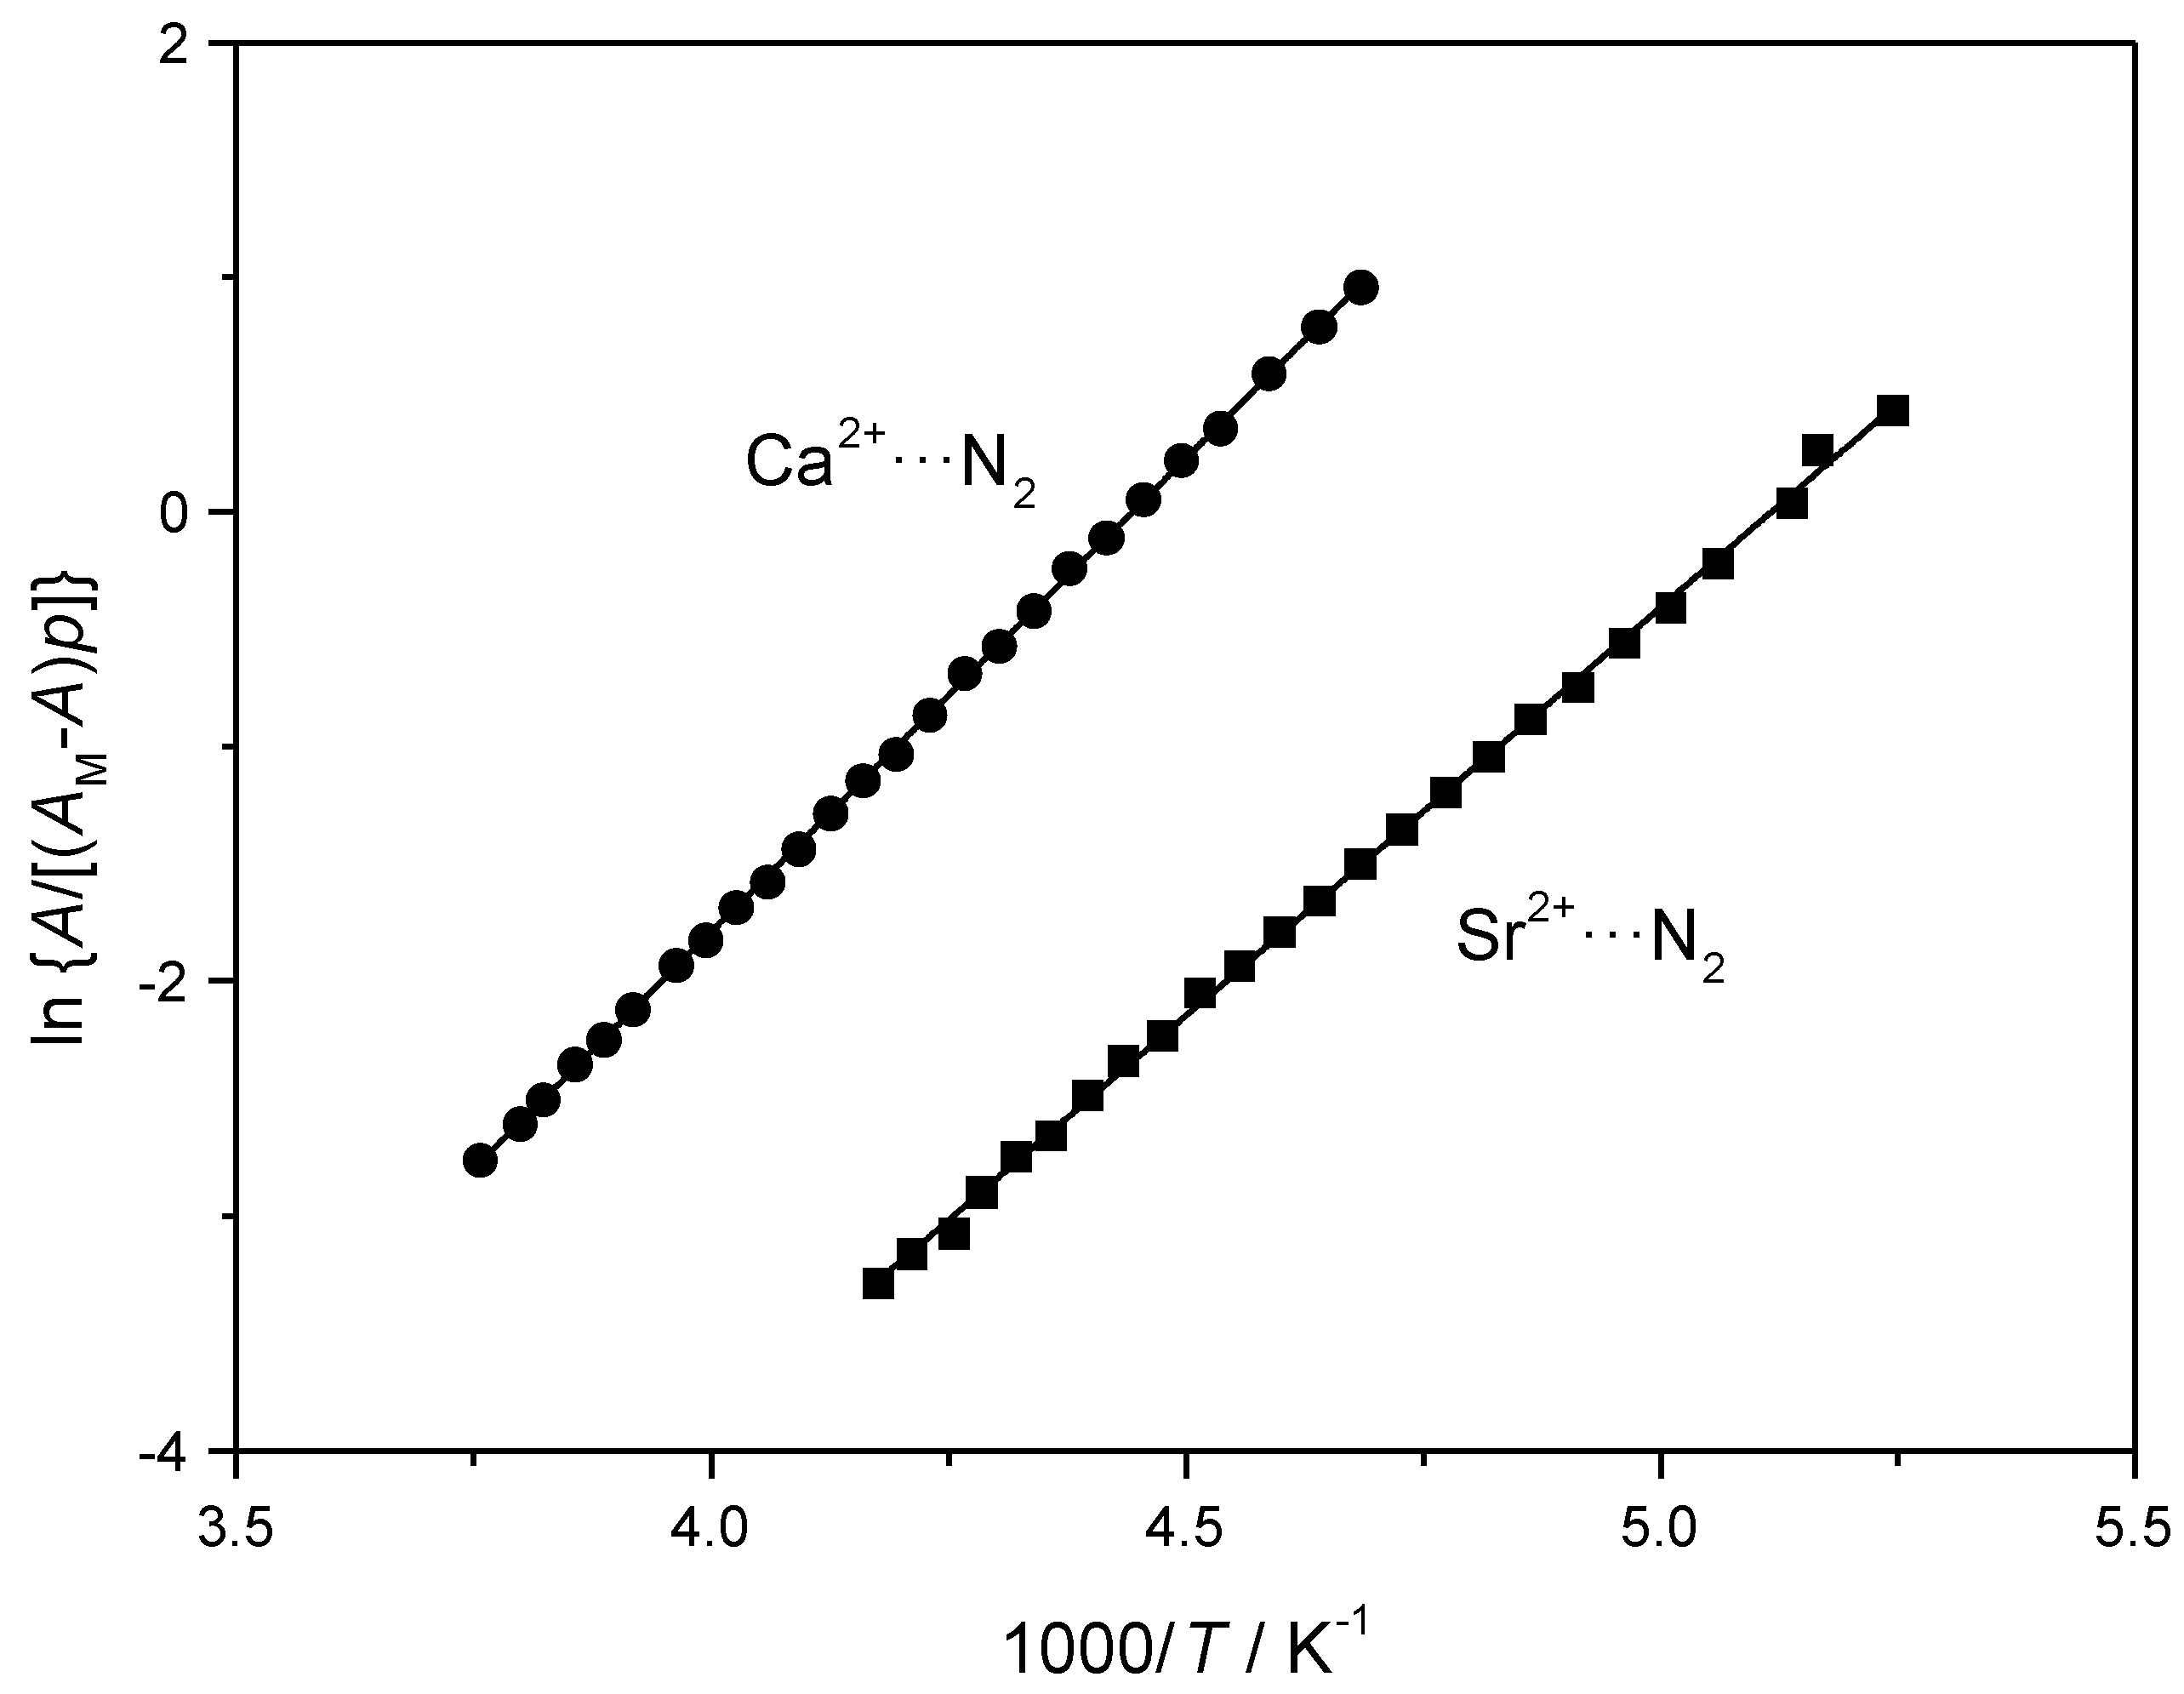
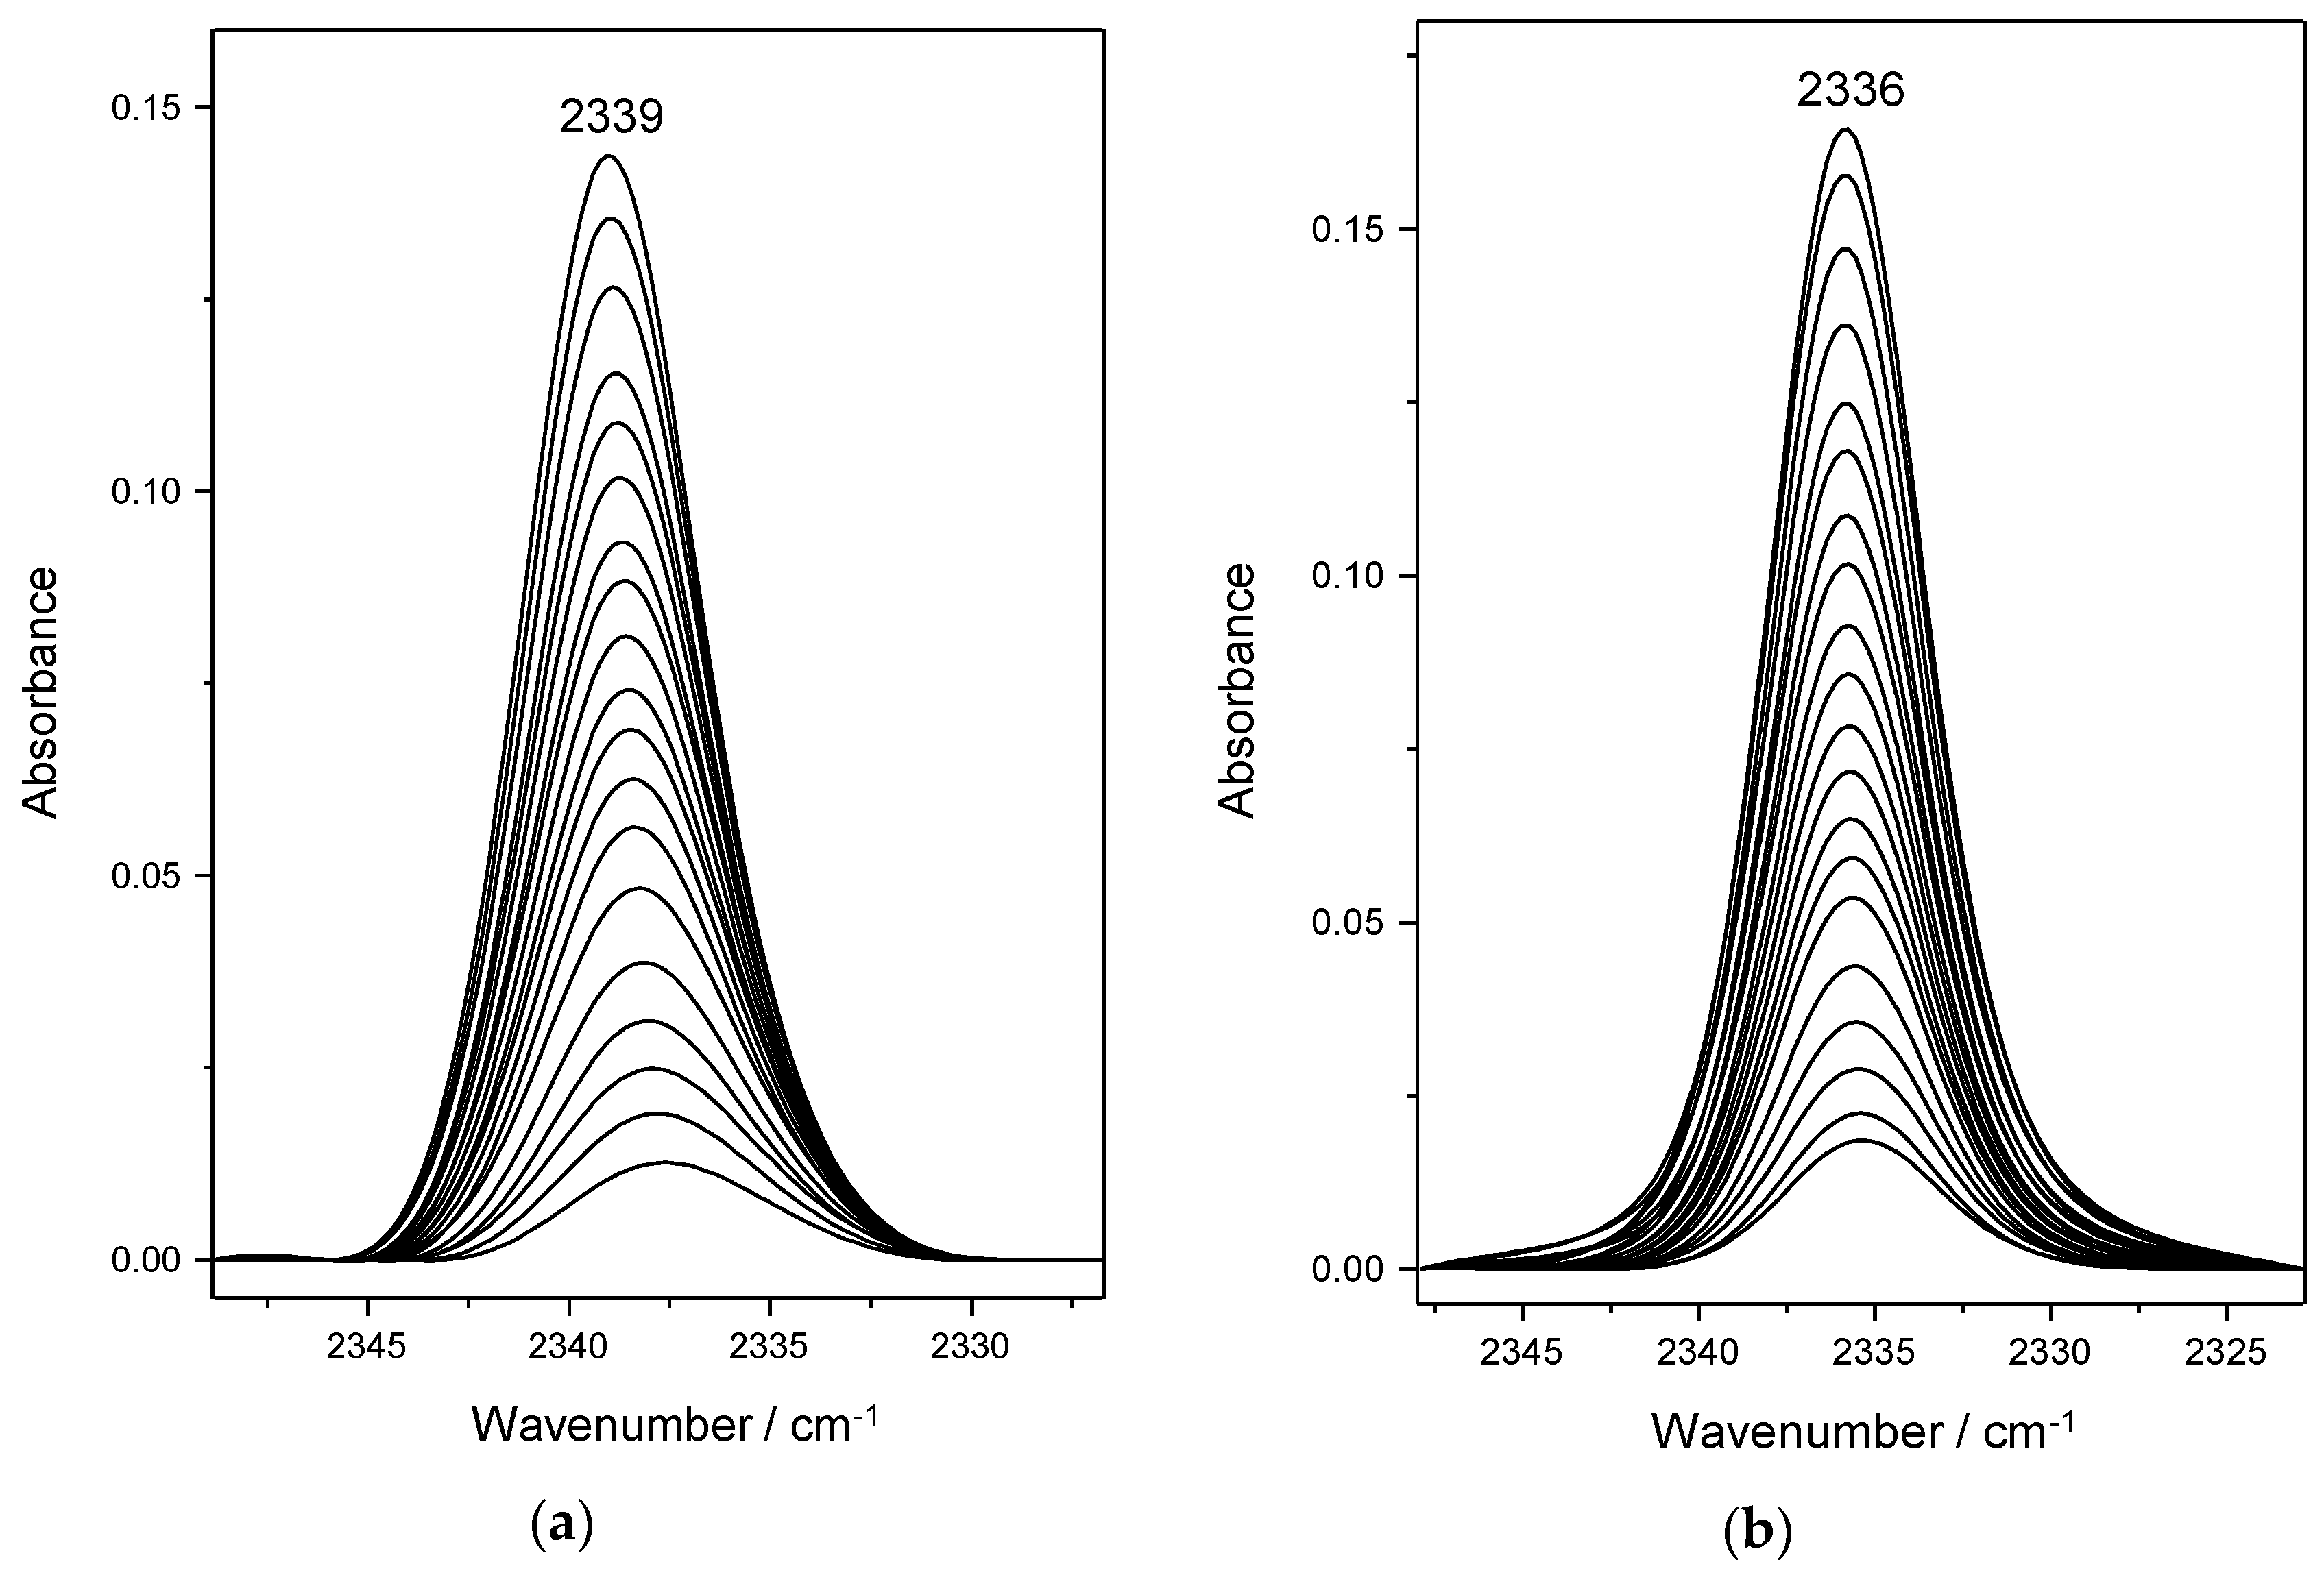
4.2. Dinitrogen Adsorption in Ca-Y and Sr-Y

Figure 3a depicts representative VTIR spectra, covering the range of 207 to 266 K, obtained for dinitrogen adsorption in the Ca-Y zeolite. The peak wavenumber appears at 2339 cm−1, slightly higher than that found for the case of the N2/Na-Y system, as expected on account of the larger positive electric charge of the cation. The corresponding plot of the left-hand side of Equation (5) versus the reciprocal of the temperature, for the whole series of spectra recorded, is shown in Figure 4. From this linear plot, the corresponding values of standard adsorption enthalpy and entropy were found to be −33.5(±2) kJ mol−1 and −151(±10) J mol−1 K−1, respectively.
Representative VTIR spectra (191 to 239 K) obtained for dinitrogen adsorption in Sr-Y are shown in Figure 3b. All of them peak at 2336 cm−1, this wavenumber value, slightly smaller than that found for the N2/Ca-Y system, reflects the smaller polarizing power (charge/radius ratio) of the Sr2+ ion as compared to that of Ca2+. The van’t Hoff plot for the N2/Sr-Y system is shown in Figure 4. Corresponding values of ΔH0 and ΔS0 are −29(±2) kJ mol−1 and −150(±10) J mo−1 K−1, respectively.
The set of ΔH0 and ΔS0 values reported above for N2 adsorption in alkaline zeolites is summarized in Table 1, which also compiles corresponding results previously reported [30,31,32] for dinitrogen adsorption in some protonic zeolites. The complete set of results is plotted in Figure 5a, which clearly shows a non-linear enthalpy-entropy correlation. It is relevant to add that a similar correlation between ΔH0 and ΔS0 was reported some time ago [17] for the case of dihydrogen adsorption in alkaline zeolites, as shown in Figure 5b. In both cases it turns out that (referring to absolute values) the relative range at which entropy changes gradually slows down as enthalpy increases more and more, thus giving rise to the concave curves seen in Figure 5. Such a non-linear enthalpy-entropy correlation can be rationalized by considering that, in principle, there is no definite limit for ΔH0 (which increases with increasing interaction energy between the adsorbed molecules and the adsorption site), while ΔS0 does have an inherent limit, given by complete loss of motion freedom (a limit that is not expected to be attained in physisorption).
In this context, it is also relevant to add that Hercigonja et al. [33] have studied (by adsorption calorimetry) the enthalpy-entropy compensation effect for n-hexane adsorption in several ion exchanged ZSM-5 zeolites, finding linear ΔH0 versus ΔS0 plots in all cases. By contrast, they found no linear compensation effect for the adsorption of the same gas in faujasite-type zeolites. These findings, taken together with those reported herein for dinitrogen (and dihydrogen) adsorption, suggest that valuable new insights could be expected from further research concerning adsorption enthalpy-entropy correlation effects, which are highly relevant for both gas separation and gas delivery.

Author Contributions

C.O.A.: planning, experimental, discussion, wrote the draft. M.R.D.: planning, experimental and discussion, edited the manuscript.

Funding

This research received no external funding.

Conflicts of Interest

The authors declare no conflicts of interest.

References

  1. Nandi, S.P.; Walker, P.L., Jr. Separation of Oxygen and Nitrogen Using 5A Zeolite and Carbon Molecular Sieves. Sep. Sci. 1976, 11, 441–453. [Google Scholar] [CrossRef]
  2. Mofarahi, M.; Towfighi, J.; Fathi, L. Oxygen separation from air by four-bed pressure swing adsorption. Ind. Eng. Chem. Res. 2009, 48, 5439–5444. [Google Scholar] [CrossRef]
  3. Hamed, H.H. Oxygen separation from air using zeolite type 5A. Int. J. Sci. Eng. Res. 2015, 6, 597–602. [Google Scholar]
  4. Rufford, T.E.; Smart, S.; Watson, G.C.Y.; Graham, B.F.; Boxall, J.; Diniz da Costa, J.C.; May, E.F. The removal of CO2 and N2 from natural gas: A review of conventional and emerging process technologies. J. Petrol. Sci. Technol. 2012, 94, 123–154. [Google Scholar] [CrossRef]
  5. Shah, M.S.; Tsapatsis, M.; Siepman, J.I. Identifying optimal zeolitic sorbents for sweetening of highly sour natural gas. Angew. Chem. Int. Ed. 2016, 55, 5938–5942. [Google Scholar] [CrossRef] [PubMed]
  6. Bae, T.H.; Hudson, M.R.; Mason, J.A.; Queen, W.L.; Dutton, J.J.; Sumida, K.; Micklash, K.J.; Kaye, S.S.; Browns, C.M.; Long, J.R. Evaluation of cations exchanged zeolite adsorbents for post-combustion carbon dioxide capture. Energy Environ. Sci. 2013, 6, 128–138. [Google Scholar] [CrossRef]
  7. Thang, H.V.; Grajciar, L.; Nachtigall, P.; Bludsky, O.; Arean, C.O.; Frydova, E.; Bulanek, R. Adsorption of CO2 in FAU zeolites: Effect of zeolite composition. Catal. Today 2014, 227, 50–56. [Google Scholar] [CrossRef]
  8. Pham, T.D.; Hudson, M.R.; Brown, C.M.; Lobo, R.F. On the structure-property relationships of cation-exchanged ZK-5 zeolites for CO2 adsorption. ChemSusChem. 2017, 10, 946–957. [Google Scholar] [CrossRef] [PubMed]
  9. Gomez-Alvarez, R.; Calero, S. Highly selective zeolite topologies for flue gas separation. Chem. Eur. J. 2016, 52, 18705–18708. [Google Scholar] [CrossRef] [PubMed]
  10. Pulido, A.; Delgado, M.R.; Bludsky, O.; Nachtigall, P.; Arean, C.O. Combined DFT/CC and IR spectroscopic studies on carbon dioxide adsorption on the zeolite H-FER. Energy Environ. Sci. 2009, 2, 1187–1195. [Google Scholar] [CrossRef]
  11. Ackley, M.W.; Rege, S.V.; Saxena, H. Application of natural zeolites in the purification and separation of gases. Microporous Mesoporous Mater. 2003, 61, 25–42. [Google Scholar] [CrossRef]
  12. Armandi, M.; Bonelli, B.; Bottero, I.; Arean, C.O.; Garrone, E. Synthesis and characterization of ordered porous carbons with potential applications as hydrogen storage media. Microporous Mesoporous Mater. 2007, 103, 150–157. [Google Scholar] [CrossRef]
  13. Arean, C.O.; Groppo, E.; Liu, W.; Velasco, L.F.; Parra, J.B. Carbon dioxide and nitrogen adsorption on porous copolymers of divinylbenzene and acrylic acid. Adsorption 2013, 19, 367–372. [Google Scholar] [CrossRef]
  14. Boots, H.M.J.; Boks, P.K. Theory of enthalpy-entropy compensation. J. Phys. Chem. 1989, 93, 8240–8243. [Google Scholar] [CrossRef]
  15. Pan, A.; Biswas, T.; Rakshit, A.K.; Moulik, S.P. Enthalpy-entropy compensation (EEC) effect: A revisit. J. Phys. Chem. B 2015, 119, 15876–15884. [Google Scholar] [CrossRef] [PubMed]
  16. Arean, C.O.; Bonelli, B.; Delgado, M.R.; Garrone, E. Hydrogen storage via physisorption: the combined role of adsorption enthalpy and entropy. Turk. J. Chem. 2009, 33, 599–606. [Google Scholar]
  17. Garrone, E.; Bonelli, B.; Arean, C.O. Enthalpy-entropy correlation for hydrogen adsorption on zeolites. Chem. Phys. Lett. 2008, 456, 68–70. [Google Scholar]
  18. Arean, C.O.; Manoilova, O.V.; Palomino, G.T.; Delgado, M.R.; Tsyganenko, A.A.; Bonelli, B.; Garrone, E. Variable-temperature infrared spectroscopy. An access to adsorption thermodynamics of weakly interacting systems. Phys. Chem. Chem. Phys. 2002, 4, 5713–5715. [Google Scholar] [CrossRef]
  19. Garrone, E.; Arean, C.O. Variable temperature infrared spectroscopy: A convenient tool for studying the thermodynamics of weak solid-gas interactions. Chem. Soc. Rev. 2005, 34, 846–857. [Google Scholar] [CrossRef] [PubMed]
  20. Arean, C.O. Probing Brønsted acidity of protonic zeolites with variable-temperature infrared spectroscopy. Ukr. J. Phys. 2018, 63, 538–545. [Google Scholar] [CrossRef]
  21. Tsyganenko, A.A.; Storozhev, P.Y.; Arean, C.O. Infrared spectroscopic studies on the binding isomerism of adsorbed molecules. Kinet. Catal. 2004, 45, 530–540. [Google Scholar] [CrossRef]
  22. Garrone, E.; Delgado, M.R.; Bonelli, B.; Arean, C.O. Probing gas adsorption in zeolites by variable-temperature IR spectroscopy: An overview of current research. Molecules 2017, 22, 1557. [Google Scholar] [CrossRef] [PubMed]
  23. Chakarova, K.; Andonova, S.; Hadjiivanov, K. FTIR study of CO and N2 adsorption on [Ge]FAU zeolites in their Na- and H-forms. Microporous Mesoporous Mater. 2016, 220, 188–197. [Google Scholar] [CrossRef]
  24. Yamazaki, T.; Watanuki, I.; Ozawa, S.; Ogino, Y. Infrared spectra of nitrogen adsorbed on ion-exchanged ZSM-5 zeolite. Bull. Chem. Soc. Jpn. 1988, 61, 1039–1044. [Google Scholar] [CrossRef]
  25. Smudde, G.H.; Slager, T.L.; Coe, C.G.; MacDougall, J.E.; Weigel, S.J. DRIFTS and Raman investigation of N2 and O2 adsorption on zeolites at ambient temperature. Appl. Spectrosc. 1995, 49, 1747–1755. [Google Scholar] [CrossRef]
  26. Zecchina, A.; Arean, C.O. Diatomic molecular probes for mid-IR studies of zeolites. Chem. Soc. Rev. 1996, 25, 187–197. [Google Scholar] [CrossRef]
  27. Bulanin, K.M.; Lobo, R.F.; Bulanin, M.O. Low-temperature adsorption of N2, O2, and D2 on LiX, NaX and NaLiX zeolites studied by FT-IR spectroscopy. J. Phys. Chem. B 2000, 104, 1269–1276. [Google Scholar] [CrossRef]
  28. Koubi, L.; Blain, M.; Cohen de Lara, E.; Leclercq, J.M. Vibrational frequency shifts of diatomic molecules in interaction with a Na+ cation by ab-initio calculations—comparison with experiment on H2 and N2 adsorbed in Na-A zeolite. Chem. Phys. Lett. 1994, 217, 544–550. [Google Scholar] [CrossRef]
  29. Cohen de Lara, E. Electric field effect on molecules: Relation between the orientation of the molecule with respect to the field and the vibrational frequency shift observed in IR spectra of molecules adsorbed in zeolites. Phys. Chem. Chem. Phys. 1999, 1, 501–505. [Google Scholar] [CrossRef]
  30. Arean, C.O. Dinitrogen and carbon monoxide hydrogen bonding in protonic zeolites: Studies from variable-temperature infrared spectroscopy. J. Mol. Struct. 2008, 880, 31–37. [Google Scholar] [CrossRef]
  31. Nachtigall, P.; Bludsky, O.; Grajciar, L.; Nachtigallova, D.; Delgado, M.R.; Arean, C.O. Computational and FTIR spectroscopic studies on carbon monoxide and dinitrogen adsorption on a high-silica H-FER zeolite. Phys. Chem. Chem. Phys. 2009, 11, 791–802. [Google Scholar] [CrossRef] [PubMed]
  32. Arean, C.O.; Delgado, M.R.; Nachtigall, P.; Thang, H.V.; Rubes, M.; Bulanek, R.; Chlubna-Eliasova, P. Measuring the Brønsted acid strength of zeolites: does it correlate with the O-H frequency shift probed by a weak base? Phys. Chem. Chem. Phys. 2014, 21, 10129–10141. [Google Scholar] [CrossRef] [PubMed]
  33. Hercigonja, R.; Rac, V.; Rakic, V.; Auroux, A. Enthalpy-entropy compensation for n-hexane adsorption on HZSM-5 containing transition metal ions. J. Chem. Thermodyn. 2012, 48, 112–117. [Google Scholar] [CrossRef]
Sample Availability: Samples of the compounds are not available from the authors.
Figure 1. Scheme of the homemade (stainless-steel) variable-temperature IR cell: (1) sample wafer, (2) sample holder, (3) magnetically driven anchoring piece, (4) quartz tube, (5) hook for fixing the sample wafer inside the furnace, (6) furnace, (7) Viton O-ring, (8) cell body, (9) refrigerated region, (10) and (11) optical windows, (12) indium gaskets, (13) valve, (14) Teflon gasket, (15) pressure gauge. Refs. [21,22].
Molecules 23 02978 g001
Figure 2. (a) Variable-temperature IR spectra (in the N–N stretching region) of N2 adsorbed in Na-Y. From top to bottom temperature increases from 129 to 177 K; and equilibrium pressure from 2.34 to 5.67 mbar. (b) Blank spectrum of the zeolite sample in the 2200 to 3800 cm−1 (black line) and after dosing with N2 (grey line). The inset shows a magnification of the O–H stretching region. (c) van’t Hoff plot for N2 adsorbed in Na-Y, data obtained from the IR absorption band at 2336 cm−1.
Molecules 23 02978 g002
Figure 3. (a) Representative variable-temperature IR spectra of N2 adsorbed in Ca-Y. From top to bottom temperature increases from 207 to 266 K; and equilibrium pressure from 1.05 to 1.77 mbar. (b) Representative variable-temperature IR spectra of N2 adsorbed in Sr-Y. From top to bottom temperature increases from 191 to 239 K; and equilibrium pressure from 2.27 to 3.28 mbar.
Molecules 23 02978 g003
Figure 4. van’t Hoff plots for N2 adsorbed in Ca-Y and Sr-Y, data obtained from the IR absorption bands at 2339 (Ca2+···N2) and 2336 cm−1 (Sr2+···N2), respectively.
Molecules 23 02978 g004
Figure 5. Standard adsorption enthalpy versus entropy for nitrogen (a) and hydrogen (b) adsorption in several zeolites.
Molecules 23 02978 g005
Table 1. Thermodynamic data for nitrogen adsorbed on several zeolites. Error limits for ΔH0 and ΔS0 are ±2 kJ mol−1 and ±10 J mol−1 K−1, respectively.
Zeolite−ΔH0 (kJ mol−1)−ΔS0 b (J mol−1 K−1)Ref
H-MCM-5613106[32]
H-MCM-2214.5107[32]
H-Y15.7123[30]
H-FER19.1133[30,31]
H-ZSM-519.7127[30]
Na-Y19.7143This work
Sr-Y29150This work
Ca-Y33.5151This work
b Referred to a standard state at 1 mbar. Within the perfect gas approximation, ΔS0 changes by an amount of +57 J mol−1 K−1 when referred to a standard state at 1 bar.

