
A Label-Free Fluorescent DNA Calculator Based on Gold Nanoparticles for Sensitive Detection of ATP

Abstract
1. Introduction
2. Results and Discussion
2.1. Establishment of AND DNA Calculator
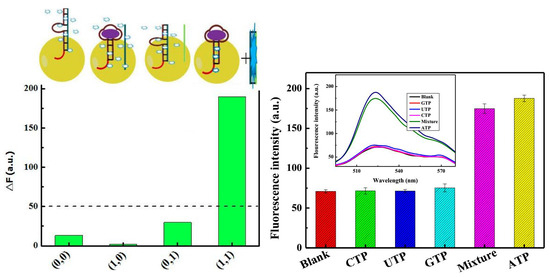
2.2. Assay Feasibility
2.3. Assay Linearity and Sensitivity
2.4. Assay Selectivity
2.5. Determination of ATP Concentration in Real Urine Samples
3. Materials and Methods
3.1. Materials and Reagents
3.2. Apparatus
3.3. ATP Detection in Real Samples
4. Conclusions
Author Contributions
Funding
Conflicts of Interest
References
- Aw, T.Y.; Jones, D.P. Atp concentration gradients in cytosol of liver cells during hypoxia. Am. J. Physiol. 1985, 249, C385–C392. [Google Scholar] [CrossRef] [PubMed]
- Agardh, C.D.; Folbergrova, J.; Siesjo, B.K. Cerebral metabolic changes in profound, insulin-induced hypoglycemia, and in the recovery period following glucose administration. J. Neurochem. 1978, 31, 1135–1142. [Google Scholar] [CrossRef] [PubMed]
- Katsura, K.; Folbergrova, J.; Bengtsson, F.; Kristian, T.; Gido, G.; Siesjo, B.K. Recovery of mitochondrial and plasma membrane function following hypoglycemic coma: Coupling of ATP synthesis, K+ transport, and changes in extra- and intracellular pH. J. Cereb. Blood Flow Metab. 1993, 13, 820–826. [Google Scholar] [CrossRef] [PubMed]
- Xiao, L.; Sun, S.; Pei, Z.; Pei, Y.; Pang, Y.; Xu, Y. A Ga3+ self-assembled fluorescent probe for ATP imaging in vivo. Biosens. Bioelectron. 2015, 65, 166–170. [Google Scholar] [CrossRef] [PubMed]
- Zhou, F.; Li, B.; Ma, J. A linear DNA probe as an alternative to a molecular beacon for improving the sensitivity of a homogenous fluorescence biosensing platform for DNA detection using target-primed rolling circle amplification. RSC Adv. 2015, 5, 4019–4025. [Google Scholar] [CrossRef]
- Chen, H.G.; Ren, W.; Jia, J.; Feng, J.; Gao, Z.F.; Li, N.B.; Luo, H.Q. Fluorometric detection of mutant DNA oligonucleotide based on toehold strand displacement-driving target recycling strategy and exonuclease III-assisted suppression. Biosens. Bioelectron. 2016, 77, 40–45. [Google Scholar] [CrossRef] [PubMed]
- Wang, X.P.; Yin, B.C.; Wang, P.; Ye, B.C. Highly sensitive detection of micrornas based on isothermal exponential amplification-assisted generation of catalytic g-quadruplex dnazyme. Biosens. Bioelectron. 2013, 42, 131–135. [Google Scholar] [CrossRef] [PubMed]
- Huang, J.; Su, X.; Li, Z. Enzyme-free and amplified fluorescence DNA detection using bimolecular beacons. Anal. Chem. 2012, 84, 5939–5943. [Google Scholar] [CrossRef] [PubMed]
- Zhang, D.Y.; Winfree, E. Control of DNA strand displacement kinetics using toehold exchange. J. Am. Chem. Soc. 2009, 131, 17303–17314. [Google Scholar] [CrossRef] [PubMed]
- Liu, X.; Yang, Y.; Hua, X.; Feng, X.; Su, S.; Huang, Y.; Fan, Q.; Wang, L.; Huang, W. An improved turn-on aptasensor for thrombin detection using split aptamer fragments and graphene oxide. Chin. J. Chem. 2015, 33, 981–986. [Google Scholar] [CrossRef]
- Lv, H.; Li, S.; Liu, Y.; Wang, G.; Li, X.; Lu, Y.; Wang, J. A reversible fluorescent inhibit logic gate for determination of silver and iodide based on the use of graphene oxide and a silver–selective probe DNA. Microchim. Acta 2015, 182, 2513–2520. [Google Scholar] [CrossRef]
- Li, F.; Hu, X.; Wang, F.; Zheng, B.; Du, J.; Xiao, D. A fluorescent “on-off-on” probe for sensitive detection of ATP based on ATP displacing DNA from nanoceria. Talanta 2018, 179, 285–291. [Google Scholar] [CrossRef] [PubMed]
- Jin, Y.; Li, H.; Bai, J. Homogeneous selecting of a quadruplex-binding ligand-based gold nanoparticle fluorescence resonance energy transfer assay. Anal. Chem. 2009, 81, 5709–5715. [Google Scholar] [CrossRef] [PubMed]
- Yin, B.C.; Zuo, P.; Huo, H.; Zhong, X.; Ye, B.C. Dnazyme self-assembled gold nanoparticles for determination of metal ions using fluorescence anisotropy assay. Anal. Biochem. 2010, 401, 47–52. [Google Scholar] [CrossRef] [PubMed]
- Kang, B.H.; Gao, Z.F.; Li, N.; Shi, Y.; Li, N.B.; Luo, H.Q. Thiazole orange as a fluorescent probe: Label-free and selective detection of silver ions based on the structural change of i-motif DNA at neutral ph. Talanta 2016, 156–157, 141–146. [Google Scholar] [CrossRef] [PubMed]
- Lv, Z.; Liu, J.; Zhou, Y.; Guan, Z.; Yang, S.; Li, C.; Chen, A. Highly sensitive fluorescent detection of small molecules, ions, and proteins using a universal label-free aptasensor. Chem. Commun. 2013, 49, 5465–5467. [Google Scholar] [CrossRef] [PubMed]
- Dragan, A.I.; Casas-Finet, J.R.; Bishop, E.S.; Strouse, R.J.; Schenerman, M.A.; Geddes, C.D. Characterization of picogreen interaction with dsdna and the origin of its fluorescence enhancement upon binding. Biophys. J. 2010, 99, 3010–3019. [Google Scholar] [CrossRef] [PubMed]
- Pu, W.; Zhao, H.; Huang, C.; Wu, L.; Xua, D. Fluorescent detection of silver(i) and cysteine using sybr green i and a silver(i)-specific oligonucleotide. Microchim. Acta 2012, 177, 137–144. [Google Scholar] [CrossRef]
- Braich, R.S.; Chelyapov, N.; Johnson, C.; Rothemund, P.W.K.; Adleman, L. Solution of a 20-variable 3-sat problem on a DNA computer. Science 2002, 296, 499–502. [Google Scholar] [CrossRef] [PubMed]
- Benenson, Y.; Paz-Elizur, T.; Adar, R.; Keinan, E.; Livneh, Z.; Shapiro, E. Programmable and autonomous computing machine made of biomolecules. Nature 2001, 414, 430–434. [Google Scholar] [CrossRef] [PubMed]
- Li, J.; Huang, Y.Q.; Qin, W.S.; Liu, X.F.; Huang, W. An optical-logic system based on cationic conjugated polymer/DNA/intercalating dyes assembly for label-free detection of conformational conversion of DNA i-motif structure. Polym. Chem. 2011, 2, 1341. [Google Scholar] [CrossRef]
- Zhao, Y.; Zhang, Q.; Wang, W.; Jin, Y. Input-dependent induction of g-quadruplex formation for detection of lead (ii) by fluorescent ion logic gate. Biosens. Bioelectron. 2013, 43, 231–236. [Google Scholar] [CrossRef] [PubMed]
- Shi, F.; Li, Y.; Lin, Z.; Ma, D.; Su, X. A novel fluorescent probe for adenosine 5′-triphosphate detection based on Zn2+-modulated l-cysteine capped cdte quantum dots. Sens. Actuators B Chem. 2015, 220, 433–440. [Google Scholar] [CrossRef]
- Tang, J.L.; Li, C.Y.; Li, Y.F.; Zou, C.X. A ratiometric fluorescent probe with unexpected high selectivity for ATP and its application in cell imaging. Chem. Commun. 2014, 50, 15411–15414. [Google Scholar] [CrossRef] [PubMed]
- Lee, J.D.; Cang, J.; Chen, Y.C.; Chen, W.Y.; Ou, C.M.; Chang, H.T. Detection of adenosine 5′-triphosphate by fluorescence variation of oligonucleotide-templated silver nanoclusters. Biosens. Bioelectron. 2014, 58, 266–271. [Google Scholar] [CrossRef] [PubMed]
- Lu, L.; Qian, Y.; Wang, L.; Ma, K.; Zhang, Y. Metal-enhanced fluorescence-based core-shell Ag@SiO2 nanoflares for affinity biosensing via target-induced structure switching of aptamer. ACS Appl. Mater. Interfaces 2014, 6, 1944–1950. [Google Scholar] [CrossRef] [PubMed]
- Zhu, Y.; Hu, X.C.; Shi, S.; Gao, R.R.; Huang, H.L.; Zhu, Y.Y.; Lv, X.Y.; Yao, T.M. Ultrasensitive and universal fluorescent aptasensor for the detection of biomolecules (ATP, adenosine and thrombin) based on DNA/Ag nanoclusters fluorescence light-up system. Biosens. Bioelectron. 2016, 79, 205–212. [Google Scholar] [CrossRef] [PubMed]
- Li, P.H.; Lin, J.Y.; Chen, C.T.; Ciou, W.R.; Chan, P.H.; Luo, L.; Hsu, H.Y.; Diau, E.W.; Chen, Y.C. Using gold nanoclusters as selective luminescent probes for phosphate-containing metabolites. Anal. Chem. 2012, 84, 5484–5488. [Google Scholar] [CrossRef] [PubMed]
- Zhan, Z.; Cai, J.; Wang, Q.; Su, Y.; Zhang, L.; Lv, Y. Green synthesis of fluorescence carbon nanoparticles from yum and application in sensitive and selective detection of ATP. Luminescence 2016, 31, 626–632. [Google Scholar] [CrossRef] [PubMed]
- Yu, C.J.; Wu, S.M.; Tseng, W.L. Magnetite nanoparticle-induced fluorescence quenching of adenosine triphosphate-bodipy conjugates: Application to adenosine triphosphate and pyrophosphate sensing. Anal. Chem. 2013, 85, 8559–8565. [Google Scholar] [CrossRef] [PubMed]
Sample Availability: Samples of the compounds ATP, GNP, and PicoGreen fluorescence dye are available from the authors. |


| Methods | LOD | Linear Range | Correlation Coefficient (R2) | Reference |
|---|---|---|---|---|
| Graphene-Based Aptamer Logic Gates | 2.07 μmol/L | 5–50 µmol/L | 0.997 | 23 |
| Naphthalimide-rhodamine Compound (NR) probe | 100 nmol/L | 0.1–10 µmol/L | N/A | 24 |
| Oligonucleotide-templated Silver Nanoclusters | 33 nmol/L | 0.1–10 µmol/L | 0.98 | 25 |
| Core-Shell Ag@SiO2 Nanoflares | 8 μmol/L | 0–0.5 mmol/L | N/A | 26 |
| DNA/Ag Nanoclusters | 91.6 nmol/L | 0.5–8.0 μmol/L | 0.99 | 27 |
| Gold Nanoclusters | 43 μmol/L | 50–100 µmol/L | 0.9908 | 28 |
| Carbon nanoparticles-Fe3+ | 0.48 μmol/L | 0.5–50 µmol/L | 0.99733 | 29 |
| ATP Displace Adsorbed DNA from Nanoceria | 54 pmol/L | 0.1 nmol/L–1.5 µmol/L | 0.996 | 12 |
| Magnetite Nanoparticle | 30 nmol/L | 100–1000 nmol/L | 0.9950 | 30 |
| GNP | 46.5 nmol/L | 50–500 nmol/L | 0.99391 | This work |
| Samples | ATP | Proposed | Method | ||
|---|---|---|---|---|---|
| Added | Found | Recovery | SD (n = 3) | RSD (n = 3) | |
| (nmol/L) | (nmol/L) | (%) | (nmol/L) | (%) | |
| Urine-1 | 100.00 | 99.9749 97.0575 98.1570 | 98.4 | 1.2 | 1.2 |
| Urine-2 | 300.00 | 295.1230 305.9749 311.0817 | 101.4 | 6.65 | 2.7 |
| Urine-3 | 500.00 | 513.4384 492.3729 481.5200 | 99.2 | 13.2 | 2.6 |
| Serum-1 | 100.00 | 110.8895 98.1786 101.8063 | 103.6 | 5.3 | 5.2 |
| Serum-2 | 300.00 | 299.0586 301.0191 303.8109 | 101.3 | 4.1 | 1.3 |
| Serum-3 | 500.00 | 506.5864 498.6701 502.3293 | 101.2 | 5.6 | 1.1 |
| Oligonucleotide | Sequence |
|---|---|
| DNA-T | 5′-CGC GCG ACC TGG GGG AGT ATT GCG GAG GAA GGT-3′ |
| DNA-M | 5′-ACC TTC CTC CCC AGG T-3′ |
| DNA-M′ | 5′-ACC TGG GGA GGA AGG T-3′ |
| Name | Components |
|---|---|
| a-curve | 1800 µL buffer, 30 µL PicoGreen, 90 µL DNA-T + DNA-M dsDNA, 10 µL GNP, 200 µL of 10 µM ATP |
| b-curve | 1800 µL buffer, 30 µL PicoGreen, 90 µL DNA-T + DNA-M dsDNA and 10 µL GNP |
| c-curve | 1800 µL buffer, 30 µL PicoGreen, 90 µL DNA-T + DNA-M dsDNA and 10 µL GNP, 100 µL DNA-M′ |
| d-curve | 1800 µL buffer, 30 µL PicoGreen, 90 µL DNA-T + DNA-M dsDNA and 10 µL GNP, 100 µL DNA-M′, 200 µL of 10 µM ATP |
| Name | Components | |
|---|---|---|
| Figure 2A | (a) | 1800 µL buffer, 30 µL PicoGreen, 90 µL DNA-T + DNA-M dsDNA |
| (b) | 200 µL of 10 µM ATP | |
| Figure 2B | (a) | 1800 µL buffer, 30 µL PicoGreen, 90 µL DNA-T + DNA-M dsDNA |
| (b) | 10 µL GNP | |
| Figure 2C | 1800 µL buffer, 30 µL PicoGreen, 90 µL DNA-T + DNA-M dsDNA, 10 µL GNP, 200 µL of 10 µM ATP | |
| Figure 2D | (a) | 1800 µL buffer, 30 µL PicoGreen, 90 µL DNA-T + DNA-M dsDNA, 10 µL GNP |
| (b) | 100 µL DNA-M′ | |
| Figure 2E | (a) | 1800 µL buffer, 30 µL PicoGreen, 90 µL DNA-T + DNA-M dsDNA, 10 µL GNP, 200 µL of 10 µM ATP |
| (b) | 100 µL DNA-M′ | |
© 2018 by the authors. Licensee MDPI, Basel, Switzerland. This article is an open access article distributed under the terms and conditions of the Creative Commons Attribution (CC BY) license (http://creativecommons.org/licenses/by/4.0/).
Share and Cite
Zhang, J.; Zhang, S.; Niu, C.; Liu, C.; Du, J.; Chen, Y. A Label-Free Fluorescent DNA Calculator Based on Gold Nanoparticles for Sensitive Detection of ATP. Molecules 2018, 23, 2494. https://doi.org/10.3390/molecules23102494
Zhang J, Zhang S, Niu C, Liu C, Du J, Chen Y. A Label-Free Fluorescent DNA Calculator Based on Gold Nanoparticles for Sensitive Detection of ATP. Molecules. 2018; 23(10):2494. https://doi.org/10.3390/molecules23102494
Chicago/Turabian StyleZhang, Jingjing, Shizhi Zhang, Chaoqun Niu, Chen Liu, Jie Du, and Yong Chen. 2018. "A Label-Free Fluorescent DNA Calculator Based on Gold Nanoparticles for Sensitive Detection of ATP" Molecules 23, no. 10: 2494. https://doi.org/10.3390/molecules23102494
APA StyleZhang, J., Zhang, S., Niu, C., Liu, C., Du, J., & Chen, Y. (2018). A Label-Free Fluorescent DNA Calculator Based on Gold Nanoparticles for Sensitive Detection of ATP. Molecules, 23(10), 2494. https://doi.org/10.3390/molecules23102494