Article

Dibasic Derivatives of Phenylcarbamic Acid against Mycobacterial Strains: Old Drugs and New Tricks?

1
Department of Pharmaceutical Chemistry, Faculty of Pharmacy, Comenius University in Bratislava, Odbojárov 10, SK-832 32 Bratislava, Slovakia
2
Department of Chemical Drugs, Faculty of Pharmacy, University of Veterinary and Pharmaceutical Sciences in Brno, Palackého 1946/1, CZ-612 42 Brno, Czech Republic
3
Clinic for Tuberculosis and Lung Diseases, National Institute for Tuberculosis, Lung Diseases and Thoracic Surgery, Vyšné Hágy, SK-059 84 Vysoké Tatry, Slovakia
4
Department of Public Health, Faculty of Health, Catholic University in Ružomberok, Hrabovská cesta 1A, SK-034 01 Ružomberok, Slovakia
5
Clinic for Department of Infectious Diseases and Microbiology, Faculty of Veterinary Medicine, University of Veterinary and Pharmaceutical Sciences, Palackého 1946/1, CZ-612 42 Brno, Czech Republic
6
Laboratory for Mycobacterial Diagnostics and Tuberculosis, Regional Institute of Public Health, Partyzánské náměstí 7, CZ-702 00 Ostrava, Czech Republic
7
Department of Pharmaceutical Analysis and Nuclear Pharmacy, Faculty of Pharmacy, Comenius University in Bratislava, Odbojárov 10, SK-832 32 Bratislava, Slovakia
8
Toxicological and Antidoping Center, Faculty of Pharmacy, Comenius University in Bratislava, Odbojárov 10, SK-832 32 Bratislava, Slovakia
9
Global Change Research Institute CAS, Belidla 986/4a, CZ-603 00 Brno, Czech Republic
*
Author to whom correspondence should be addressed.
Molecules 2018, 23(10), 2493; https://doi.org/10.3390/molecules23102493
Submission received: 5 September 2018 / Revised: 21 September 2018 / Accepted: 24 September 2018 / Published: 28 September 2018
(This article belongs to the Special Issue Heterocycles in Medicinal Chemistry)

Abstract

:
In order to provide a more detailed view on the structure–antimycobacterial activity relationship (SAR) of phenylcarbamic acid derivatives containing two centers of protonation, 1-[2-[({[2-/3-(alkoxy)phenyl]amino}carbonyl)oxy]-3-(dipropylammonio)propyl]pyrrolidinium oxalates (1ad)/dichlorides (1eh) as well as 1-[2-[({[2-/3-(alkoxy)phenyl]amino}carbonyl)oxy]-3-(di-propylammonio)propyl]azepanium oxalates (1il)/dichlorides (1mp; alkoxy = butoxy to heptyloxy) were physicochemically characterized by estimation of their surface tension (γ; Traube’s stalagmometric method), electronic features (log ε; UV/Vis spectrophotometry) and lipophilic properties (log kw; isocratic RP-HPLC) as well. The experimental log kw dataset was studied together with computational logarithms of partition coefficients (log P) generated by various methods based mainly on atomic or combined atomic and fragmental principles. Similarities and differences between the experimental and in silico lipophilicity descriptors were analyzed by unscaled principal component analysis (PCA). The in vitro activity of compounds 1ap was inspected against Mycobacterium tuberculosis CNCTC My 331/88 (identical with H37Rv and ATCC 2794, respectively), M. tuberculosis H37Ra ATCC 25177, M. kansasii CNCTC My 235/80 (identical with ATCC 12478), the M. kansasii 6509/96 clinical isolate, M. kansasii DSM 44162, M. avium CNCTC My 330/80 (identical with ATCC 25291), M. smegmatis ATCC 700084 and M. marinum CAMP 5644, respectively. In vitro susceptibility of the mycobacteria to reference drugs isoniazid, ethambutol, ofloxacin or ciprofloxacin was tested as well. A very unique aspect of the research was that many compounds from the set 1ap were highly efficient almost against all tested mycobacteria. The most promising derivatives showed MIC values varied from 1.9 μM to 8 μM, which were lower compared to those of used standards, especially if concerning ability to fight M. tuberculosis H37Ra ATCC 25177, M. kansasii DSM 44162 or M. avium CNCTC My 330/80. Current in vitro biological assays and systematic SAR studies based on PCA approach as well as fitting procedures, which were supported by relevant statistical descriptors, proved that the compounds 1ap represented a very promising molecular framework for development of ‘non-traditional’ but effective antimycobacterial agents.

Graphical Abstract

1. Introduction

The treatment of commonly encountered species of tuberculous and non-tuberculous mycobacteria responsible for a multiplicity of different types of infections, including pulmonary, respiratory, cutaneous, and systemic infections, by (i) brand new classes of promising compounds preferably acting on novel targets; or (ii) ‘non-typical’ antimycobacterial drug candidates is still in very dynamic and progressive debate [1,2,3,4,5,6]. The strategy was successfully used in a case of in vitro screening of some β-lactam antibiotics (ceftaroline or ceftazidime) in a combination with an β-lactamase inhibitor avibactam against Mycobacterium avium complex [3,4]. Another encouraged example was in vitro and ex vivo testing of tricyclic thioridazine (Figure 1a), an old neuroleptic phenothiazine. The molecule was used alone or in a combinatorial therapy with anti-tuberculosis drugs (isoniazid, rifampin, linezolid or moxifloxacin) against M. tuberculosis regardless of its antibiotic resistance phenotype and was highly active due to its multi mechanisms of action [5,6].
Antimycobacterial properties of compounds originally designed and tested as local anesthetics (LAs) have been investigated sporadically. Moreover, their application to management of the infections caused by a broad spectrum of species of the Mycobacterium genus has not been systematically reviewed. Nevertheless, Schmidt and Rosenkranz [7] as well as Fujii et al. [8] found that lidocaine (xylocaine; Figure 1b), a highly efficient LA drug [9,10], notably inhibited in vitro growth of some strains of human M. tuberculosis, M. bovis or M. kansasii. Similarly, a quinoline core-containing dibucaine (cinchocaine; Figure 1c) [11], was able to effectively in vitro fight rapidly growing M. phlei [12].
A common structural feature of given efficient LAs (and promising antimycobacterials) was presence of a lipophilic moiety, polar anilido or amido group, connecting hydrocarbon chain and salt-forming fragment. All considered moieties were color-differentiated for a molecule of dibucaine (cinchocaine; Figure 1c).
Sequencing of Mycobacterium spp. genomes proved that these microorganisms produced a variety of enzymes [13,14,15] able to hydrolyze ester, anilide or amide bonds in a chemical structure of antimycobacterial drug candidates. Isosteric replacement of these polar groups with a carbamate moiety would provide very good proteolytic stability, especially if the modified structural arrangement of novel derivatives would be as follows: Aryl–NH–C(O)O–Alkyl [16]. The carbamate functionality imposes a degree of conformational restriction due to delocalization of non-bonded electrons on nitrogen into a carboxyl moiety. Participation of the carbamate group in hydrogen bonding through carboxyl and backbone N–H [17] should be also taken into account. Considering the importance of the carbamate functionality, its incorporation into a structure of novel antimycobacterial agents was one of key tasks in a process of their design and synthesis [18,19,20].
Currently evaluated 1-[2-[({[2-/3-(alkoxy)phenyl]amino}carbonyl)oxy]-3-(dipropylammonio)-propyl]pyrrolidinium/azepanium oxalates/dichlorides (1ap; alkoxy = butoxy to heptyloxy; Table 1, Scheme 1) were synthesized with intention to find effective LAs with favorable toxicity profiles [21]. The compounds contained two types of an anionic counterpart (1ad and 1il versus 1eh and 1mp; Table 1) in order to achieve convenient aqueous solubility in biological assays [21].
It was found that all tested derivatives showed higher indices defining their relative surface (Us) as well as infiltration (Ui) local anesthetic efficiency than reference LA drugs cocaine (Us = 1.0, Ui = 3.6) or procaine (Us = 0.1, Ui = 1.0) [21]. The most effective dibasic molecule in given types of local anesthesia was 1-[2-[({[3-(pentyloxy)phenyl]amino}carbonyl)oxy]-3-(dipropylammonio)propyl]-pyrrolidinium dichloride (1f) with Us = 130 and Ui = 250 (Table S1 in Supplementary Materials), respectively.
It might be expected that the carbamate moiety was sterically protected due to branching of both connecting hydrocarbon chain and salt-forming group. Rotatable bonds of the 2-/3-alkoxy side chain R could also contribute to the steric hindrance (Table 1). It was proved by ab initio procedures that an intramolecular hydrogen bond between N–H of the carbamate functionality and oxygen atom of the 2-alkoxy chain was formed [22]. Such structural arrangements of compounds would provide stability against effects of various mycobacterial enzymes and would consider them promising candidates for antimycobacterial agents.
It was observed that surface tension (relative surface activity), electronic and lipophilic properties of carbamate group-containing molecules notably influenced the in vitro antimycobacterial efficiency [23,24,25]. However, the set 1ap has not been satisfactorily characterized by values of relevant physicochemical descriptors [26] (Table S1).
In a first part of this study, attention was turned on more precise physicochemical characterization of the derivatives 1ap. The research aimed determination of compounds’ ability to decrease surface tension of water (γ), estimation of electronic properties described by logarithms of molar absorption coefficients (log ε) of their methanolic solutions, which were investigated in the UV/Vis region of an electromagnetic spectrum, as well as evaluation of lipophilic features defined by calculated log kw parameters. These log kw were based on extrapolation procedures of estimated logarithms of retention factors (log k) to elution with 100% water by reversed-phase high-performance liquid chromatography (RP-HPLC). In addition, relationships between the log kw dataset and calculated logarithms of partition coefficients (log P) related to the octan-1-ol/water partitioning system were explored in order to provide a critical view on possibilities to predict lipophilic properties of the compounds based on two-dimensional (2D) visualization of their chemical structures.
Next, a very essential objective of the research was in vitro screening of the derivatives 1ap against various strains of tuberculous and non-tuberculous mycobacteria, i.e., M. tuberculosis CNCTC My 331/88, M. tuberculosis H37Ra ATCC 25177, M. kansasii CNCTC My 235/80, a M. kansasii 6509/96 clinical isolate, M. kansasii DSM 44162, M. avium CNCTC My 330/80, M. smegmatis ATCC 700084 and M. marinum CAMP 5644, respectively.
A key aim of the study was to find some structural and physicochemical features of the compounds 1ap, which might appear to be notable for their in vitro antimycobacterial efficiency.

2. Results and Discussion
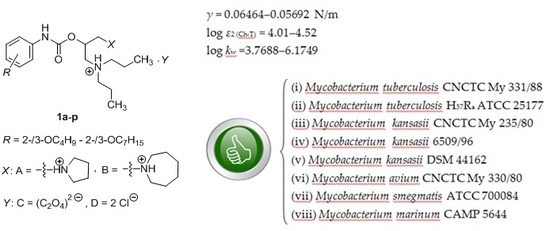
2.1. Synthesis of the Compounds 1ap

The investigated compounds 1ap were prepared by multi step pathways using 2-aminophenol (1′a) and 3-aminophenol (1′b), respectively, as starting molecules (Scheme 1). Very briefly, a reaction of 1′a or 1′b with acetanhydride led to N-(2-/3-hydroxyphenyl)ethanamide (2′a or 2′b). A solution of 2′a or 2′b in anhydrous ethanol (EtOH) was added to sodium ethanoate. After mixing, 1-bromoalkane (alkane = butane to heptane) was added in order to prepare a series of N-(2-/3-alk-oxyphenyl)ethanamides (3′ah; alkoxy = butoxy to heptyloxy). The molecules 3′ah were suspended in 18% hydrochloric acid and heated up to reflux. The solutions were cooled, neutralized and crude intermediates were extracted into diethyl ether (DEE). The organic layer was dried, filtered and solutions were removed in vacuo giving 2-/3-alkoxyanilines (4′ah; alkoxy = butoxy to heptyloxy) [27]. Reulting intermediates 4′ah were dissolved in anhydrous toluene and added continuously into a saturated solution of phosgene [27]. The mixed solutions were refluxed, toluene was removed in vacuo providing desired 1-alkoxy-2-/3-isocyanatobenzenes (5′ah).
Into an aqueous solution of N-propylpropanamine (6′), a (±)-2-(chloromethyl)oxirane reagent was added and solution was allowed to stand at room temperature (r.t.; 48h). The mixture was heated up to 75 °C and treated with 38% sodium hydroxide. The cooled solution was filtered and a crude intermediate was formed. Extraction of the filtrate with DEE, drying and removal of the organic layer provided additional amount of the intermediate [28], which isolation and crystallization from absolute EtOH led to (±)-N-(oxiran-2-ylmethyl)-N-propylpropanamine (7′).
The addition of pyrrolidine or azepane to 7′ in anhydrous propan-2-ol (2-PrOH) provided 1-(dipropylamino)-3-pyrrolidin-1-ylpropan-2-ol (8′a) or 1-azepan-1-yl-3-(dipropylamino)-propan-2-ol (8′b) [29].
Oily 1-(1-azacycloalkyl)-3-(dipropylamino)propan-2-yl (2-/3-alkoxyphenyl)carbamates (9′ap; azacycloalkyl = pyrrolidinyl or azepanyl) were prepared by a reaction of 1-alkoxy-2-/3-isocyanato-benzenes 5′ah with a dibasic alcohol 8′a or 8′b in anhydrous toluene.
Addition of a saturated solution of oxalic acid in anhydrous EtOH or ethereal hydrogen chloride to the bases 9′ap dissolved in chloroform led to solid colorless 1-[2-[({[2-/3-(alkoxy)phenyl]- amino}carbonyl)oxy]-3-(dipropylammonio)propyl]pyrrolidinium oxalates (1ad)/dichlorides (1eh) and 1-[2-[({[2-/3-(alkoxy)phenyl]amino}carbonyl)oxy]-3-(dipropylammonio)propyl]azepanium oxalates (1il)/dichlorides (1mp; Scheme 1, Table 1) as well. More detailed procedures describing syntheses of particular intermediates and final molecules were provided in Supplementary Materials.
Chemical structure of the compounds 9′ap and 1ap was previously verified by their infrared (IR) spectra, which confirmed presence of all key groups. In addition, elemental analyses results (% C, H, N) were within ±0.40% of theoretical values for both bases 9′ap and salts 1ap [21]. Melting points (m.p.s), Rf values (TLC) and acid-base pKa1 and pKa2 parameters of 1ap were already published [21,26] and can be found in Table S1.
Current liquid chromatography high resolution mass spectroscopy (HPLC-HR-MS) analyses, which were performed on the LC Agilent Infinity System coupled with the Quadrupole Time-Of-Flight Mass Spectrometer (6520 Accurate Mass Q-TOF LC/MS), confirmed structural identity of the intermediates 9′ap (Supplementary Materials).
After re-crystallization from a mixture of acetone/ethanol (subgroups 1ad, 1eh and 1mp) or acetone (1il), high-resolution mass spectra (HR-MS) of these salts were measured by the Dionex UltiMate 3000 High-Performance Liquid Chromatograph coupled with the LTQ Orbitrap XL Hybrid Ion Trap-Orbitrap Fourier Transform Mass Spectrometer equipped with a HESI II (heated electrospray ionization) source in a positive (1ad, 1il) or negative (1eh, 1mp) mode. The analyses confirmed structural identity of given molecules.

2.2. Determination and Prediction of Some Physicochemical Properties of the Compounds 1ap

2.2.1. Surface Tension

Surface tension (relative surface activity; γ) of aqueous solutions of the compounds 1ap (c = 2.0 × 10⁻³ M) was determined by a drop count technique [30,31] using a Traube stalagmometer. All evaluated substances were able to decrease surface tension of water (γ = 0.07259 N/m) at 21 °C.
Elongation of the 2-/3-alkoxy side chain R led to more surface-active derivatives within homological sets 1ad, 1eh, 1il and 1mp. This behavior was also in agreement with conclusions of a research paper [32]. The 2-alkoxy substituted molecules 1ad and 1il showed lower ability to reduce surface tension of water than their 3-alkoxy substituted isomers 1eh or 1mp (Table 1, Figure 2).
Relationships between the number of carbon atoms forming the chain R (nc) and γ values (in N/m units) was inspected using a linear function, polynomial function of 2nd order and sigmoidal fitting, respectively.
Equations related to the most relevant functions and values of common statistical descriptors, namely, number of points (number of cases; n), degrees of freedom (DF), reduced chi-square (χ,2red), residual sum of squares (RSS), correlation coefficient (R), adjusted coefficient of determination (Adj. R2), root mean squared error (standard deviation; RMSE), norm of residuals (NR), Fisher’s significance ratio (Fisher’s F-test; F) and probability of obtaining the F Ratio (significance of a whole model; Prob > F), respectively, can be found in Table S2.
Indication of a significance level of the F Ratio was as follows: one star symbol (*) for statistically significant, two stars symbol (**) for statistically very significant or three stars symbol (***) for statistically extremely significant level was used. The regression equations and their statistical characteristics were calculated and visualized by the Origin Pro ver. 9.0.0 SR2 software (OriginLab Corporation, Northampton, MA, USA).
The relationships between nc and γ were described most precisely by statistically significant (1ad, 1il and 1mp) or very significant (1eh) models built on polynomial functions of 2nd order (Figure 2, Equations (S1–S4) in Table S2).
The derivatives containing an azepanium moiety (1il, 1mp) showed slightly higher ability to decrease surface tension of water than their positional isomers with a pyrrolidinium salt-forming group (1ad, 1eh). The most surface active were 1-[2-[({[3-(heptyloxy)phenyl]amino}carbonyl)-oxy]-3-(dipropylammonio)propyl]azepanium dichloride (1p) with γ = 0.05692 N/m and 1-[2-[({[3-(heptyloxy)phenyl]amino}carbonyl)oxy]-3-(dipropylammonio)propyl]pyrrolidinium dichloride (1h), which showed γ = 0.05786 N/m (Table 1, Figure 2).
Very similar behaviors to present findings were observed when Čižmárik with co-workers [33,34] analyzed structurally similar compounds JC-01al, effective LAs [33], which contained only one centrum of basicity (Figure 3). All given molecules showed ability to decrease surface tension of water and 3-alkoxy substituted derivatives JC-01gl (alkoxy = propoxy to octyloxy) were more efficient surfactants than their 2-alkoxy positional isomers JC-01af. Relationships between nc (nc = 3–8) and γ (in N/m units) of these alkoxy positional isomers were described very satisfactorily by polynomial functions of 2nd order [34].
Concerning presently analyzed dichlorides 1mp, branching of their connecting chain and presence of a dipropylammonium moiety resulted in the γ values (Table 1), which were slightly lower in comparison to those of JC-01hk [34].

2.2.2. Electronic Properties

Electronic properties of the molecules 1ap (Table 1) were characterized by logarithms of molar absorption coefficients (log ε) of their methanolic solutions (c = 8.0 × 10⁻⁵ M) investigated in the UV/Vis region of an electromagnetic spectrum.
The solutions showed three absorption maxima in a near ultraviolet (quarz) region of this spectrum between 200 nm and 400 nm [35], namely, λ1 = 208–210 nm, λ2 (Ch-T) = 236–238 nm and λ3 = 278–280 nm (Table 1), respectively. Positions of these absorption bands in the spectrum were typical for derivatives of (substituted) phenylcarbamic acid and the bands were assigned as first local excitation (λ3), charge-transfer (λ2 (Ch-T)) and second local excitation (λ1) absorption maxima, respectively [36]. The λ1 and λ2 (Ch-T) maxima of 2-alkoxy substituted compounds 1ad and 1il were slightly lower compared to those of their 3-alkoxy substituted positional isomers 1eh and 1mp (Table 1), respectively. Chemical structures of analyzed derivatives 1ad and 1il indicated that steric inability of both carbamoyloxy and alkoxy groups to achieve coplanarity inhibited ‘proper’ resonance.
The log ε2 (Ch-T) parameters of compounds 1ap, which were observed at λ2 (Ch-T), varied from 4.01 (1o) to 4.52 (1c). The methanolic solutions of 1ah were characterized by higher log ε2 (Ch-T) values than those of 1ip and ranged from 4.05 (1b) to 4.52 (1c; Table 1), excluding the molecules 1j (4.22) and 1l (4.14). In addition, there was found nor linear neither quasi-parabolic relationship between number of carbon atoms forming the side chain R (nc) and log ε2 (Ch-T) values (Figure S1 in Supplementary Materials).
In next sections of the paper, which are aimed at relationships between structure and in vitro activity, special consideration is devoted to the log ε2 (Ch-T) values because they could be the most sensitive to differences in electronic environment of a phenylcarbamoyloxy moiety due to different position and length of a substituent R [36].

2.2.3. Lipohydrophilic Properties

Lipophilicity has been the physicochemical parameter of notable importance in QSAR and SAR studies as a predominant descriptor encoding information on a network of inter- and intramolecular forces affecting drug transport via lipophilic compartments as well as drug’s interactions with target effector sites [37,38].
A classical shake-flask method for a partitioning measurement of a compound in the octan-1-ol/buffer (or water) system, thus estimation of its log Pexp value, is quite time-consuming, it requires the solute to be pure and with adequate solubility in an aqueous phase. Insolubility often means that highly lipophilic compounds may not be determined accurately [39]. Concerning these issues very seriously, RP-HPLC was rather applied to estimate lipophilic properties of the molecules 1ap than the shake-flask alternative.
Octadecyl-functionalized silica gel was currently used as a stationary phase (SPh) and a gradient of two solvents at different volume ratios modified retention properties of the SPh [39,40]. Liquid binary mixtures of methanol (MeOH) with water were employed as mobile phases (MPhs) in the isocratic RP-HPLC. The MeOH modifier was preferred because of similarity of both observed and extrapolated lipophilicity parameters with the ones determined in the octan-1-ol/water partition system, considering also sensitivity to H-bond donor properties of investigated compounds [41].
The modifier was applied in different volume concentrations, which varied from 85% to 100% (v/v) with 5% increments. This interval was chosen due to very high lipophilicity of investigated salts. Practically, lower volume concentration of MeOH, i.e., less than 85% (v/v) in used MPhs, caused uncertainty of retention times (tr) due to notable peaks broadening, especially within subsets 1il and 1mp. In addition, their tr values were considerably prolonged with increase in water content (v/v) of the MPhs so it was no longer possible to determine tr values in such MPhs. Taking the 85–100% volume concentrations range, the isocratic separation was feasible and reasonable retention of the compounds 1ap was observed in all MPhs. The highest tr parameters were found for the molecules 1k (tr = 47.108 min) and 1l (tr = 70.012 min) in the MPh containing 85% proportion (v/v) of MeOH (Table 2).
In addition, purity (in percentages) of the compounds 1ap was verified by RP-HPLC. Areas of their peaks were measured using the MPh, which contained 90% proportion (v/v) of MeOH. The purity of given salts varied from 96.82% (1j) to 99.65% (1m; Table S3).
Estimated retention factor (capacity factor; k) values were found in an area from 0.5063 (1e) to 2.5096 (1l) if pure MeOH was used as the MPh, and from 3.6174 (1e) to 30.4159 (1l) if the 80:20 MeOH/water (v/v) MPh was applied (Table S3).
Regarding a group of oxalates (Scheme 1), a pyrrolidium moiety-containing derivatives 1ad showed lower log k values in all used MPhs than those with an azepanium fragment 1il. Same trends were observed for dichlorides, i.e., the compounds 1eh showed lower log k outputs compared to those of a series 1mp.
Elongation of the R substituent (Table 1) led to increase in tr as well as log k values within all evaluated subgroups 1ad, 1eh, 1il and 1mp (Table 2). Increase in a volume concentration (v/v) of MeOH caused shortening of both tr and log k for all analyzed compounds 1ap (Table 2).
El Tayar et al. [42,43] investigated lipophilic properties of protonated basic compounds, which were therapeutically used as psychoactive agents, and inspected relationships between their log k values and volume concentrations (v/v) of MeOH. They found that these relationships were notably influenced by nature of solutes. The models were preferably built on linear functions and MeOH exerted its own solvophobic effect in the MPhs, which contained more than 80% (v/v) of given organic modifier if focusing on analyses of neutral and non-ionic compounds.
For partially and completely ionized polar compounds, the relationships appeared to be nearly parabolic but the parts of parabolic curves, which corresponded to MeOH-rich eluents (80% or higher volume concentration (v/v) of MeOH) were regarded as linear [42,43].
Paschke et al. [44] analyzed a series of highly lipophilic tetrachlorobenzyltoluene isomers by isocratic RP-HPLC and found linear relationships (R > 0.9995) between their log k values and volume concentrations of MeOH, which varied from 80% to 100% (v/v).
On the other hand, observed log k data could not be used in terms of a universal scale to express lipophilicity of compounds because the log k values were dependent on chromatographic conditions, i.e., they depended on both MPhs and SPhs. Extrapolation of estimated solute retention (log k) to elution with 100% water (calculation of log kw) would definitely be much more precise approach than using of log k, because the kw parameters were independent of any effect of the organic modifier and relied on the SPh alone [45]. It has been recognized that the log kw descriptor was very efficient for anticipation of in vitro antimycobacterial properties of compounds [46,47,48,49].
According to the authors’ opinions based on systematic scientific literature survey, a current research paper was the first, which aimed the log kw parameters of 2-/3-alkoxyphenylcarbamic acid derivatives containing two centers of protonation. The log kw values were extrapolated from intercepts of a relationship between log k and volume fraction of the MPh modifier (ϕM) using the Snyder–Soczewiński linear solvent strength model [50,51,52]. The relationship was justified by R > 0.9900, Adj. R2 > 0.9750 as well as F > 180.00 for calculation of particular log kw parameters (Table 3).
Goodness of fit for all proposed models generating log kw, in other words, quantity used to test whether any given data were well described by a suggested function, was adjusted by χ2red values, which varied from 0.0002 (1c) to 0.0045 (1o). As can be seen, the linear relationships minimized RSS values, as variabilities about regression lines, which ranged from 0.0007 (1c) to 0.0134 (1o). The linearity was also proved by calculated RMSE parameters, as standard deviations of the data about regression lines, which were found in an interval from 0.0152 (1c) to 0.0668 (1o; Table 3).
The extrapolated log kw values of compounds 1ap (Table 3) were in accordance with their elution order and hydrophobicity and varied from 3.7688 (1a) to 6.1749 (1p). Assuming presence of an identical azacycloalkyl moiety, oxalates (1ad, 1il) were less lipophilic than corresponding positional isomers synthesized as dichlorides (1eh, 1mp; Table 3). As expected, 1-[2-[({[3-(hept-yloxy)phenyl]amino}carbonyl)oxy]-3-(dipropylammonio)propyl]azepanium oxalate (1l) and 1-[2-[({[3-(heptyloxy)phenyl]amino}carbonyl)oxy]-3-(dipropylammonio)propyl]azepanium dichloride (1p; Table 1) were found to be the most lipophilic showing log kw of 5.8966 (1l) and 6.1749 (1p; Table 3), respectively.
Increase in nc (Table 1) led to higher log kw values in all inspected subgroups 1ad, 1eh, 1il and 1mp. These relationships were defined by statistically significant (1eh, 1il), very significant (1ad) and extremely significant (1mp) linear functions and values of relevant statistical descriptors (Equations (S5)–(S8) in Table S4).
The S index (Table 3) in RP-HPLC has been a function of molecular structure parameters. For sets of non-polar homologues, linear relationships between their S and number of carbon atoms in a hydrocarbon side chain was found. Increase in size and van der Waals volume of a solute led to increased S parameter as well [53].
Results of present analyses agreed with given conclusions. Increase in length of the side chain R led to higher S within all inspected homological subgroups. The compounds containing an azepanium moiety showed higher S parameters, which varied from 4.3102 (1i) to 6.2672 (1p), than those with a pyrrolidium group, i.e., from 3.7768 (1a) to 5.6830 (1h; Table 3), if same position and length of R was presumed.
The slope S values of linear regression functions used to obtain log kw were connected with specific hydrophobic surface areas of compounds and could serve as indicative measure of uniformity of retention mechanisms. If the uniformity was observed, a convenient model between the slope(s) and intercept(s), i.e., log kw values, was anticipated [40]. Statistically extremely significant relationship between the log kw and S values of 1ap was found and described by Equation (1):
S = 0.9449 (±0.0823) × log kw + 0.2755 (±0.4087)
n = 16, DF = 14, χ,2red = 0.0470, RSS = 0.6586, R = 0.9508, Adj. R2 = 0.8971,
RMSE = 0.2169, NR = 0.8115, F = 131.75, Prob > F = 0.0001 ***
Based on values of statistical descriptors provided above, the uniformity of a retention mechanism was proven and suitability of chosen MPhs was confirmed for lipophilicity evaluation of the derivatives 1ap.
Statistical analyses indicated that both position and length of the side chain R (Equations (S9) and (S10) in Table S5) were more important factors, which contributed to the uniformity of retention behavior, compared to nature (and physicochemical properties) of a salt-forming fragment (Equations (S11) and (S12) in Table S5) of inspected compounds, despite the fact that all partial models built on linear regression analyses were statistically extremely significant.
To provide better understanding and give a critical review of relationships between the experimental lipophilicity measures and in silico prediction of lipophilic properties, the log kw dataset was studied together with computational logarithms of partition coefficients (log P).
Practical estimation of log Pexp for some molecules from the set 1ap by a shake-flask method was not possible due to their insolubility in phosphate buffer systems (pH = 7.30). Thus, the lack of enough reliable log Pexp values would be a very limiting factor for eventual investigation of the relationships between log Pexp and in silico log P. On the other hand, linear models between log kw and log Pexp were already observed [39], so interchangeability of these descriptors was fully justified.
The log P parameters of non-protonated forms of analyzed compounds, i.e., 9′ap (Scheme 1, Table 4), were calculated for the octan-1-ol/water partitioning system. These values were generated by the ChemBioDraw Ultra 12.0 software package (CambridgeSoft, Cambridge, MA, USA), various Java and non-Java interactive applets as well.
The Ghose and Crippen′s log PCr [54,55], Viswanadhan′s log PV [56], Broto’s log PB [57] and Leo’s CLOGP 4.0 [58] atomic and atomic/fragmental-based approaches were chosen to calculate the log p values (Table 4) by the ChemBioDraw Ultra 12.0 software, respectively. The Virtual Computer Chemistry Laboratory [59], a freely available web-based tool working in Java environment, was used to calculate log P by the Wang’s XLOGP 2.0 [60], Cheng’s XLOGP 3.0 [61], Moriguchi’s MLOGP [62], Sander’s (Actelion’s) ACLOGP [63], Molinspiration’s miLogP 2.2 [64], ALOGP [65] and Tetko’s ALOGPs 2.1 [66] method (Table 4 and Table 5), respectively. All these methods integrated algorithms combining atomic and fragmental principles, except for ALOGPs 2.1, which considered a molecule in the whole [66].
Finally, the SILICOS-IT hybrid method, which used proprietary fragment- and property-based principles, was also employed to generate log P parameters (log PS-IT; Table 5). The method was implemented in the SwissADME applet, a free web tool designed to evaluate pharmacokinetics and drug-likeness of small molecules [67].
A common issue connected with given in silico approaches [26] was that they did not allow to correctly predict log p values of particular salts 1ap. This was the reason why current research targeted on the calculations related to non-protonated bases 9′ap.
The compounds 9′ip showed higher log P than their positional isomers 9′ah, which contained a different salt-forming moiety. Almost all used predictor tools indicated the molecules 9′ap highly lipophilic with log p > 4.27 (Table 4 and Table 5), excluding the MLOGP method. The calculations based on MLOGP indicated moderate or high lipophilicity of these substances, which log P were found in a range from 2.75 (9′a and 9′e) to 3.76 (9′l and 9′p; Table 5).
The CLOGP 4.0 predicted the highest lipophilic nature of the bases 9′ap and their log P varied from 6.23 (9′a and 9′e) to 8.94 (9′l and 9′p; Table 4). As might be assumed, all employed atomic and atomic/fragmental methods did not consider a position of the side chain R when generating log P (Table 4 and Table 5). Only the whole-molecule ALOGPs 2.1 approach took into account this aspect, so the 2-alkoxy substituted compounds 9′ad and 9′il were less lipophilic than their 3-alkoxy substituted positional isomers 9′eh and 9′mp (Table 5), respectively.
It was found that linear relationships between the extrapolated log kw values of compounds 1ap (Table 3) and particular in silico log P parameters of non-protonated derivatives 9′ap, namely, log PCr, log PV, log PB, CLOGP 4.0, XLOGP 2.0, XLOGP 3.0, MLOGP, ACLOGP, miLogP 2.2, ALOGP, log PS-IT and ALOGPs 2.1 (Table 4 and Table 5), respectively, were statistically extremely significant (Prob > F = 0.0001) and were defined by R > 0.9300, Adj. R2 > 0.8650, F > 99.00 and other common statistical descriptors (Equations (S13)–(S24) in Table S6).
In an effort to characterize these relationships more precisely, similarities and differences between given descriptors were analyzed by using unscaled principal component analysis (PCA), a powerful multivariate statistical technique, that analyzed a set of values, in which observations were described by several inter-correlated quantitative dependent variables. A set of new orthogonal variables, called principal components (PCs), and pattern of similarity of observations was a result the analysis [68].
Current PCAs were performed by the Origin Pro ver. 9.0.0 SR2 software. Number of concerned PCs was determined by visual evaluation of a scree plot, as a relationship between calculated eigenvalues (λe) and number of PCs. The λe descriptor measured amount of variation retained by each PC [68]. The first two PCs, i.e., Principal Component 1 (PC 1) and Principal Component 2 (PC 2), of the analysis accounted for 99.26% of the total variance in the data. It meant that other PCs might be ignored without losing any substantial information. The PCs did not prove existence of ‘real’ parameters, they only indicated that existence of these descriptors was mathematically possible within the set of analyzed values.
A relationship between PC 1 and PC 2 resulted in division of examined compounds into characteristic groups. Differences in lipophilic properties of the bases 9′ap were reflected in their PC 1 values. One group, defined by negative PC 1 values, included derivatives containing a pyrrolidin-1-yl moiety (9′ac, 9′eg) as well as molecules with both azepan-1-yl fragment and butoxy side chain (9′i, 9′m). Conversely, second group, which was characterized by positive PC 1 values, encompassed compounds containing an azepan-1-yl moiety (9′jl, 9′np) as well as derivatives with both sterically smaller azacycloalkyl ring and heptyloxy substituent (9′d, 9′h). The most negative PC 1 value was generated for the least lipophilic derivative 9′a, which salt 1a showed the lowest experimental lipophilicity (log kw = 3.7688). The most positive PC 1 output was registered for the most lipophilic compound 9′p, a base of the most lipophilic salt 1p (log kw = 6.1749; Figure 4).
It was found that PC 2 took into consideration a type of an azacycloalkyl moiety as well as position and length of R. The derivatives 9′ah showed higher PC 2 than the compounds 9′ip. Higher PC 2 were assigned to the 3-alkoxy substituted molecules compared to their 2-alkoxy positional isomers, when assuming their identical salt-forming moiety.
Increase in nc of the side chain R led to higher PC 1 as well as PC 2. There were found no compounds (points), which could be regarded as outliers to the remaining ones along PC 1 or PC 2 (Figure 4).
The PCA-based 2D biplot showed both PC scores (PC 1, PC 2) of evaluated compounds (green dots) and loadings of variables indicated as orange straight lines [68]. The lines characterizing log kw, log PI-IT, XLOGP 2.0, XLOGP 3.0 and ACLOGP variables were located on upper right side of this biplot. The line related to log kw formed the smallest angles with those of log PI-IT, XLOGP 2.0 or XLOGP 3.0, which meant that these descriptors correlated each other most positively. Conversely, the largest angle was observed between the lines connected with log kw and CLOGP 4.0, so these variables were unlikely to correlate each other (Figure 4).
The PC 1 was influenced almost equally by loadings of all inspected variables, as indicated particular scores on top axis. The scores varied from 0.27 (log kw) to 0.28 (log PCr, log PV, log PB, miLogP 2.2 and ALOGP, respectively). The most positive impact on PC 2 showed a loading of the log kw and log PI-IT variable, which scored approximately 0.45 and 0.37, respectively, on right axis. Conversely, the strongest inverse relationship was found between PC 2 and loading of the CLOGP 4.0 variable (−0.28; Figure 4).
Following visualization, the in silico log PI-IT, XLOGP 2.0 and XLOGP 3.0 descriptors might be used to characterize lipophilic properties of analyzed salts and bases, especially if they contained highly lipophilic side chain R. Those molecules were defined by positive values of both PC 1 and PC 2. In addition, very close grouping was observed for 9′l with 9′p (Figure 4).
Considering observed physicochemical characteristics of the compounds 1ap, there was found statistically extremely significant linear relationship between the γ and log kw values. This dependence was expressed by Equation (2) and values of relevant statistical descriptors as follows:
γ = −0.0031 (±0.0003) × log kw + 0.0765 (±0.0015)
n = 16, DF = 14, χ,2red = 6.436 × 10⁻⁷, RSS = 9.010 × 10⁻⁶, R = 0.9383, Adj. R2 = 0.8718,
RMSE = 8.022 × 10⁻⁴, NR = 0.0030, F = 103.02, Prob > F = 0.0001 ***
Linearity of this model was adjusted by relatively very low χ2red, RSS and RMSE values. The γ and log kw parameters of 1ip showed the most positive impact to final statistical analysis data (Equation (S28) in Table S7) connected with Equation (2) compared to those of a subset 1ah (Equation (S27) in Table S7).
One of the major tasks to consider in drug design is the ability of a compound to cross biological membranes. The blood–brain barrier (BBB) is a critical biological structure for maintaining homeostasis of central nervous system and preventing damage to the brain. Compounds primarily designed as neuroactive agents are required to cross the BBB to provide their therapeutic effect. Conversely, molecules that target other compartments of a body ideally should not cross this barrier to avoid possible psychotropic side effects. Thus, the task of predicting the BBB permeability of new compounds is of great importance [69].
Norinder and Haeberlein [70] suggested some simple rules to preliminary answer a question whether a drug candidate would be able to cross the BBB. Very briefly, if a sum of nitrogen and oxygen atoms (nN + nO) in a molecule was ≤ 5 or if [CLOGP − (nN + nO)] > 0 then the compound would have a good chance to enter the brain by passive diffusion. The originally employed CLOGP was a lipophilicity descriptor generated in silico. In addition, molecular weight (MW) of such compound should be ≤ 450 to facilitate brain permeation [71].
Each of the oxalates 1ad and 1il contained (nN + nO) = 10, each of the chlorides 1eh and 1mp contained (nN + nO) = 6 (Table 1), respectively. If presently calculated CLOGP 4.0 parameter would be replaced with log PS-IT (Table 5), which was closer to a ‘real’ log kw lipophilicity descriptor (Figure 4), only basic forms of the most lipophilic compounds 1l and 1p, i.e., the substances 9′l and 9′p, might be considered to possess very limited brain permeation. On the other hand, calculated MW > 450 for these derivatives [21] indicated that they might not be able to passively cross the BBB.

2.3. In Vitro Antimycobacterial Assays

The in vitro activity of compounds 1ap was inspected against Mycobacterium tuberculosis CNCTC My 331/88 (identical with H37Rv and ATCC 2794, respectively; abbreviation used: MTv H37Rv), M. tuberculosis H37Ra ATCC 25177 (MTa H37Ra), M. kansasii CNCTC My 235/80 (identical with ATCC 12478; MK 235/80), a M. kansasii 6509/96 clinical isolate (MK 6509/96), M. kansasii DSM 44162 (MK DSM), M. avium CNCTC My 330/80 (identical with ATCC 25291; MA 330/80), M. smegmatis ATCC 700084 (MS) and M. marinum CAMP 5644 (MM), respectively, by the methods described earlier [20,72,73,74,75]. In vitro susceptibitity of given mycobacteria to reference drugs isoniazid (INH), ethambutol (EMB), ofloxacin (OFLX) or ciprofloxacin (CPX) was tested as well (Table 6 and Table 7).
A value of a minimum inhibitory concentration (MIC) was the lowest concentration of a tested compound, (i) which inhibited growth of MTv H37Rv, MK 235/80, MK 6509/96 and MA 330/80, respectively; (ii) at which no visible growth of MTa H37Ra, MS, MK DSM as well as MM was observed [20,72,73,74,75].
The in vitro screening procedures related to particular mycobacterial strains were repeated three times and the MIC values, reported in Table 6 and Table 7 (in μM units), were average values of these determinations.
A very unique aspect of a present research was that many compounds from the set 1ap were in vitro efficient against almost all tested mycobacteria. The most promising molecules with observed MIC ≤ 8 μM were indicated in gray (Table 6 and Table 7).
The 3-alkoxy substituted derivatives 1eh and 1mp were slightly more effective against all screened strains than their 2-alkoxy substituted isomers 1ad and 1il, respectively. 1-[2-[({[3-(Heptyloxy)phenyl]amino}carbonyl)oxy]-3-(dipropylammonio)propyl]azepanium dichloride (1p) was the most active against almost complete spectrum of tested microorganisms (MIC ≤ 8 μM), excluding MA 330/80 only. Comparable efficiency to 1p was observed for 1-[2-[({[3-(heptyl-oxy)phenyl]amino}carbonyl)oxy]-3-(dipropylammonio)propyl]pyrrolidinium dichloride (1h), which also showed MIC ≤ 8 μM against almost all tested mycobacteria, excluding MA 330/80 as well as MS. In addition, antimycobacterial activity of 1-[2-[({[3-(pentyloxy)phenyl]amino}carbonyl)oxy]-3-(di-propylammonio)propyl]azepanium dichloride (1n) and 1-[2-[({[3-(hexyloxy)phenyl]amino}-carbonyl)oxy]-3-(dipropylammonio)propyl]azepanium dichloride (1o), respectively, was only slightly lower compared to activity of the substances 1p and 1h (Table 6 and Table 7).
It was found that MTv H37Rv was not so sensitive to the compounds 1ap as to INH (MIC = 0.5 μM and 1 μM). The most promising substances 1d, 1h, 1l, 1n or 1p showed MIC = 4 μM and 8 μM (Table 6), respectively.
Similar trends were observed when evaluating susceptibility of MK 235/80. The molecules 1h, 1n and 1p showed MIC = 8 μM, however, the OFLX reference drug was more active (MIC = 0.5 μM and 1 μM; Table 6). Comparable ability to fight MK 6509/96 was found for the derivative 1h, series 1np (MIC = 4 μM and 8 μM) and INH (MIC = 2–8 μM; Table 6), respectively.
All 3-alkoxy substituted molecules 1eh and 1mp were more active against MTa H37Ra (MIC = 3.7–8.1 μM) than INH (MIC = 36.5 μM) or CPX (MIC = 48.3 μM). The dibasic compounds were also able to fight MK DSM more effectively, their MIC values ranged from 1.9 μM (1h) to 16.2 μM (1e), than INH (MIC = 29.2 μM; Table 6). Moreover, the derivatives 1g, 1h and 1np were almost equally efficient against MA 330/80 as EMB (MIC = 16 μM; Table 7).
If attention was paid to the 2-alkoxy substituted compounds 1ad and 1il, 1-[2-[({[2-(heptyl-oxy)phenyl]amino}carbonyl)oxy]-3-(dipropylammonio)propyl]pyrrolidinium dichloride (1d) was more active against both MTa H37Ra (MIC = 12.5 μM) and MK DSM (MIC = 6.2 μM) than INH (Table 6).
Waisser et al. [76] in vitro tested two series of structurally similar molecules JC-01al (Figure 3) and JC-02al (Figure 5) against MTv H37Rv, MK 235/80, MK 6509/96 and MA 330/80, respectively. The authors found that the compounds with an azepanium group were antimycobacterially more promising agents than the ones containing a pyrrolidinium heterocycle.
Current in vitro assays revealed that both branching of a connecting hydrocarbon chain and presence of ‘an additional’ dipropylammonium group within a salt-forming part of tested compounds 1ap were favorable for their antimycobacterial activity and they were more effective than the sets JC-01al and JC-02al.
The INH standard was less effective against MS (MIC = 117 μM) as well as MM (MIC = 467 μM) than almost all screened phenylcarbamic acid-based substances, exluding the derivatives 1a, 1i, 1k or 1l (Table 7). 1-[2-[({[2-(Pentyloxy)phenyl]amino}carbonyl)oxy]-3-(dipropylammonio)propyl]-azepanium oxalate (1j) was the most active against MS (MIC = 6.2 μM), the molecule 1h fight MM most efficiently (MIC < 3.7 μM). On the other hand, these strains were sensitive to lower MICs of CPX (MIC = 0.4 μM and 0.8 μM; Table 7). It should be also mentioned that both sets JC-01al (Figure 3) and JC-02al (Figure 5) have not been in vitro tested against MTa H37Ra, MK DSM, MS or MM.
The chemometric PCA tool was applied to study activity–activity relationships of the compounds 1ap to explore similarities or differences in their impact on particular mycobacterial strains. The analysis was carried out by the XLSTAT ver. 2016.02.28451 software (Addinsoft, New York, NY, USA), a statistical application for Microsoft Excel ver. 2013 (Microsoft Corp., Redmont, WA, USA). Number of PCs was determined using visual evaluation of a scree plot, as a relationship between calculated λe and number of PCs. A present selection of PCs was based on a Kaiser–Guttman rule, as the most common stopping rule in PCA [77], which aimed an average value of λe > 1.0. The first two interpreted PCs of the analysis (with λe > 1.0) accounted for 89.59% of the total variance in the data as follows: 77.22% (PC 1) and 12.37% (PC 2), respectively.
The quality of 2D representation of a variable was visualized by a distance between the projected variable onto a plane and circle of correlation. The loadings of variables were indicated as variously colored vectors, connected with particular mycobacterial strains, and numbered according to their position in the circle of radius 1 in an absolute value (Figure 6). In more detail, the digit 1 was assigned to the vector built on the log (1/MIC [M]) values, which were connected with 14-d in vitro testing of the compounds 1ap against MTv H37Rv (MTv H37Rv, 14-d). Analogously, numbering of other vectors was as follows: 2 (MTv H37Rv, 21-d), 3 (MK 235/80, 7-d), 4 (MA 330/80, 14-d), 5 (MK 235/80, 21-d), 6 (MK 235/80, 14-d), 7 (MK 6509/96, 14-d), 8 (MK 6509/96, 7-d), 9 (MA 330/80, 21-d), 10 (MK 6509/96, 21-d), 11 (MTa H37Ra, 7-d), 12 (MM, 21-d), 13 (MK DSM, 7-d) and 14 (MS, 3-d), respectively.
A position of the variable in mapping could be defined by values of square cosines (cos2), which estimated quality of representation. The sum of cos2 for variables on PCs is equal to one. The higher cos2, the more perfect representation of a variable by chosen PCs [68]. The highest sum of cos2 on PC 1 and PC 2 was found for the vector 1 (MTv H37Rv, 14-d). This vector was characterized by cos2 = 0.961 (Table S8) indicating its almost exclusive representation by both PC 1 and PC 2. In addition, its position was the closest to a circle of correlation (Figure 6) compared to positions of the vectors 2–14. The cos2 values on particular PCs related to concerned vectors are listed in Table S8.
The vectors 1–3 were defined by PC 1 > 0.75 and PC 2 > 0.25, the vectors 4–10 were described by PC 1 > 0.75 and PC 2, which could be found in an interval from 0.25 to -0.25. Furthermore, PC 1 > 0.75 together with PC 2 between −0.35 and −0.53 were used to characterize the vectors 11–13. Finally, the vector 14 was described by PC 1 < 0.75 and PC 2 < −0.50 (Figure 6), respectively.
Visual assessment indicated the smallest angles between the vectors 5–10. A relatively sharp angle was also observed between 1 and 2 as well as 12 and 13, respectively. Conversely, there was found ‘almost orthogonal’ arrangement of the vectors 1 and 14. Regarding this visualization, it could be assumed that the compounds 1ap showed (i) similar mechanisms of action against MK 235/80, MK 6509/96 and MA 330/80, respectively; (ii) different mechanisms of action against MTv H37Rv and MS.

2.4. Structure–Activity Relationships

As suggested in previous sections of the paper, surface tension (relative surface activity γ; in N/m units), electronic (log ε2 (Ch-T)) and lipophilic (log kw) properties of the compounds 1ap might notably affect their in vitro efficiency (in log (1/MIC [M]) units) against tested mycobacterial strains. The PCA approach was applied for preliminary SAR studies of these derivatives by the XLSTAT ver. 2016.02.28451 software. Number of PCs was determined using visual evaluation of a scree plot, as a relationship between calculated λe and number of PCs. The first three PCs of the analysis with λe > 1.0 [77] accounted for 90.01% of the total variance in the data as follows: 69.59% (PC 1), 14.35% (PC 2) and 6.07% (PC 3), respectively.
The 2D visualization of relationships between the vectors describing physicochemical parameters and in vitro antimycobacterial activities of the compounds 1ap on axes (i) PC 1 and PC 2 (Figure S2), as well as (ii) PC 1 and PC 3 (Figure S3) revealed the closest connection between lipophilicity (log kw; vector A) and efficiency against MTv H37Rv (14-d; 1). In addition, there were found notably negatively correlated variables (vectors), which were positioned on opposed quadrants of the loading plots (Figures S2 and S3). These correlations aimed γ (C) versus log kw (A) or C versus the vectors built on in vitro activity against MTv H37Rv (14-d; 1), MTv H37Rv (21-d; 2), MA 330/80 (14-d; 3) as well as MK 235/80 (7-d; 4). It seemed that ‘almost orthogonal’ arrangement of the vector characterizing log ε2 (Ch-T) (B) to those of antimycobacterial activities (5–14; Figure S3) indicated no correlation.
A linear, quasi-parabolic (polynomial function of 2nd order) and sigmoidal function, respectively, was also employed in order to investigate SAR in more detailed manner. The research focused on relationships between the independent variables (γ, log ε2 (Ch-T), log kw) and dependent variable(s), i.e., biological values (in log (1/MIC [M]) units).
Resulting equations and values of common statistical descriptors, namely, n, DF, χ,2red, RSS, R, Adj. R2, RMSE, NR, F and Prob > F, respectively, were calculated by using the Origin Pro ver. 9.0.0 SR2 software. In addition, only statistically significant (Prob > F values varied from 0.0100 to <0.0500; one-star indication), very significant (Prob > F from 0.0010 to <0.0100; two stars indication) or extremely significant (Prob > F from 0.0000 to <0.0010; three stars indication) relationships between the independent and dependent variables were presented in next paragraphs. These models were also characterized by R ≥ 0.9000, Adj. R2 ≥ 0.7750 and F ≥ 25.00, respectively.
Respecting given criteria, the following discussion considered relationships connected with MTv H37Rv, MK 235/80, MK 6509/96, MK DSM, MA 330/80 and MS as well. Conversely, there were found no statistically significant, very significant neither extremely significant models related to MTa H37Ra or MM. It should be also noted that suggested models meeting those requirements were connected mostly with the subgroups containing a limited number of compounds (n = 8). However, it was not possible to perform the specific PCA for such subsets due to this restriction, i.e., number of effective observations was lower (n = 8) than number of examined variables (n = 17). This was a reason why next sections were focused mainly on linear, quasi-parabolic or sigmoidal fitting procedures and their statistical descriptions.

2.4.1. Models Related to Mycobacterium tuberculosis CNCTC My 331/88

Notable linear relationships between the γ or log kw parameters and log (1/MIC [M]) values based on both 14-d and 21-d in vitro screenings against MTv H37Rv were observed for the series 1ah. These models were defined by Equations (3)–(6) and found to be statistically very significant or extremely significant. Decrease in γ and increase in log kw of these derivatives led to their more promising antitubercular profile.
MTv H37Rv (14-d)/1ah: log (1/MIC [M]) = –120.2060 (±12.9578) × γ + 12.3509 (±0.8027)
n = 8, DF = 6, χ,2red = 0.0058, RSS = 0.0347, R = 0.9669, Adj. R2 = 0.9240,
RMSE = 0.0761, NR = 0.1863, F = 86.06, Prob > F = 0.0001 ***
MTv H37Rv (14-d)/1ah: log (1/MIC [M]) = 0.4301 (±0.0737) × log kw + 2.9438 (±0.3393)
n = 8, DF = 6, χ,2red = 0.0133, RSS = 0.0798, R = 0.9220, Adj. R2 = 0.8251,
RMSE = 0.1153, NR = 0.2825, F = 34.03, Prob > F = 0.0011 **
MTv H37Rv (21-d)/1ah: log (1/MIC [M]) = –103.4692 (±18.7975) × γ + 11.1642 (±1.1644)
n = 8, DF = 6, χ,2red = 0.0122, RSS = 0.0730, R = 0.9136, Adj. R2 = 0.8072,
RMSE = 0.1103, NR = 0.2702, F = 30.30, Prob > F = 0.0015 **
MTv H37Rv (21-d)/1ah: log (1/MIC [M]) = 0.3957 (±0.0633) × log kw + 2.9505 (±0.2911)
n = 8, DF = 6, χ,2red = 0.0098, RSS = 0.0587, R = 0.9312, Adj. R2 = 0.8449,
RMSE = 0.0989, NR = 0.2424, F = 39.13, Prob > F = 0.0008 ***
It seemed that ability to decrease surface tension of water was slightly more important than increase in lipophilicity of inspected compounds 1ah with the intention to improve their antitubercular properties, especially when concerning 14-d in vitro biological evaluation.
It would not be reasonable to suggest some biparametric linear models containing γ, log kw and log (1/MIC [M]) parameters with an attempt to provide more satisfactory values of statistical descriptors related to the set 1ah. The reason not to apply bilinear reggresion analyses would be that statistically extremely significant relationships between γ and log kw (Equations (S25)–(S28) in Table S7) were already observed.
Current findings were only in partial agreement with a research of Čižmárik et al. [38,78,79], who studied derivatives of 2-/3-alkoxyphenylcarbamic acid (alkoxy = propoxy do decyloxy), which basic part was formed by only one azacycloalkyl moiety (pyrrolidinium or piperidinium). The authors employed a linear, quasi-parabolic and sigmoidal model, respectively, to provide comprehensive QSAR investigation. They found that simultaneous increase in lipophilicity and in vitro antitubercular activity of these molecules was quite limited [78,79]. In addition, this behavior was also observed when inspecting relationships between the in silico log p values (CLOGP 4.0) and in vitro efficiency of these monobasic compounds against non-tuberculous MK 235/80, MK 6509/96 and MA 330/80, respectively [38].
The antitubercular activities of derivatives 1ap might theoretically indicate that comparable efficiency of homologues containing a pyrrolidinium group would be observed, if length of their side chain R would be beyond a certain border, i.e., if R = 2-/3-OC8H17 or 2-/3-OC9H19.
A cell envelope of MTv H37Rv is composed of three major segments, namely, a plasma membrane, cell wall core and outermost layer. The cell wall core, which is essential for viability, consists of peptidoglycan (PG) in covalent attachment via phosphoryl-N-acetylglucosaminosyl-rhamnosyl linkage units with heteropolysaccharide arabinogalactan (AG). The AG is in turn esterified at its non-reducing ends to long-chain (C70–C90) mycolic acids. The latter form the bulk of the inner leaflet of the outer membrane, with the outer layer consisting of a variety of non-covalently attached (glyco)lipids, polysaccharides, lipoglycans, and proteins [80].
Results of present statistical analyses indicated that not only lipophilic nature of the compounds 1ap, possible interactions of their side chain R with some components of the cell wall or ability do decrease surface tension of water in order to ‘non-specifically’ disrupt the cell envelope could be decisive for their in vitro efficiency. In fact, suggested mechanisms of antitubercular action might become more relevant for the subgroup 1ah compared to 1ip.
A closer look at the relationships between inspected physichochemical and biological descriptors among particular positional isomers proved that there were calculated more convenient statistical values for the 2-alkoxy substituted compounds 1ad and 1il (Equations (S29)–(S32) in Table S9) compared to those of the 3-alkoxy substituted isomers 1eh and 1mp, respectively.

2.4.2. Models Related to the Mycobacterium kansasii Species

Statistically significant linear relationships between the log kw parameters and log (1/MIC [M]) values connected with in vitro testing of the series 1ah against MK 235/80 were found. The MIC values observed after 7-d and 14-d cultivation were the same (Table 6), so both proposed models were defined by Equation (7). More prospective anti-MK 235/80 compounds showed higher log kw values.
MK 235/80 (14-d)/1ah: log (1/MIC [M]) = 0.4395 (±0.0650) × log kw + 2.6388 (±0.2990)
n = 8, DF = 6, χ,2red = 0.0103, RSS = 0.0620, R = 0.9403, Adj. R2 = 0.8648,
RMSE = 0.1016, NR = 0.2489, F = 45.76, Prob > F = 0.0001 ***
Statistically extremely significant linear models between the log kw and log (1/MIC [M]) values resulting from 7-d and 21-d in vitro screening of the subgroup 1ah against MK 6509/96 were also set. The observed dependences were defined by Equations (8) and (9). Higher log kw values were related to more promising anti-MK 6509/96 agents.
MK 6509/96 (7-d)/1ah: log (1/MIC [M]) = 0.5072 (±0.0757) × log kw + 2.5914 (±0.3485)
n = 8, DF = 6, χ,2red = 0.0140, RSS = 0.0842, R = 0.9392, Adj. R2 = 0.8624,
RMSE = 0.1185, NR = 0.2901, F = 44.86, Prob > F = 0.0001 ***
MK 6509/96 (21-d)/1ah: log (1/MIC [M]) = 0.5061 (±0.0737) × log kw + 2.3356 (±0.3393)
n = 8, DF = 6, χ,2red = 0.0133, RSS = 0.0798, R = 0.9418, Adj. R2 = 0.8682,
RMSE = 0.1153, NR = 0.2825, F = 47.12, Prob > F = 0.0005 ***
Increase in lipophilicity of the derivatives 1ah was more important factor to positively influence their efficiency compared to surface properties. However, it could be assumed that constant increase in lipophilicity due to elongation of the side chain R would not led to more promising derivatives, as observed for a subgroup 1ip (Table 6).
Statistically very significant and extremely significant linear relationships between the γ or log kw and log (1/MIC [M]) descriptors were also found when concerning the molecules 1ah and their 7-d in vitro efficiency against MK DSM. The models were characterized by Equations (10) and (11), respectively.
Highly lipophilic compounds with ability to decrease surface tension of water more markedly showed higher potential to fight given mycobacterium. Conversely, increase in lipophilicity due to increase in number of carbons of the azacycloalkyl fragment (1ip) would not be a guaranty of improvement in anti-MK DSM activity (Table 6).
MK DSM (7-d)/1ah: log (1/MIC [M]) = –192.0357 (±33.5781) × γ + 16.8889 (±2.0800)
n = 8, DF = 6, χ,2red = 0.0388, RSS = 0.2330, R = 0.9192, Adj. R2 = 0.8192,
RMSE = 0.1971, NR = 0.4827, F = 32.71, Prob > F = 0.0012 **
MK DSM (7-d)/1ah: log (1/MIC [M]) = 0.7579 (±0.0817) × log kw + 1.5371 (±0.3758)
n = 8, DF = 6, χ,2red = 0.0163, RSS = 0.0979, R = 0.9670, Adj. R2 = 0.9240,
RMSE = 0.1277, NR = 0.3129, F = 86.15, Prob > F = 0.0001 ***

2.4.3. Models Related to Mycobacterium avium CNCTC My 330/80

Different models were suggested when exploring relationships between γ and log (1/MIC [M]) values resulting from 14-d and 21-d in vitro screening of the compounds 1ap against MA 330/80. Concerning well-known differences in their salt-forming fragment, a statistically very significant linear model was found for a subgroup 1ah (14-d) and defined by Equation (12).
MA 330/80 (14-d)/1ah: log (1/MIC [M]) = –150.5250 (±29.7405) × γ + 13.7803 (±1.8423)
n = 8, DF = 6, χ,2red = 0.0305, RSS = 0.1828, R = 0.9001, Adj. R2 = 0.7790,
RMSE = 0.1745, NR = 0.4275, F = 25.61, Prob > F = 0.0032 **
If a main criterion to consider was a position of compounds’ side chain R, a bilinear model between γ and log (1/MIC [M]) was regarded as the most convenient for two subsets 1eh and 1mp (Figure 7).
A bilinear model proposed by Kubinyi [81] was generally applicable and presented a smooth synthesis of both linear and non-linear parts of SAR as an effort to simulate a complex process in a rather simplistic way.
The compounds with γ varying from 0.05692 N/m (1p) to 0.06154 N/m (1n) showed a comparable capability to act against MA 330/80 (21-d). Further increase in γ, i.e., minor ability to decrease surface tension of water, resulted in sharp decrease in their antimycobacterial efficiency. The observed behavior could indicate a non-specific mechanism of action of these derivatives, which might be based on their ability to disrupt an outermost layer of a cell envelope of MA 330/80. The layer, which consists of diverse amphiphilic glycolipids, namely, mycosides C, glycolipids, peptidolipids, and phospholipids, respectively, hinders diffusion of chemotherapeutic agents via the wall thus causing multiple drug-resistance by exclusion [82].
Statistically very significant or extremely significant linear relationships between log kw and log (1/MIC [M]) resulting from 14-d and 21-d in vitro screening of the compounds 1ah were also observed. The suggested models were defined by Equations (13) and (14). As expected, higher log kw values were connected with more effective agents.
MA 330/80 (14-d)/1ah: log (1/MIC [M]) = 1.6968 (±0.3122) × log kw + 0.6051 (±0.0678)
n = 8, DF = 6, χ,2red = 0.0113, RSS = 0.0675, R = 0.9643, Adj. R2 = 0.9182,
RMSE = 0.1061, NR = 0.2599, F = 79.57, Prob > F = 0.0001 ***
MA 330/80 (21-d)/1ah: log (1/MIC [M]) = 1.8560 (±0.4695) × log kw + 0.5458 (±0.1020)
n = 8, DF = 6, χ,2red = 0.0255, RSS = 0.1528, R = 0.9092, Adj. R2 = 0.7978,
RMSE = 0.1596, NR = 0.3909, F = 28.62, Prob > F = 0.0081 **
Statistical characteristics given above might support a hypothesis, which was based on a non-specific mechanism of action of the molecules 1ah against MA 330/80. However, the model related to 21-d in vitro biological evaluation (Equation (14)) provided clearly worse values of the statistical descriptors than those connected with 14-d in vitro screening (Equation (13)).
If attention was turned to the 3-alkoxy substituted derivatives 1eh and 1mp, increase in their log kw up to approximately 5.1000 (Table 3) meant sharp increase in activity against MA 330/80 (21-d). Further increase in lipophilicity beyond this border was not reflected in higher antimycobacterial potential of the compounds 1n, 1h, 1o and 1p showing log kw of 5.2087, 5.5384, 5.6569 and 6.1749 (Table 3, Figure 8), respectively.

2.4.4. Models Related to Mycobacterium smegmatis ATCC 700084

There was observed a very significant quasi-parabolic relationship between the log ε2 (Ch-T) values and log (1/MIC [M]) parameters connected with 3-d in vitro evaluation of the pyrrolidium moiety-containing compounds 1ch against MS (Equation (S33) in Table S9). The possibility to exclude the molecules 1a and 1b from a current analysis was based on the observation that they showed the lowest efficiency against given mycobacterium (Table 7).
It was found that anti-MS activity increased with increasing log ε2 (Ch-T), reached a maximum if this independent variable was between 4.24 and 4.27 (1e, 1f and 1h) and then decreased with further increase in the log ε2 (Ch-T) values (Figure S4, Table 1). This behavior, defined as a cut-off effect, was originally reviewed and rationalized in number of mechanistic ways by Hansch and Clayton a few decades ago [83].
It was also found that lower γ and higher log kw did not lead to increase in anti-MS activity of the compounds 1ip, as explored by some models, which were not provided because of their statistical insignificance (Prob > F ≥ 0.0500).

3. Materials and Methods

3.1. General Information

Liquid chromatography high resolution mass spectroscopy (HPLC-HR-MS) analyses of the compounds 9′ap (Supplementary Materials) were performed on a chromatographic apparatus consisting of the LC Agilent Infinity System (Agilent Technologies, Santa Clara, CA, USA) equipped with a gradient pump (1290 Bin Pump VL), automatic injector (1260 HiPals), and column thermostat (1290 TCC). The LC system was coupled with the Quadrupole Time-Of-Flight mass spectrometer (6520 Accurate Mass Q-TOF LC/MS). Q-TOF was equipped with an electrospray ionization source operated in a positive and negative ionization mode as well.
For data acquisition and processing, a personal computer with the Mass Hunter software ver. MassHunter Workstation B 04.00 (Agilent Technologies) was used.
Each of the compounds 9′ap was dissolved in 50% (v/v) MeOH to reach a concentration of 1 mg/L. Particular solutions were filtered via 0.22 µm nylon syringe filter and 1.0 µL was used for the HPLC-HR-MS analyses at 35 °C using the RP-C18 column Zorbax Extend-C18, 2.1 × 50 mm, 1.7 µm (Agilent Technologies).
The mobile phases consisted of 0.1% aqueous solution of formic acid in demineralized water (mobile phase A) and acetonitrile (mobile phase B). Gradient elution was used with linear gradient from 5% to 95% of acetonitrile per 8 min. The flow rate of a mobile phase was set to 400 µL/min.
The MS spectrometer was operated in a positive and negative ionization mode, respectively, keeping particular specifications as follows: drying gas temperature 360 °C, drying gas flow 12 L/min, nebulizing gas pressure 60 psi, ESI source voltage 4000 V, fragmentor voltage 125 V, skimmer voltage 65 V and collision gas N2, respectively. The m/z ratios of both [M + H]+ and [M − H] ions were recorded in an interval from 50 m/z to 1500 m/z. Observed m/z values of the adducts were compared to the theoretical ones. The difference (in ppm units; Supplementary Materials) was calculated according to Equation (15):
Difference = [(m/z theoreticalm/z obtained)/m/z theoretical] × 106
High-resolution mass spectra of the compounds 1ap were measured using the Dionex UltiMate 3000 high-performance liquid chromatograph (Thermo Scientific, West Palm Beach, FL, USA) coupled with the LTQ Orbitrap XL Hybrid Ion Trap-Orbitrap Fourier Transform Mass Spectrometer (Thermo Scientific) equipped with a HESI II (heated electrospray ionization) source operating in a positive (1ad, 1il) or negative (1eh, 1mp) mode. The HPLC system was controlled through the Chromeleon Chromatography Data System ver. 7.2 (Thermo Scientific). The separation was performed on a C18-Hypersil Gold (3 µm, 50 mm × 2.1 mm) column (Thermo Scientific). A mobile phase consisted of water Purelab Classic (ELGA LabWater, High Wycombe, Bucks, UK) and acetonitrile hypergrade for LC-MS LiChrosolv (Merck KGaA, Darmstadt, Germany) in 80:20 volume ratio (v/v). Total flow rate was 0.3 mL/min, injection volume was 1 μL, and column temperature was set to 30 °C, respectively.
The UV/Vis spectra of methanolic solutions of analyzed compounds 1ap (c = 8.0 × 10⁻⁵ M) were observed on the 8452A Diode Array spectrophotometer HP-8452A (Hewlett-Packard, Palo Alto, CA, USA) at 21 °C. Methanol for UV-spectroscopy (Merck, Darmstadt, Germany) was used for preparation of these solutions. Results of the UV/Vis analyses were collected and stored digitally using the ChemStation controller software (Agilent Technologies, Waldbronn, Germany). The HP-8452A apparatus measured a complete range of compounds’ spectrum from 190 nm to 820 nm.
The HPLC separation module Waters e2695 equipped with a Waters 2996 PDA Detector (Waters Corp., Milford, MA, USA) and chromatographic column Symmetry C18 × 5 μm, 4.6 × 250 mm, Part No. W21751W016 (Waters Corp.) were used for estimation of lipophilic properties of the compounds 1ap at 21 °C.
The HPLC separation process was monitored by the Empower 3 Chromatography Data Software (Waters Corp.) working on a personal computer HP Compaq (Hewlett-Packard, Palo Alto, CA, USA) equipped with Intel® CoreTM i5 processor (Intel Corp., Santa Clara, CA, USA), 2400 CPU, 3.10 GHz, and 4.00 GB of RAM, respectively. The computer operated on the Windows 7 Professional system, a 64-bit version (Microsoft Corp., Redmont, WA, USA).
Isocratic elution was carried out using mobile phases consisting of methanol p.a. (MeOH; Honeywell, Paris, France) and purified water in various volume ratios (80:20, 85:15, 90:10, 95:5 (v/v) and pure MeOH, respectively). Distilled water (CentralChem, Bratislava, Slovak Republic) was purified by the Aquinity2 P10 ultra-pure water system for production of ultra-pure water with an integrated 10 L permeate tank (membraPure, Hennigsdorf, Germany).
Total flow of the column was 1.0 mL/min, injection volume was 4 μL and column temperature was set to 40 °C. The detection wavelengths varying from 236 nm to 238 nm were chosen for current experimental procedures.

3.2. Synthesis of Compounds

Presently analyzed 1-[2-[({[2-/3-(alkoxy)phenyl]amino}carbonyl)oxy]-3-(dipropylammonio)- propyl]pyrrolidinium oxalates (1ad)/dichlorides (1eh) as well as 1-[2-[({[2-/3-(alkoxy)phenyl]- amino}carbonyl)oxy]-3-(dipropylammonio)propyl]azepanium oxalates (1il)/dichlorides (1mp; alkoxy = butoxy to heptyloxy) were prepared by multi step pathways (Scheme 1) using 2-aminophenol (1a) and 3-aminophenol (1b), respectively, as starting compounds [21,27,28,29].
Procedures for preparation of reaction intermediates 2′a, 2′b, 3′ah, 4′ah, 5′ah, 7′, 8′a, 8′b, 9′ap and final molecules 1ap were originally published in research papers [21,27,28,29] and are provided in Supplementary Materials. In addition, HPLC-HR-MS spectral characterizations of the compounds 9′ap are included as well.
Spectral data (IR), elemental analyses results (% C, H, N), melting point (m.p.) values, Rf parameters (TLC) and acid-base dissociation constants (pKa1, pKa2), respectively, of solid colorless compounds 1ap can be found in the papers [21,26] and some of given characteristics are also listed in Supplementary Materials.
The molecules 1ap were re-crystallized from mixture of acetone/ethanol (1ad, 1eh, 1mp) or acetone (1il) before being spectrally, physicochemically and biologically investigated. Present HR-MS spectral description of these compounds was given below.
The compound 1a: HR-MS for C24H42N3O3 [M + H]+ calculated 420.32207 m/z, found 420.32343 m/z; 1b: HR-MS for C25H44N3O3 [M + H]+ calculated 434.33772 m/z, found 434.33920 m/z; 1c: HR-MS for C25H46N3O3 [M + H]+ calculated 448.35337 m/z, found 448.35471 m/z. 1d: HR-MS for C27H47N3O3 [M + H]+ calculated 462.36902 m/z, found 462.37048 m/z; 1e: HR-MS for C24H40N3O3 [M − H] calculated 418.30751 m/z, found 418.30746 m/z; 1f: HR-MS for C25H42N3O3 [M − H] calculated 432.32316 m/z, found 432.32294 m/z; 1g: HR-MS for C26H44N3O3 [M − H] calculated 446.33881 m/z, found 446.33912 m/z; 1h: HR-MS for C27H46N3O3 [M − H] calculated 460.35446 m/z, found 460.35458 m/z; 1i: HR-MS for C26H46N3O3 [M + H]+ calculated 448.35337 m/z, found 448.35458 m/z; 1j: HR-MS for C27H48N3O3 [M + H]+ calculated 462.36902 m/z, found 462.37045 m/z; 1k: HR-MS for C28H50N3O3 [M + H]+ calculated 476.38567 m/z, found 476.38608 m/z; 1l: HR-MS for C29H52N3O3 [M + H]+ calculated 490.40192 m/z, found 490.40210 m/z; 1m: HR-MS for C26H44N3O3 [M − H] calculated 446.33881 m/z, found 446.33908 m/z; 1n: HR-MS for C27H46N3O3 [M − H] calculated 460.35446 m/z, found 460.35474 m/z; 1o: HR-MS for C28H48N3O3 [M − H] calculated 474.37011 m/z, found 474.36996 m/z; 1p: HR-MS for C29H50N3O3 [M − H] calculated 488.38576 m/z, found 488.38596 m/z.

3.3. Determination and Prediction of Physicochemical Properties

3.3.1. Estimation of Surface Tension

Surface tension (relative surface activity; γ) of the derivatives 1ap was determined by a drop count method using a glassy Traube stalagmometer (Kavalier Glass, Prague, Czech Republic). Number of drops of compounds’ and reference solutions were counted between upper and lower marks of the stalagmometer [30,31]. Aqueous solutions of the molecules 1ap were prepared with distilled, deionized water (c = 2.0 × 10⁻³ M). Distilled deionized water was also used as a reference solution, which showed γ = 0.07259 N/m. The drops were allowed to form at constant temperature 21 °C. The experimental procedure was described in a paper [31]. Current measurements were done in six replicates and average γ values (in N/m units) were reported (Table 1).

3.3.2. Estimation of Electronic Properties

The log ε values characterizing methanolic solutions of the compounds 1ap (c = 8.0 × 10⁻⁵ M) were observed at λ1 = 208–210 nm, λ2 (Ch-T) = 236–238 nm and λ3 = 278–280 nm (Table 1), respectively, in a near ultraviolet (quarz) region of the electromagnetic spectrum between 200 nm and 400 nm [35]. The log ε values for presently observed absorption maxima were calculated following the Lambert-Beer’s law, which was discussed in [35], for example, and expressed by Equation (16):
A = ε × c × l
where the A parameter represented absorbance of a compound’s solution, the ε descriptor was a molar absorption coefficient (in L/mol/cm units) and l was path length (in cm units).

3.3.3. Estimation and In Silico Investigation of Lipohydrophilic Properties

Lipophilicity of the compounds 1ap was determined by reversed-phase high-performance liquid chromatography (RP-HPLC). Methanol (MeOH)/water mobile phases with varying volume ratio of the organic modifier and water (80:20, 85:15, 90:10, 95:5 (v/v) and pure MeOH, respectively) were chosen.
A methanolic solution of potassium iodine was used for dead time (td) determination. Retention factors (capacity factors; k) were calculated according to Equation (17):
k = (tr − td)/td
where tr was retention time of a solute (in min), the td parameter denoted dead time of potassium iodine, an unretained analyte (in min).
The observed retention (tr) and dead (td) times were means of three independent determinations. Average td values of potassium iodine in used MPhs were as follows: 2.237 min (MeOH/water ratio (v/v) was 80:20), 2.245 min (85:15), 2.245 min (90:10), 2.228 min (95:5) and 2.210 min (pure MeOH), respectively.
The log kw values, i.e., the logarithms of extrapolated retention (capacity) factors for 100% water in the isocratic RP-HPLC, were determined from intercepts of linear plots between the log k and ϕM (a volume fraction of an organic modifier in the isocratic elution RP-HPLC) according to Equation (18):
log k = log kwS × ϕM
where the S parameter represented the slope of a regression curve, which was related to solvent strength of a pure organic solvent [51,52].
Purity (in percentages) of the compounds 1ap was also verified by RP-HPLC. Areas of their peaks were measured using the MPh, which contained 90% proportion (v/v) of MeOH. The purity of given salts is provided in Table S3.
The log p values of non-protonated bases 9a′p (Scheme 1, Table 4) for the octan-1-ol/water partitioning system were calculated by the Ghose and Crippen′s log PCr [54,55], Viswanadhan′s log PV [56], Broto’s log PB [57] and Leo’s CLOGP 4.0 [58] atomic as well as combined atomic and fragmental methods using the ChemBioDraw Ultra 12.0 software package (CambridgeSoft, Cambridge, MA, USA).
The Virtual Computer Chemistry Laboratory [59], a freely available web-based tool working in Java environment, was taken to generate log P by the Wang’s XLOGP 2.0 [60], Cheng’s XLOGP 3.0 [61], Moriguchi’s MLOGP [62], Sander’s (Actelion’s) ACLOGP [63], Molinspiration’s miLogP 2.2 [64], ALOGP [65] and Tetko’s ALOGPs 2.1 [66] method (Table 4 and Table 5), respectively. All these approaches integrated algorithms based on atomic/fragmental principles, excluding ALOGPs 2.1, which considered a molecule in the whole [66].
The SILICOS-IT hybrid method, which used a proprietary fragment- and property-based principles, was also employed to generate log P parameters (log PS-IT; Table 5). The method was implemented in the SwissADME applet, a free web tool designed to evaluate pharmacokinetics and drug-likeness of small molecules [67].

3.4. In Vitro Antimycobacterial Assays

The in vitro activity of compounds 1ap was inspected against Mycobacterium tuberculosis CNCTC My 331/88 (identical with H37Rv and ATCC 2794, respectively; abbreviation used: MTv H37Rv), M. kansasii CNCTC My 235/80 (identical with ATCC 12478; MK 235/80), the M. kansasii 6509/96 clinical isolate (MK 6509/96) and M. avium CNCTC My 330/80 (identical with ATCC 25291; MA 330/80), respectively, in the Laboratory for Mycobacterial Diagnosis and Tuberculosis (Institute of Public Health in Ostrava, Czech Republic). These strains were purchased from the National Reference Laboratory—Czech National Collection of Type Cultures (CNCTC; The National Institute of Public Health, Prague, Czech Republic), excluding MK 6509/96, which was clinically isolated because the INH-resistant M. kansasii strains have not been found in Czech Republic or Slovak Republic. In the experiments, dilution of the strains was as follows: 10−3 M (MTv H37Rv), 10−4 M (MK 235/80, MK 6509/96) and 10−5 M (MA 330/80), respectively.
The molecules 1ap were also in vitro screened against an avirulent M. tuberculosis H37Ra ATCC 25177 (MTa H37Ra), M. kansasii DSM 44162 (MK DSM), M. smegmatis ATCC 700084 (MS) and M. marinum CAMP 5644 (MM), respectively, in the Department of Infectious Diseases and Microbiology (Faculty of Veterinary Medicine, University of Veterinary and Pharmaceutical Sciences in Brno, Czech Republic).
Standard drugs. Isoniazid (INH), ethambutol (EMB), ofloxacin (OFLX) and ciprofloxacin (CPX) reference drugs were purchased from Sigma-Aldrich (Darmstadt, Germany), respectively, showing purity of analytical grade.
Determination of a minimum inhibitory concentration (MIC) againstMTv H37Rv, MK 235/80, MK 6509/96 and MA 330/80. Efficiency of the compounds 1ap and standard drugs (INH, EMB and OFLX, respectively) against given mycobacteria were determined in lyophilized Šula’s semisynthetic medium (Sevac, Prague, Czech Republic) by a dilution-micromethod [20,72,84].
Each tested mycobacterial strain was simultaneously inoculated into Petri plates containing the Šula’s medium for sterility control and growth of the inoculum [84]. All screened molecules were added to this medium as solutions in dimethyl sulfoxide (DMSO; Sigma-Aldrich, Irvine, UK). In the in vitro assays, following concentrations of the solutions were used: 1000, 500, 250, 125, 62.5, 32, 16, 8, 4, 2, 1, 0.5 and 0.25 μM, respectively. The inoculated plates kept in microtone bags were incubated at 37 °C. Particular reading was carried out macroscopically on a stand with a bottom magnifying mirror using a magnifying glass.
Growth in the plates [20,72] was evaluated after 7, 14 and 21 days (MK 235/80, MK 6509/96) or after 14 and 21 days (MTv H37Rv, MA 330/80).
The value of a minimum inhibitory concentration (MIC) was the lowest concentration (on the above concentration scale) of a tested compound, which inhibited growth of the mycobacteria [20,72]. The screening was repeated three times and the MIC values (in μM units), reported in Table 6 and Table 7, were the same.
Determination of a minimum inhibitory concentration (MIC) against MTa H37Ra. The mycobacterium was grown on Middlebrook broth (MB; MiddleBrook Pharmaceuticals, Inc., Westlake, TX, USA), supplemented with Oleic-Albumin-Dextrose-Catalase (OADC) supplement (Difco, Lawrence, KS, USA) and salicylate-derived mycobactin J (2 μg/mL; Allied Monitor Inc., Fayette, MO, USA), an iron-binding siderophore [85,86].
At log phase growth, a culture sample (10 mL) was centrifuged at 15,000 rpm/20 min using a bench top centrifuge MPW-65R (MPW Med Instruments, Warsaw, Poland). Following removal of the supernatant, a pellet was washed in fresh liquid Middlebrook 7H9GC broth (MiddleBrook Pharmaceuticals, Inc.) and re-suspended in a fresh OADC-supplemented MB (10 mL).
Turbidity was adjusted to match the McFarland standard No. 1 [87] containing approximately 3 × 10⁸ Colony Forming Units (CFU) with MB broth. Further 1:20 dilution of the culture was performed in MB broth.
Susceptibility of MTa H37Ra was investigated in a 96-well plate format. In the experiments, sterile deionized water (300 µL) was added to all outer-perimeter wells of the plates to minimize evaporation of the medium in test wells during incubation. Each evaluated compound (100 µL) was incubated with MTa H37Ra (100 µL). Dilutions of each compound were prepared in triplicate and final concentrations varied from 1000 μg/mL to 8 μg/mL. All tested molecules were dissolved in DMSO (Sigma-Aldrich, Irvine, UK), and subsequent dilutions were made in supplemented MB broth. The plates were sealed with parafilm and incubated at 37 °C for 7 days.
Following incubation, 10% addition a water-soluble dye, the alamarBlue reagent (AbD Serotec, Kidlington, UK) was mixed into each well. This resaurin-based reagent served as an oxidation-reduction indicator of metabolic function and cellular health in cell viability bioassays [88].
Absorbance readings at 570 nm and 600 nm were taken, initially for background subtraction and after 24h re-incubation. The subtraction is necessary for strongly colored compounds, where the color may interfere with the interpretation of any color change. For non-interfering compounds, a blue color in a well was interpreted as absence of growth and pink color was scored as growth [73,74].
The minimum inhibitory concentration (MIC) was defined as the lowest concentration of a compound, at which no visible bacterial growth was observed. In other words, the MIC was the lowest concentration that prevented visual color change from blue to pink. The MIC value has been routinely and widely used in bacterial assays and it has been a standard detection limit according to the Clinical and Laboratory Standards Institute [73,74]. Clinically used antimycobacterials INH and CPX were applied as reference drugs. The estimated MIC values (in μM units) were provided in Table 6.
Determination of a minimum inhibitory concentration (MIC) against MKDSM, MS and MM. A broth dilution micromethod in Middlebrook 7H9 medium (Difco, Lawrence, MO, USA) supplemented with BD BBL Middlebrook OADC Enrichment medium (Becton, Dickinson & Company, Franklin Lakes, NJ, USA) containing 8.5 g NaCl, 50.0 g bovine albumin (fraction V), 20.0 g dextrose, 0.03 g catalase, and 0.6 mL oleic acid [89], respectively, was used to determine the MIC values for given strains, as described [75].
Tested phenylcarbamic acid-based molecules 1ap as well as standard drugs INH and CPX were dissolved in DMSO (Sigma-Aldrich, Irvine, UK) and final concentration of DMSO did not exceed 2.5% of the total solution composition. The final concentrations, varying from 256 μg/mL to 0.125 μg/mL, were obtained by a two-fold serial dilution of a stock solution in a microtiter plate with sterile medium.
Bacterial inocula were prepared by transferring colonies from culture into sterile water. Cell density was adjusted to the 0.5 McFarland units [87] using the cell density meter Densi-La-Meter (LIAP, Riga, Latvia). Final inoculum was made by 1:1000 dilution of the suspension with sterile water. Drug-free controls, sterility controls and controls consisted of medium and DMSO alone were included. Results were determined visually after static incubation in darkness in aerobic atmosphere for: (i) 3 days at 37 °C in a case of MS; (ii) 7 days at 37 °C (MK DSM) and (iii) 21 days at 28 °C (MM), respectively.
The MIC parameter was defined as the lowest concentration of a compound, at which no visible bacterial growth was observed. The MIC value has been routinely and widely used in bacterial assays considering it a standard detection limit according to the Clinical and Laboratory Standards Institute [73,74]. Presently observed MIC values (in μM units) are provided in Table 6 and Table 7.

3.5. Calculations and Statistical Analyses

Regression equations of relevant fitting procedures and their statistical characteristics were calculated and visualized by the Origin Pro ver. 9.0.0 SR2 software (OriginLab Corporation, Northampton, MA, USA).
In a current research, those statistical parameters were calculated: number of points (number of cases; n), degrees of freedom (DF), reduced chi-square (χ,2red), residual sum of squares (RSS), correlation coefficient (R), adjusted coefficient of determination (Adj. R2), root mean squared error (standard deviation; RMSE), norm of residuals (NR), Fisher’s significance ratio (Fisher’s F-test; F) and probability of obtaining F Ratio (significance of a whole model; Prob > F), respectively.
The analyses were also focused on indication of a significance level of calculated F Ratio as follows: * (one star)—statistically significant; ** (two stars)—statistically very significant; *** (three stars)—statistically extremely significant. Detailed information regarding given statistical descriptors could be found in a research paper [47].
The chemometric principal component analysis (PCA) tool was used to explore relationships between (i) experimental and in silico lipophilicity descriptors, (ii) in vitro efficiency against all tested mycobacterial strains as well as (iii) physicochemical descriptors and in vitro biological activities of the compounds 1ap. The PCA is a mathematical algorithm that reduces the dimensionality of the data while retaining most of variation in the data set. It accomplishes this reduction by identifying directions, called principal components (PCs), along which the variation in the data is maximal. By using a few components, each sample can be represented by relatively few numbers instead of by values for thousands of variables. Samples can then be plotted, making it possible to visually assess similarities and differences between samples and determine whether samples can be grouped [90].
The PCA was performed by the XLSTAT ver. 2016.02.28451 software (Addinsoft, New York, NY, USA), a cloud-based statistical application for statistics and data analyses, which worked as an add-on to the Microsoft Excel ver. 2013 software (Microsoft Corp., Redmont, WA, USA).

4. Conclusions

In summary, determination of physicochemical properties and in vitro antimymycobacterial screening in connection with SAR analyses of 1-[2-[({[2-/3-(alkoxy)phenyl]amino}carbonyl)oxy]-3-(dipropylammonio)propyl]pyrrolidinium oxalates (1ad)/dichlorides (1eh) and 1-[2-[({[2-/3-(alk-oxy)phenyl]amino}carbonyl)oxy]-3-(dipropylammonio)propyl]azepanium oxalates (1il)/di-chlorides (1mp; alkoxy = butoxy to heptyloxy) were considered main objectives of the research.
All compounds 1ap in aqueous solutions (c = 2.0 × 10⁻³ M) were able to decrease surface tension of water (γ = 0.07259 N/m) at 21 °C and their γ varied from 0.05692 N/m (1p) to 0.06464 N/m (1a). Relationships between number of carbon atoms forming their side chain R (nc) and γ values (in N/m units) were described most precisely by statistically significant or very significant models based on polynomial functions of 2nd order within all homological subsets 1ad, 1eh, 1il and 1mp.
Electronic properties of the molecules 1ap were characterized by logarithms of molar absorption coefficients (log ε) of their methanolic solutions (c = 8.0 × 10⁻⁵ M) investigated in the UV/Vis region of an electromagnetic spectrum. The solutions showed three absorption maxima in a near ultraviolet (quarz) region of the spectrum between 200 nm and 400 nm. The maxima were found at λ1 = 208–210 nm (second local excitation band), λ2 (Ch-T) = 236–238 nm (charge-transfer band) and λ3 = 278–280 nm (first local excitation band), respectively. There was observed nor linear neither quasi-parabolic relationship between nc and log ε2 (Ch-T), as the maximum being the most sensitive to differences in electronic environment of a phenylcarbamoyloxy moiety due to different position and length of a substituent R.
The log kw values, as descriptors characterizing lipophilic properties of 1ap, were extrapolated from intercepts of statistically extremely significant linear relationships between log k parameters and volume fractions of MeOH modifier (ϕM) using the Snyder–Soczewiński solvent strength model. These log kw values were in accordance with an elution order and hydrophobicity of the molecules 1ap and varied from 3.7688 (1a) to 6.1749 (1p). Increase in length of their side chain R led to higher S, as a function of molecular structure parameters, within all homological sets. The compounds containing an azepanium moiety showed higher S than those with a pyrrolidium group presuming same position and length of R. The calculated S parameters varied from 3.7788 (1a) to 6.2672 (1p). A statistically extremely significant relationship between the log kw and S values was found.
The experimental log kw dataset was studied together with computational logarithms of partition coefficients (log P). The log P parameters of non-protonated bases 9′ap were calculated for the octan-1-ol/water partitioning system using the Ghose and Crippen′s log PCr, Viswanadhan′s log PV, Broto’s log PB, Leo’s CLOGP 4.0, Wang’s XLOGP 2.0, Cheng’s XLOGP 3.0, Moriguchi’s MLOGP, Sander’s (Actelion’s) ACLOGP, Molinspiration’s miLogP 2.2, ALOGP, SILICOS-IT and Tetko´s ALOGPs 2.1 method as well. Similarities and differences between log kw and in silico descriptors were analyzed by unscaled principal component analysis (PCA). There was confirmed high sensitivity of PCA for detecting of small differerences between analyzed positional isomers, which given in silico methods could not perform with satisfactory visibility. The log PI-IT, XLOGP 2.0 and XLOGP 3.0 descriptors might be used to characterize lipophilic properties of investigated salts and bases, especially if they contained highly lipophilic side chain R.
The compounds 1ap were in vitro screened against Mycobacterium tuberculosis CNCTC My 331/88 (identical with H37Rv; abbreviation used: MTv H37Rv), M. tuberculosis H37Ra ATCC 25177 (MTa H37Ra), M. kansasii CNCTC My 235/80 (MK 235/80), the M. kansasii 6509/96 clinical isolate (MK 6509/96), M. kansasii DSM 44162 (MK DSM), M. avium CNCTC My 330/80 (MA 330/80), M. smegmatis ATCC 700084 (MS) and M. marinum CAMP 5644 (MM), respectively. In vitro susceptibility of given mycobacteria to clinically used reference drugs isoniazid (INH), ethambutol (EMB), ofloxacin (OFLX) or ciprofloxacin (CPX) was tested as well.
A very unique aspect of a present research was that many compounds from the set 1ap were in vitro efficient against almost all tested mycobacterial strains. The compounds 1h and 1p were the most active practically against the whole spectrum of tested mycobacteria (MIC ≤ 8 μM), excluding MA 330/80.
All 3-alkoxy substituted molecules 1eh and 1mp were more efficient against MTa H37Ra (MIC = 3.7–8.1 μM) than INH or CPX. The dibasic compounds also inhibited growth of MK DSM more effectively (MIC = 1.9–16.2 μM) compared to INH. Moreover, the derivatives 1g, 1h and 1np showed approximately equal activity against MA 330/80 (MIC = 16 μM) as EMB. Regarding MTv H37Rv, however, none of the molecules 1ap showed similar ability to fight given mycobacterium as INH. Comparable activity against MK 6509/96 was found for the substances 1h, 1np (MIC = 4 μM and 8 μM) and INH. If concerning the 2-alkoxy substituted compounds 1ad and 1il, the derivative 1d was more promising against MTa H37Ra (MIC = 12.5 μM) and MK DSM (MIC = 6.2 μM) than INH. The INH standard was also less effective against MS or MM than practically all tested phenylcarbamic acid-based substances, from which were 1j (MIC = 6.2 μM; anti-MS) and 1h (MIC < 3.7 μM; anti-MM) the most efficient.
The chemometric PCA approach as well as fitting procedures, supported by relevant equations and adequate statistical analyses, were used to comprehensively investigate SAR of the derivatives 1ap. It seemed that ability to decrease surface tension of water was slightly more important than increase in lipophilicity of a pyrrolidinium moiety-containing compounds 1ah in order to improve their efficiency against both MTv H37Rv and MA 330/80. The compounds with γ varying from 0.05692 N/m (1p) to 0.06154 N/m (1n) showed comparable potential to act against MA 330/80 (21-d). Further increase in γ, i.e., minor ability to decrease surface tension of water, resulted in sharp decrease in their antimycobacterial efficiency. If attention was turned to the 3-alkoxy substituted molecules 1eh and 1mp, increase in their log kw up to approximately 5.1000 led to sharp increase in activity against MA 330/80 (21-d). Further increase in lipophilicity beyond this border did not result in higher antimycobacterial activity of 1n (log kw = 5.2087), 1h (log kw = 5.5384), 1o (log kw = 5.6569) or 1p (log kw = 6.1749).
Increase in lipophilicity of the molecules 1ah was more important factor, which positively influenced their efficiency against MK 235/80, MK 6509/96 and MK DSM, compared to surface properties. Conversely, incease in lipophilicity over ‘a certain value’ (log kw of approximately 5.2000) together with different size and steric properties of a salt-forming group (1ip) would not be a guaranty of improvement in antimycobacterial activity.
There was observed a statistically very significant model between log ε2 (Ch-T) and log (1/MIC [M]) connected with 3-d in vitro evaluation of the compounds 1ch against MS. It was found that activity increased with increasing log ε2 (Ch-T), reached a maximum if the independent variable was between 4.24 and 4.27 (1e, 1f and 1h) and then decreased with further increase in the log ε2 (Ch-T) values.
Overall, the results of current in vitro biological screening and SAR investigations of the molecules 1ap might reveal new horizons in discovery of very effective ‘non-traditional’ antimycobacterial agents based on a phenylcarbamic acid structural scaffold.

Supplementary Materials

The supplementary materials are available online.

Author Contributions

I.M. suggested the research idea, created the concept and designed the study, investigated electronic and lipophilic properties of the compounds 1ap, analyzed the data related to in vitro antimycobacterial screening, performed in silico studies, interpreted results, explored and statistically characterized proposed models, performed PCAs and fitting procedures, interpreted PCAs and SARs, wrote and revised the paper; J.C. designed chemical structures of the compounds 1ap and synthesized them, estimated their spectral characteristics (IR) and elemental analyses, contributed reagents/materials tools; I.S. suggested the research idea, created the concept and designed the study, interpreted results from in vitro biological assays; Š.P., H.M. and J.S. performed in vitro antimycobacterial evaluation of the molecules 1ap, contributed reagents/materials tools; J.J. and A.Č. suggested the research idea, created the concept and designed the study, contributed reagents/materials tools; I.K. estimated purity and lipophilic properties of the compounds1ap, analyzed results from isocratic RP-HPLC, contributed reagents/materials tools; J.Č. and M.P. estimated surface tension (relative surface activity) and electronic properties of the compounds 1ap; D.P. measured and interpreted HPLC-HR-MS spectra of the intermediates 9′ap (not biologically investigated); M.O. measured and interpreted HR-MS spectra of the compounds 1ap. The authors have approved a final version of the manuscript.

Acknowledgments

The authors very gratefully acknowledge financial support received especially from the Faculty of Pharmacy, Comenius University in Bratislava (Slovak Republic). The research was also supported by the grant projects of the Comenius University in Bratislava No. UK/241/2018 and UK/229/2018 as well as grant project of the Faculty of Pharmacy, Comenius University in Bratislava No. FaF UK/9/2018. The authors wish to express their gratitude to the Scientific Grant Agency of the Ministry of Education, Science, Research and Sport of the Slovak Republic for providing financial support by a grant project VEGA No. 1/0040/17. The HPLC/HRMS system forms a part of the National Infrastructure CzeCOS ProCES CZ.02.1.01/0.0/0.0/16_013/0001609; Michal Oravec was supported by the National Sustainability Program (NPU I; Grant No. LO1415). The research was also partially supported by Sanofi-Aventis Pharma Slovakia, s.r.o. (Slovak Republic).

Conflicts of Interest

The authors declare no conflict of interest.

Abbreviations

The following abbreviations are used in this manuscript:
2-PrOHPropan-2-ol
3-d3-Day cultivation
7-d7-Day cultivation
14-d14-Day cultivation
21-d21-Day cultivation
λeEigenvalues (principal component analysis)
χ,2redReduced chi-square (statistical analysis)
ϕMVolume fraction of a mobile phase modifier (RP-HPLC)
CPXCiprofloxacin
Adj. R2Adjusted coefficient of determination (statistical analysis)
DEEDiethyl ether
DFDegrees of freedom (statistical analysis)
DMSODimethyl sulfoxide
EtOHEthanol
EMBEthambutol
FFisher’s F-test (Fisher’s significance ratio; statistical analysis)
INHIsoniazid
IRInfrared
kRetention (capacity) factor (RP-HPLC)
LA/LAsLocal anesthetic/local anesthetics
log kwLipophilicity index; values extrapolated from intercepts of a linear relationship between the logarithm of retention factor k (log k) and volume fraction of a mobile phase modifier (ϕM; RP-HPLC)
MeOHMethanol
MAMycobacterium avium
MICMinimum inhibitory concentration (in μΜ units)
MKMycobacterium kansasii
MMMycobacterium marinum
MSMycobacterium smegmatis
MTMycobacterium tuberculosis
ncNumber of carbon atoms forming an 2-/3-alkoxy side chain (R)
NRNorm of residuals (statistical analysis)
OFLXOfloxacin
PCPrincipal Component (principal component analysis)
PCA/PCAsPrincipal component analysis/principal component analyses
Prob > FProbability of obtaining the F Ratio (statistical analysis)
RMSERoot mean squared error (standard deviation; statistical analysis)
RSSResidual sum of squares (statistical analysis)
SSlope (RP-HPLC)
SAR/SARsStructure–activity relationship/Structure–activity relationships
trRetention time of a compound (RP-HPLC)

References

  1. Squeglia, F.; Romano, M.; Ruggiero, A.; Berisio, R. Molecular players in tuberculosis drug development: Another break in the cell wall. Curr. Med. Chem. 2017, 24, 3954–3969. [Google Scholar] [CrossRef] [PubMed]
  2. Da Silva, P.B.; Campos, D.L.; Ribeiro, C.M.; da Silva, I.C.; Pavan, F.R. New antimycobacterial agents in the pre-clinical phase or beyond: Recent advances in patent literature (2001–2016). Expert Opin. Ther. Pat. 2017, 27, 269–282. [Google Scholar] [CrossRef] [PubMed]
  3. Wu, M.L.; Aziz, D.B.; Dartois, V.; Dick, T. NTM Drug discovery: Status, gaps and the way forward. Drug Discov. Today 2018, 23, 1502–1519. [Google Scholar] [CrossRef] [PubMed]
  4. Deshpande, D.; Srivastava, S.; Chapagain, M.L.; Lee, P.S.; Cirrincione, K.N.; Pasipanodya, J.G.; Gumbo, T. The discovery of ceftazidime/avibactam as an anti-Mycobacterium avium agent. J. Antimicrob. Chemother. 2017, 72 (Suppl. 2), i36–i42. [Google Scholar] [CrossRef] [PubMed]
  5. Amaral, L.; Viveiros, M.; Kristiansen, J.E. ‘Non-Antibiotics’: Alternative therapy for the management of MDRTB and MRSA in economically disadvantaged countries. Curr. Drug Targets 2006, 7, 887–891. [Google Scholar] [CrossRef] [PubMed]
  6. Amaral, L.; Viveiros, M. Thioridazine: A non-antibiotic drug highly effective, in combination with first line anti-tuberculosis drugs, against any form of antibiotic resistance of Mycobacterium tuberculosis due to its multi-mechanisms of action. Antibiotics 2017, 6, 3. [Google Scholar] [CrossRef] [PubMed]
  7. Schmidt, R.M.; Rosenkranz, H.S. Antimicrobial activity of local anesthetics: Lidocaine and procaine. J. Infect. Dis. 1970, 121, 597–607. [Google Scholar] [CrossRef] [PubMed]
  8. Fujii, H.; Nakajima, H.; Hirose, T.; Mochizuki, T.; Fukaura, A.; Ota, S.; Sugihara, S.; Tazawa, H.; Takahashi, T. Growth inhibition of mycobacteria by lidocaine in fiberoptic bronchoscopic aspirates. JJSRE 1993, 15, 108–115. [Google Scholar] [CrossRef]
  9. Goldberg, L. Pharmacological properties of xylocaine. Sven. Tandl. Tidskr. 1947, 40, 819–830. [Google Scholar]
  10. Gordh, T. Xylocain—A new local analgesic. Anesthesia 1949, 4, 4–9. [Google Scholar] [CrossRef]
  11. Miescher, K. Studies of local anesthetics. Helv. Chim. Acta 1932, 15, 163–190. [Google Scholar] [CrossRef]
  12. Agarwal, N.; Kalra, V.K. Studies on the mechanism of action of local anesthetics on proton translocating ATPase from Mycobacterium phlei. Biochim. Biophys. Acta 1984, 764, 316–323. [Google Scholar] [CrossRef]
  13. Nakayama, Y. The electrophoretical analysis of esterase and catalase and its use in taxonomical studies of mycobacteria. Jpn. J. Microbiol. 1967, 11, 95–101. [Google Scholar] [CrossRef]
  14. Prigozhin, D.M.; Mavrici, D.; Huizar, J.P.; Vansell, H.J.; Alber, T. Structural and biochemical analyses of Mycobacterium tuberculosis N-acetylmuramyl-l-alanine amidase Rv3717 point to a role in peptidoglycan fragment recycling. J. Biol. Chem. 2013, 288, 31549–31555. [Google Scholar] [CrossRef] [PubMed]
  15. Sultana, R.; Vemula, M.H.; Banerjee, S.; Guruprasad, L. The PE16 (Rv1430) of Mycobacterium tuberculosis is an esterase belonging to serine hydrolase superfamily of proteins. PLoS ONE 2013, 8, e55320. [Google Scholar] [CrossRef] [PubMed]
  16. Vacondio, F.; Silva, C.; Mor, M.; Testa, B. Qualitative structure–metabolism relationships in the hydrolysis of carbamates. Drug Metab. Rev. 2010, 42, 551–589. [Google Scholar] [CrossRef] [PubMed]
  17. Moraczewski, A.L.; Banaszynski, L.A.; From, A.M.; White, C.E.; Smith, B.D. Using hydrogen bonding to control carbamate C−N rotamer equilibria. J. Org. Chem. 1998, 63, 7258–7262. [Google Scholar] [CrossRef] [PubMed]
  18. Combrink, K.D.; Denton, D.A.; Harran, S.; Ma, Z.; Chapo, K.; Yan, D.; Bonventre, E.; Roche, E.D.; Doyle, T.B.; Robertson, G.T.; et al. New C25 carbamate rifamycin derivatives are resistant to inactivation by ADP-ribosyl transferases. Bioorg. Med. Chem. Lett. 2007, 17, 522–526. [Google Scholar] [CrossRef] [PubMed]
  19. Velikorodov, A.V.; Urlyapova, N.G.; Daudova, A.D. Synthesis and antimycobacterial activity of carbamate derivatives of 1,2-oxazine. Pharm. Chem. J. 2006, 40, 380–382. [Google Scholar] [CrossRef]
  20. Férriz, J.M.; Vávrová, K.; Kunc, F.; Imramovský, A.; Stolaříková, J.; Vavříková, E.; Vinšová, J. Salicylanilide carbamates: Antitubercular agents active against multidrug-resistant Mycobacterium tuberculosis strains. Bioorg. Med. Chem. 2010, 18, 1054–1061. [Google Scholar] [CrossRef] [PubMed]
  21. Csöllei, J.; Búčiová, Ľ.; Čižmárik, J.; Kopáčová, L. Studies of local anaesthetics CXII. Preparation and activity of dibasic alkylesters of 2-, and 3-alkoxy-substituted phenylcarbamic acids. Českoslov. Farm. 1993, 42, 127–129. (In Slovak) [Google Scholar]
  22. Pavelčík, F.; Remko, M.; Čižmárik, J.; Majer, J. Crystal and molecular structure of heptacain hydrochloride. Collect. Czechoslov. Chem. Commun. 1986, 51, 264–270. [Google Scholar] [CrossRef]
  23. Waisser, K.; Doležal, R.; Palát, K., Jr.; Čizmárik, J.; Kaustová, J. QSAR Study of antimycobacterial activity of quaternary ammonium salts of piperidinylethyl esters of alkoxysubstituted phenylcarbamic acids. Folia Microbiol. 2006, 51, 21–24. [Google Scholar] [CrossRef]
  24. Blaser, A.; Palmer, B.D.; Sutherland, H.S.; Kmentova, I.; Franzblau, S.G.; Wan, B.; Wang, Y.; Ma, Z.; Thompson, A.M.; Denny, W.A. Structure−activity relationships for amide-, carbamate-, and urea-linked analogues of the tuberculosis drug (6S)-2-nitro-6-{[4-(trifluoromethoxy)benzyl]oxy}-6,7-dihydro-5H-imidazo[2,1-b][1,3]oxazine (PA-824). J. Med. Chem. 2012, 55, 312–326. [Google Scholar] [CrossRef] [PubMed]
  25. Gonec, T.; Pospisilova, S.; Holanova, L.; Stranik, J.; Cernikova, A.; Pudelkova, V.; Kos, J.; Oravec, M.; Kollar, P.; Cizek, A.; et al. Synthesis and antimicrobial evaluation of 1-[(2-substituted phenyl)carbamoyl]naphthalen-2-yl carbamates. Molecules 2016, 21, 1189. [Google Scholar] [CrossRef] [PubMed]
  26. Malík, I.; Sedlárová, E.; Csöllei, J.; Andriamainty, F.; Čižmárik, J.; Kečkéšová, S. The physicochemical properties of dibasic alkyl esters of 2- and 3-alkyloxy substituted phenylcarbamic acid. Acta Fac. Pharm. Univ. Comen. 2007, 54, 136–145. [Google Scholar]
  27. Čižmárik, J.; Borovanský, A.; Švec, P. Study of local anesthetics LII. Piperidinoethyl esters of alkoxyphenylcarbamic acids. Acta Fac. Pharm. 1976, 29, 53–79. [Google Scholar]
  28. Heywood, D.L.; Phillips, B. The reaction of epichlorohydrin with secondary amines. J. Am. Chem. Soc. 1958, 80, 1257–1259. [Google Scholar] [CrossRef]
  29. Schleppnik, A.A.; Gutsche, C.D. Synthesis of polysubstituted triptych-boroxazolidines. J. Org. Chem. 1962, 27, 3684–3686. [Google Scholar] [CrossRef]
  30. Dilmohamud, B.A.; Seeneevassen, J.; Rughooputh, S.D.D.V.; Ramasami, P. Surface tension and related thermodynamic parameters of alcohols using the Traube stalagmometer. Eur. J. Phys. 2005, 26, 1079–1084. [Google Scholar] [CrossRef]
  31. Vazquez, G.; Alvarez, E.; Navaza, J.M. Surface tension of alcohol water + water from 20 to 50 °C. J. Chem. Eng. Data 1995, 40, 611–614. [Google Scholar] [CrossRef]
  32. Stopková, L.; Gališinová, J.; Šuchtová, Z.; Čižmárik, J.; Andriamainty, F. Determination of critical micellar concentration of homologous 2-alkoxyphenylcarbamoyloxyethylmorpholinium chlorides. Molecules 2018, 23, 1064. [Google Scholar] [CrossRef] [PubMed]
  33. Čižmárik, J.; Borovanský, A.; Švec, P. Study of local anesthetics. LVII. Perhydroazepinylethyl esters of alkoxyphenylcarbamic acids. Česk. Farm. 1976, 25, 118–121. (In Slovak) [Google Scholar] [PubMed]
  34. Blešová, M.; Čižmárik, J.; Bachratá, M.; Bezáková, Ž.; Borovanský, A. Chromatographic parameters, pKa, and surface activity of a series of hydrochlorides of perhydroazepinylethyl esters of alkoxyphenylcarbamic acids and their relation to anaesthetic activity. Collect. Czechoslov. Chem. Commun. 1985, 50, 1133–1140. [Google Scholar] [CrossRef]
  35. Yadav, L.D.S. Ultraviolet and Visible Spectroscopy. In Organic Spectroscopy; Yadav, L.D.S., Ed.; Springer: Amsterdam, The Netherlands, 2005; pp. 7–51. [Google Scholar] [CrossRef]
  36. Čižmárik, J.; Borovanský, A. Synthesis, u.v. and i.r. spectra of 2-piperidnoethyl esters of alkyloxyphenylcarbamic acids. Chem. Zvesti 1975, 29, 119–123. [Google Scholar]
  37. Rutkowska, E.; Pajak, K.; Jóźwiak, K. Lipophilicity–methods of determination and its role in medicinal chemistry. Acta Pol. Pharm. 2013, 70, 3–18. [Google Scholar] [PubMed]
  38. Waisser, K.; Doležal, R.; Čižmárik, J. Graphic demonstration of the structure–antimycobacterial activity relationships in the series of ester phenylcarbamic acid with piperidine or pyrrolidine moiety. Folia Pharm. Univ. Carol. 2008, 37, 65–76. [Google Scholar]
  39. Van de Waterbeemd, H.; Kansy, M.; Wagner, B.; Fischer, H. Lipophilicity Measurement by Reversed-Phase High Performance Liquid Chromatography (RP-HPLC). In Lipophilicity in Drug Action and Toxicology. Methods and Principles in Medicinal Chemistry; Pliška, V., Testa, B., van de Waterbeemd, H., Eds.; VCh Verlag: Weinheim, Germany, 1996; pp. 73–88. ISBN 3-527-29383-3. [Google Scholar]
  40. Valkó, K.; Slégel, P. New chromatographic hydrophobicity index (ϕ0) based on the slope and the intercept of the log k′ versus organic phase concentration plot. J. Chromatogr. A 1993, 631, 49–61. [Google Scholar] [CrossRef]
  41. Du, Ch.M.; Valko, K.; Bevan, Ch.; Reynolds, D.; Abraham, M.H. Rapid method for estimating octanol–water partition coefficient (log Poct) from isocratic RP-HPLC and a hydrogen bond acidity term (A). J. Liq. Chrom. Rel. Technol. 2001, 24, 635–649. [Google Scholar] [CrossRef]
  42. El Tayar, N.; van de Waterbeemd, H.; Testa, B. Lipophilicity measurements of protonated basic compounds by reversed-phase high-performance liquid chromatography: I. Relationship between capacity factors and the methanol concentration in methanol–water eluents. J. Chromatogr. A 1985, 320, 293–304. [Google Scholar] [CrossRef]
  43. El Tayar, N.; van de Waterbeemd, H.; Testa, B. Lipophilicity measurements of protonated basic compounds by reversed-phase high-performance liquid chromatography: II. Procedure for the determination of a lipophilic index measured by reversed-phase high-performance liquid chromatography. J. Chromatogr. A 1985, 320, 305–312. [Google Scholar] [CrossRef]
  44. Paschke, A.; Manz, M.; Schüürmann, G. Application of different RP-HPLC methods for the determination of the octanol/water partition coefficient of selected tetrachlorobenzyltoluenes. Chemosphere 2001, 45, 721–728. [Google Scholar] [CrossRef]
  45. Montanari, M.L.C.; Montanari, C.A.; Piló-Veloso, D.; Cass, Q.B. Estimation of the RP-HPLC lipophilicity parameters log k′, and log kw, a comparison with the hydrophobicity index ϕ0. J. Liq. Chromatogr. Relat. Technol. 1997, 20, 1703–1715. [Google Scholar] [CrossRef]
  46. Flieger, J.; Tatarczak-Michalewska, M.; Wujec, M.; Pitucha, M.; Świeboda, R. RP-HPLC Analysis and in vitro identification of antimycobacterial activity of novel thiosemicarbazides and 1,2,4-triazole derivatives. J. Pharm. Biomed. Anal. 2015, 107, 501–511. [Google Scholar] [CrossRef] [PubMed]
  47. Goněc, T.; Malík, I.; Csöllei, J.; Jampílek, J.; Stolaříková, J.; Solovič, I.; Mikuš, P.; Keltošová, S.; Kollár, P.; O’Mahony, J.; et al. Synthesis and in vitro antimycobacterial activity of novel N-arylpiperazines containing an ethane-1,2-diyl connecting chain. Molecules 2017, 22, 2100. [Google Scholar] [CrossRef] [PubMed]
  48. Carta, A.; Paglietti, G.; Rahbar Nikookar, M.E.; Sanna, P.; Sechi, L.; Zanetti, S. Novel substituted quinoxaline 1,4-dioxides with in vitro antimycobacterial and anticandida activity. Eur. J. Med. Chem. 2002, 37, 355–366. [Google Scholar] [CrossRef]
  49. Moreno, E.; Gabano, E.; Torres, E.; Platts, J.A.; Ravera, M.; Aldana, I.; Monge, A.; Pérez-Silanes, S. Studies on log Po/w of quinoxaline di-N-oxides: A comparison of RP-HPLC experimental and predictive approaches. Molecules 2011, 16, 7893–7908. [Google Scholar] [CrossRef] [PubMed]
  50. Snyder, L.R.; Poppe, H. Mechanism of solute retention in liquid–solid chromatography and the role of the mobile phase in affecting separation: Competition versus ‘sorption’. J. Chromatogr. A 1980, 184, 363–413. [Google Scholar] [CrossRef]
  51. Valkó, K.; Snyder, L.R.; Glajch, J.L. Retention in reversed-phase liquid chromatography as a function of mobile-phase composition. J. Chromatogr. A 1993, 656, 501–520. [Google Scholar] [CrossRef]
  52. Soczewiński, E. Mechanistic molecular model of liquid–solid chromatography: Retention–eluent composition relationships. J. Chromatogr. A 2002, 965, 109–116. [Google Scholar] [CrossRef]
  53. Chen, N.; Yhang, Y.; Lu, P. Effects of molecular structure on the S index in the retention equation in reversed-phase high-performance liquid chromatography. J. Chromatogr. A 1992, 606, 35–42. [Google Scholar] [CrossRef]
  54. Ghose, A.K.; Crippen, G.M. Atomic physicochemical parameters for three-dimensional structure-directed quantitative structure–activity relationships. I. Partition coefficients as a measure of hydrophobicity. J. Comput. Chem. 1986, 7, 565–577. [Google Scholar] [CrossRef]
  55. Ghose, A.K.; Crippen, G.M. Atomic physicochemical parameters for three-dimensional structure-directed quantitative structure–activity relationships. II. Modeling dispersive and hydrophobic interactions. J. Chem. Inform. Comput. Sci. 1987, 27, 21–35. [Google Scholar] [CrossRef]
  56. Viswanadhan, N.V.; Ghose, K.A.; Reyankar, R.G.; Robins, K.R. Atomic physicochemical parameters for three-dimensional structure-directed quantitative structure–activity relationships 4. Additional parameters for hydrophobic and dispersive interactions and their application for an automated superposition of certain naturally occurring nucleoside antibiotics. J. Chem. Inform. Comput. Sci. 1989, 29, 163–172. [Google Scholar] [CrossRef]
  57. Broto, P.; Moreau, G.; Vandycke, C. Molecular structures: Perception, autocorrelation descriptor and SAR studies. System of atomic contributions for the calculation of the n-octanol/water partition coefficients. Eur. J. Med. Chem. 1984, 19, 71–78. [Google Scholar]
  58. Leo, A. The octanol–water partition coefficient of aromatic solutes: The effect of electronic interactions, alkyl chains, hydrogen bonds, and ortho-substitution. J. Chem. Soc. Perkin Trans. II 1983, 20, 825–838. [Google Scholar] [CrossRef]
  59. Tetko, I.V.; Gasteiger, J.; Todeschini, R.; Mauri, A.; Livingstone, D.; Ertl, P.; Palyulin, V.A.; Radchenko, E.V.; Zefirov, N.S.; Makarenko, A.S.; et al. Virtual computational chemistry laboratory–design and description. J. Comput. Aided Mol. Des. 2005, 19, 453–463. [Google Scholar] [CrossRef] [PubMed]
  60. Wang, R.; Gao, Y.; Lai, L. Calculating partition coefficient by atom-additive method. Perspect. Drug Discov. Des. 2000, 19, 47–66. [Google Scholar] [CrossRef]
  61. Cheng, T.; Zhao, Y.; Li, X.; Lin, F.; Xu, Y.; Zhang, X.; Li, Y.; Wang, R.; Lai, L. Computation of octanol–water partition coefficients by guiding an additive model with knowledge. J. Chem. Inf. Model. 2007, 47, 2140–2148. [Google Scholar] [CrossRef] [PubMed]
  62. Moriguchi, I.; Hirono, S.; Liu, Q.; Nakagome, I.; Matsushita, Y. Simple method of calculating octanol/water partition coefficient. Chem. Pharm. Bull. 1992, 40, 127–130. [Google Scholar] [CrossRef]
  63. Sander, T.; Freyss, J.; von Korff, M.; Reich, J.R.; Rufener, C. OSIRIS, an entirely in-house developed drug discovery informatics system. J. Chem. Inf. Model. 2009, 49, 232–246. [Google Scholar] [CrossRef] [PubMed]
  64. Molinspiration Cheminformatics, Slovenský Grob, Slovak Republic. Available online: http://www.molinspiration.com/cgi-bin/properties (accessed on 7 June 2018).
  65. Viswanadhan, V.N.; Rami Reddy, M.; Bacquet, R.J.; Erion, M.D. Assessment of methods used for predicting lipophilicity: Application to nucleosides and nucleoside bases. J. Comput. Chem. 1993, 14, 1019–1026. [Google Scholar] [CrossRef]
  66. Tetko, I.V.; Tanchuk, V.Y. Application of associative neural networks for prediction of lipophilicity in ALOGPS 2.1 program. J. Chem. Inf. Comput. Sci. 2002, 42, 1136–1145. [Google Scholar] [CrossRef] [PubMed]
  67. Daina, A.; Michielin, O.; Zoete, V. SwissADME: A free web tool to evaluate pharmacokinetics, drug-likeness and medicinal chemistry friendliness of small molecules. Sci. Rep. 2017, 7, E42717–E42729. [Google Scholar] [CrossRef] [PubMed]
  68. Abdi, H.; Williams, L.J. Principal component analysis. WIREs Comp. Stat. 2010, 2, 433–459. [Google Scholar] [CrossRef] [Green Version]
  69. Carpenter, T.S.; Kirshner, D.A.; Lau, E.Y.; Wong, S.E.; Nilmeier, J.P.; Lightstone, F.C. A method to predict blood–brain barrier permeability of drug-like compounds using molecular dynamics simulations. Biophys. J. 2014, 107, 630–641. [Google Scholar] [CrossRef] [PubMed]
  70. Norinder, U.; Haeberlein, M. Computational approaches to the prediction of blood–brain distribution. Adv. Drug Deliv. Rev. 2002, 54, 291–313. [Google Scholar] [CrossRef]
  71. Van de Waterbeemd, H.; Camenisch, G.; Folkers, G.; Chretien, J.R.; Raevsky, O.A. Estimation of blood–brain barrier crossing of drugs using molecular size and shape, and H-bonding descriptors. J. Drug Targets 1998, 6, 151–165. [Google Scholar] [CrossRef] [PubMed]
  72. Imramovsky, A.; Pesko, M.; Kralova, K.; Vejsova, M.; Stolarikova, J.; Vinsova, J.; Jampilek, J. Investigating spectrum of biological activity of 4- and 5-chloro-2-hydroxy-N-[2-(arylamino)-1-alkyl-2-oxoethyl]benz-amides. Molecules 2011, 16, 2414–2430. [Google Scholar] [CrossRef] [PubMed]
  73. Clinical and Laboratory Standards Institute (CLSI). Methods for Antimicrobial Susceptibility Testing of Anaerobic Bacteria; Approved Standard, 8th ed.; CLSI Document M11-A8; CLSI: Wayne, NJ, USA, 2012; pp. 10–56. [Google Scholar]
  74. Clinical and Laboratory Standards Institute (CLSI). Performance Standards for Antimicrobial Susceptibility Testing, 24th ed.; Informational Supplement M100-S24; CLSI: Wayne, NJ, USA, 2014; pp. 106–211. [Google Scholar]
  75. Brown-Elliott, B.A.; Cohen, S.; Wallace, R.J., Jr. Susceptibility Testing of Mycobacteria. In Antimicrobial Susceptibility Testing Protocols; Schwalbe, R., Steele-Moore, L., Goodwin, A.C., Eds.; CRC Press (Taylor and Francis Group): Boca Raton, FL, USA, 2007; pp. 243–274. [Google Scholar]
  76. Waisser, K.; Dražková, K.; Čižmárik, J.; Kaustová, J. Antimycobacterial activity of basic ethylesters of alkoxy-substituted phenylcarbamic acids. Folia Microbiol. 2003, 48, 45–50. [Google Scholar] [CrossRef]
  77. Jackson, D.A. Stopping rules in principal components analysis: A comparison of heuristical and statistical approaches. Ecology 1993, 74, 2204–2214. [Google Scholar] [CrossRef]
  78. Čižmárik, J.; Waisser, K.; Doležal, R. QSAR Study of antimycobacterial activity of esters of phenylcarbamic acids. Acta Fac. Pharm. Univ. Comen. 2008, 55, 90–95. [Google Scholar]
  79. Čižmárik, J.; Waisser, K. Review of potential antituberculotics: Esters of substituted phenylcarbamic acids. Folia Pharm. Univ. Carol. 2008, 37, 91–94. [Google Scholar]
  80. Grzegorzewicz, A.E.; de Sousa-d’Auria, C.; McNeil, M.R.; Huc-Claustre, E.; Jones, V.; Petit, C.; Angala, S.K.; Zemanová, J.; Wang, Q.; Belardinelli, J.M.; et al. Assembling of the Mycobacterium tuberculosis cell wall core. J. Biol. Chem. 2016, 291, 18867–18879. [Google Scholar] [CrossRef] [PubMed]
  81. Kubinyi, H. Quantitative structure–activity relationships. 7. The bilinear model, a new model for nonlinear dependence of biological activity on hydrophobic character. J. Med. Chem. 1977, 20, 625–629. [Google Scholar] [CrossRef] [PubMed]
  82. David, H.L.; Rastogi, N.; Clavel-Sérès, S.; Clément, F.; Thorel, M.-F. Structure of the cell envelope of Mycobacterium avium. Zent. Bakteriol. Mikrobiol. Hyg. A 1987, 264, 49–66. [Google Scholar] [CrossRef]
  83. Hansch, C.; Clayton, J.M. Lipophilic character and biological activity of drugs II. The parabolic case. J. Pharm. Sci. 1973, 62, 1–21. [Google Scholar] [CrossRef] [PubMed]
  84. Šula, L. WHO Co-operative studies on a simple culture technique for the isolation of mycobacteria. 1. Preparation, lyophilization and reconstitution of a simple semi-synthetic concentrated liquid medium; culture technique; growth pattern of different mycobacteria. Bull. World Health Organ. 1963, 29, 589–606. [Google Scholar] [PubMed]
  85. De Voss, J.J.; Rutter, K.; Schroeder, B.G.; Su, H.; Zhu, Y.; Barry, C.E., III. The salicylate-derived mycobactin siderophores of Mycobacterium tuberculosis are essential for growth in macrophages. Proc. Natl. Acad. Sci. USA 2000, 97, 1252–1257. [Google Scholar] [CrossRef] [PubMed]
  86. Schwartz, B.D.; De Voss, J.J. Structure and absolute configuration of mycobactin J. Tetrahedron Lett. 2001, 42, 3653–3655. [Google Scholar] [CrossRef]
  87. Atlas, R.; Snyder, J. Reagents, Stains, and Media: Bacteriology. In Manual of Clinical Microbiology (2-Volume Set), 11th ed.; Jorgensen, J.H., Pfaller, M.A., Carroll, K.C., Funke, G., Landry, M.L., Richter, S.S., Warnock, D.W., Eds.; ASM Press: Washington, DC, USA, 2015; Volume 1, pp. 316–349. [Google Scholar] [CrossRef]
  88. Franzblau, S.G.; Witzig, R.S.; McLaughlin, J.C.; Torres, P.; Madico, G.; Hernandez, A.; Degnan, M.T.; Cook, M.B.; Quenzer, V.K.; Ferguson, R.M.; et al. Rapid, low-technology MIC determination with clinical Mycobacterium tuberculosis isolates by using the microplate Alamar Blue assay. J. Clin. Microbiol. 1998, 36, 362–366. [Google Scholar] [PubMed]
  89. Long, J.E.; DeJesus, M.; Ward, D.; Baker, R.E.; Ioerger, T.; Sassetti, C.M. Identifying Essential Genes in Mycobacterium Tuberculosis by Global Phenotypic Profiling. In Gene Essentiality. Methods and Protocols; Lu, L.J., Ed.; Humana Press (Springer): New York, NY, USA, 2015; pp. 79–98. [Google Scholar] [CrossRef]
  90. Ringnér, M. What is principal component analysis? Nat. Biotechnol. 2008, 26, 303–304. [Google Scholar] [CrossRef] [PubMed]
Sample Availability: Samples of the compounds 1ap are available from the authors Ivan Malík and Jozef Csöllei.
Figure 1. Chemical structure of thioridazine (a), a neuroleptic drug containing a phenothiazine scaffold (a); as well as effective local anesthetics (b) lidocaine (xylocaine); and (c) dibucaine (cinchocaine). All these compounds showed notable in vitro efficiency against some mycobacterial strains [5,6,7,8,9,10,11,12]. Structural fragments of dibucaine were color-coded as follows: a lipophilic moiety (a dark green framework), polar group (orange), connecting hydrocarbon chain (gray) and salt-forming (basic) group (dark red), respectively.
Molecules 23 02493 g001
Scheme 1. Synthesis of 1-[2-[({[2-/3-(alkoxy)phenyl]amino}carbonyl)oxy]-3-(dipropylammonio)-propyl]pyrrolidinium/azepanium oxalates/dichlorides (1ap; alkoxy = butoxy to heptyloxy). Reagents and conditions: (i) (CH3CO)2O, reflux (1h); (ii) Na, anhydrous EtOH, 1-bromoalkane (alkane = butane to heptane), r.t. (12h), reflux (3h); (iii) 18% HCl, reflux (2h); (iv) phosgene, anhydrous toluene, reflux (3h); (v) (±)-2-(chloromethyl)oxirane, 35 °C (2h), r.t. (48h), 38% NaOH; (vi) pyrrolidine/azepane, anhydrous 2-PrOH, reflux (6h); (vii) anhydrous toluene, reflux (8h); (viii) saturated solution of (a) oxalic acid in anhydrous EtOH or (b) ethereal hydrogen chloride.
Molecules 23 02493 sch001
Figure 2. Relationships between number of carbon atoms forming the 2-/3-alkoxy side chain R (nc; alkoxy = butoxy to heptyloxy) and γ values (in N/m units) of the compounds 1ap.
Molecules 23 02493 g002
Figure 3. Chemical structure of the compounds JC-01al, effective local anesthetics [33], which were able to decrease surface tension of water [34].
Molecules 23 02493 g003
Figure 4. Two-dimensional biplot (mapping) showing both Principal Component 1 and 2 scores of the compounds 9′ap and loadings of extrapolated chromatographic (log kw; 1ap) and in silico lipophilicity variables, i.e., log PS-IT, XLOGP 2.0, XLOGP 3.0, ACLOGP, ALOGPs 2.1, miLogP 2.2, CLOGP 4.0, log PCr, log PV, log PB, MLOGP and ALOGP, respectively.
Molecules 23 02493 g004
Figure 5. Chemical structure of the derivatives of 2-/3-alkoxyphenylcarbamic acids JC-02al (alkoxy = propoxy to octyloxy), which were in vitro screened against MTv H37Rv, MK 235/80, MK 6509/96 and MA 330/80 [76], respectively.
Molecules 23 02493 g005
Figure 6. Two-dimensional mapping of the loadings of variables (variously colored vectors) indicating their (i) positions towards a circle of correlation; and (ii) relationships to both Principal Component 1 and 2. Numbering of the vectors was as follows: 1 (the vector built on the log (1/MIC [M]) values, which were observed after 14-d in vitro cultivation against MTv H37Rv), 2 (MTv H37Rv, 21-d), 3 (MK 235/80, 7-d), 4 (MA 330/80, 14-d), 5 (MK 235/80, 21-d), 6 (MK 235/80, 14-d), 7 (MK 6509/96, 14-d), 8 (MK 6509/96, 7-d), 9 (MA 330/80, 21-d), 10 (MK 6509/96, 21-d), 11 (MTa H37Ra, 7-d), 12 (MM, 21-d), 13 (MK DSM, 7-d) and 14 (MS, 3-d), respectively.
Molecules 23 02493 g006
Figure 7. Bilinear relationship between the γ (in N/m units) and log (1/MIC [M]) parameters resulting from 21-d in vitro screening of the 3-alkoxy substituted compounds 1eh and 1mp (alkoxy = butoxy to heptyloxy) against MA 330/80.
Molecules 23 02493 g007
Figure 8. Bilinear relationship between the log kw and log (1/MIC [M]) parameters resulting from 21-d in vitro screening of the 3-alkoxy substituted compounds 1eh and 1mp (alkoxy = butoxy to heptyloxy) against MA 330/80.
Molecules 23 02493 g008
Table 1. Chemical structure of evaluated compounds 1ap, their surface tension γ (relative surface activity; in N/m units), wavelengths of observed absorption maxima (λ1, λ2 (Ch-T), λ3) and logarithms of molar absorption coefficients (log ε1, log ε2 (Ch-T), log ε3) of compounds’ methanolic solutions (c = 8.0 × 10⁻⁵ M), which were investigated in the UV/Vis region of an electromagnetic spectrum.
Molecules 23 02493 i001
Comp.RXYγ (N/m)λ1log ε1λ2 (Ch-T)1 log ε2 (Ch-T)λ3log ε3
1a2-OC4H9AC0.064642084.512364.192803.63
1b2-OC5H11AC0.063662084.392364.052803.51
1c2-OC6H13AC0.062222084.582384.522783.49
1d2-OC7H15AC0.059852084.432364.082803.55
1e3-OC4H9AD0.063162104.652384.242793.59
1f3-OC5H11AD0.062852104.552374.272793.62
1g3-OC6H13AD0.061052104.542374.132793.48
1h3-OC7H15AD0.057862104.662374.272793.63
1i2-OC4H9BC0.063022084.442364.082803.57
1j2-OC5H11BC0.062062084.542364.222803.71
1k2-OC6H13BC0.060652084.422364.102803.57
1l2-OC7H15BC0.058532084.442364.142803.59
1m3-OC4H9BD0.062982104.522384.092793.44
1n3-OC5H11BD0.061542104.562384.182793.52
1o3-OC6H13BD0.059252104.522384.012793.37
1p3-OC7H15BD0.056922104.652384.202793.56
1 log ε2 (Ch-T), Logarithms of molar absorption coefficients observed at the charge-transfer absorption maximum λ2 (Ch-T) = 236–238 nm.
Table 2. Retention times tr (RP-HPLC) and lipophilicity indices log k (RP-HPLC) of the compounds 1ap estimated in the mobile phases with a various volume ratio (v/v) of a methanol (MeOH) organic modifier and water.
Comp.Mobile Phase MeOH/Water (v/v)
80:2085:1590:1095:5Pure MeOH
tr (min)log ktr (min)log ktr (min)log ktr (min)log ktr (min)log k
1a13.8830.716510.6940.57567.8300.39585.7660.20084.224−0.0403
1b17.2000.825412.6470.66569.4490.50646.5140.28414.5260.0203
1c25.6941.020616.9500.816211.2920.60537.4310.36835.2460.1287
1d31.0001.109219.6000.888213.5530.70227.8920.40525.3850.1573
1e10.3300.55846.9170.31835.4000.14783.822−0.14543.329−0.2956
1f12.4000.65749.2000.49116.2800.25464.022−0.09413.340−0.2913
1g17.2000.825411.4020.61047.4830.36795.1530.11823.583−0.2067
1h22.0030.952113.7010.71598.5320.45655.7880.20923.556−0.2153
1i24.0200.988116.9170.815311.6910.62407.7650.39545.1270.1205
1j29.5251.086320.0210.898113.0600.68288.5200.45095.2950.1449
1k47.1081.302327.0011.042416.5330.80389.6410.52216.9380.3303
1l70.0121.483138.8001.215222.6360.961911.6700.62717.7560.3996
1m15.7310.78059.2180.49226.4200.26954.6850.04243.519−0.2275
1n22.1830.950212.3700.65428.1560.42054.9950.09413.947−0.1047
1o29.1741.080713.6510.70599.6340.51745.0950.10954.127−0.0618
1p33.7191.148417.1290.821511.3320.60725.8010.20513.925−0.1102
Table 3. Extrapolated log kw parameters (RP-HPLC) of analyzed molecules 1ap and values of statistical descriptors (χ2red, RSS, R, Adj. R2, RMSE, NR, F and Prob > F), which characterized a linear relationship between the log k and ϕM values for a particular compound. The ϕM parameter was a volume fraction of MeOH in the isocratic elution RP-HPLC.
Comp.log kw1S2χ2red3RSS4R5Adj. R26RMSE7NR8F9Prob > F
1a3.76883.77680.00110.00340.99530.98750.03350.0580317.640.0001 ***
1b4.04543.98340.00180.00550.99310.98170.04290.0744215.170.0007 ***
1c4.60494.46340.00020.00070.99930.99820.01520.02632155.370.0001 ***
1d4.94874.77360.00110.00330.99710.99230.03320.0574518.150.0002 ***
1e4.02584.34340.00130.00380.99600.98940.03540.0614375.470.0003 ***
1f4.67224.96520.00280.00840.99320.98210.05300.0917219.790.0007 ***
1g4.94465.11280.00130.00400.99690.99190.03660.0634487.750.0002 ***
1h5.53845.68300.00420.01260.99230.97950.06480.1122192.510.0008 ***
1i4.46794.31020.00140.00420.99550.98790.03760.0652328.270.0004 ***
1j4.84664.66000.00160.00480.99560.98820.04010.0695337.190.0004 ***
1k5.23594.92860.00050.00170.99870.99640.02340.04061106.570.0001 ***
1l5.89665.51020.00070.00200.99880.99650.02590.04491127.920.0001 ***
1m4.70994.93160.00040.00130.99900.99720.02050.03561442.730.0001 ***
1n5.20875.33980.00110.00320.99780.99410.03250.0564673.050.0001 ***
1o5.65695.76280.00450.01340.99200.97890.06680.1157186.230.0009 ***
1p6.17496.26720.00220.00670.99660.99090.04740.0820438.0420.0001 ***
1S, Slope; 2χ2red, reduced chi-square; 3RSS, residual sum of squares; 4R, correlation coefficient; 5Adj. R2, adjusted coefficient of determination; 6RMSE, root mean squared error (standard deviation); 7NR, norm of residuals; 8F, Fisher’s significance ratio (Fisher’s F-test); 9Prob > F, probability of obtaining the F Ratio (significance of a whole model). Indication of a significance level of the F Ratio was as follows: *** (three stars), extremely significant.
Table 4. Values of logarithms of partition coefficients of basic (non-protonated) compounds 9′ap predicted for the octan-1-ol/water partitioning system by the Ghose and Crippen′s approach (log PCr), Viswanadhan′s principle (log PV), Broto′s algorithm (log PB) and CLOGP method (CLOGP 4.0), respectively, as well as by both XLOGP approaches (XLOGP 2.0 and XLOGP 3.0).
Molecules 23 02493 i002
Comp.RXlog PCrlog PVlog PBCLOGP
4.0
XLOGP
2.0
XLOGP
3.0
9′a2-OC4H9A4.594.454.516.234.525.14
9′b2-OC5H11A5.004.854.976.765.095.68
9′c2-OC6H13A5.425.245.427.295.666.22
9′d2-OC7H15A5.845.645.887.826.236.77
9′e3-OC4H9A4.594.454.516.234.525.14
9′f3-OC5H11A5.004.854.976.765.095.68
9′g3-OC6H13A5.425.245.427.295.666.22
9′h3-OC7H15A5.845.645.887.826.236.77
9′i2-OC4H9B5.425.245.427.355.245.86
9′j2-OC5H11B5.845.645.887.885.816.40
9′k2-OC6H13B6.266.046.338.416.386.84
9′l2-OC7H15B6.676.436.798.946.957.48
9′m3-OC4H9B5.425.245.427.355.245.86
9′n3-OC5H11B5.845.645.887.885.816.40
9′o3-OC6H13B6.266.046.338.416.386.84
9′p3-OC7H15B6.676.436.798.946.957.48
Table 5. Values of logarithms of partition coefficients of basic (non-protonated) compounds 9′ap predicted for the octan-1-ol/water partitioning system by the MLOGP, ACLOGP, miLogP 2.2, ALOGP, SILICOS-IT (log PS-IT) and ALOGPs 2.1 method, respectively.
Comp.MLOGPACLOGPmiLogP
2.2
ALOGPlog PS-ITALOGPs
2.1
9′a2.755.055.305.424.275.18
9′b2.965.525.805.874.685.57
9′c3.165.986.326.335.105.93
9′d3.366.456.816.795.536.25
9′e2.755.055.325.424.275.21
9′f2.965.525.835.874.685.61
9′g3.165.986.336.335.105.95
9′h3.366.456.846.795.536.32
9′i3.165.696.316.334.785.93
9′j3.366.166.816.795.206.23
9′k3.566.627.327.245.626.54
9′l3.767.087.827.706.046.77
9′m3.165.696.336.334.785.97
9′n3.366.166.846.795.206.27
9′o3.566.627.347.245.626.59
9′p3.767.087.857.706.046.83
Table 6. The in vitro activity (MIC values in μM units) of investigated compounds 1ap and reference drugs isoniazid (INH), ethambutol (EMB), ofloxacin (OFLX) and ciprofloxacin (CPX) against M. tuberculosis CNCTC My 331/88 (M. tuberculosis H37Rv; MTv H37Rv), M. tuberculosis H37Ra ATCC 25177 (MTa H37Ra), M. kansasii CNCTC My 235/80 (MK 235/80), M. kansasii 6509/96 (MK 6509/96) and M. kansasii DSM 44162 (MK DSM), respectively.
Comp.MIC [μM]
MTv
H37Rv
MTa
H37Ra
MK 235/80MK 6509/96MK
DSM
1 14-d2 21-d3 7-d7-d14-d21-d7-d14-d21-d7-d
1a323221362.562.562.53262.562.553
1b163252323262.5323262.526.1
1c16162532323216161612.7
1d8812.5161632816166.2
1e16328.132323216163216.2
1f1616<3.9161632816167.9
1g816<3.816161688163.8
1h48<3.78884481.9
1i16322033262.562.516323251
1j1632199163262.516323250
1k816195163262.516323298
1l4896163232161632382
1m81615.4161632816167.7
1n487.58884887.5
1o8167.3816164883.6
1p487.18884883.6
INH0.5136.5>250>250>25024829.2
EMB12122
OFLX120.5110.50.51
CPX48.33.0
1 14-d, 14-Day cultivation; 2 21-d, 21-day cultivation; 3 7-d, 7-day cultivation. The most promising values of compounds in vitro antimycobacterial activity (MIC ≤ 8 μM) were indicated in gray cells of Table 6.
Table 7. The in vitro activity (MIC values in μM units) of investigated compounds 1ap and reference drugs isoniazid (INH), ethambutol (EMB), ofloxacin (OFLX) and ciprofloxacin (CPX) against M. avium CNCTC My 330/80 (MA 330/80), M. smegmatis ATCC 700084 (MS) and M. marinum CAMP 5644 (MM), respectively.
Comp.MIC [μM]
MA 330/80MSMM
1 14-d2 21-d3 3-d21-d
1a125125213106
1b62.512510452
1c3262.55125.5
1d323224.912.5
1e62.562.516.232.5
1f323215.8<3.9
1g161615.4<3.8
1h81615.0<3.7
1i62.512520351
1j62.51256.250
1k3262.539098
1l3262.5382191
1m163230.715.4
1n161615.015.0
1o16167.37.3
1p16167.17.1
INH> 250> 250117467
EMB1616
OFLX3262.5
CPX0.40.8
1 14-d, 14-Day cultivation; 2 21-d, 21-day cultivation; 3 3-d, 3-day cultivation. The most promising values of compounds´ in vitro antimycobacterial activity (MIC ≤ 8 μM) were indicated in gray cells of Table 7.

