Article

Characterization of Odors of Wood by Gas Chromatography-Olfactometry with Removal of Extractives as Attempt to Control Indoor Air Quality

Research Institute of Wood Industry, Chinese Academy of Forestry, Beijing 100091, China
*
Author to whom correspondence should be addressed.
These authors contributed equally to this work.
Molecules 2018, 23(1), 203; https://doi.org/10.3390/molecules23010203
Submission received: 28 December 2017 / Revised: 12 January 2018 / Accepted: 15 January 2018 / Published: 18 January 2018

Abstract

:
Indoor air quality problems are usually revealed by occupants’ complaints. In this study, the odors of two types of hardwood species, namely, Cathy poplar (Populus cathayana Rehd.) and rubberwood (Hevea brasiliensis) were selected and extracted with ethanol-toluene for removal of extractives in an attempt to eliminate the odors. The odorous components of neat and extracted woods were identified by gas chromatography-mass spectrometry/olfactometry (GC-MS/O). The results showed that about 33 kinds of key volatile compounds (peak area above 0.2%) were detected from the GC-MS, and about 40 kinds of odorants were identified from GC-O. The components were concentrated between 15 and 33 min in GC-O, which was different from the concentration time in GC-MS. Lots of the odors identified from GC-O were unpleasant to humans, and variously described as stinky, burnt, leather, bug, herb, etc. These odors may originate from the thermos-oxidation of wood components. After extraction, the amounts and intensities of some odorants decreased, while some remained. However, the extraction process resulted in a benzene residue and led to increased benzene odor.

Graphical Abstract

1. Introduction

Odor has a direct effect on human behaviors and can significantly affect the quality of life [1]. It certainly plays an important role in human attractions, memories, and emotions, and can be described as pleasant, unpleasant, or indifferent [2]. Therefore, odor is one of many important factors for indoor air quality. Generally, the indoor air quality is strongly affected by volatile compounds emitted from materials such as furniture, carpet, textile, plant and humans [3,4,5]. Among these, wood has been widely used indoors for a long time. Although the odor of wood is often described as pleasant with positive associations, some people are hypersensitive to certain species like padauk (Pterocarpus indicus Willd.). Besides, people are concerned with several issues regarding odors, such as the relationship between unpleasant odors and health problems [6]. The odor of wood originates from the volatile organic compounds (VOCs) which are highly relevant to the extractives [7].
Wood extractives are rich in volatiles, typically with several hundred different constituent VOCs in individual species [8,9,10]. Although many of the VOCs are not odorous in nature, a broad overview of the volatiles hitherto detected in diverse woods offers insights into prospective main odor-active candidates that contribute to wood odor [11]. Therefore, numerous studies have been carried out for identification of the specific class of extractives [12,13,14,15,16]. However, not all VOCs contribute to odor because it depends on whether the concentration of the VOC is higher than the human threshold odor concentration [2]. Hitherto, there are few reports on the odor of natural woods. One particular study on the odor-active substances of wood was carried out by Culleré et al. [17] who investigated the odor of acacia, chestnut, cherry, ash and oak chips by gas chromatography-olfactometry (GC-O). Different odorants were detected, including phenolic compounds, as well as compounds arising from the degradation of wood carbohydrates and lipids. Similar studies were performed based on GC-O on toasted and non-toasted oak woods by Díaz-Maroto et al. [18], Poplar, Pine, and Basswood by Wang et al. [19], and cedar by Schreiner et al. [20].
GC-O consists of gas chromatography-mass spectrometry (GC-MS) coupling with an olfactometric detection. It is essential to identify compounds with odor because they are usually a minor set of eluting compounds, which depends on the human nose and shows high sensitivity and reproducibility [21]. It has been widely used in many areas ranging from daily necessities to chemical products [22,23,24,25,26,27]. Therefore, it can be an optimal instrument for odor testing. With the developing of costumed furniture, the wood products are heavily used indoors, and the odor annoyance arises due to the woods. Cathy poplar (Populus cathayana Rehd.) is a kind of fast growing tree and widely used for costumed furniture in China. Rubberwood (Hevea brasiliensis) is also been used for solid wood flooring and furniture while it contains lots of gum with strong smells. Both of the woods can affect the indoor air quality. Therefore, in this study, the two types of woods were selected for odor identification. Considering the high connection between extractives and odor, the woods were extracted with ethanol-toluene as an attempt to eliminate odor. The aim of this study was to investigate the odors of the two kinds of wood and whether the extraction can be a good method to eliminate the odor, which is important for the controlling of indoor air quality. The odorous components of neat and extracted woods were identified by GC-MS/O. Besides, the chemical components of the woods are analyzed.

2. Results and Discussion

2.1. Chemical Components

The results of the chemical components of the wood samples are listed in Table 1. According to the related standards, the deviations in the parentheses should not be larger than 0.04%. The analysis can be helpful for better understanding the contents of chemical components as well as extractives in the woods. It can be seen that the extractives of RW were higher than that of CP. The α-cellulose contents of the two woods were almost the same, while the content of holocelluloses of RW was higher than that of CP. By calculating the content differences between holocelluloses and α-cellulose, a rough estimate content value of hemicelluloses can be obtained [28]. The results indicated the RW owned the higher hemicelluloses content than CP. As for the lignin contents, RW was higher.

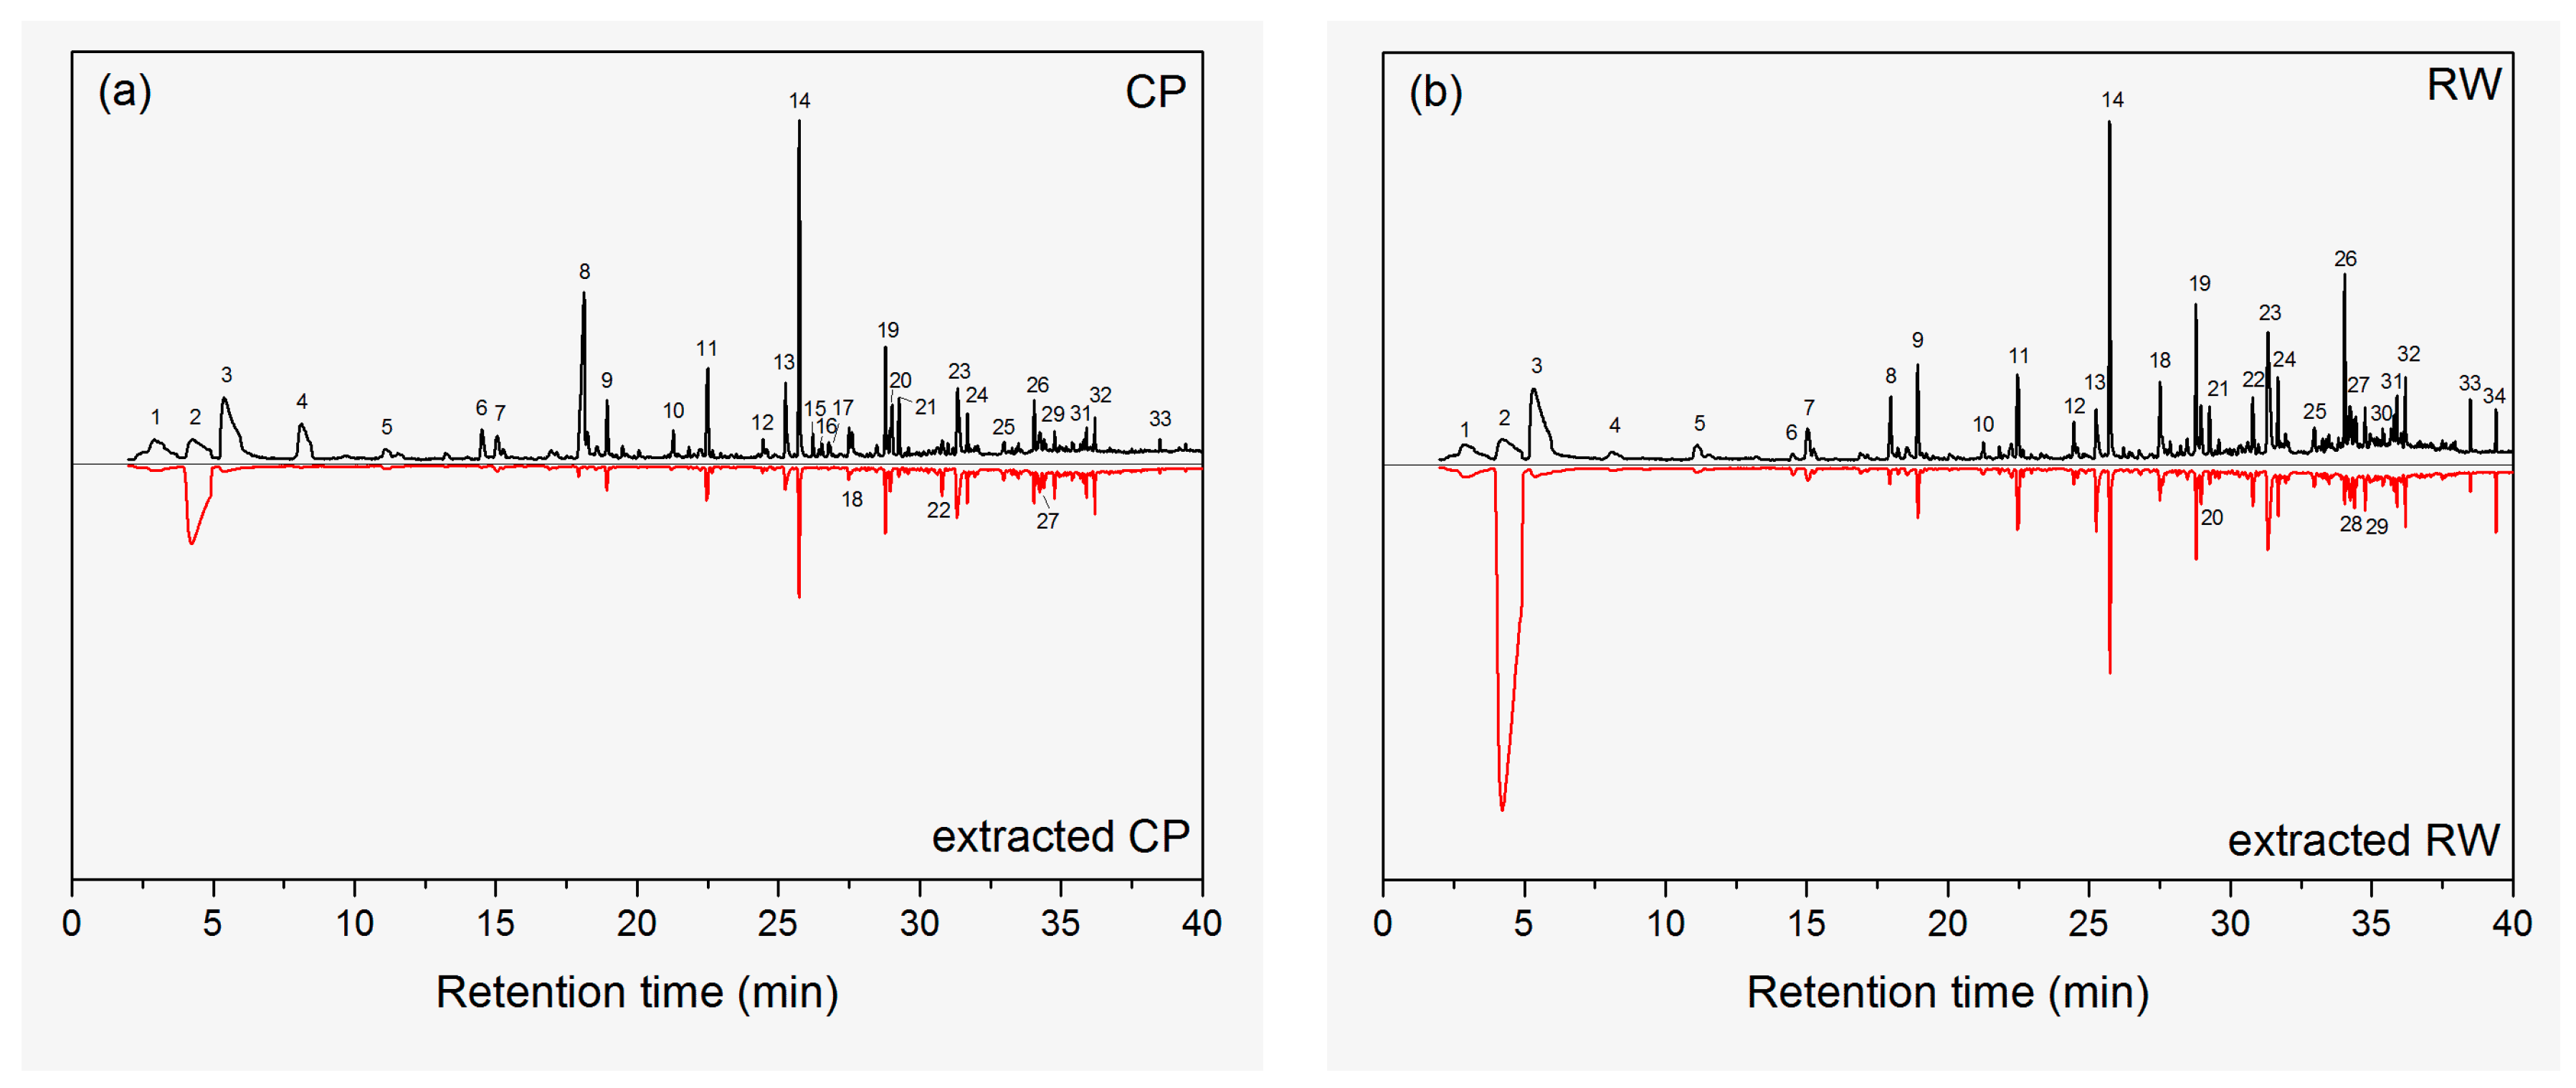
2.2. Identification of VOCs

As regards the origin of the compounds detected by GC-O, it must be taken into account that only some of the VOCs extracted from the woods are originally present in this material in significant amounts. Therefore, it was very important to know the key VOCs extracted from the woods. Figure 1 shows the GC-MS chromatograms of neat and extracted wood samples. The key compounds with peak area above 0.2% are detected from the chromatograms and the results are listed in Table 2. In general, these compounds can be classified into alkanes, aldehydes, alcohols, aromatics, ketones, carboxylic acids, esters, and miscellaneous (silane derivatives). About 33 kinds of key VOCs were identified in both CP and RW. However, the types and contents of the VOCs were varied like the content of 2,4-di-tert-butylphenol (peak 26) was much higher in RW than that in CP. CP and RW had some common VOCs, such as ethanol (peak 1), benzene (peak 2), acetic acid (peak 3), and so on. Some are unique for certain wood. For example, hexyltrimethoxysilane (peak 15), 4-oxononanal (peak 16), and (E)-2-decenal (peak 17) were not identified in RW, while tetradecanal (peak 28), 2-methyl-hetadecane (peak 30), and dibutyl phthalate (peak 34) were not identified in CP. Among these compounds, the tetradecane (peak 14) showed the largest intensity, but the percentages were not higher than acetic acid (peak 3). Hexanoic acid (peak 8), tridecane (peak 11), pentadecane (peak 19), 1-dodecanol (peak 23) also had relative high intensities compared with other compounds.
The ethanol-benzene extraction process resulted in significant reduction in the contents of VOCs. For example, the percentages of acetic acid (peak 3) were 14.8% and 16.3% in neat CP and RW, respectively. After extraction, the values both decreased to 1%. Besides, the contents of some compounds in CP like hexanal (peak 4), furfural (peak 5), 1,3-dichlorobenzene (peak 7), pentanoic acid (peak 6), heptanoic acid (peak 10), octanoic acid (peak 12), hexyltrimethoxysilane (peak 15), 4-oxononanal (peak 16), (E)-2-decenal (peak 17), n-octyltriethoxysilane (peak 21), and 1,2-benzene-dicarboxylic acid bis(2-methylpropyl) ester (peak 33) significantly decreased to lowest detecting limits. Therefore, there were only 20 kinds of key compounds identified after extraction. Similar results were found in RW, suggesting the removal of these compounds. Considering the classification, the contents of aldehydes, carboxylic acids, and miscellaneous considerably decreased. This should be explained by their non-polar characters and solubility in ethanol-benzene.
Pelaez-Samaniego et al. [29] had extracted wood fiber with hot water, and also mentioned the content of acetic acid and aromatics rapidly decreased. The amounts of alkanes, alcohols, ketones, and esters almost remained, which indicated the extraction method has little effect on the removal of these compounds. Aromatics of 1,3-dichloro-benzene (peak 7) also showed considerably reduced contents after extraction. It should be noted that the contents of pentadecane (peak 19), (E)-6,10-dimethyl-5,9-undecadien-2-one (peak 22), hexadecane (peak 24), 2,6,10-trimethylpentadecane (peak 25), 2,6,10,14-tetramethyl-pentadecane (peak 27), cedrol (peak 29), (4-octyldodecyl)-cyclopentane (peak 31), benzoic acid 2-ethylhexyl ester (peak 32) increased in CP after extraction, which might account for the removal of other compounds while the contents of these components were remained. Another remarkably increased intensity after extraction is found for benzene (peak 2), which should be associated with the solvent residue.

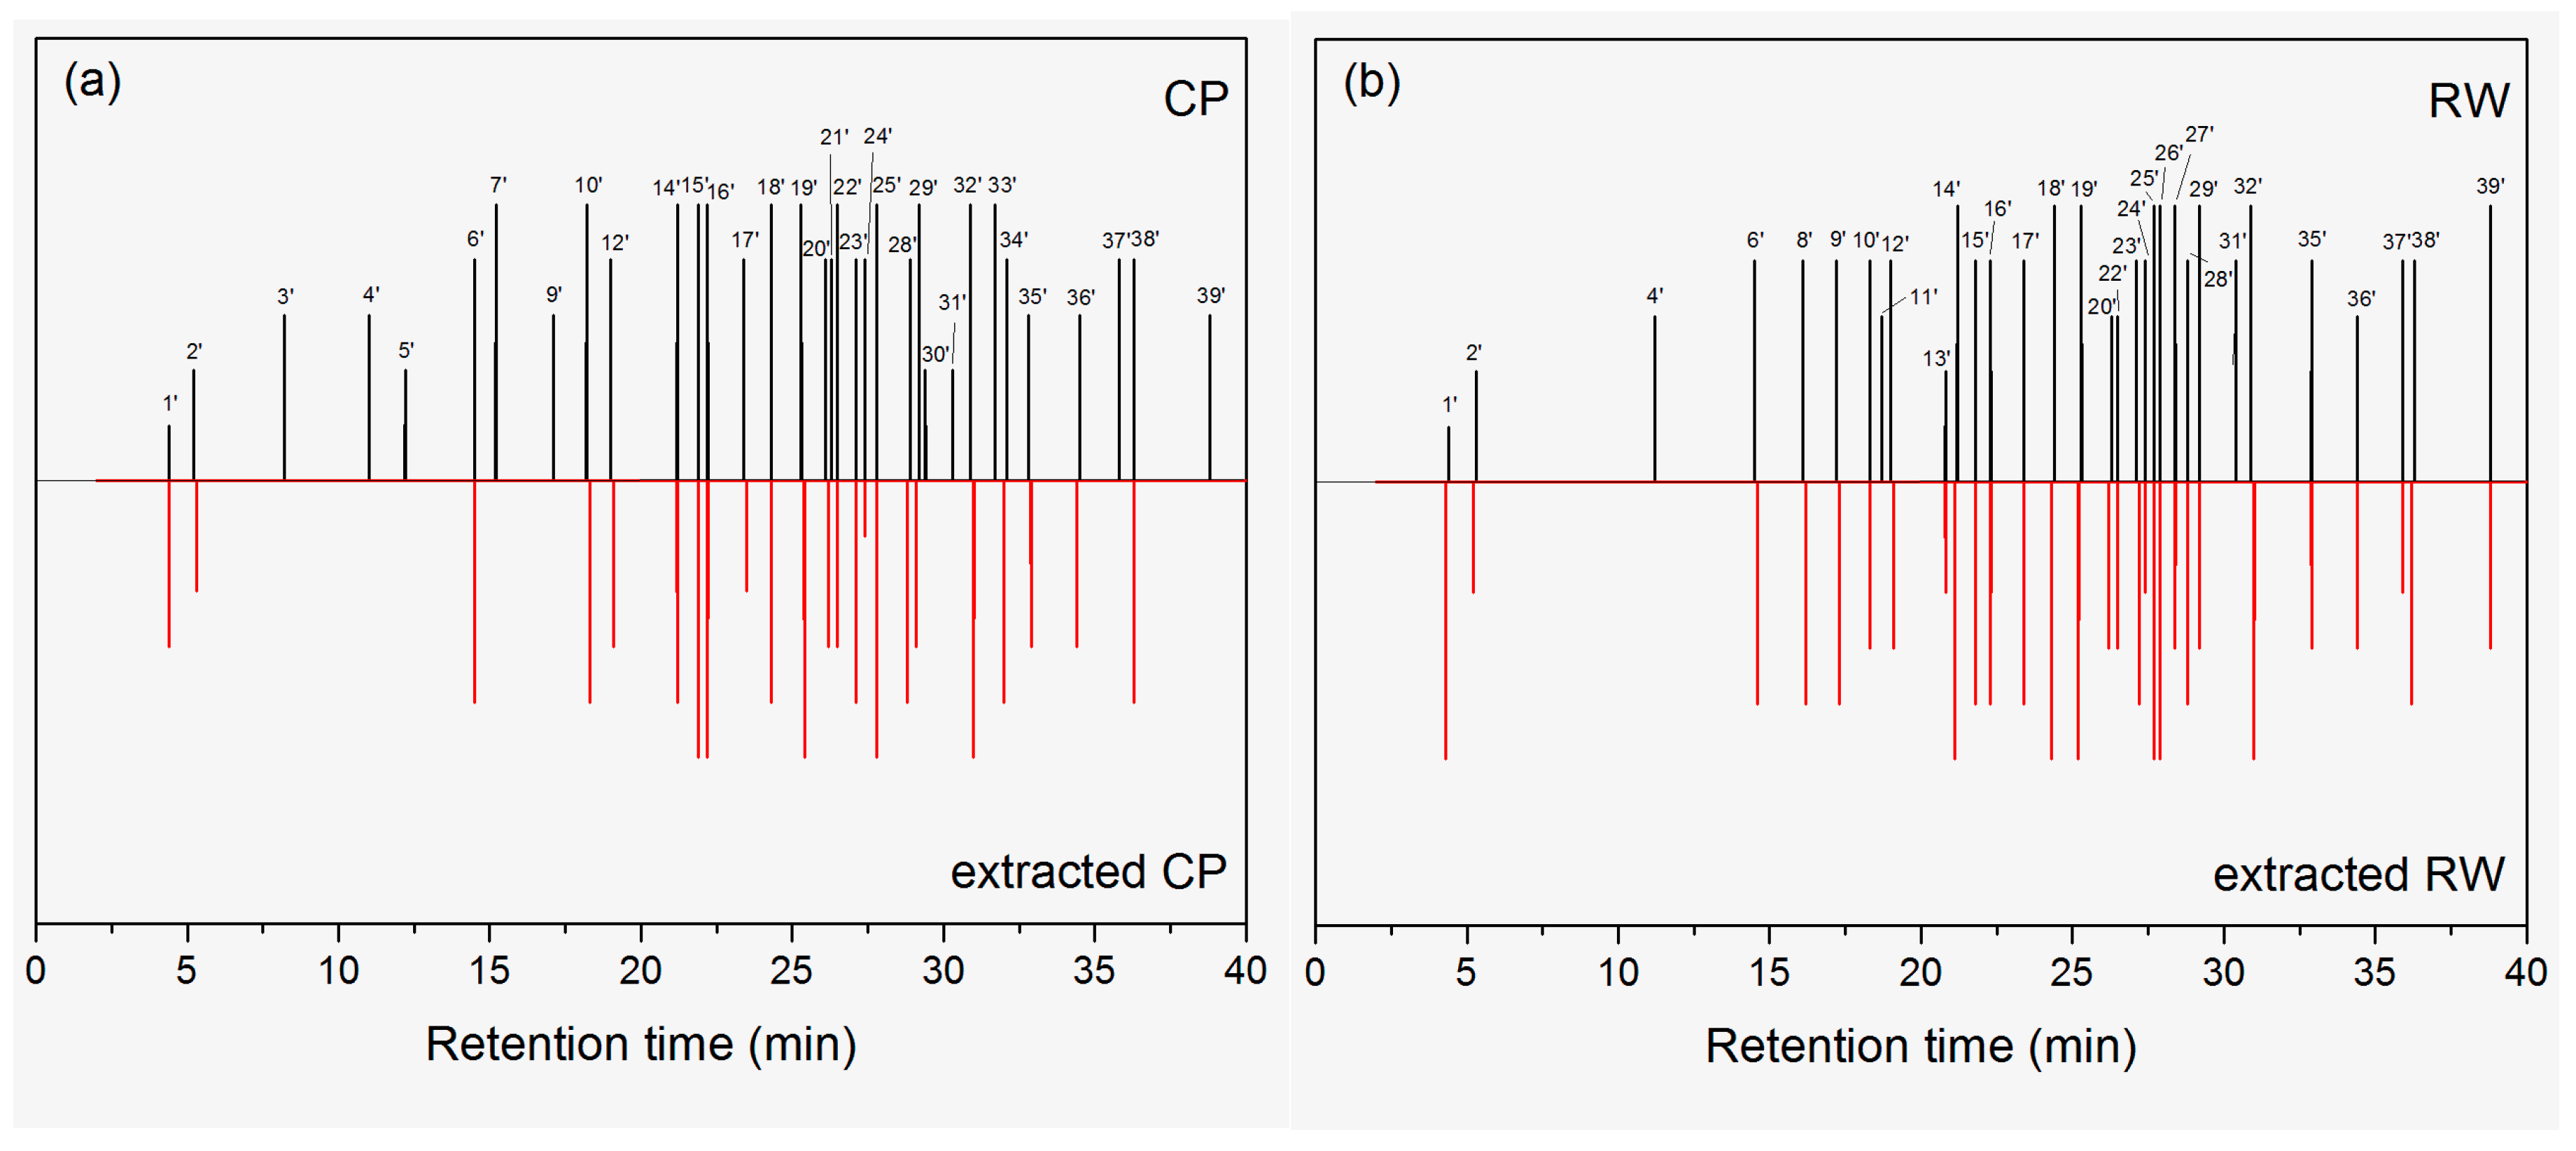
2.3. Characterization of Odors

The odor images of neat and extracted wood samples tested by GC-O are shown in Figure 2. About 40 kinds of odors were identified. The time was concentrated from 15 to 36 min, which was different with the concentration time of VOCs in GC-MS, indicating that some VOCs did not contribute to the odors. Table 3 lists the odorants and odor descriptors of neat and extracted wood samples. These odors are described according to judgments of the panelists and then amended on the basis of the literatures [22,23,24,25,26,27]. From Table 2, it is clear that most odors are unpleasant. These odorants can be classified into alkanes, aldehydes, alcohols, aromatics, carboxylic acids, esters, and miscellaneous (silane derivatives). However, these compounds were not corresponding to the key VOCs. For example, some high concentration of alkanes like tridecane (peak 11), tetradecane (peak 14), pentadecane (peak 19), and hexadecane (peak 24) had small smells. Among the alkanes only 2,6,10-trimethylpentadecane (peak 27) offered an odor, which was described as gasoline and bronze- like. Félix et al. [30] investigated the odor of wood-plastic composites and also found little influence of alkanes on the odor of the composites. Some compounds lower than 0.2% caused significantly strong smells for both CP and RW, such as 2-nonenal (peak 15’), 1-methoxy-4-(2-propenyl)-benzene (peak 16’), 5,5,8-trimethyl-3,6,7-nonatrien-2-one (peak 17’), (E,E)-2,4-decadienal (peak 25’) and 8-methyl-1-undecene (peak 32’). Between the retention times of 20 to 36 min, lots of odorants are emitted. However, these compounds are unpleasant to humans, except for hexadecanoic acid (21’) at 26.3 min in CP and nonanoic acid (peak 24’) at 27.4 min. These unpleasant compounds are usually described as stinky, burnt, leather, bug, herb, etc. Ezquerro et al. [31] mentioned that the unacceptable odor in packaging materials, such as the hexanoic acid is related to the thermo-oxidative degradation of cellulose. Therefore, the extraction method cannot remove it. At the later stage of testing from 37 to 40 min, some perfumed smells existed and the odors are described as milk, fruit, cake, and grass.
For neat CP, 34 kinds of odors were identified, where seven kinds were unique. Hexanal (bitter, green) was identified in both CP and RW. However, the percentage was only 1.2% in RW, which was 1/5 to that in CP. Therefore, the odor intensity was 0 in RW. Another six unique odors were not identified in GC-MS, while they all had strong smells. They were 2-furancarboxaldehyde (special, grain), octanal (fruit, soap), hexadecanoic acid (fruit, sour), 2-methylpropanoic acid, 3-hydroxy-2,4,4-trimethylpentyl ester (sour, bitter, herb), 1-tetradecanol (dirt, bronze), and 1-pentadecanol (bronze). The very strong odors are 12 kinds: octanal (fruit, soap), hexanoic acid (cheese, fishy), heptanoic acid (stinky, leather, bug), 2-nonenal (stinky, fat, iris), 1-methoxy-4-(2-propenyl)-benzene (bitter, herb, burnt), octanoic acid (stinky, fat, bug), (Z)-2-decenal (stinky, fat, herb), 4-oxononanal (herb), (E,E)-2,4-decadienal (animal, burnt), n-octyltriethoxysilane (burnt, bug), 8-methyl-1-undecene (paint, dirt), and 1-tetradecanol (dirt, bronze). These odors are all unpleasant. For neat RW, 32 kinds of odors were identified, where five kinds were unique. These compounds were 5-methyl-2-furancarboxaldehyde (chocolate, coconut), 2-octenal (bitter), α-methyl-α-2,5,7-octatrienylbenzenemethanol (bitter, nut), 3,7-dimethyl-2,6-octadien-1-ol, acetate (stinky, bug), and 2-undecenal (citrus, fishy, herb), which were trace in the amount of VOCs. The very strong odors of RW were heptanoic acid (stinky, leather, bug), octanoic acid (stinky, fat, bug), (Z)-2-decenal (stinky, fat, herb), (E,E)-2,4-decadienal (animal, burnt), 3,7-dimethyl-2,6-octadien-1-ol, acetate (stinky, bug), 2-undecenal (citrus, fishy, herb), n-octyl-triethoxysilane (burnt, bug), 8-methyl-1-undecene (paint, dirt), and 1,2-benzenedicarboxylic acid, bis(2-methylpropyl) ester (cake, grass), where 8/9 were unpleasant. By comparing the odors between CP and RW, the dominant odorants (intensity above 4) were 16 kinds: pentanoic acid (cheese, paint), hexanoic acid (stinky, leather, bug), nonanal (flower, fat), heptanoic acid (stinky, leather, bug), 2-nonenal (stinky, fat, iris), 1-methoxy-4-(2-propenyl)-benzene (bitter, herb, burnt), 5,5,8-trimethyl-3,6,7-nonatrien-2-one (stinky, chemical, bug), octanoic acid (stinky, fat, bug), (Z)-2-decenal (stinky, fat, herb), (E)-2-decenal (kerosene, herb), nonanoic acid (milk), (E,E)-2,4-decadienal (animal, burnt), dodecanal (mint, pungent), n-octyltriethoxysilane (burnt, bug), 8-methyl-1-undecene (paint, dirt), octadecanal (bronze, grease), and benzoic acid, 2-ethylhexyl ester (milk, fruit).
After ethanol-benzene extraction, both the amounts and intensities of odors decreased in both CP and RW, suggesting the extraction process had removed some kinds of odorants, such as hexanoic acid (cheese, fishy), nonanal (flower, fat), n-octyltriethoxysilane (burnt, bug), decanoic acid (herb), octadecanal (bronze, grease), and 1,2-benzenedicarboxylic acid, bis(2-methylpropyl) ester (cake, grass) and so on. However, some kinds odors remained their intensities, such as acetic acid (irritant, sour), pentanoic acid (cheese, paint), 2-nonenal (stinky, fat, iris), 1-methoxy-4-(2-propenyl)-benzene (bitter, herb, burnt), (Z)-2-decenal (stinky, fat, herb), (E)-2-decenal (kerosene, herb), (E,E)-2,4-decadienal (animal, burnt), dodecanal (mint, pungent), 8-methyl-1-undecene (paint, dirt), cedrol (fat, wood), benzoic acid, 2-ethylhexyl ester (milk, fruit) and so on though the amount percentages was reduced in GC-MS. In addition, consistent with the results of GC-MS, the residue of benzene caused increase of odor, which was described as gasoline and solvent.
As mentioned above, the uncomfortable odors originated from the thermos-oxidation. Maybe the temperature had a tremendous influence on these odorants. Further study can focus on the effects of temperature on the odor release or try to find another effective odor elimination process.

3. Materials and Methods
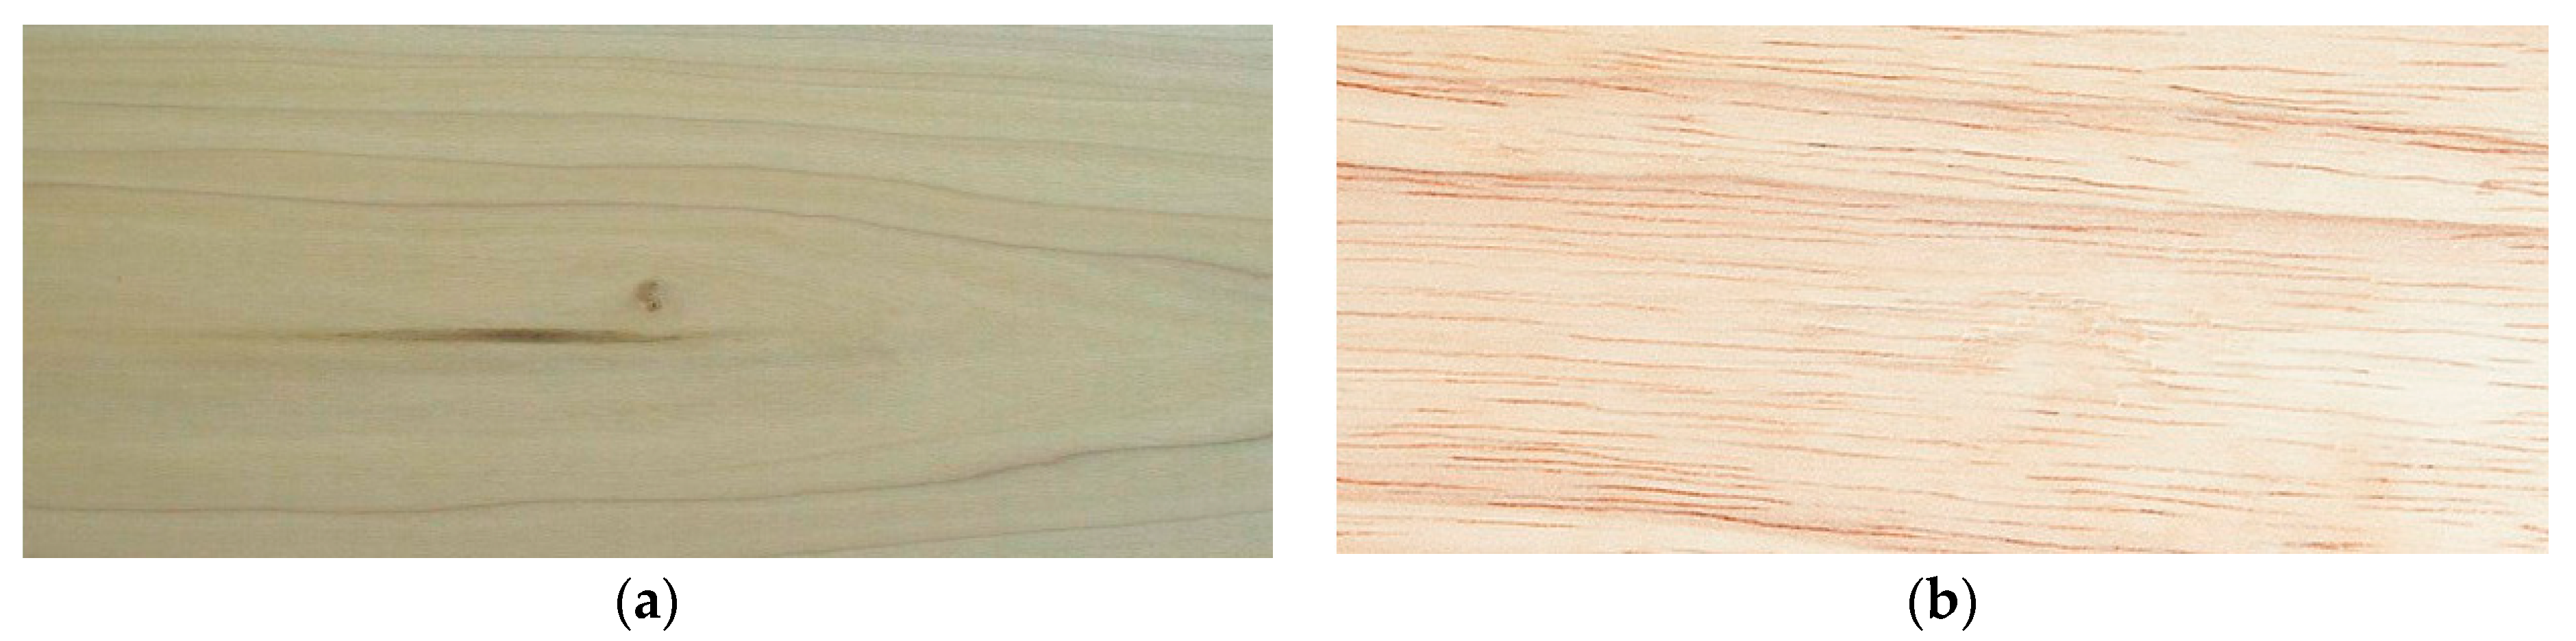
3.1. Materials

The two kinds of wood were harvested from forests and then bucked into lumbers. The lumbers were air dried for at least 3 months to eliminate excessive water. Both the kinds of wood were provided by at least three providers from a single origin and analyzed to ensure their uniformity. The average growth ring widths, densities and origins of place are presented in Table 4. The sapwood was chosen without bark and visible defects such as knots, decay, and so on. Figure 3 shows tangential sections of the two kinds of wood. The wood samples were ground into fibers of 40–60 mesh consistent with the particle sizes about 50 μm.

3.2. Analyisis of Chemical Components

The wood fiber was extracted in a Soxhlet extractor with a 1:2 mixture of ethanol and toluene (v/v) for 6 h, followed by a second extraction with ethanol for 4 h to remove extractives. The extracted wood fiber was dried in an oven at 103 ± 2 °C to reach a constant weight. The content of extractives was calculated. The chemical components of the natural fibers for holocelluloses, α-cellulose, and lignin contents were performed according to chlorite method, TAPPI 203 cm-09, and TAPPI T 222 om-11, respectively [32].

3.3. Odor Characterization

The odor characterization experiment was tested by a GC-MS (QP-2010, Shimadzu, Shimane, Japan) combined with an olfactory port (OP 275, GL Sciences, Shimane, Japan) connected by a flow splitter to the column exit. Separation was achieved using a DB-WAX column (30 m × 0.25 mm × 0.25 μm, J&W Scientific Inc., Folsom, CA, USA) with a temperature program at 40 °C (3 min) to 230 °C (5 min) at 6 °C/min with helium as carrier gas (1.8 mL/min). The mass spectrometer was operated in electron impact mode (70 eV) and the masses were scanned over a range of 35–350 m/z. The transmission line temperature was 250 °C and the ion source temperature was 200 °C.
About 3 g wood fiber sample was added into a 15 mL headspace bottle and conditioned at 60 °C in a water bath for 40 min and the extraction occurred at the same temperature for 40 min. Desorption was carried out in the GC injection port.
Sensory assessments were carried out by a panel of four judges (two females and two males, 26 years old on average) from the Laboratory of Brewing Microbiology and Applied Enzymology at Jiangnan University. The panelists were trained for 3 months in GC-O using at least 30 odor-active reference compounds in a concentration 10 times above their odor thresholds in air. Sniffing time was approximately 40 min. During a GC run described above, the nose of a panelist was placed close to the sniffing port, responded to the aroma intensity of the stimulus, and recorded the aroma descriptor and intensity value as well as retention time. A six-point scale ranging from 0 to 5 was used for intensity judgment: 0 = none, 1 = very weak, 2 = weak, 3 = moderate, 4 = strong, and 5 = very strong.
The odorants were identified by comparing the MS spectra to the National Institute of Standards and Technology (NIST) library (https://www.nist.gov). The primary odor compounds were identified by mass spectrometry, retention time, and odor characterization.

4. Conclusions

About 40 kinds of odors and their relevant components of woods were identified by GC-O. These odorants were classified into alkanes, aldehydes, alcohols, aromatics, carboxylic acids, esters, and miscellaneous (silane derivatives). By comparing the time and intensity of odorants occurring in GC-O and that of VOCs occurring in GC-MS, no good relationship was found, which means that some high contents of VOCs did not contribute to the odors. The removal of extractives showed mostly reduced quantities and intensities of odors. However, some odors were unaffected. An increase of benzene residue was also observed. Many of the odors identified in woods were unpleasant to humans. The retention time was concentrated between 25 and 36 min described as stinky, burnt, leather, bug, herb, etc., which mainly originated from the thermos-oxidation of wood components. This study was helpful to understand the indoor air quality caused by wood. To mitigate the odor problem, a further study can focus on the effects of temperature on the odor release or try to find another effective odor elimination process.

Acknowledgments

This study was financially supported by the National Key Research and Development Program of China (No. 2016YFD0600706).

Author Contributions

Ru Liu and Chen Wang performed the experiments, analyzed the data, and wrote the manuscript; Anmin Huang conceived and designed the experiments; Bin Lv contributed to the materials and analysis tools.

Conflicts of Interest

The authors declare no conflict of interest.

References

  1. Kasper, P.L.; Mannebeck, D.; Oxbøl, A.; Nygaard, J.V.; Hansen, M.J.; Feilberg, A. Effects of dilution systems in olfactometry on the recovery of typical livestock odorants determined by PTR-MS. Sensors 2017, 17, 1859. [Google Scholar] [CrossRef] [PubMed]
  2. Brattoli, M.; Cisternino, E.; Dambruoso, P.R.; de Gennaro, G.; Giungato, P.; Mazzone, A.; Palmisani, J.; Tutino, M. Gas chromatography analysis with olfactometric detection (GC-O) as a useful methodology for chemical characterization of odorous compounds. Sensors 2013, 13, 16759–16800. [Google Scholar] [CrossRef] [PubMed]
  3. Peng, C.; Lan, C.; Wu, T. Investigation of indoor chemical pollutants and perceived odor in an area with complaints of unpleasant odors. Build. Environ. 2009, 44, 2106–2113. [Google Scholar] [CrossRef]
  4. Bitter, F.; Müller, B.; Müller, D. Estimation of odour intensity of indoor air pollutants from building materials with a multi-gas sensor system. Build. Environ. 2010, 45, 197–204. [Google Scholar] [CrossRef]
  5. Liu, W.; Zhang, Y.; Yao, Y.; Li, J. Indoor decorating and refurbishing materials and furniture volatile organic compounds emission labeling systems: A review. Chin. Sci. Bull. 2012, 57, 2533–2543. [Google Scholar] [CrossRef]
  6. Rosenkranz, H.S.; Cunningham, A.R. Environmental odors and health hazards. Sci. Total Environ. 2003, 313, 15–24. [Google Scholar] [CrossRef]
  7. Ka, M.H.; Choi, E.H.; Chun, H.S.; Lee, K.G. Antioxidative activity of volatile extracts isolated from Angelica tenuissimae roots, peppermint leaves, pine needles, and sweet flag leaves. J. Agric. Food Chem. 2005, 53, 4124–4129. [Google Scholar] [CrossRef] [PubMed]
  8. Uçar, G.; Balaban, M. Volatile wood extractives of black pine (Pinus nigra Arnold) grown in Eastern Thrace. Eur. J. Wood Prod. 2001, 59, 301–305. [Google Scholar] [CrossRef]
  9. Xu, K.; Feng, J.; Zhong, T.; Zheng, Z.; Chen, T. Effects of volatile chemical components of wood species on mould growth susceptibility and termite attack resistance of wood plastic composites. Int. Biodeterior. Biodegrad. 2015, 100, 106–115. [Google Scholar] [CrossRef]
  10. Vainio-Kaila, T.; Hanninen, T.; Kyyhkynen, A.; Ohlmeyer, M.; Siitonen, A.; Rautkari, L. Effect of volatile organic compounds from Pinus sylvestris and Picea abies on Staphylococcus aureus, Escherichia coli, Streptococcus pneumoniae and Salmonella enterica serovar Typhimurium. Holzforschung 2017, 71, 905–912. [Google Scholar] [CrossRef]
  11. Schreiner, L.; Beauchamp, J.; Buettner, A. Characterisation of odorants in wood and related products: Strategies, methodologies, and achievements. In Proceedings of the International Conference “Wood Science and Engineering in the Third Millennium”—ICWSE 2017, Brasov, Romania, 2–4 November 2017. [Google Scholar]
  12. Risholm-Sundman, M.; Lundgren, M.; Vestin, E.; Herder, P. Emissions of acetic acid and other volatile organic compounds from different species of solid wood. Holz Roh Werkst. 1998, 56, 125–129. [Google Scholar] [CrossRef]
  13. Manninen, A.M.; Pasanen, P.; Holopainen, J.K. Comparing the VOC emissions between air-dried and heat-treated Scots pine wood. Atmos. Environ. 2002, 36, 1763–1768. [Google Scholar] [CrossRef]
  14. Ekeberg, D.; Flæte, P.O.; Eikenes, M.; Fongen, M.; Naess-Andresen, C.F. Qualitative and quantitative determination of extractives in heartwood of Scots pine (Pinussylvestris L.) by gas chromatography. J. Chromatogr. A 2006, 1109, 267–272. [Google Scholar] [CrossRef] [PubMed]
  15. Widhalm, B.; Ters, T.; Srebotnik, E.; Rieder-Gradinger, C. Reduction of aldehydes and terpenes within pine wood by microbial activity. Holzforschung 2016, 70, 895–900. [Google Scholar] [CrossRef]
  16. Sassoli, M.; Taiti, C.; Nissim, W.G.; Costa, C.; Mancuso, S.; Menesatti, P.; Fioravanti, M. Characterization of VOC emission profile of different wood species during moisture cycles. iForest 2017, 10, 576–584. [Google Scholar] [CrossRef]
  17. Culleré, L.; de Simón, B.F.; Cadahía, E.; Ferreira, V.; Hernández-Orte, P.; Cacho, J. Characterization by gas chromatography–olfactometry of the most odor-active compounds in extracts prepared from acacia, chestnut, cherry, ash and oak woods. LWT-Food Sci. Technol. 2013, 53, 240–248. [Google Scholar] [CrossRef]
  18. Díaz-Maroto, M.C.; Guchu, E.; Castro-Vázquez, L.; de Torres, C.; Pérez-Coello, M.S. Aroma-active compounds of American, French, Hungarian and Russian oak woods, studied by GC-MS and GC-O. Flavour Fragr. J. 2008, 23, 93–98. [Google Scholar] [CrossRef]
  19. Wang, Q.; Shao, Y.; Cao, T.; Shen, J. Identification of key odor compounds from three kinds of wood species. In Proceedings of the 2017 International Conference on Environmental Science and Sustainable Energy (ESSE2017), Suzhou, China, 23–25 June 2017. [Google Scholar]
  20. Schreiner, L.; Loos, H.M.; Buettner, A. Identification of odorants in wood of Calocedrus decurrens (Torr.) Florin by aroma extract dilution analysis and two-dimensional gas chromatography–mass spectrometry/olfactometry. Anal. Bioanal. Chem. 2017, 409, 3719–3729. [Google Scholar] [CrossRef] [PubMed]
  21. Ai, N.; Liu, H.; Wang, J.; Zhang, X.; Zhang, H.; Chen, H.; Huang, M.; Liu, Y.; Zheng, F.; Sun, B. Triple-channel comparative analysis of volatile flavour composition in raw whole and skim milk via electronic nose, GC-MS and GC-O. Anal. Methods 2015, 7, 4278–4284. [Google Scholar] [CrossRef]
  22. Pripdeevech, P.; Khummueng, W.; Park, S.K. Identification of odor-active components of agarwood essential oils from Thailand by solid phase microextraction-GC/MS and GC-O. J. Essent. Oil Res. 2011, 23, 46–53. [Google Scholar] [CrossRef]
  23. Gao, W.; Fan, W.; Xu, Y. Characterization of the key odorants in light aroma type Chinese liquor by gas chromatography-olfactometry, quantitative measurements, aroma recombination, and omission studies. J. Agric. Food Chem. 2014, 62, 5796–5804. [Google Scholar] [CrossRef] [PubMed]
  24. Soso, S.B.; Koziel, J.A. Analysis of odorants in marking fluid of siberian tiger (Panthera tigris altaica) using simultaneous sensory and chemical analysis with headspace solid-phase microextraction and multidimensional gas chromatography-mass spectrometry-olfactometry. Molecules 2016, 21, 834. [Google Scholar] [CrossRef] [PubMed]
  25. Xiao, Z.; Fan, B.; Niu, Y.; Wu, M.; Liu, J.; Ma, S. Characterization of odor-active compounds of various Chrysanthemum essential oils by gas chromatography–olfactometry, gas chromatography–mass spectrometry and their correlation with sensory attributes. J. Chromatogr. B 2016, 1009–1010, 152–162. [Google Scholar] [CrossRef] [PubMed]
  26. Denk, P.; Buettner, A. Sensory characterization and identification of odorous constituents in acrylic adhesives. Int. J. Adhes. Adhes. 2017, 78, 182–188. [Google Scholar] [CrossRef]
  27. Elsharif, S.A.; Buettner, A. Influence of the chemical structure on the odor characters of β-citronellol and its oxygenated derivatives. Food Chem. 2017, 232, 704–711. [Google Scholar] [CrossRef] [PubMed]
  28. Wang, W.; Cao, J.; Cui, F.; Wang, X. Effect of pH on chemical components and mechanical properties of thermally modified wood. Wood Fiber Sci. 2012, 44, 46–53. [Google Scholar]
  29. Pelaez-Samaniego, M.R.; Yadama, V.; Lowell, E.; Amidon, T.E.; Chaffee, T.L. Hot water extracted wood fiber for production of wood plastic composites (WPCs). Holzforschung 2012, 67, 193–200. [Google Scholar] [CrossRef]
  30. Félix, J.S.; Domeño, C.; Nerín, C. Characterization of wood plastic composites made from landfill-derived plastic and sawdust: Volatile compounds and olfactometric analysis. Waste Manag. 2013, 33, 645–655. [Google Scholar] [CrossRef] [PubMed]
  31. Ezquerro, O.; Pons, B.; Tena, M.T. Development of a headspace solid-phase microextraction–gas chromatography–mass spectrometry method for the identification of odour-causing volatile compounds in packaging materials. J. Chromatogr. A 2002, 963, 381–392. [Google Scholar] [CrossRef]
  32. Ou, R.; Xie, Y.; Wolcott, M.P.; Sui, S.; Wang, Q. Morphology, mechanical properties, and dimensional stability of wood particle/high density polyethylene composites: Effect of removal of wood cell wall composition. Mater. Des. 2014, 58, 339–345. [Google Scholar] [CrossRef]
Sample Availability: All the Samples of the compounds are available from the authors.
Figure 1. GC-MS chromatograms of neat and extracted wood samples. Peak numbers are listed in Table 2.
Molecules 23 00203 g001
Figure 2. Odor images of neat and extracted wood samples tested by GC-O. Peak numbers are listed in Table 3.
Molecules 23 00203 g002
Figure 3. Images of tangential sections of the two kinds of wood. (a) CP; (b) RW.
Molecules 23 00203 g003
Table 1. Chemical components of woods.
LabelsExtractives (%) *Holocelluloses (%)α-Cellulose (%)Lignin (%)
CP2.87 (0.02)61.33 (0.01)44.24 (0.01)23.26 (0.03)
RW4.67 (0.03)67.11 (0.02)43.78 (0.02)26.07 (0.01)
* The extractives refer to benzene-ethanol soluble extractives. The values in the parentheses are the deviations of four replicates.
Table 2. Identified key compounds from GC-MS of neat and extracted wood samples.
Peak NumberRetention Time (min)CompoundsClassificationPercentage (%) *
CPExtracted CPRWExtracted RW
12.92EthanolAlcohol2.3 (0.2)1.41.9 (0.1)1.0
24.23BenzeneAromatic5.6 (0.6)32.8 (0.5)5.9 (0.2)68.5 (0.9)
35.41Acetic acidCarboxylic acid14.8 (0.2)1.016.3 (0.2)1.0
48.10HexanalAldehyde6.6 (0.2)-1.20.3
511.13FurfuralAldehyde1.0-1.5 (0.1)0.3
614.50Pentanoic acidCarboxylic acid1.8-0.40.3
715.061,3-DichlorobenzeneAromatic1.6-2.1 (0.2)0.5
818.12Hexanoic acidCarboxylic acid10.8 (0.4)0.81.9 (0.1)0.3
918.94NonanalAldehyde2.2 (0.2)1.32.8 (0.2)1.0
1021.32Heptanoic acidCarboxylic acid0.9-0.40.2
1122.50TridecaneAlkane3.5 (0.2)3.0 (0.2)3.2 (0.1)1.5
1224.46Octanoic acidCarboxylic acid0.5-0.90.2
1325.26(Z)-2-DecenalAldehyde2.8 (0.2)2.1 (0.1)2.2 (0.1)1.6 (0.1)
1425.73TetradecaneAlkane9.2 (0.5)9.0 (0.5)8.3 (0.1)3.2 (0.1)
1526.21HexyltrimethoxysilaneMiscellaneous0.2---
1626.534-OxononanalAldehyde0.2---
1726.78(E)-2-DecenalAldehyde0.7---
1827.51Nonanoic acidCarboxylic acid0.90.42.3 (0.2)0.6
1928.78PentadecaneAlkane3.0 (0.2)4.0 (0.3)3.5 (0.2)1.3
2029.02DodecanalAldehyde2.2 (0.1)1.6 (0.1)1.40.6
2129.27n-OctyltriethoxysilaneMiscellaneous1.5-1.20.2
2230.79(E)-6,10-Dimethyl-5,9-undecadien-2-oneKetone0.71.21.40.7
2331.351-DodecanolAlcohol3.6 (0.1)3.1 (0.1)6.8 (0.3)3.0 (0.2)
2431.69HexadecaneAlkane1.32.01.90.7
2532.982,6,10-Trimethyl-pentadecaneAlkane0.51.01.00.4
2634.052,4-di-tert-ButylphenolAlcohol1.00.73.4 (0.1)0.4
2734.252,6,10,14-Tetramethyl-pentadecaneAlkane1.12.31.30.8
2834.45TetradecanalAldehyde--0.70.4
2934.76CedrolAlcohol0.61.21.00.6
3035.402-Methyl-hetadecaneAlkane--0.5-
3135.90(4-Octyldodecyl)-cyclopentaneAlkane0.50.91.10.4
3236.20Benzoic acid 2-ethylhexyl esterEster0.71.21.30.6
3338.511,2-Benzenedicarboxylic acid bis(2-methylpropyl) esterEster0.2-0.70.2
3439.40Dibutyl phthalateEster--0.60.5
* The percentage was calculated based on the peak area. The values in the parentheses are the deviations of four replicates. Deviations lower than 0.5% are not listed in the Table.
Table 3. Odorants and odor descriptors of neat and extracted wood samples.
Peak Number in GC-O/MSRetention Time (min)OdorantOdor DescriptorIntensity
CPExtracted CPRWExtracted RW
1’/24.4BenzeneGasoline, solvent1315
2’/35.2Acetic acidIrritant, sour2222
3’/48.2HexanalBitter, green3000
4’/511.1FurfuralNut3030
5’/-12.22-Furan-carboxaldehydeSpecial, grain2000
6’/614.5Pentanoic acidCheese, paint4444
7’/-15.2OctanalFruit, soap5000
8’/-16.15-Methyl-2-furan-carboxaldehydeChocolate, coconut0044
9’/-17.1Decamethyl-cyclopentasiloxaneBread, nut3044
10’/818.2Hexanoic acidCheese, fishy5443
11’/-18.72-OctenalBitter0030
12’/919.0NonanalFlower, fat4343
13’/-20.8α-Methyl-α-2,5,7-octatrienyl-benzenemethanolBitter, nut0022
14’/1021.2Heptanoic acidStink, leather, bug5455
15’/-21.92-NonenalStink, fat, iris5544
16’/-22.21-Methoxy-4-(2-propenyl)-benzeneBitter, herb, burnt5544
17’/-23.45,5,8-Trimethyl-3,6,7-nonatrien-2-oneStink, chemical, bug4244
18’/1224.4Octanoic acidStink, fat, bug5455
19’/1325.3(Z)-2-DecenalStink, fat, herb5555
20’/1526.1HexyltrimethoxysilaneIrritant, stink, herb4333
21’/-26.3Hexadecanoic acidFruit, sour4000
22’/1626.54-OxononanalHerb5333
23’/1727.0(E)-2-DecenalKerosene, herb4444
24’/1827.4Nonanoic acidMilk4142
25’/-27.8(E,E)-2,4-DecadienalAnimal, burnt5555
26’/-27.93,7-Dimethyl-2,6-octadien-1-ol, acetateStink, bug0055
27’/-28.42-UndecenalCitrus, fishy, herb0053
28’/2028.8DodecanalMint, pungent4444
29’/2129.2n-Octyl-triethoxysilaneBurnt, bug5353
30’/-29.42-Methylpropanoic acid, 3-hydroxy-2,4,4-trimethylpentyl esterSour, bitter, herb2000
31’/-30.3Decanoic acidHerb2040
32’/-31.08-Methyl-1-undecenePaint, dirt5555
33’/-31.71-TetradecanolDirt, bronze5000
34’/-32.11-PentadecanolBronze4400
35’/2532.82,6,10-Trimethyl-pentadecaneGasoline, bronze3343
36’/2934.6CedrolFat, wood3333
37’/-35.9OctadecanalBronze, grease4042
38’/3236.3Benzoic acid, 2-ethylhexyl esterMilk, fruit4444
39’/3338.81,2-Benzene dicarboxylic acid, bis(2-methylpropyl) esterCake, grass3053
The unpleasant odors are highlighted in character shading. The intensities were determined on agreements of four judges.
Table 4. Average growth ring widths, densities, and origins of place of the woods.
LabelWoodScientific NameAverage Growth Ring Width (cm)Density (g/cm3) *Origin of Place
CPCathy poplarPopulus cathayana Rehd.0.60.49–0.52Hebei, China
RWRubberwoodHevea brasiliensis0.20.64–0.67Hainan, China
* The density values of six replicates were tested at moisture contents about 12%.

