Article

Structure Identification and In Vitro Anticancer Activity of Lathyrol-3-phenylacetate-5,15-diacetate

1
Key Laboratory of Molecular and Clinical Pharmacology, School of Pharmaceutical Sciences and the Fifth Affiliated Hospital, Guangzhou Medical University, Guangzhou 511436, China
2
Infinitus (China) Company Ltd., Jiangmen 529156, China
3
Pediatric Department, Guangdong Women and Children Hospital and Health Institute, Guangzhou 511400, China
4
School of Chinese Medicine, Hong Kong Baptist University, Hong Kong, China
*
Authors to whom correspondence should be addressed.
Molecules 2017, 22(9), 1412; https://doi.org/10.3390/molecules22091412
Submission received: 7 August 2017 / Accepted: 22 August 2017 / Published: 25 August 2017
(This article belongs to the Collection Natural Products: Anticancer Potential and Beyond)

Abstract

:
Natural products from the genus Euphorbia show attention-attracting activities, such as anticancer activity. In this article, classical isolation and structure identification were used in a study on Caper Euphorbia Seed. Subsequently, MTT and wound healing assays, flow cytometry, western blotting, Hoechst 33258 staining and fluorescence microscopy examination were applied to investigate the anticancer activity of the obtained compounds. In a result, lathyrol-3-phenyl- acetate-5,15-diacetate (deoxy Euphorbia factor L1, DEFL1) was isolated from Caper Euphorbia Seed. Moreover, the NMR signals were totally assigned. DEFL1 showed potent inhibition against lung cancer A549 cells, with an IC50 value of 17.51 ± 0.85 μM. Furthermore, DEFL1 suppressed wound healing of A549 cells in a concentration-dependent manner. Mechanically, DEFL1 induced apoptosis, with involvement of an increase of reactive oxygen species (ROS), decrease of mitochondrial membrane potential (ΔΨm), release of cytochrome c, activity raise of caspase-9 and 3. Characteristic features of apoptosis were observed by fluorescence microscopy. In summary, DEFL1 inhibited growth and induced apoptosis in lung cancer A549 cells via a mitochondrial pathway.

Graphical Abstract

1. Introduction

Cancer has become the increasing public health problem and the major threat to human health for its high morbidity and mortality [1,2,3]. Under current understanding, chemotherapy is one of the key treatment methods, which has achieved great therapeutic success for certain malignant tumors [4,5,6]. However, some aspects are limiting factors of chemotherapy, including side effects and resistance, particularly multi-drug resistance (MDR) [7,8,9]. Thus, developing novel drugs with better efficacy to treat cancer is the effective strategy [10,11,12].
Natural resources are still the key provider of novel drugs despite the development of combinatorial chemistry, which can synthesize thousands of compounds quickly [13,14]. Euphorbia is the largest genus of the spurge family, containing more than 2000 species, some of which have been applied as medicinal plants to treat various diseases, including cancer [15]. Caper Euphorbia Seed, used as a Traditional Chinese Medicine is the seeds of Euphorbia lathyris L. [16]. The main constituents of Caper Euphorbia Seed are lathyrane diterpenoids [17], and a series of diterpenes L1–L8 based on the lathyrane skeleton have been isolated from the seeds. The biological activities of these lathyrane-type diterpenes have been studied, showing cytotoxicity to cancer cells and the ability to reverse MDR [18,19].
As part of ongoing research, we have exhaustively investigated Caper Euphorbia Seed, examining the chemical isolation and structure identification of its components and their pharmacological aspects [20,21,22,23]. During these studies, lathyrol-3-phenylacetate-5,15-diacetate (deoxy Euphorbia factor L1, DEFL1) was isolated from Caper Euphorbia Seed. In this article we report its structure identification and total NMR signal assignment. Furthermore, DEFL1 was shown to inhibit the growth of and induce apoptosis in A549 cells via a mitochondrial pathway.

2. Results

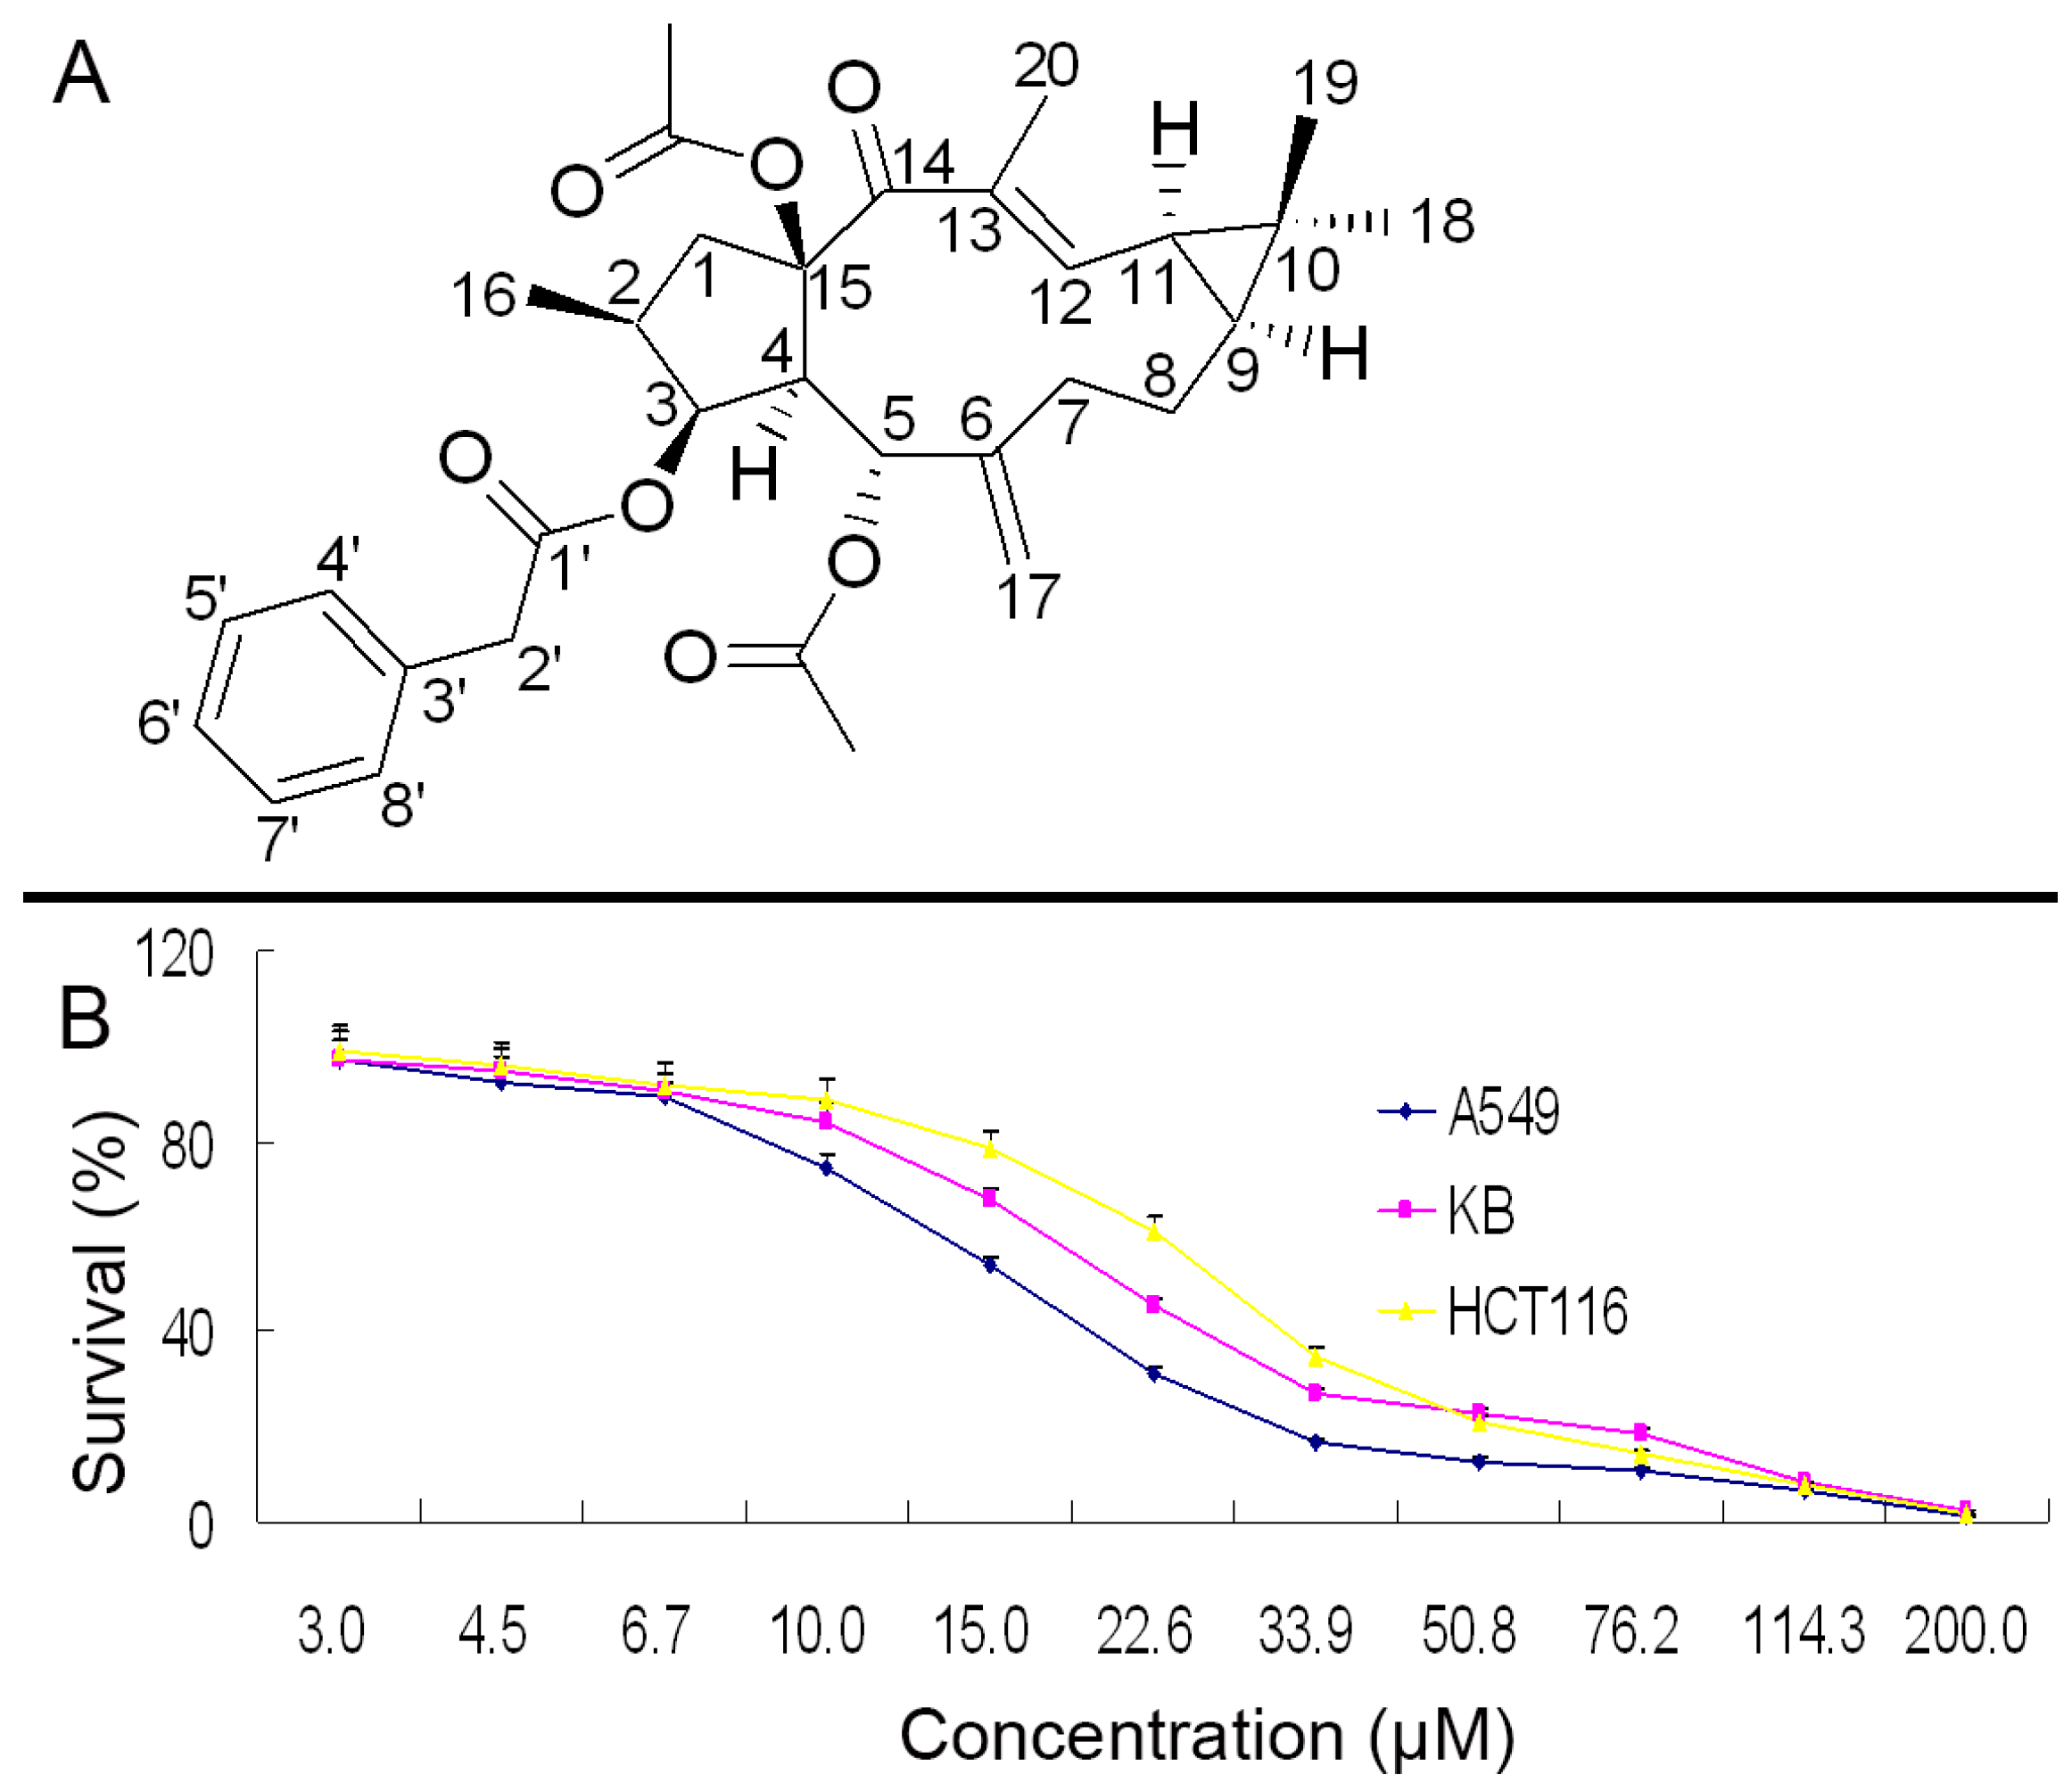
2.1. Structure Identification and NMR Signal Assignments

Lathyrol-3-phenylacetate-5,15-diacetate (deoxy Euphorbia factor L1, DEFL1) was obtained as white flaky crystals. Colorless crystals were obtained from dichloromethane-petroleum ether. The molecular formula C32H40O7 was determined by high resolution mass spectrometry (HRMS) showing m/z 537.2848 (M + H), which indicates 13 degrees of unsaturation. The 1H-NMR spectrum displayed five benzene protons with chemical shifts between 7.15 and 7.50. Moreover, 30 carbon signals were visible in the 13C-NMR data. The information supplied by the molecular formula, 1H-NMR and 13C-NMR implied that DEFL1 contains one monosubstituted benzene ring. The 13C-NMR spectrum also showed four carbonyls at 196.8, 171.3, 170.7 and 169.8 ppm. The DEPT spectrum indicated that DEFL1 has six methyl carbons, five methylene carbons, ten methine carbons, and nine quaternary carbons. The 1H-, 13C-NMR and heteronuclear multiple bond correlation (HMBC) data listed in Table 1, together with the data in reference [19] allowed the full assignment of the 1D NMR signals and the determination of the structure as shown in Figure 1A.

2.2. Growth Inhibition in A549, KB and HCT116 Cells

The growth suppression results of DEFL1 were determined by an MTT assay to give IC50 values of 17.51 ± 0.85, 24.07 ± 1.06, and 27.18 ± 1.21 μM for A549, KB and HCT116 cells, respectively (Figure 1B). Among these three cancer cell lines, A549 cells showed the most sensitivity (p < 0.05), thus A549 cells were selected for further investigation.

2.3. Suppressed Wound Healing in A549 Cells

To further determine the growth inhibition of DEFL1, a wound healing assay was performed, which could also measure cell migration ability [4]. After A549 cells were treated with the indicated concentrations of DEFL1 for 12, 24, 48 h, the percentage of wound healing was determined (Figure 2). At 12 h, the healing percentages were 23.72 ± 2.21%, 11.86 ± 1.72% and 6.70 ± 1.14% for control, 18.0 and 36.0 μM DEFL1, respectively. At 24 h, the healing percentages were 36.89 ± 1.78%, 21.09 ± 2.58% and 15.68 ± 2.09% for control, 18.0 and 36.0 μM DEFL1, respectively. At 48 h, the healing percentages were 50.02 ± 1.49%, 37.47 ± 1.98% and 22.48 ± 1.70% for control, 18.0 and 36.0 μM DEFL1, respectively. These results implied that DEFL1 suppressed the proliferation and migration of A549 cells.

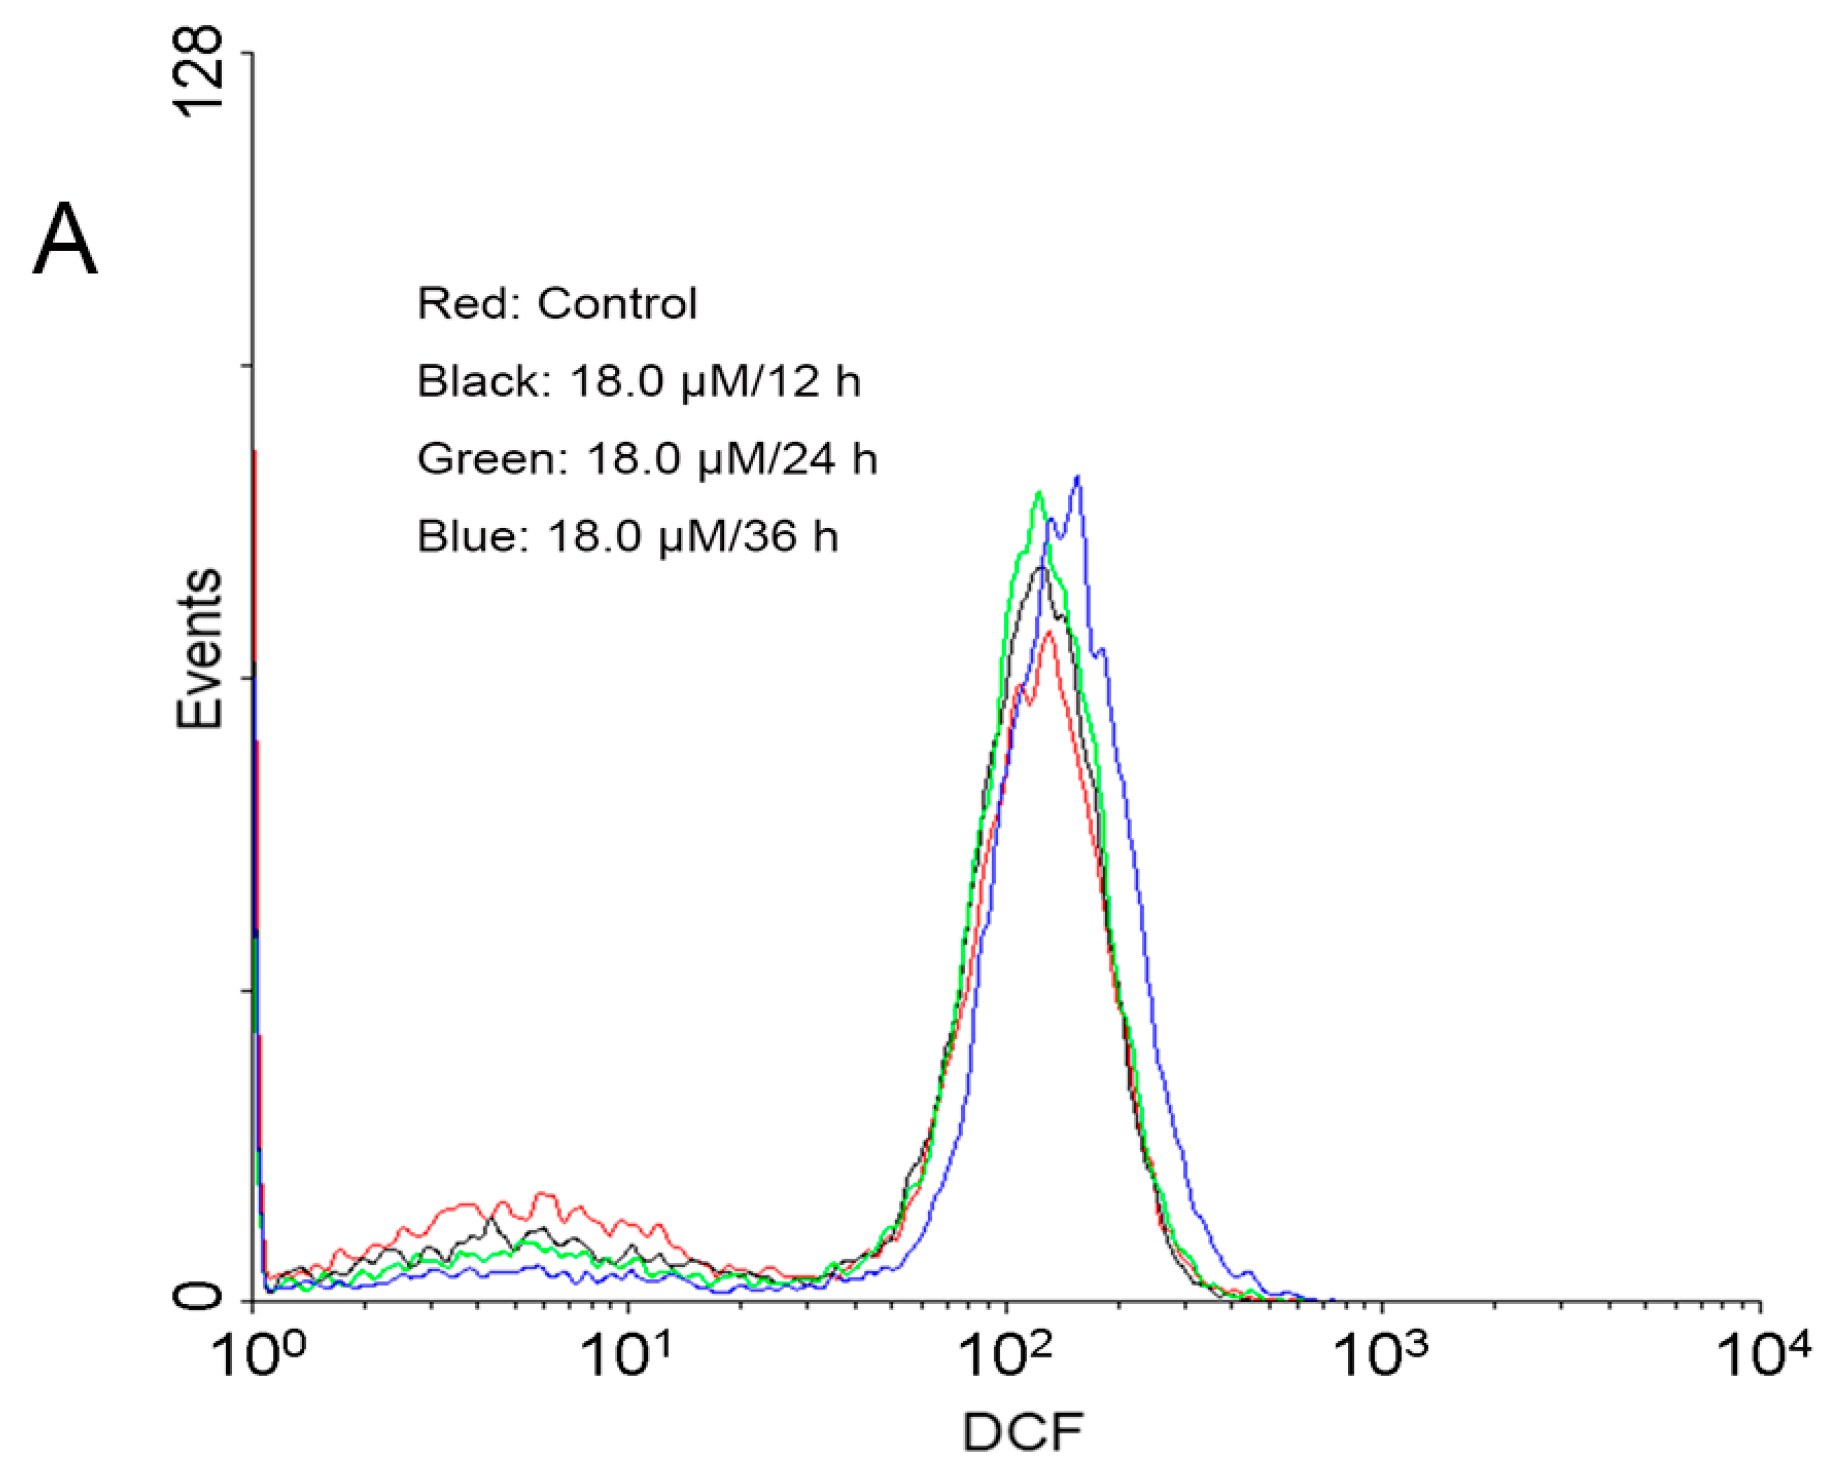
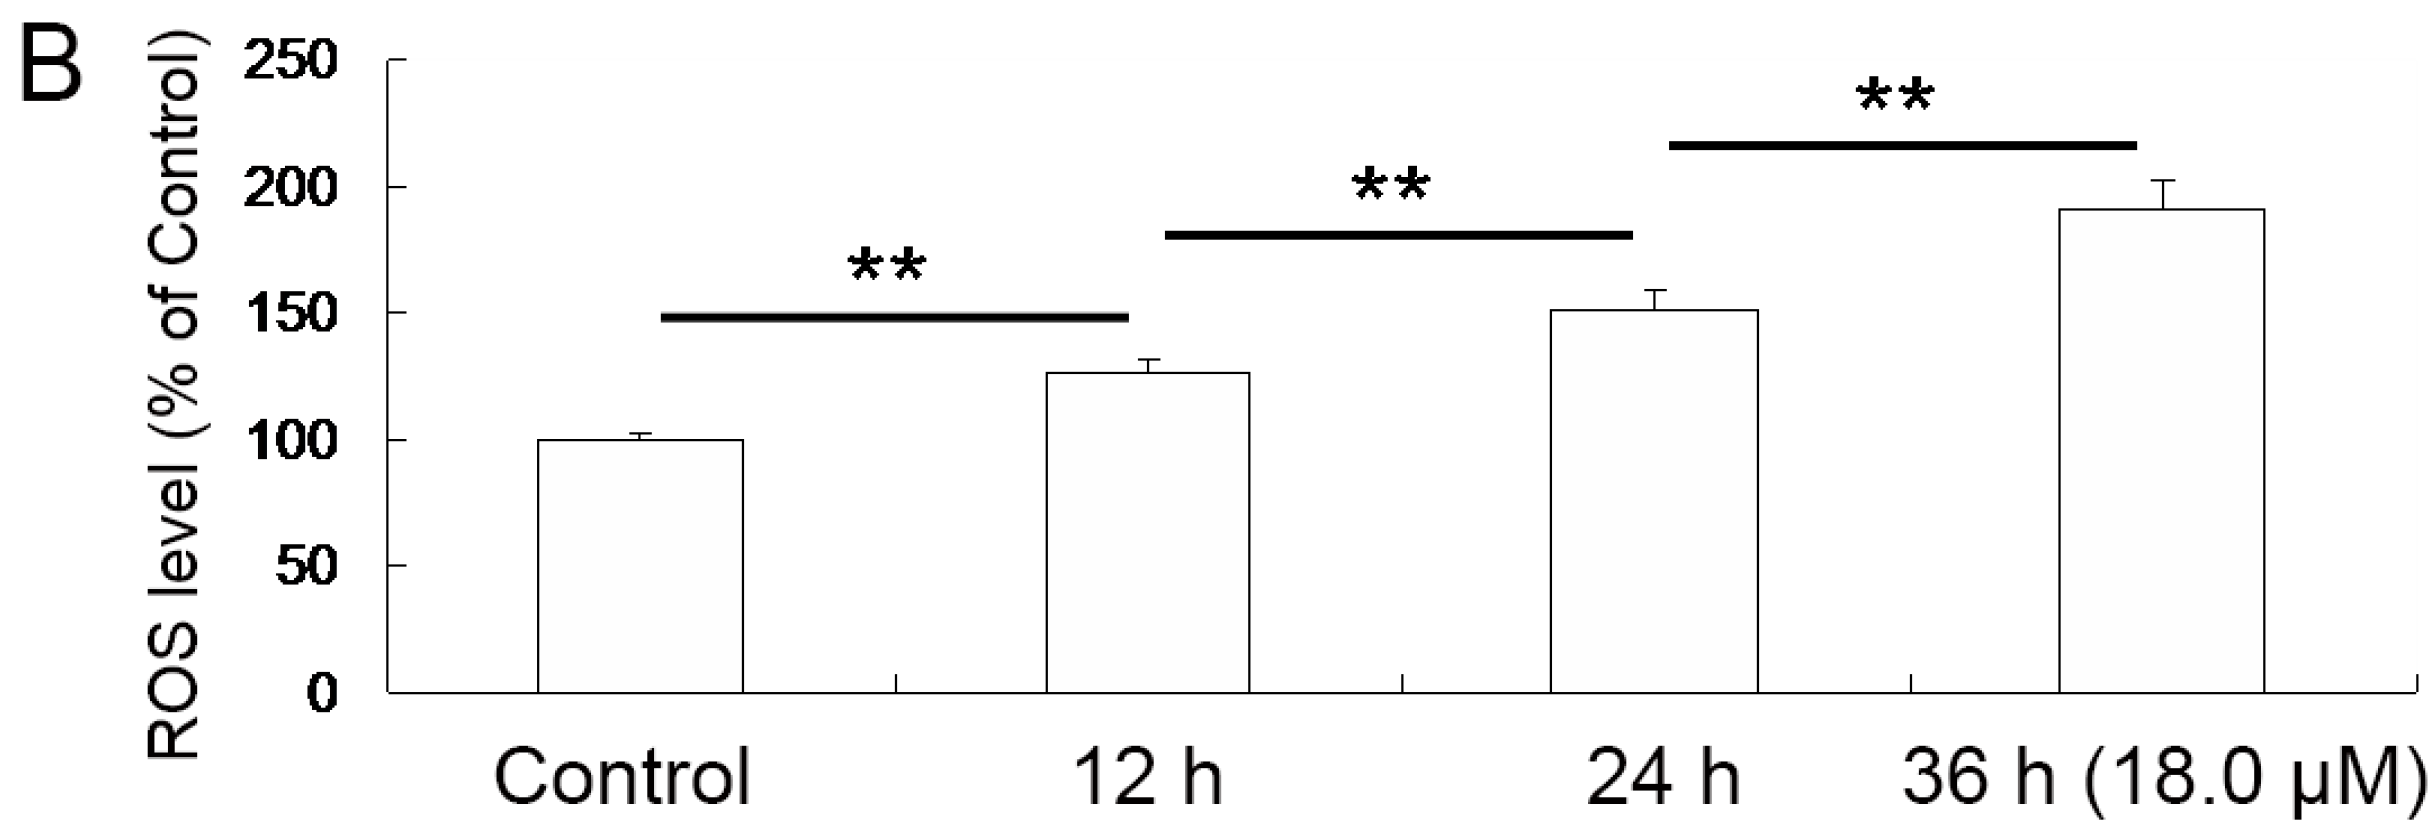
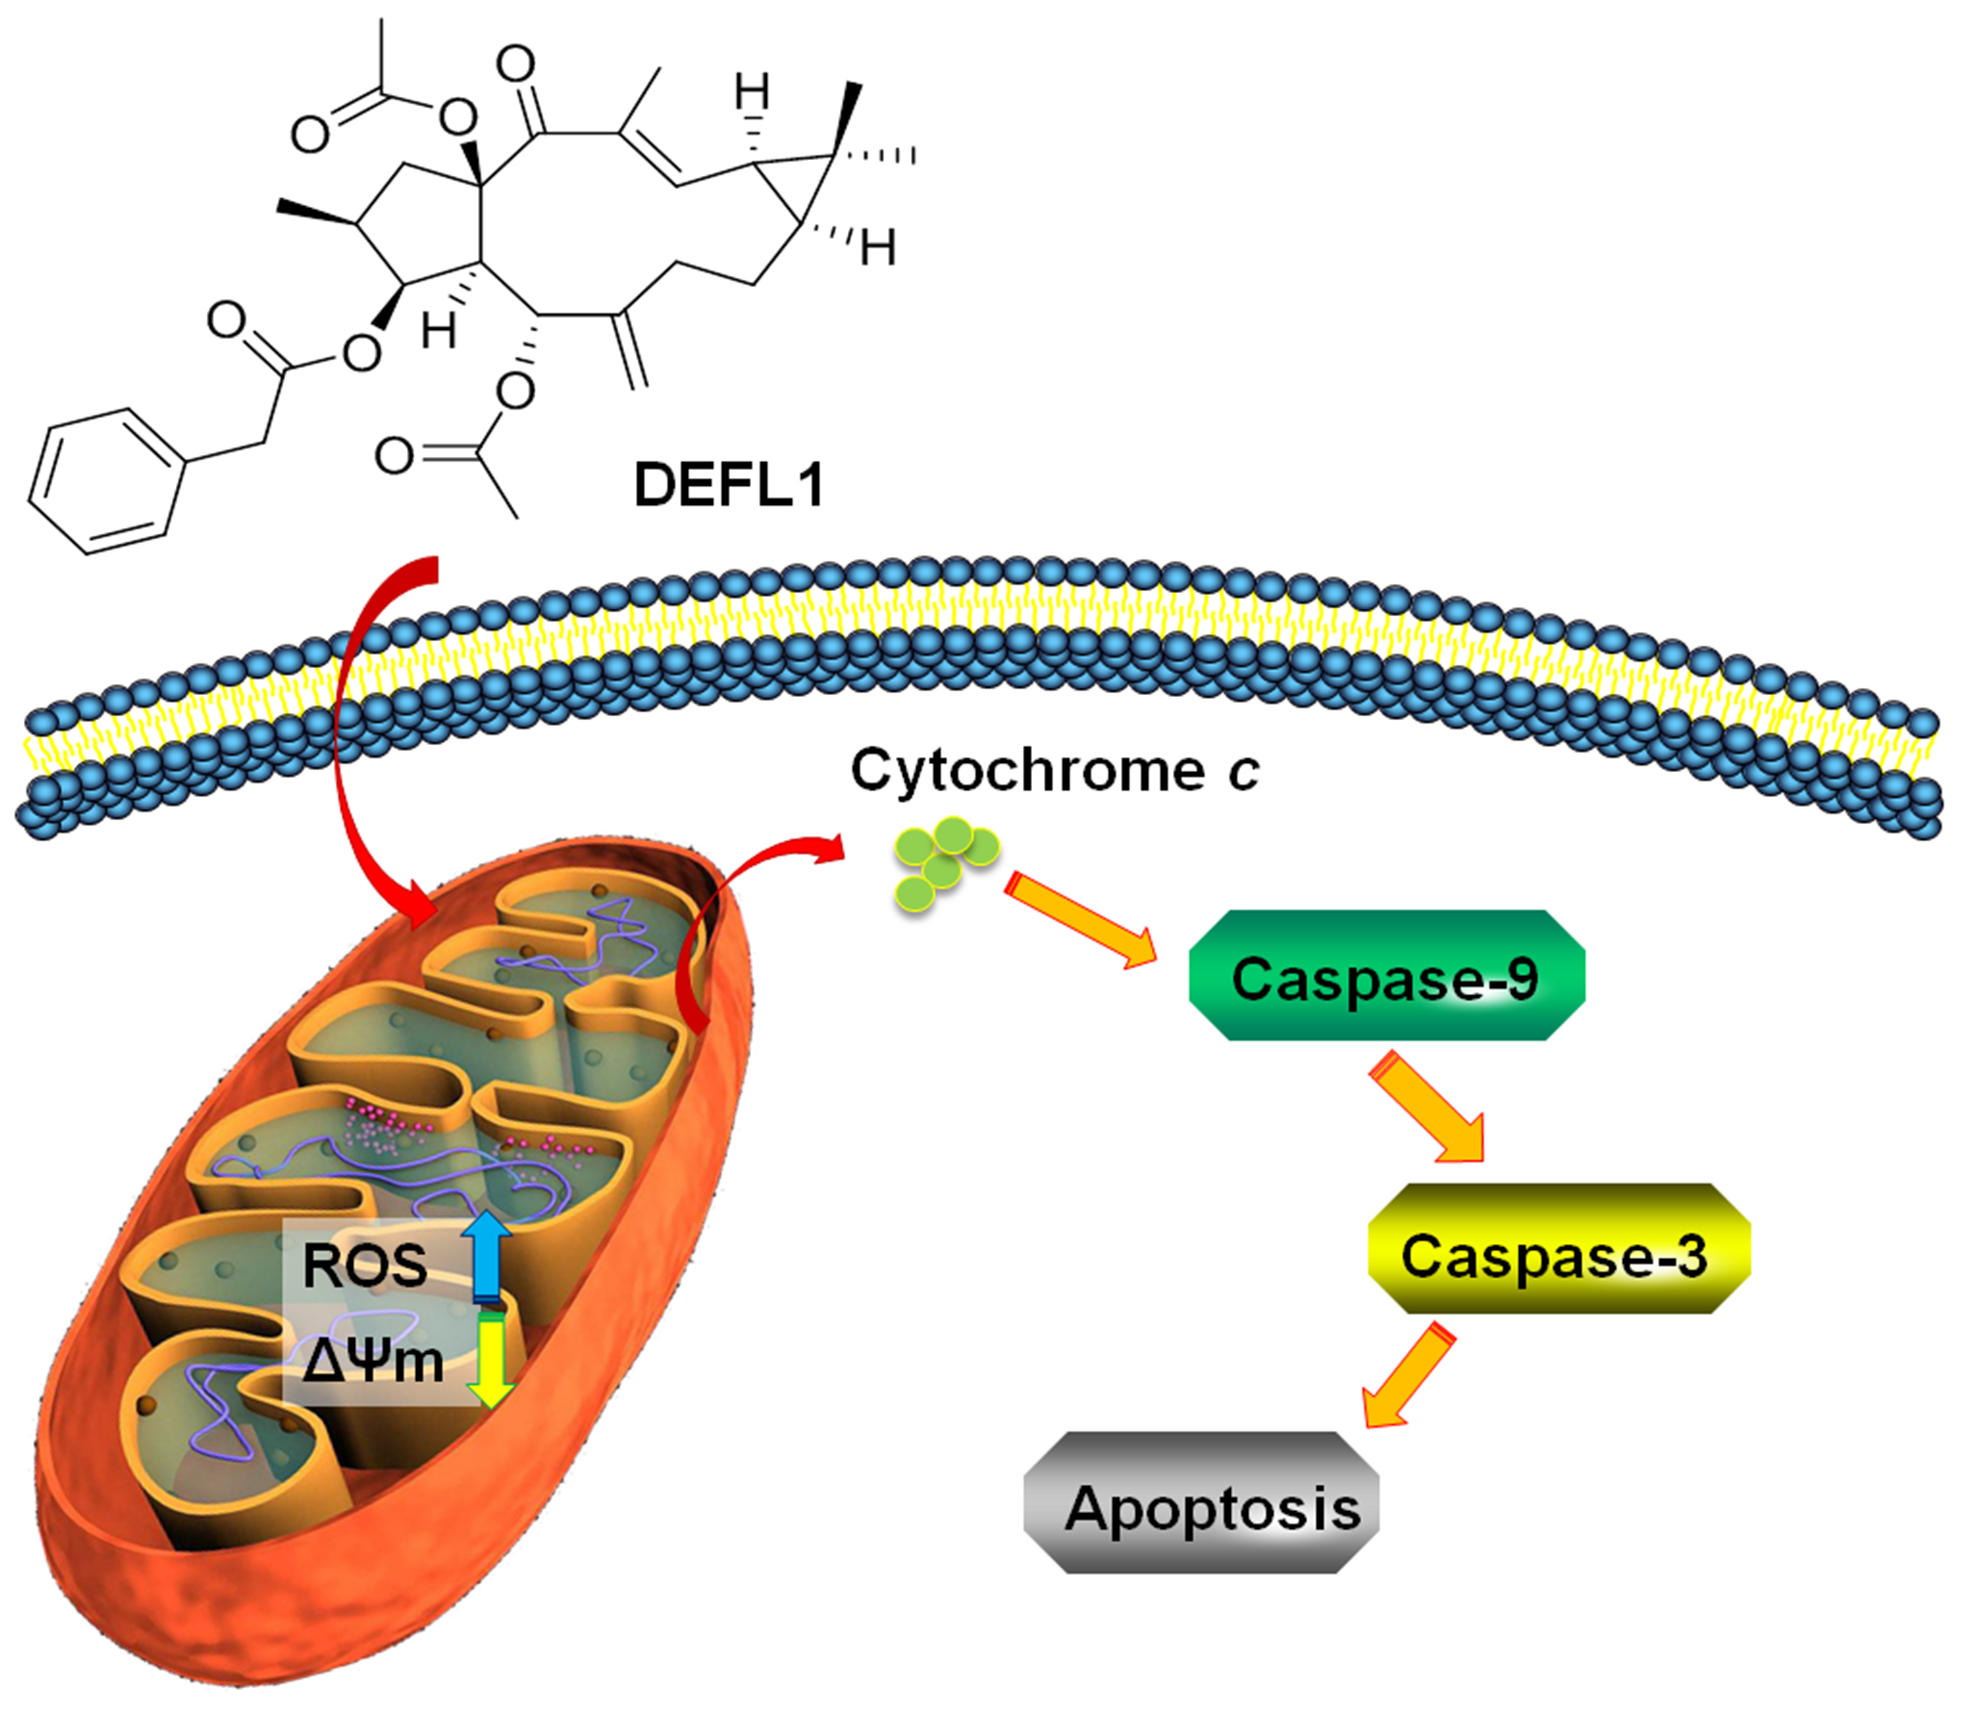
2.4. Increase of Intracellular ROS Levels in A549 Cells

According to current knowledge, a raise of intracellular ROS levels causes apoptosis [20]. To verify this, generation of ROS was measured with DCFH-DA, which can be hydrolyzed and oxidized to DCF, a fluorescent dye that can be detected by flow cytometry [21]. After A549 cells were treated with 18.0 μM DEFL1 for 12, 24 and 36 h, the intracellular ROS levels were 126.66 ± 4.46%, 151.15 ± 7.09% and 191.04 ± 11.56% of control, respectively (Figure 3).

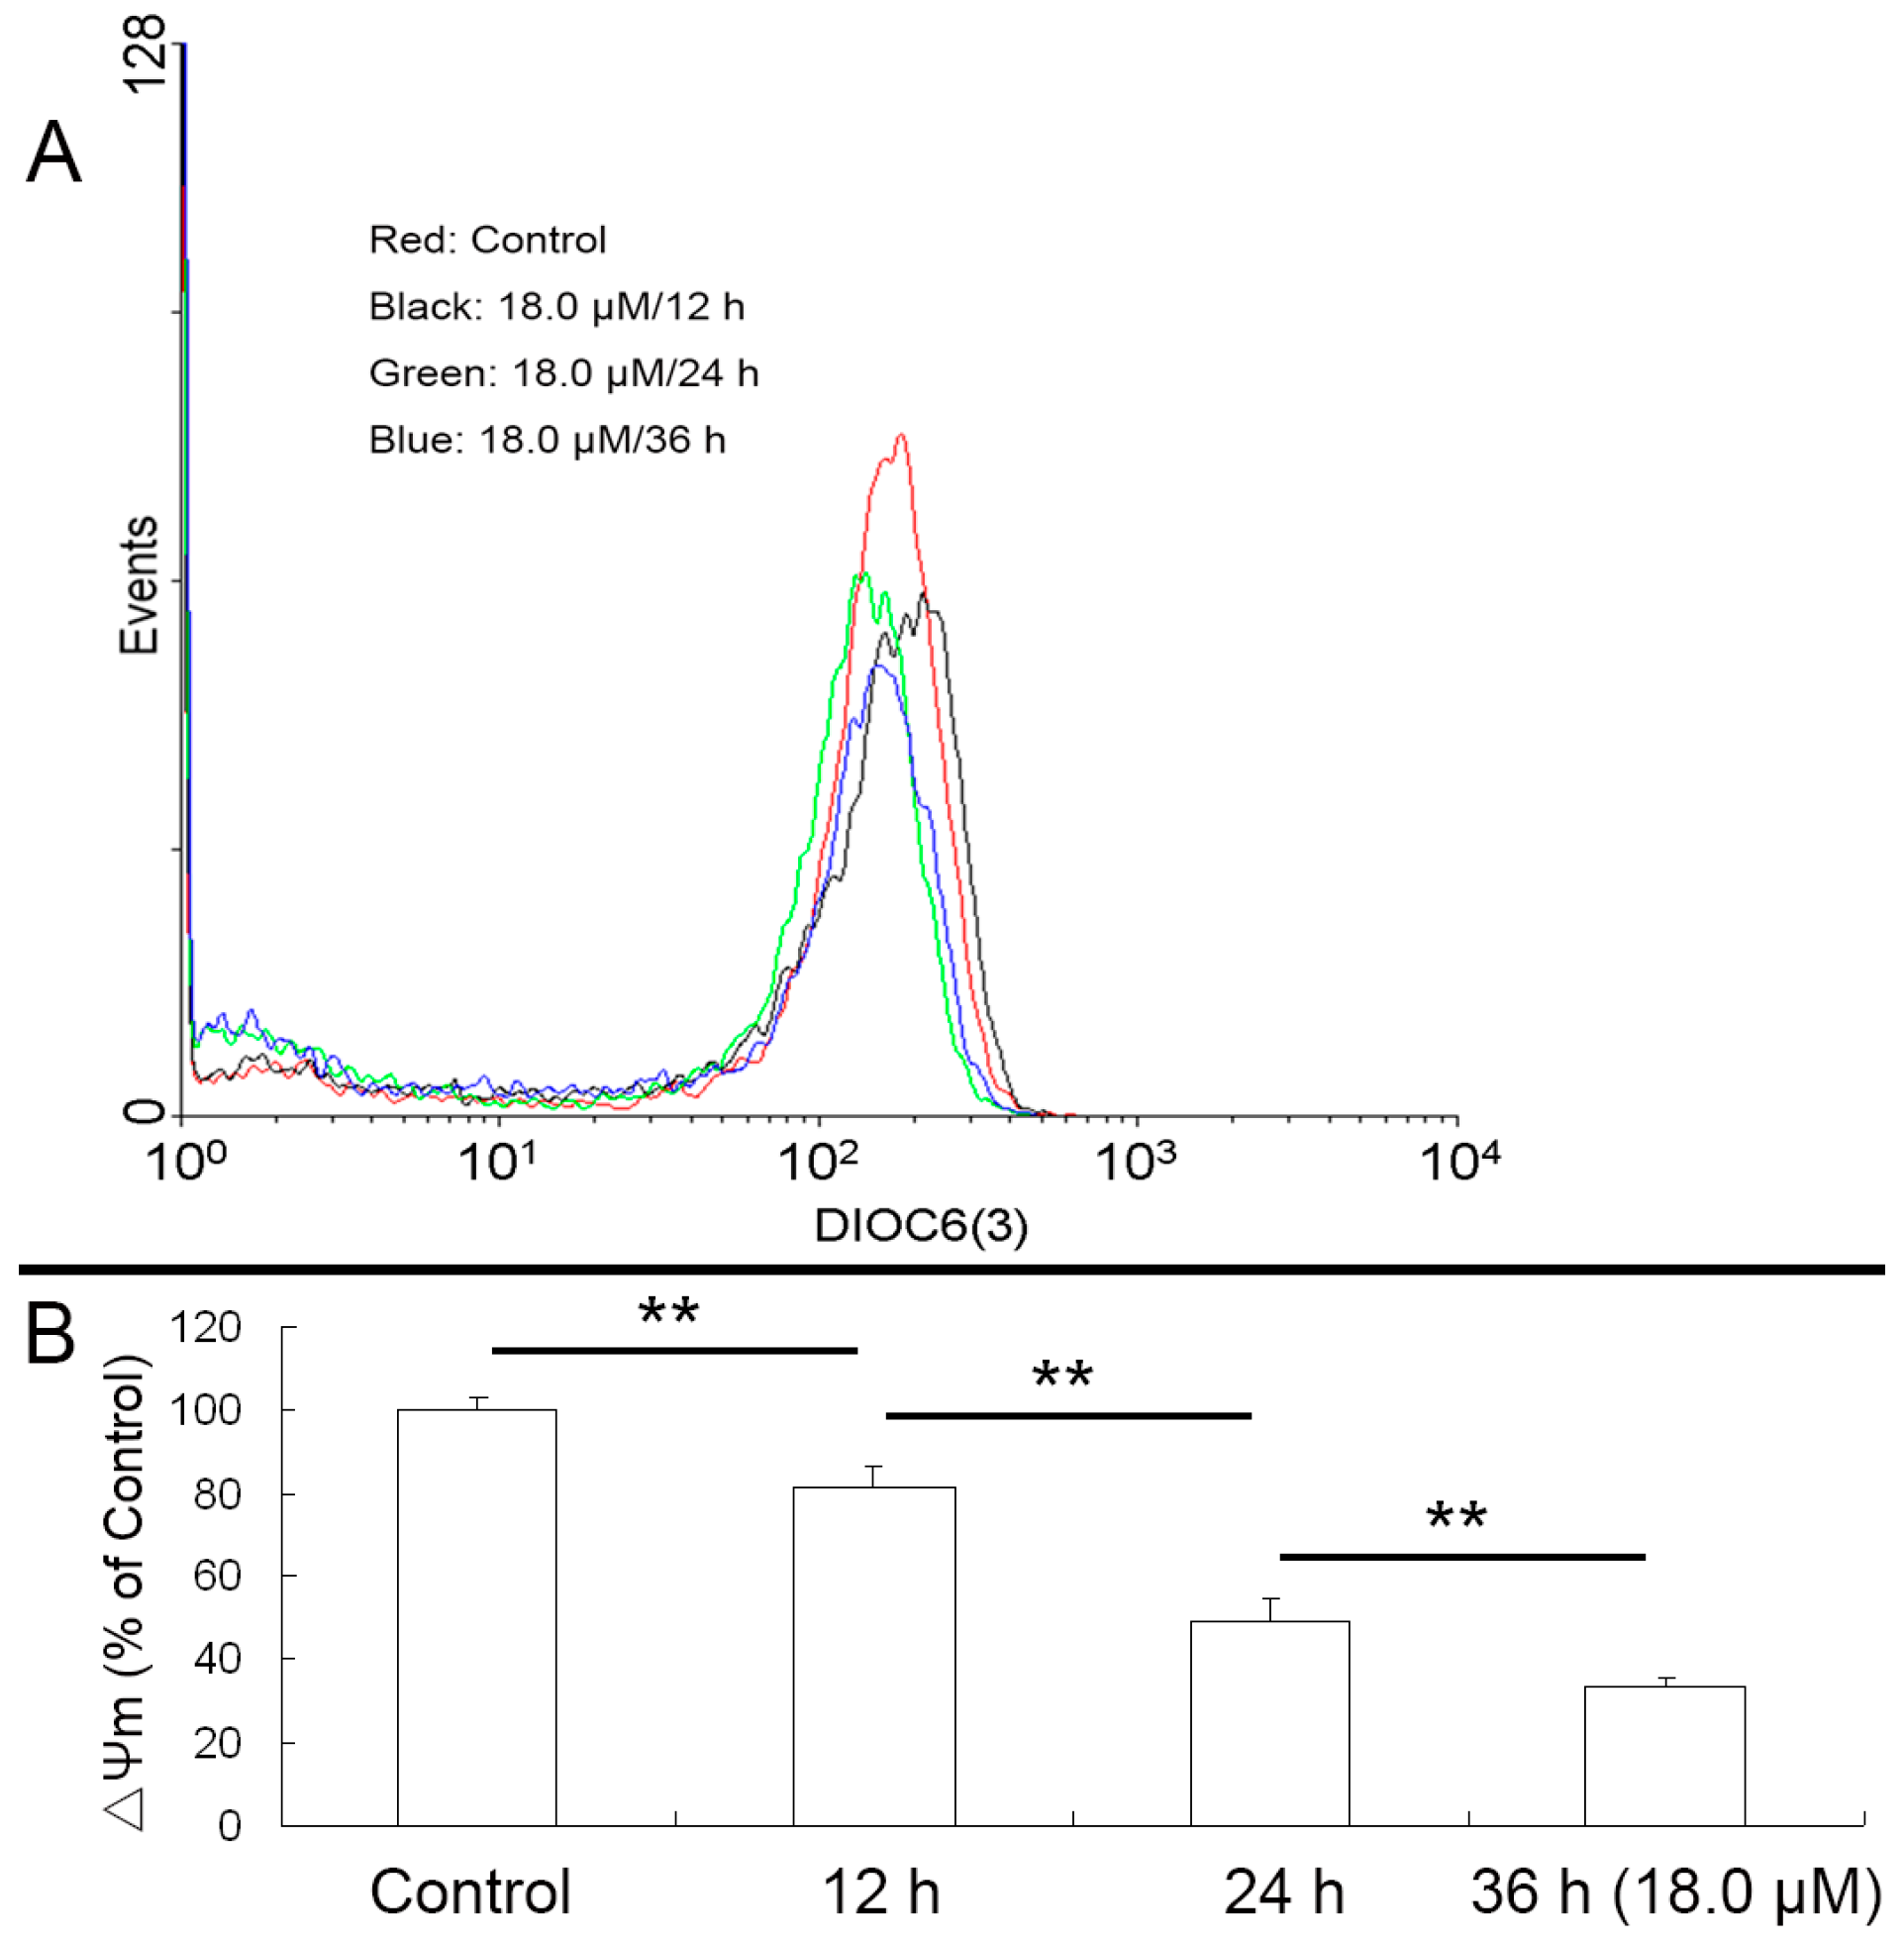
2.5. Reduced Mitochondrial Membrane Potential (ΔΨm) of A549 Cells

It is well known that an increase of ROS levels can cause the loss of ΔΨm, which plays a crucial role in the mitochondrial pathway [21]. Indeed, decreases of ΔΨm in a time-dependant manner were observed (Figure 4). After treatment with 18.0 μM DEFL1, the levels of ΔΨm were 81.42 ± 4.98%, 49.03 ± 5.33% and 33.37 ± 2.19% of control after 12, 24 and 36 h, respectively.

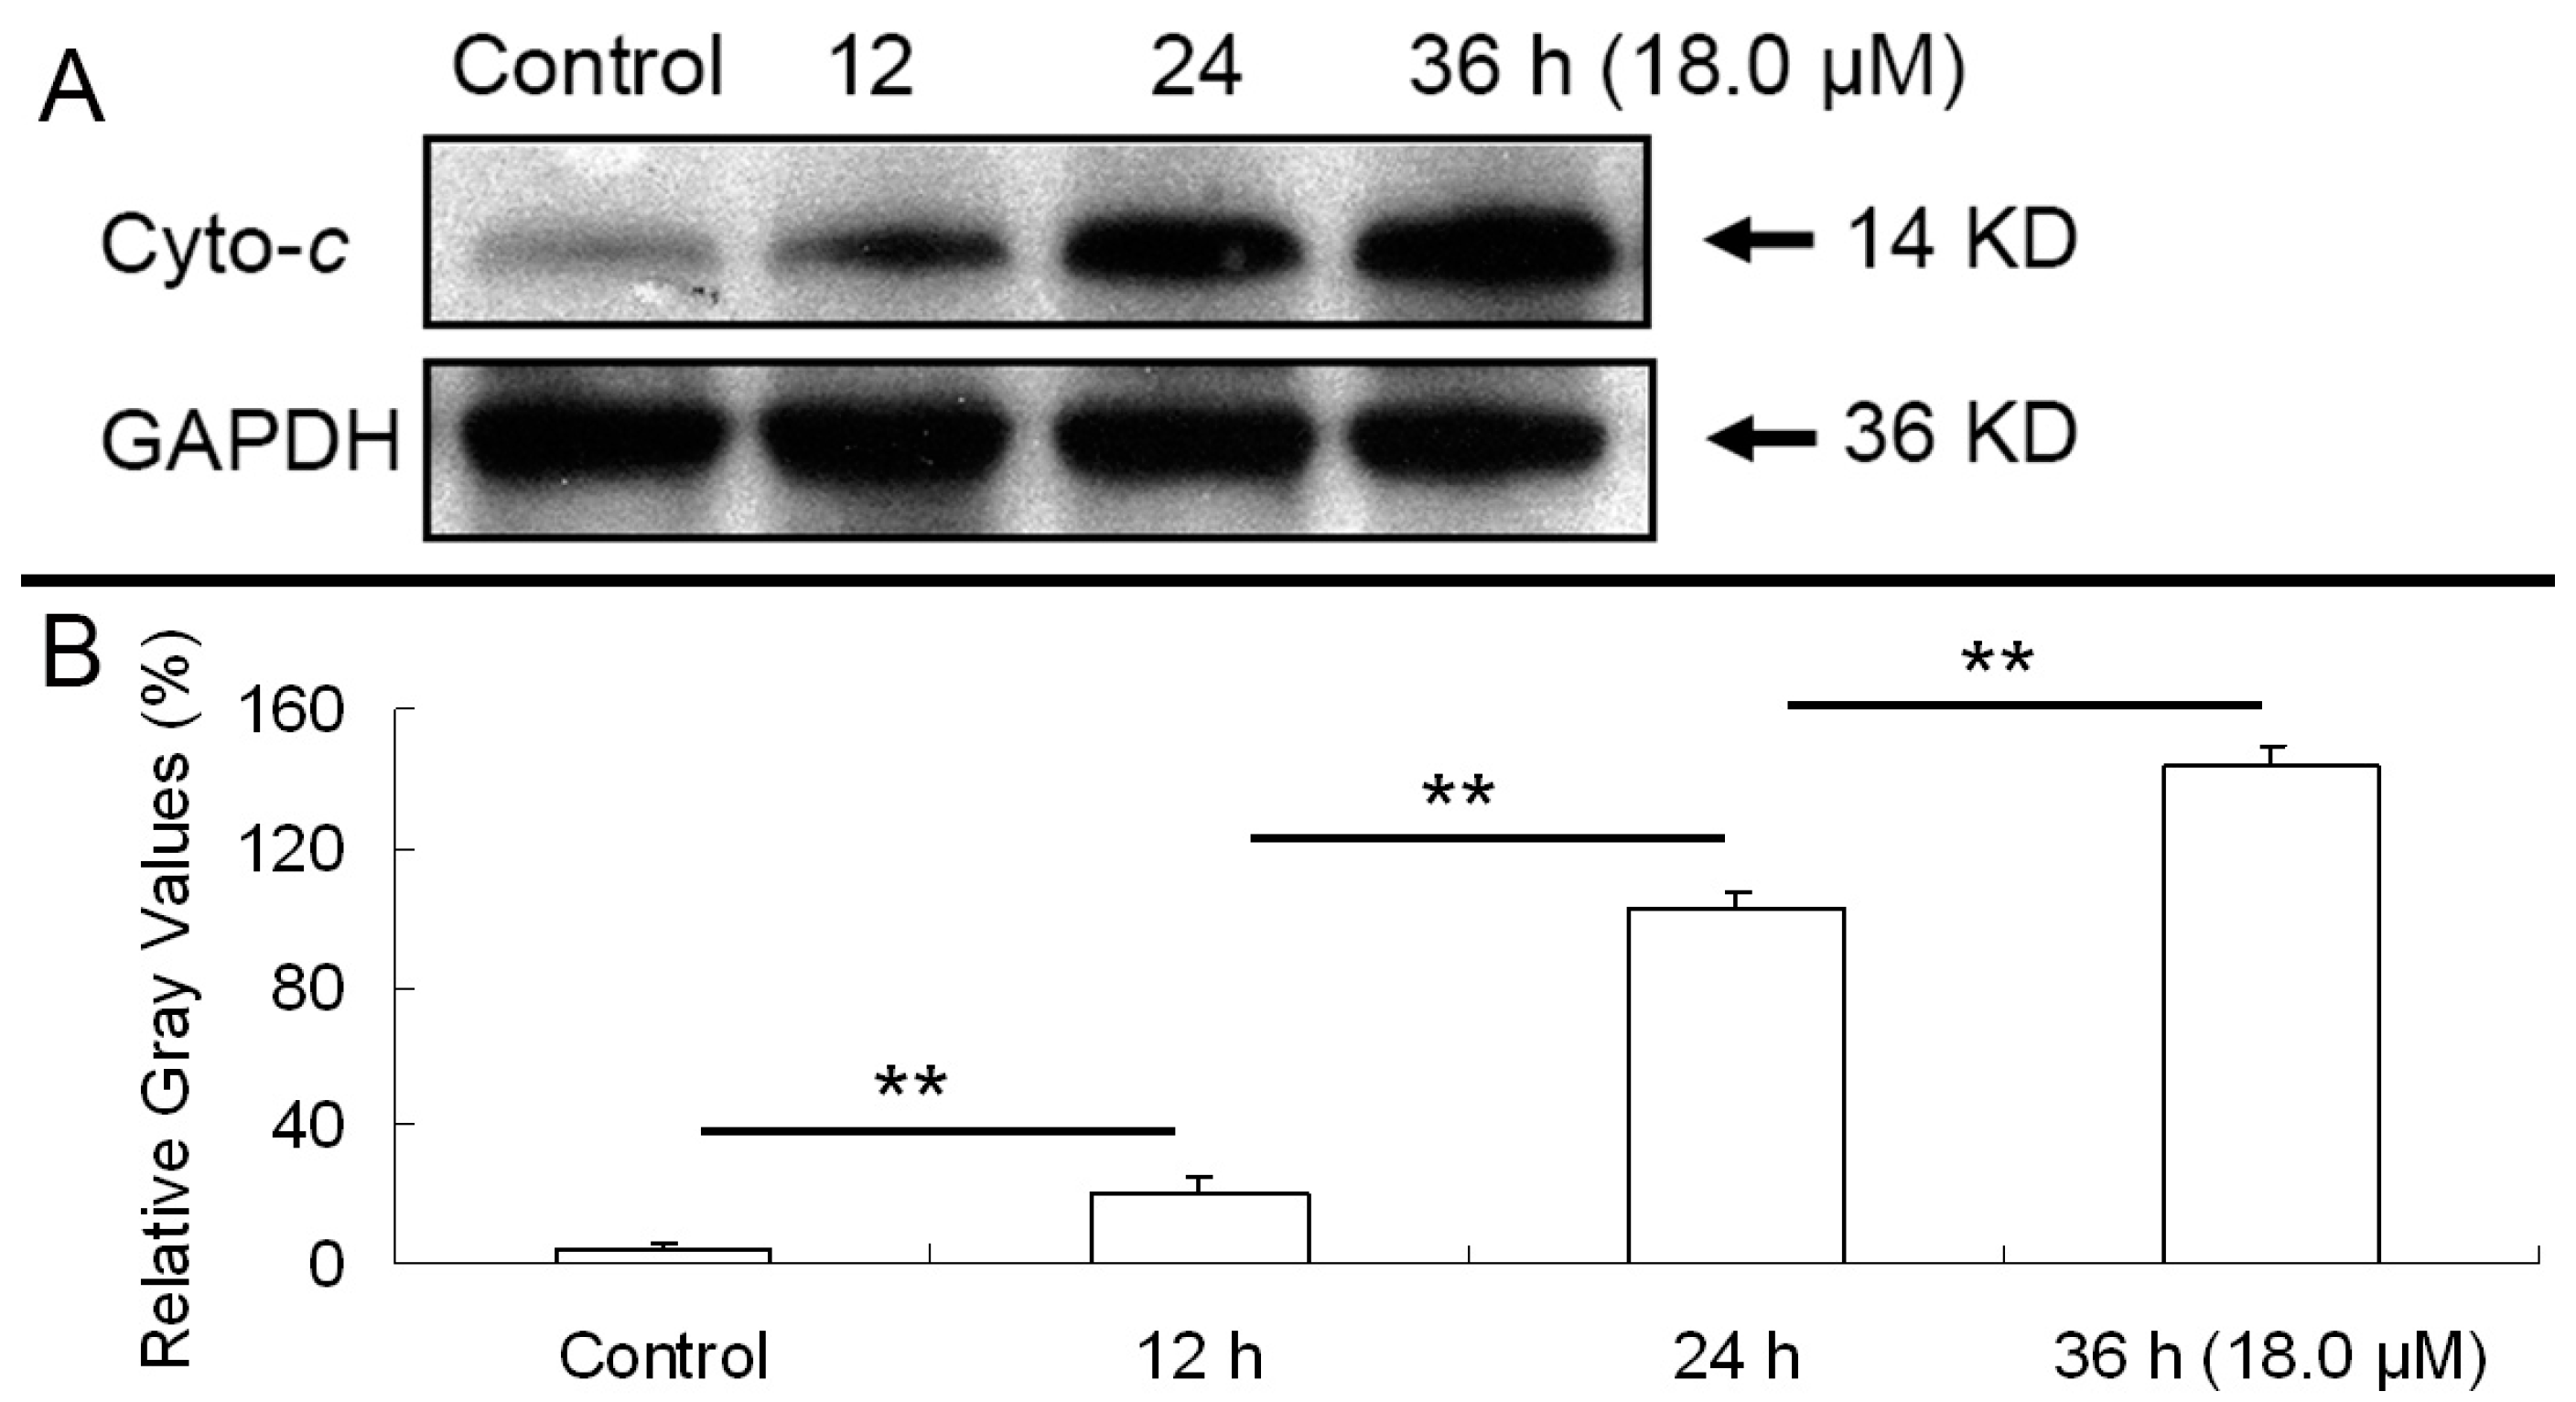
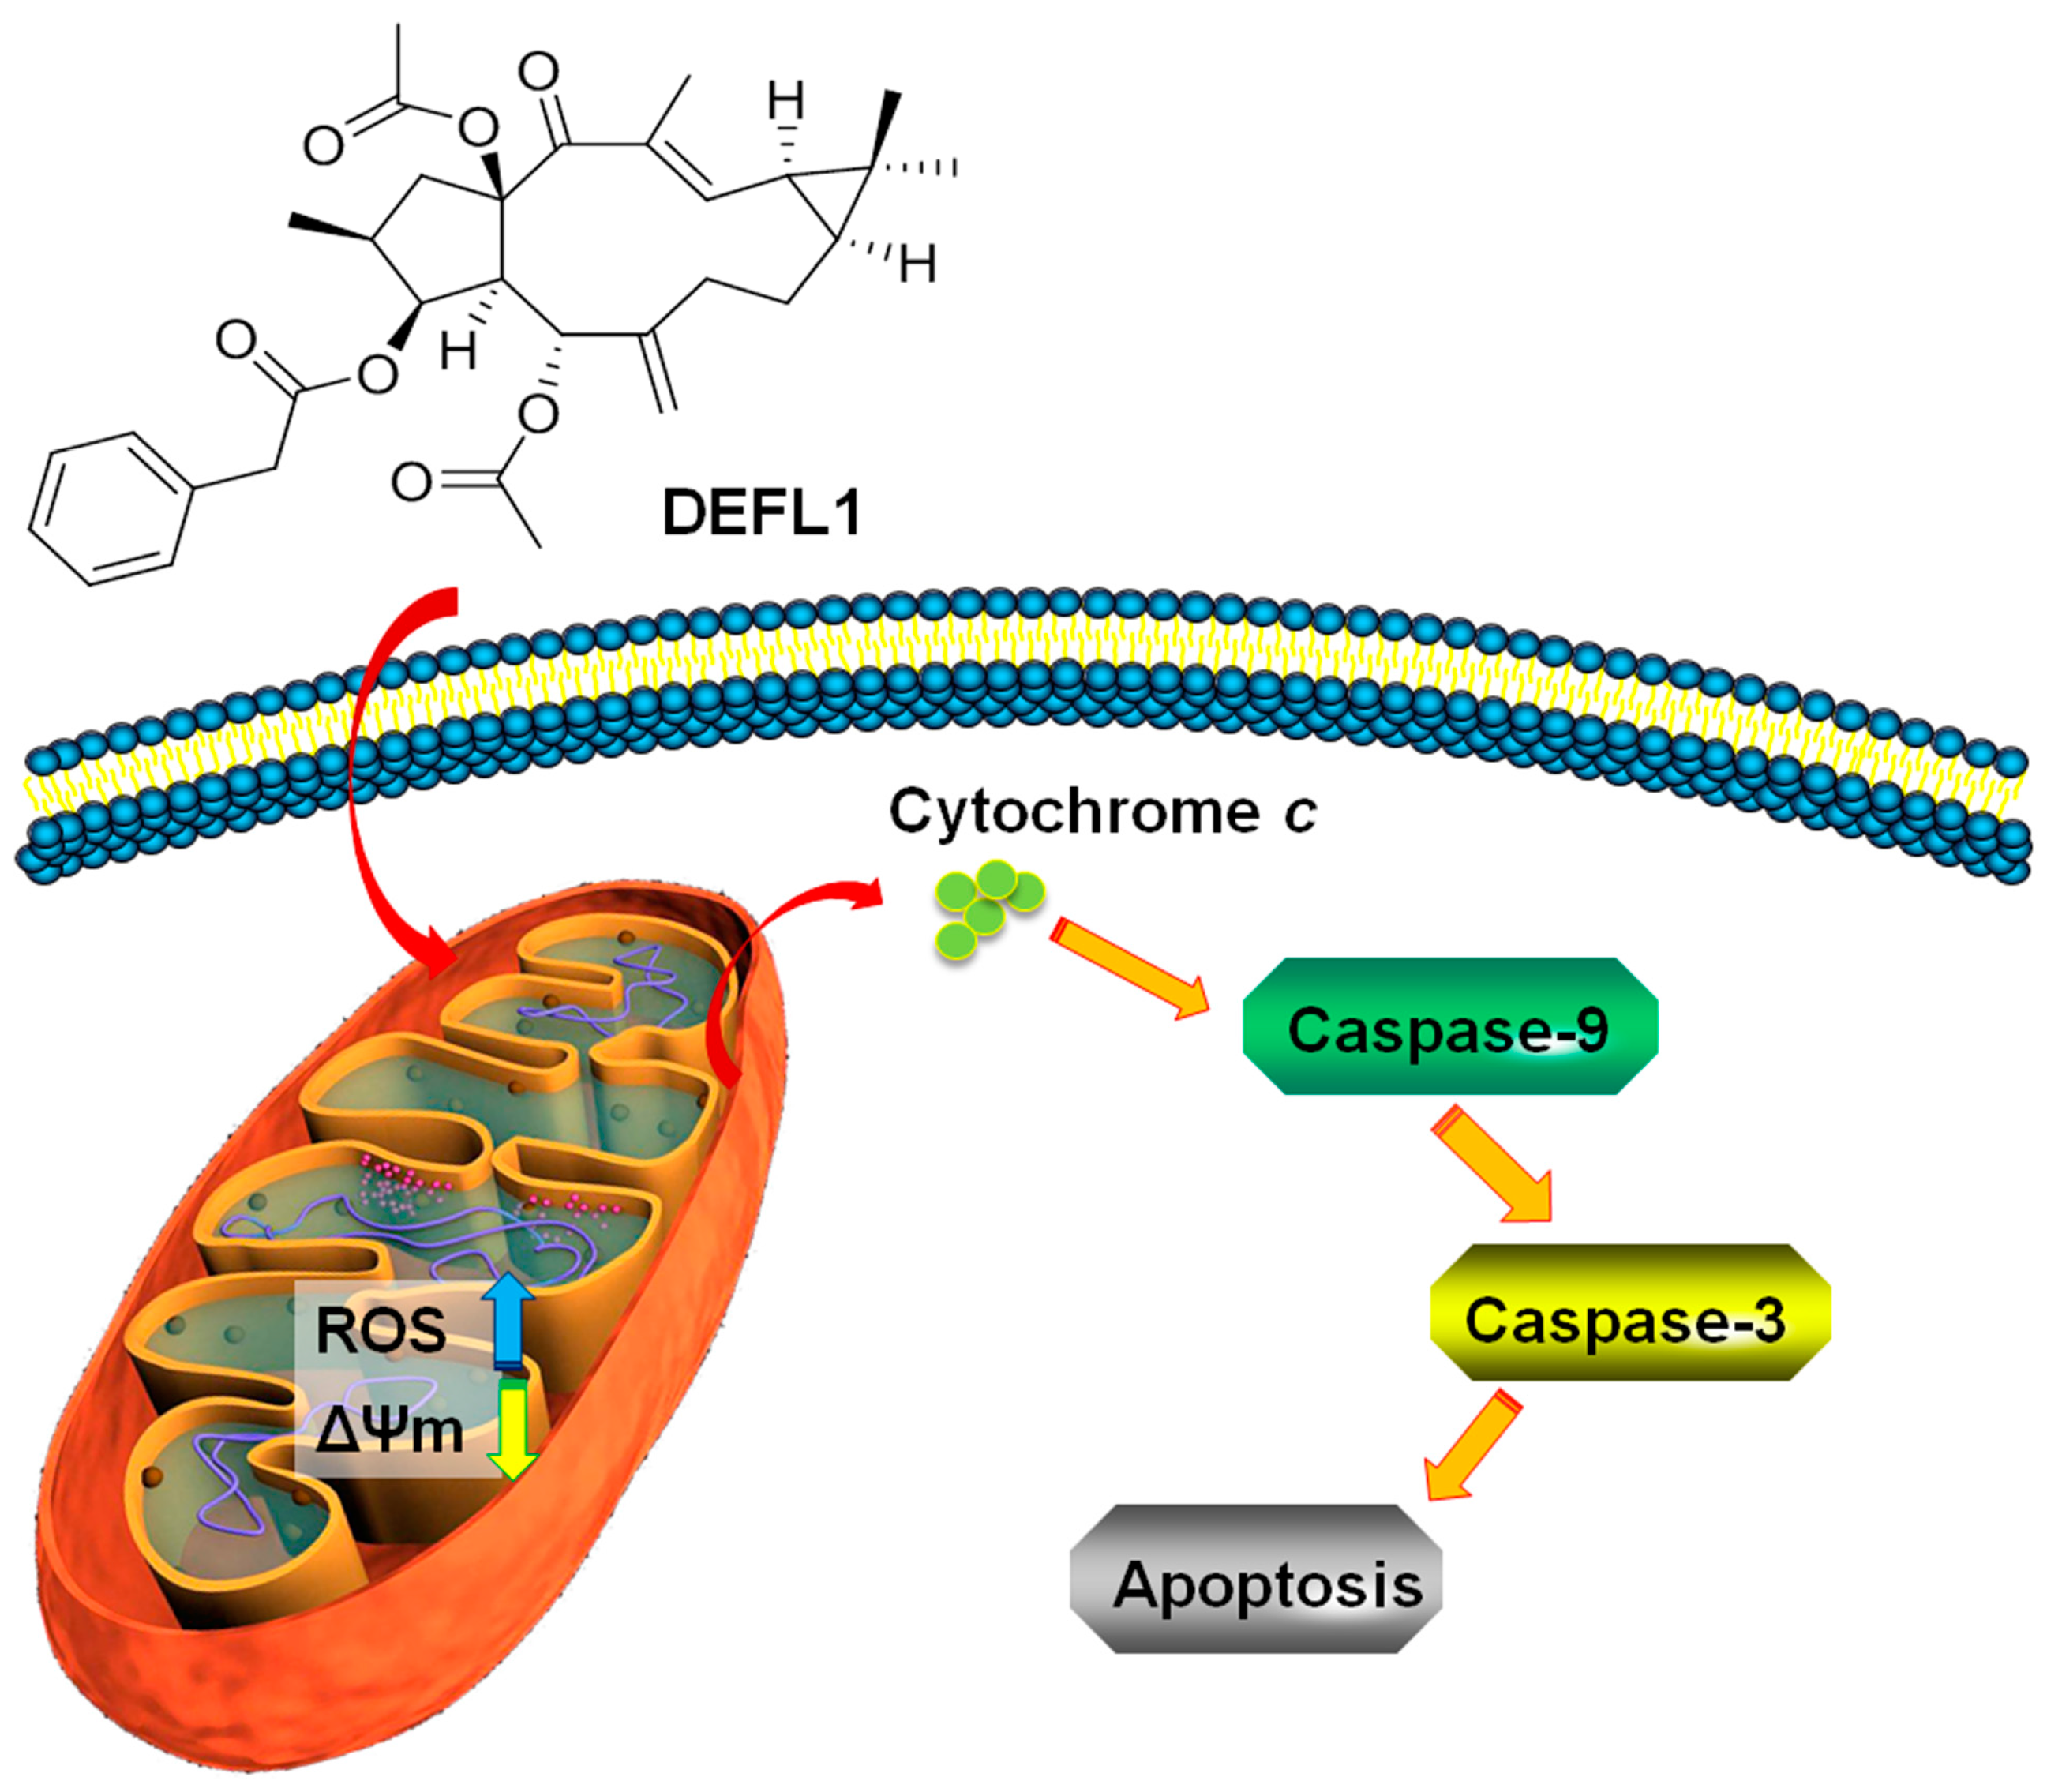
2.6. Release of Cytochrome C

Functional mitochondria depend on the maintenance of mitochondrial membrane potential (ΔΨm), loss of which results in release of cytochrome c [21]. To confirm this, cytosolic cytochrome c was detected by western blot analysis. After A549 cells were treated with 18.0 μM DEFL1 for different time, the release of cytochrome c was determined (Figure 5). Relative gray values of cytochrome c were 3.94 ± 2.17%, 20.16 ± 4.47%, 102.10 ± 4.90%, 144.09 ± 4.89%, for control, 12, 24, 36 h, respectively.

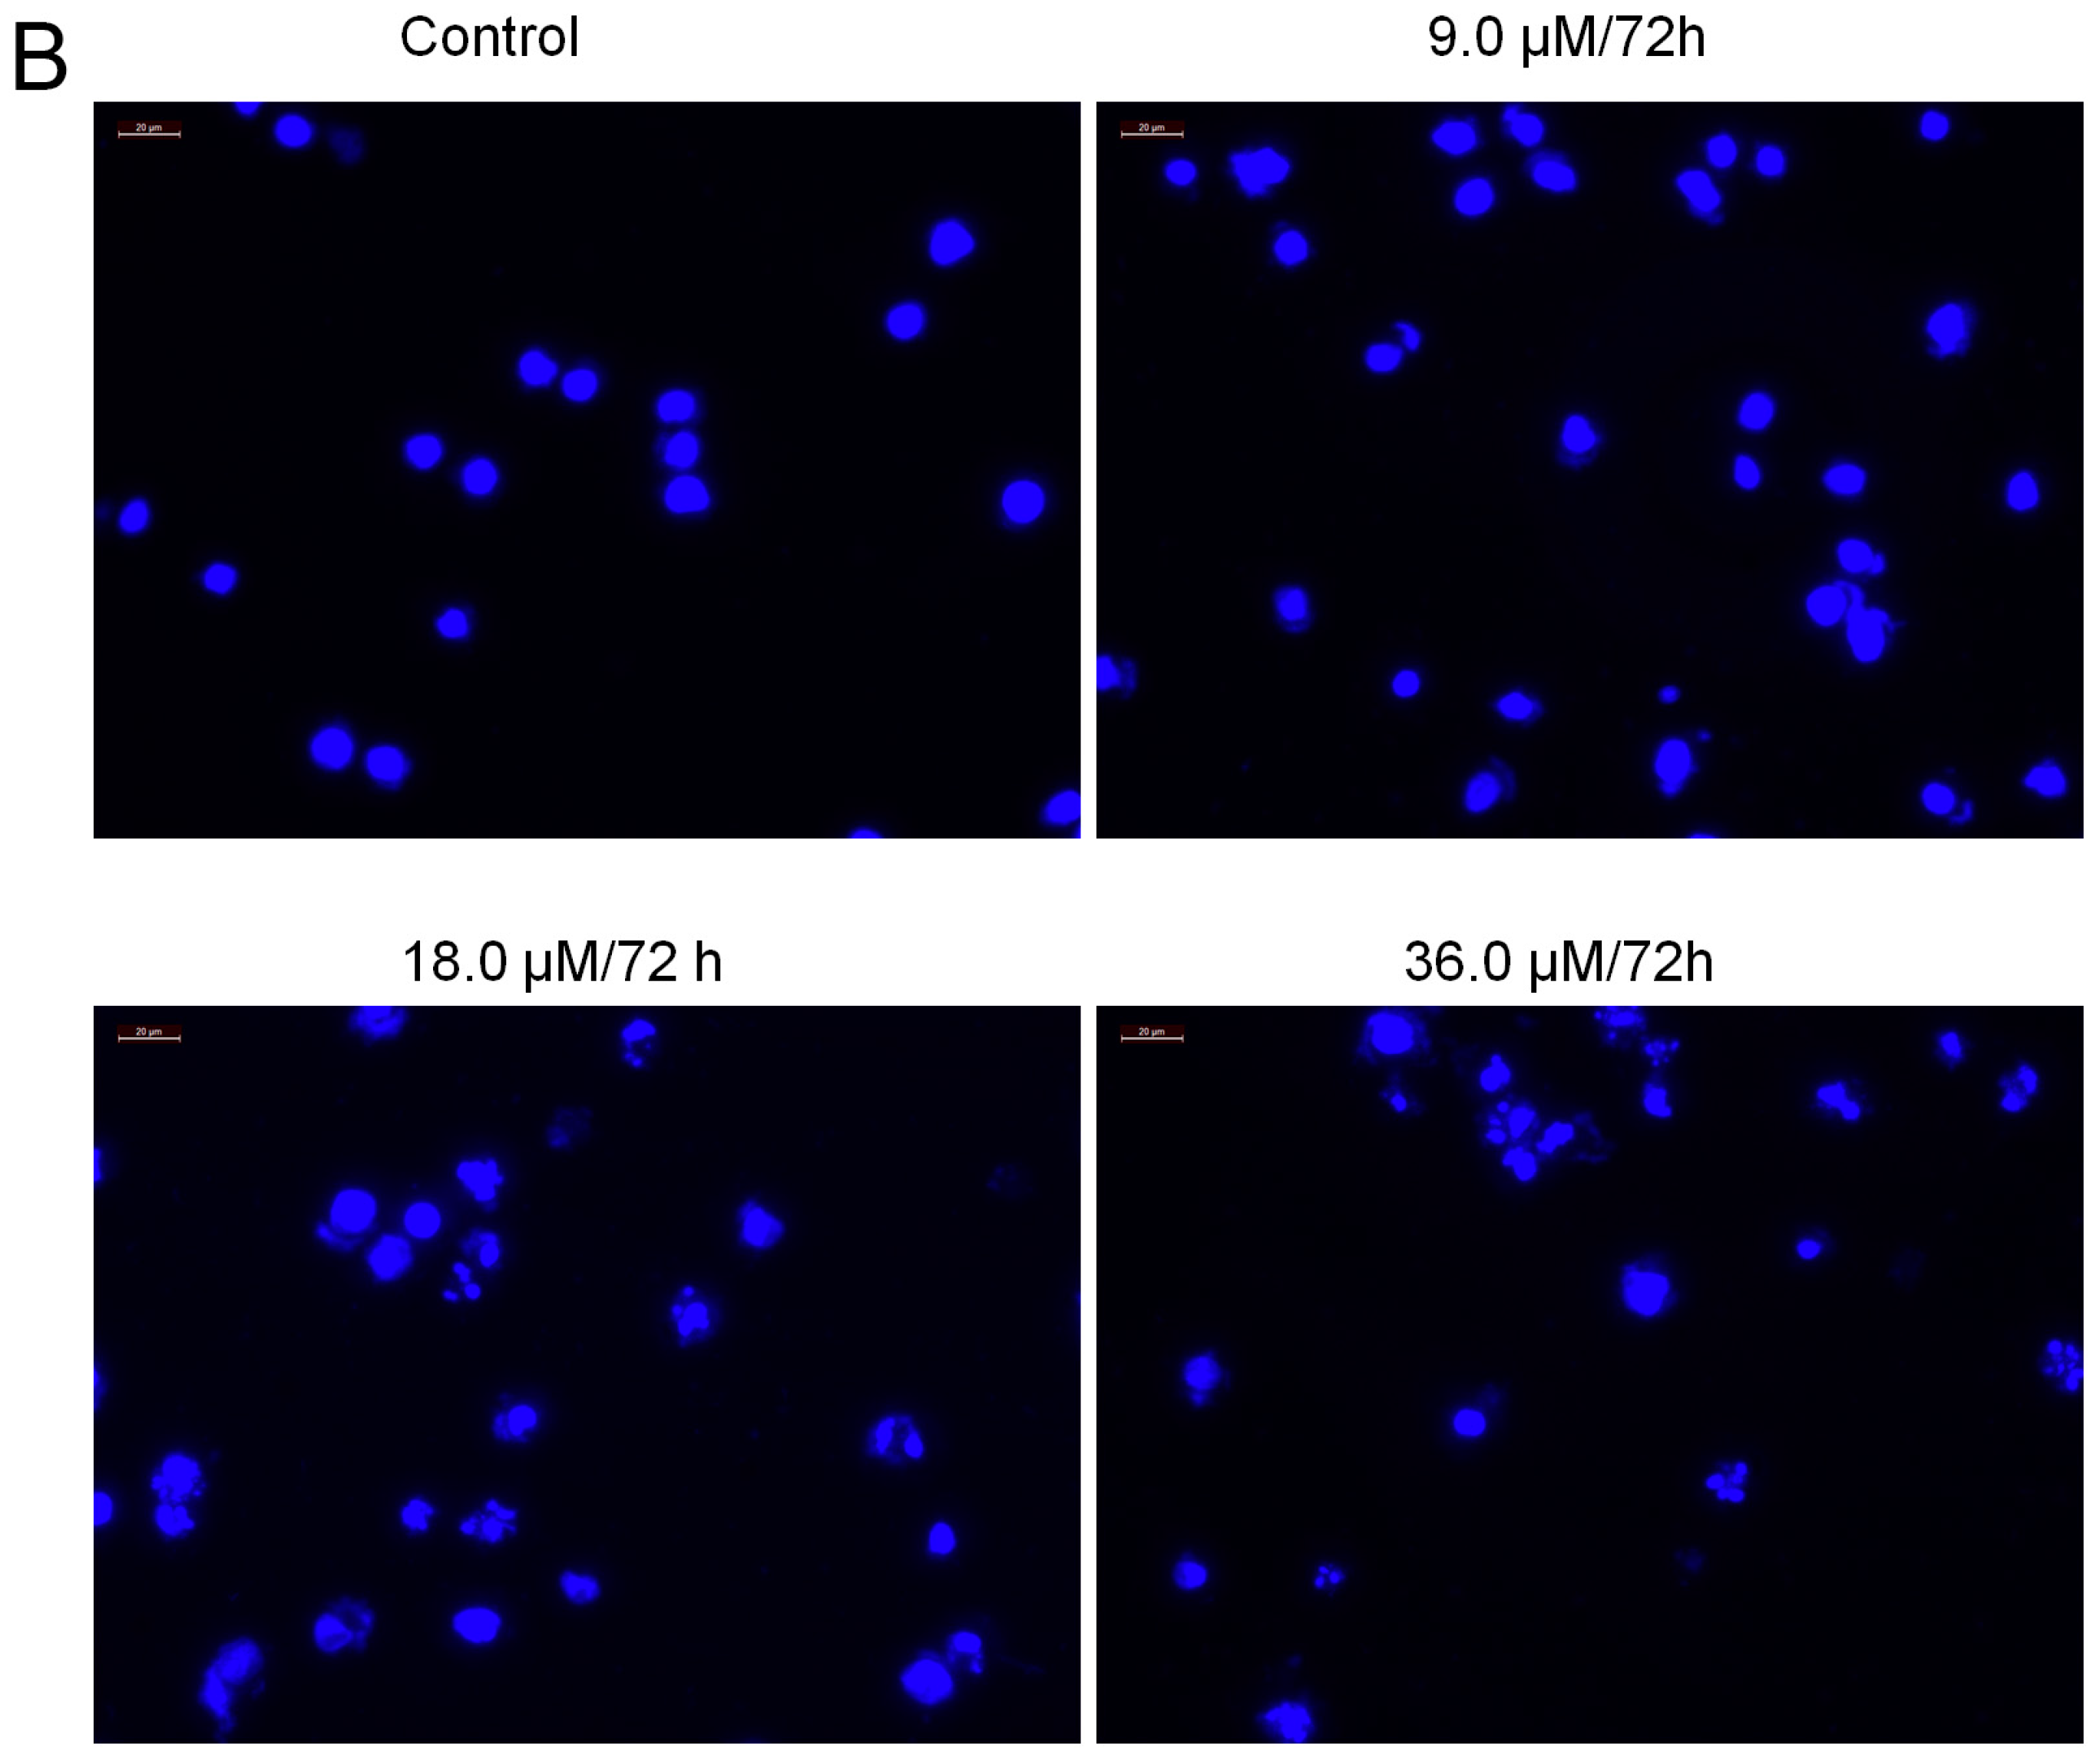
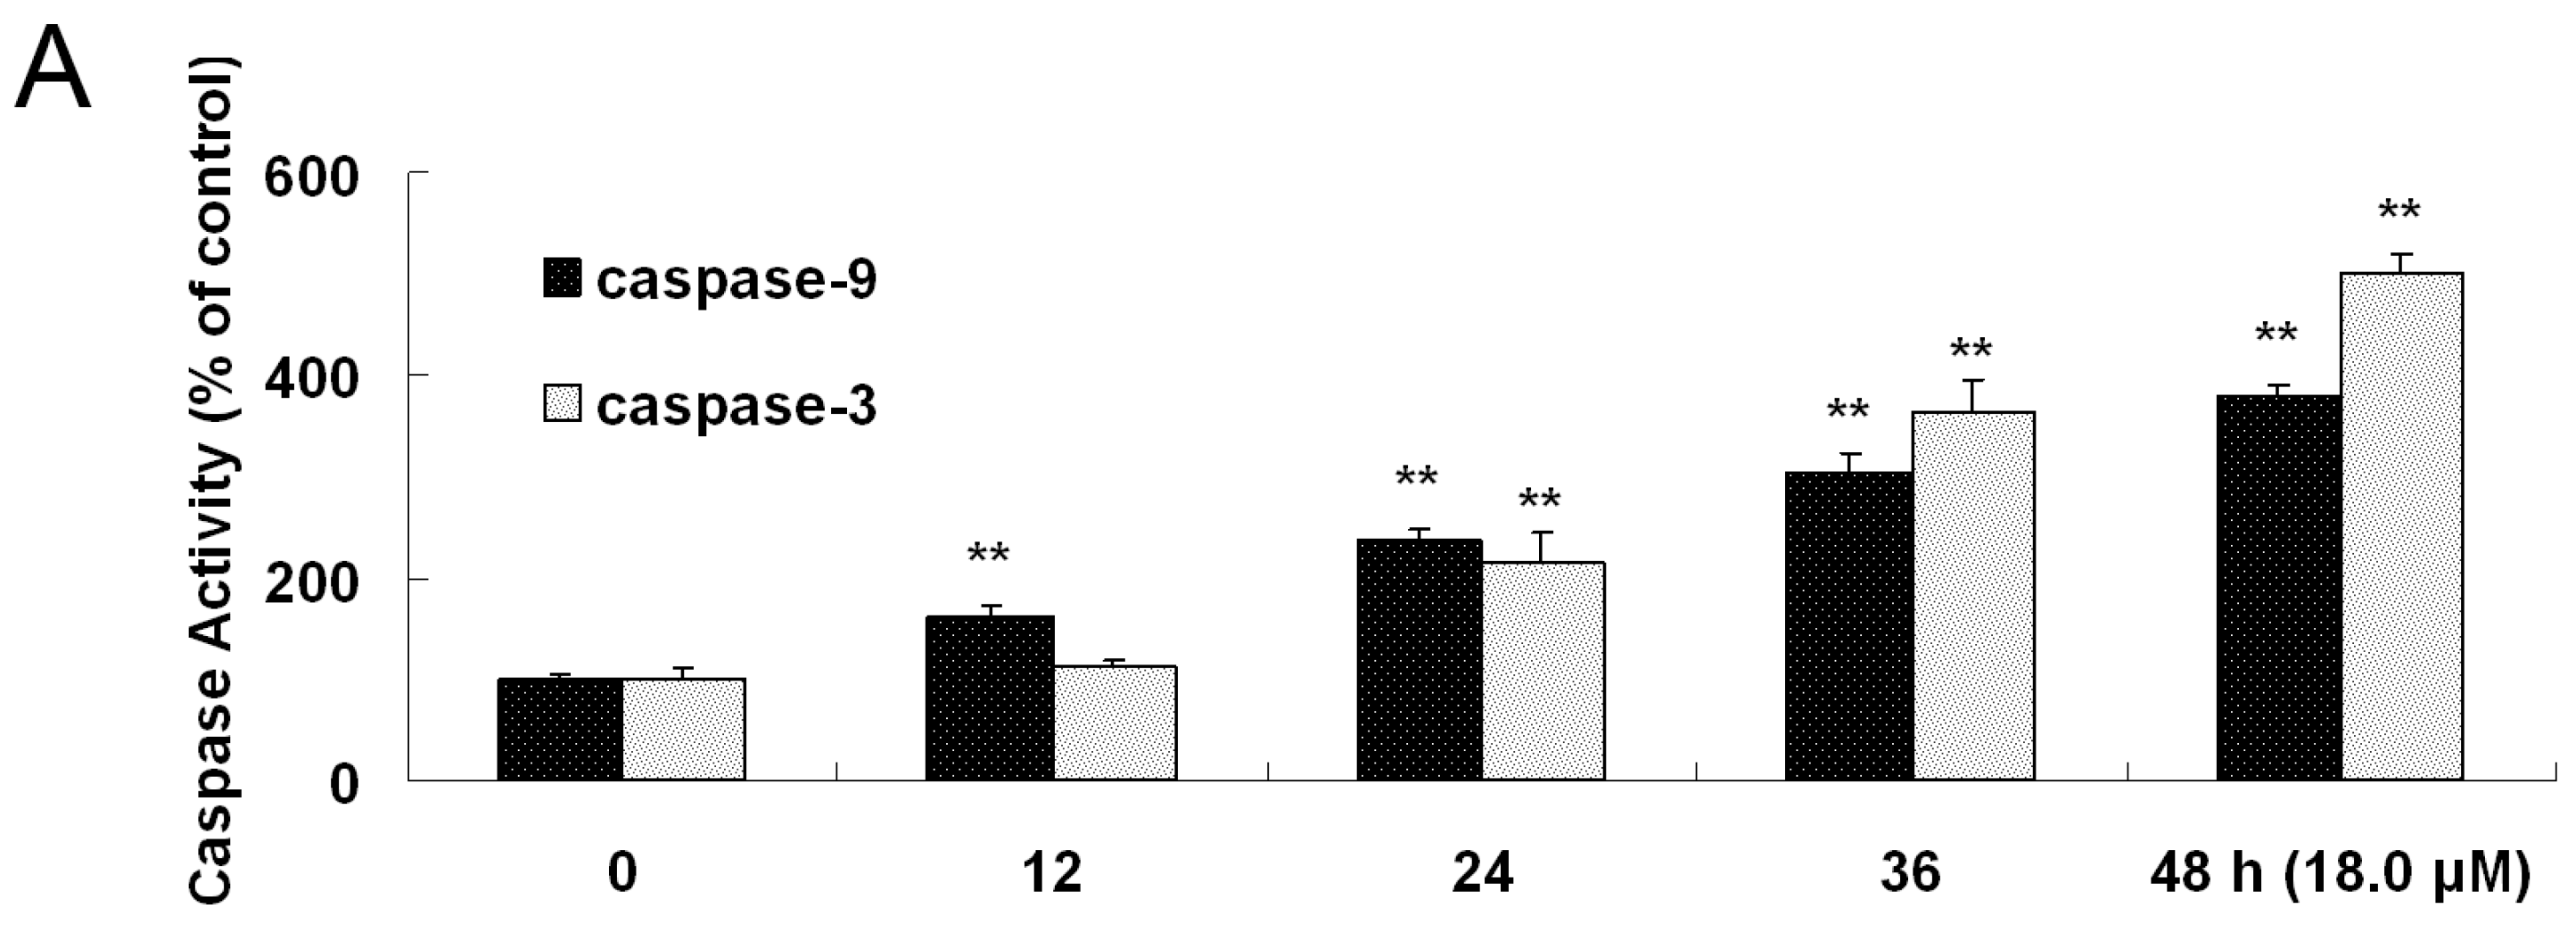
2.7. Increased Activities of Caspase-9, -3 and Apoptosis Confirmation by Hoechst 33258 Staining

It is widely known that cytosolic cytochrome c can activate procaspase-9. Subsequently, caspase-9 activates downstream caspases, including caspase-3 as apoptosis executer [21]. After A549 cells were exposed to 18.0 μM DEFL1 for indicated time, the activities of caspase-9 and -3 were measured by a caspase colorimetric assay kit following the manufacturer’s protocol (Figure 6A). Caspase-9 activity was 160.19 ± 12.31%, 237.76 ± 8.92%, 305.14 ± 18.34%, 380.06 ± 9.98% of control, 12, 24, 36, 48 h, respectively. Caspase-3 activity was 112.50 ± 6.82%, 215.97 ± 29.86%, 364.43 ± 31.98%, 500.56 ± 19.01% of control, 12, 24, 36, 48 h, respectively. Furthermore, the apoptotic cells were measured by fluorescence microscopy showing shrinkage of cell volume, and fragmentation of the nuclei (Figure 6B).

3. Discussion

Among different kinds of cancers, lung cancer remains the most common cancer throughout the world, regarding new cases and death for its high rates of morbidity and mortality [24,25]. Furthermore, non-small cell lung cancer (NSCLC) is the most common form of lung cancer [26,27]. Cancer chemotherapy offers effective treatment and developing novel anticancer drugs is a promising strategy to overcome cancer [28,29]. More and more evidence suggests that the success of anti-tumor chemotherapy depends on the discovery and development of novel drugs [23,30].
Despite the advent of combinatorial chemistry which can generate thousands of new chemicals rapidly, natural products remain the key source for developing novel drugs [31,32,33]. The genus Euphorbia provides various types of compounds including sesquiterpenoids, diterpenoids, triterpenoids, steroids, phenolics and flavonoids, among which, diterpenoids are the vital type for the biological activity [15,34]. Considerable attention has been focused on macrocyclic diterpenoids derived from lathyranes with a 5/11/3-membered ring that have exhibited anticancer and MDR- reversing activities [35,36].
In this paper we report the isolation, structure identification and apoptosis induction in NSCLC A549 cells of lathyrol-3-phenyl- acetate-5,15-diacetate (deoxy Euphorbia factor L1, DEFL1) showed strong growth inhibition in A549 cells with an IC50 value of 17.51 ± 0.85 μM (Figure 1B). What’s more, DEFL1 suppressed cell growth and migration in experiments of wound healing of A549 cells in a dose-dependent manner (Figure 2). To elucidate the anticancer mechanism, apoptosis induced by DEFL1 was investigated.
Apoptosis is a highly regulated death process deciding homeostasis and development of multicellular organisms [37,38,39]. It is characterized by a series of well-organized processes including activation of the family of cysteinyl aspartate-specific proteinases (caspase), reduction of cell volume, membrane blebbing, internucleosomal DNA cleavage, compaction of cytoplasmic organelles and fragmentation of nuclear chromatin [40,41,42]. What’s more, apoptosis is one of the important mechanisms of action of anticancer agents [43,44]. The mitochondrial pathway and death receptor pathway are two major apoptosis pathways that depend on different apoptotic stimuli [45,46]. Mitochondria have been suggested to play a critical role in the regulation of apoptosis, which is related to the generation of ROS and the disruption of redox homeostasis [47,48,49]. Indeed, an increase of ROS levels was observed in A549 cells after treatment with DEFL1 (Figure 3). Mitochondrial dysfunction, including permeability transition, loss of mitochondrial potential (ΔΨm) and release of cytochrome c from mitochondria into cytosol can lead to apoptosis [50,51]. In our research, the loss of ΔΨm (Figure 4) and release of cytochrome c (Figure 5) were detected in DEFL1- treated A549 cells.
As far as the mitochondrial pathway is concerned, caspase-9 is activated after cytochrome c is released to cytosol [52,53]. Subsequently, complex formation of cytochrome c, apoptotic protease activation factor 1 (Apaf-1) and procaspase-9 can activate the caspase-9, which brings up the activation of downstream caspases, including casapse-3 [54,55,56]. Consistently, an activity increase of caspase-9 and -3 was recorded (Figure 6A). Furthermore, Hoechst 33258 staining provided more evidence showing apoptosis of reduction of cell volume and fragmentation of nuclear chromatin (Figure 6B). Our results implied that DEFL1 induced apoptosis of A549 cells via a mitochondrial pathway and the related mechanisms are summarized in Figure 7.

4. Materials and Methods

4.1. General Procedures

3-(4,5-Dimethylthiazolyl-2)-2,5-diphenyltetrazolium bromide (MTT) was obtained from MP Biomedicals Inc. (Santa Ana, CA, USA). RPMI 1640 was purchased from Thermo Fisher Scientific Inc. (Waltham, MA, USA). Fetal bovine serum (FBS) were bought from Zhejiang Tianhang Biotechnology Co., Ltd. (Hangzhou, China). Anti-GAPDH antibodies were from Bioworld Technology Inc. (St. Louis Park, MN, USA), while anti-cytochrome c antibodies were acquired from Cell Signalling Technology Co. (Danvers, MA, USA). The caspase activity assay kit was a product of Beyotime Co. (Shanghai, China). Other routine laboratory reagents were obtained from commercial sources in analytical or HPLC grade. NMR data were recorded on a Inova-500 NB spectrometer (Varian, Palo Alto, CA, USA). CDCl3 was used as solvent and TMS as internal standard. Chemical shifts (δ) are expressed in ppm with reference to the TMS peak. Mass spectra were acquired on an ultrahigh liquid chromatography instrument coupled with a quadrupole time-of-flight mass spectrometer (G6540A, UPLC-QTOF-MS, Agilent Technologies, Santa Clara, CA, USA). IR spectra were obtained on a 5DX-FTIR spectrophotometer (Nicolet, Madison, WI, USA). Column chromatography was performed on silica gel (200–300 mesh, Qingdao Marine Chemical, Qingdao, China). Fractions were monitored by TLC visualized by heating silica gel plates sprayed with 5% H2SO4 in EtOH.

4.2. Plants, Extraction, Isolation and Characterization of DEFL1

Caper Euphorbia Seed (seeds of Euphorbia lathyris L.) was purchased from Anguo, Hebei Province and identified by Professor Hubiao Chen (School of Chinese Medicine, Hong Kong Baptist University). A voucher specimen is deposited at the Herbarium of the School of Pharmaceutical Sciences, Guangzhou Medical University. Powder of Caper Euphorbia Seed (16 kg) was refluxed with 95% EtOH (4 L/kg, 3 h/per time, three times) to obtain the ethanolic extract. Subsequently, the extract was concentrated and suspended in H2O and partitioned successively with cyclohexane (4 L/per time, three times), EtOAc (4 L/per time, three times) and n-BuOH (4 L/per time, three times) to afford the corresponding extracts. The EtOAc extract was separated and repeatedly purified by silical gel (petroleum ether-ethyl acetate) and Sephadex LH-20 column chromatography (methylene chloride-methanol) to get lathyrol-3-phenyl- acetate-5,15-diacetate (deoxy Euphorbia factor L1, DEFL1): 40 mg; mp 126–128 °C; IR (KBr) vmax 1742, 1729, 1648, 1623, 1265, 1237, 1129, 1010, 1006 cm−1; m/z 537.2848 (M + H)+; NMR: see Table 1.

4.3. Cell Lines and Culture

A549, KB and HCT116 cells provided by Prof. Li-Wu Fu (Cancer Center, Sun Yat-sen University) were cultivated in RPMI 1640 medium containing 100 U/mL penicillin, 100 μg/mL streptomycin and 10% FBS in an incubator with a humidified atmosphere of 5% CO2 at 37 °C [57]. Mycoplasma contamination was determined every two months regularly.

4.4. Cell Viability Assay

A549 cells were plated in 96-well plates and allowed to adhere for 24 h. Cells were then incubated with varying concentrations of indicated compounds or fractions. After 68 h, MTT was added to each well and plates were then incubated for another 4 h. After that, formazan crystals were dissolved with 200 μL DMSO and the absorbance at 540 nm was measured by a microplate reader with 655 nm as reference wavelength. Finally, cell survival was calculated as: survival (%) = (mean experimental absorbance/mean control absorbance) × 100% [58].

4.5. Wound Healing Assay

To perform the wound healing experiments, A549 cells were seeded in the six-well plates and cells were cultured to reach confluence overnight. Then, the 200 μL pipette tip was applied to scratch the monolayer cell to build the wound healing model. After that, the wounded cell layer was washed to discard loose cells. Medium containing different concentrations of DEFL1 was added to the plates. After indicated time of culture, images were captured. Results of cell growth and motility were examined based on the percentage of the healing area [4].

4.6. Measurement of ROS Generation

Briefly, DCF fluorescence intensity is directly related to the amount of ROS produced by the cells. After A549 cells were treated with DEFL1 for 24 h, 5 × 10⁵ cells were harvested, washed with ice-cold PBS and incubated with DCFH-DA (50 μM of the final concentration) in the dark at 37 °C for 20 min. Subsequently, cells were washed twice with ice-cold PBS and resuspended in 1 mL PBS. ROS generation quantity was examined based on 10,000 cells each sample by a FACS Caliber flow cytometer (Beckman Coulter, Brea, CA, USA) at 488 nm of the excitation wavelength and 530 nm of the emission wavelength. The data were analyzed by CellQuest software (BD Biosciences Inc., Franklin Lakes, NJ, USA) and expressed as MFI [59].

4.7. Determination of Mitochondrial Potential (ΔΨm)

A549 cells at density of 5 × 10⁵ cells/mL were treated with 18.0 µM DEFL1 for indicated time to determine ΔΨm. Thereafter, the cells were collected, centrifuged at 600 g for 5 min and then washed with ice-cold PBS. Subsequently, cells were incubated with 40 nM DiOC6 (3) for 20 min in the dark at 37 °C. After that, stained cells were washed twice with ice-cold PBS once before being resuspened in 1 mL PBS. Finally, the quantity of DiOC6 (3) maintained 10,000 cells each sample was determined by a FACS Caliber flow cytometer (Beckman Coulter, Brea, CA, USA) at 484 nm of excitation wavelength and 501 nm of emission wavelength. The recorded data were analyzed by CellQuest software (BD Biosciences Inc., Franklin Lakes, NJ, USA) and expressed as a mean fluorescence intensity (MFI) [60].

4.8. Subcellular Isolation for Western Blot Analysis of Cytosolic Cytochrome c

The indicated extract buffer contained 250 mM sucrose, 20 mM Hepes-KOH (pH 7.5), 10 mM KCl, 1.5 mM MgCl2, 1 mM DTT, 1 mM EGTA, 1 mM EDTA, 0.1 mM PMSF and 0.02 mM aprotinin. After treatment with DEFL1, A549 cells were harvested and resuspended in 5-fold volume of ice-cold extract buffer for 40 min at 4 °C. Subsequently, A549 cells were centrifuged at 1200× g for 10 min at 4 °C and the supernatant was then centrifuged at 12,000× g for 15 min at 4 °C to give the final supernatant as cytosolic fraction. Subsequently, the final supernatant after reduplicative centrifugation was collected and dissolved in 5 × loading buffer (250 mM Tris-Cl of pH 6.8, 50% glycerol, 10% sodium dodecyl sulphate, 1.25‰ bromphenol blue and 0.5 M dithiothreitol). After that the samples were heated for 15 min at 100 °C. Then the samples were subjected to western blotting analysis and cytochrome c protein was examined by anti-cytochrome c antibody in the ratio of 1:1000 [59].

4.9. Measurement of Caspase-9 and -3 Activities

The activities of caspase-9 and -3 were determined by a caspase colorimetric assay kit following the manufacturer’s protocol. To be brief, 1 × 10⁶ A549 cells were exposed to 18.0 μM DEFL1 for 12, 24, 36 and 48 h, respectively. Then, cells were collected, washed twice with ice-cold PBS and lysed with the buffer. After that, the lysates were detected for protease activity by the caspase-specific peptide conjugated with color reporter molecule p-nitroanaline. Generally, the caspase enzymatic activities in the given cell lysates were proportional to the color reaction. Finally, the chromophore p-nitroanaline cleaved by caspases was measured by spectrophotometry at 405 nm [20].

4.10. Hoechst 33258 Staining

After exposure to DEFL1, both floating and trypsinized adherent A549 cells were collected, washed once with ice-cold PBS and fixed with 1 mL 4% paraformaldehyde for 20 min. Subsequently, cells were washed once with ice-cold PBS. Then the cells were incubated in 1 mL PBS containing 10 μM Hoechst 33258 for 30 min at 37 °C, washed twice. Finally, the results were observed under a fluorescence microscope equipped with standard excitation filters (Leica Dmirb, Wetzlar, Germany) in random microscopic fields at 400 × magnification [54].

4.11. Statistical Analysis

Results were analyzed with t-test or one-way ANOVA with the SPSS software (13.0, SPSS Inc., Chicago, IL, USA). Data were expressed as means ± SD of at least triplicate determinations. * p < 0.05 and ** p < 0.01 were indicative of significance.

5. Conclusions

In summary, DEFL1 inhibits growth and induces apoptosis in A549 cells with involvement of the mitochondrial pathway (Figure 7), characterized by an increase of ROS levels, decrease of mitochondrial potential (ΔΨm), release of cytochrome c, activation of caspase-9 and -3 and observation of typical apoptosis features after Hoechst 33258 staining.

Acknowledgments

The work was supported by National Natural Science Foundation of China (81473320), Fund of Guangdong Science and Technology Department (2016A020226024), Fund of Guangdong Education Department (2015KTSCX112), Fund of Guangzhou Science and Technology Program (201707010048), Fund of Traditional Chinese Medicine Bureau of Guangdong Province (20161181) and Research Fund of undergraduates from Guangzhou Medical University.

Author Contributions

Jian-ye Zhang and Hu-biao Chen conceived and designed the experiments; Hong-mei Sun, Yun Liu, Xiao-qin Zhao, Wen-jing Huang and Si-li Tang performed the experiments; Ming-na Sun, Sheng Wang, Jia-jun Li and Ling-ling Zhang analyzed the data; Jun-hua Zhou and Qian-rong Pan contributed analysis tools; Wen-jing Huang and Jian-ye Zhang wrote the paper.

Conflicts of Interest

The authors declare no conflict of interest.

References

  1. Shi, Z.; Li, Z.; Li, Z.J.; Cheng, K.; Du, Y.; Fu, H.; Khuri, F.R. Cables1 controls p21/Cip1 protein stability by antagonizing proteasome subunit alpha type 3. Oncogene 2015, 34, 2538–2545. [Google Scholar] [CrossRef] [PubMed]
  2. Shi, Z.; Park, H.R.; Du, Y.; Li, Z.; Cheng, K.; Sun, S.Y.; Li, Z.; Fu, H.; Khuri, F.R. Cables1 complex couples survival signaling to the cell death machinery. Cancer Res. 2015, 75, 147–158. [Google Scholar] [CrossRef] [PubMed]
  3. Shi, Z.; Peng, X.X.; Kim, I.W.; Shukla, S.; Si, Q.S.; Robey, R.W.; Bates, S.E.; Shen, T.; Ashby, C.R., Jr.; Fu, L.W.; et al. Erlotinib (Tarceva, OSI-774) antagonizes ATP-binding cassette subfamily B member 1 and ATP-binding cassette subfamily G member 2-mediated drug resistance. Cancer Res. 2007, 67, 11012–11020. [Google Scholar] [CrossRef] [PubMed]
  4. Lin, M.; Bi, H.; Yan, Y.; Huang, W.; Zhang, G.; Zhang, G.; Tang, S.; Liu, Y.; Zhang, L.; Ma, J.; et al. Parthenolide suppresses non-small cell lung cancer GLC-82 cells growth via B-Raf/MAPK/Erk pathway. Oncotarget 2017, 8, 23436–23447. [Google Scholar] [CrossRef] [PubMed]
  5. Jiang, Q.W.; Cheng, K.J.; Mei, X.L.; Qiu, J.G.; Zhang, W.J.; Xue, Y.Q.; Qin, W.M.; Yang, Y.; Zheng, D.W.; Chen, Y.; et al. Synergistic anticancer effects of triptolide and celastrol, two main compounds from thunder god vine. Oncotarget 2015, 6, 32790–32804. [Google Scholar] [CrossRef] [PubMed]
  6. Shi, Z.; Tiwari, A.K.; Shukla, S.; Robey, R.W.; Singh, S.; Kim, I.W.; Bates, S.E.; Peng, X.; Abraham, I.; Ambudkar, S.V.; et al. Sildenafil reverses ABCB1- and ABCG2-mediated chemotherapeutic drug resistance. Cancer Res. 2011, 71, 3029–3041. [Google Scholar] [CrossRef] [PubMed]
  7. Shi, Z.; Liang, Y.J.; Chen, Z.S.; Wang, X.W.; Wang, X.H.; Ding, Y.; Chen, L.M.; Yang, X.P.; Fu, L.W. Reversal of MDR1/P-glycoprotein-mediated multidrug resistance by vector-based RNA interference in vitro and in vivo. Cancer Biol. Ther. 2006, 5, 39–47. [Google Scholar] [CrossRef] [PubMed]
  8. Kathawala, R.J.; Gupta, P.; Ashby, C.R., Jr.; Chen, Z.S. The modulation of ABC transporter-mediated multidrug resistance in cancer: A review of the past decade. Drug Resist. Updat. 2015, 18, 1–17. [Google Scholar] [CrossRef] [PubMed]
  9. Wu, C.P.; Ambudka, S.V. The pharmacological impact of ATP-binding cassette drug transporters on vemurafenib-based therapy. Acta Pharm. Sin. B 2014, 4, 105–111. [Google Scholar] [CrossRef] [PubMed]
  10. Huang, L.; Fu, L. Mechanisms of resistance to EGFR tyrosine kinase inhibitors. Acta Pharm. Sin. B 2015, 5, 390–401. [Google Scholar] [CrossRef] [PubMed]
  11. Jiang, Q.W.; Chen, M.W.; Cheng, K.J.; Yu, P.Z.; Wei, X.; Shi, Z. Therapeutic potential of steroidal alkaloids in cancer and other diseases. Med. Res. Rev. 2016, 36, 119–143. [Google Scholar] [CrossRef] [PubMed]
  12. Nasr, M.; Ghorab, M.K.; Abdelazem, A. In vitro and in vivo evaluation of cubosomes containing 5-fluorouracil for liver targeting. Acta Pharm. Sin. B 2015, 5, 79–88. [Google Scholar] [CrossRef] [PubMed]
  13. Aldonza, M.B.; Hong, J.Y.; Alinsug, M.V.; Song, J.; Lee, S.K. Multiplicity of acquired cross-resistance in paclitaxel-resistant cancer cells is associated with feedback control of TUBB3 via FOXO3a-mediated ABCB1 regulation. Oncotarget 2016, 7, 34395–34419. [Google Scholar] [CrossRef] [PubMed]
  14. Ma, L.Y.; Zhang, Y.B.; Zhou, Q.L.; Yang, Y.F.; Yang, X.W. Simultaneous determination of eight ginsenosides in rat plasma by liquid chromatography-electrospray ionization tandem mass spectrometry: Application to their pharmacokinetics. Molecules 2015, 20, 21597–21608. [Google Scholar] [CrossRef] [PubMed]
  15. Shi, Q.W.; Su, X.H.; Kiyota, H. Chemical and pharmacological research of the plants in genus Euphorbia. Chem. Rev. 2008, 108, 4295–4327. [Google Scholar] [CrossRef] [PubMed]
  16. Jiao, W.; Dong, W.; Li, Z.; Deng, M.; Lu, R. Lathyrane diterpenes from Euphorbia lathyris as modulators of multidrug resistance and their crystal structures. Bioorg. Med. Chem. 2009, 17, 4786–4792. [Google Scholar] [CrossRef] [PubMed]
  17. Lu, J.; Li, G.; Huang, J.; Zhang, C.; Zhang, L.; Zhang, K.; Li, P.; Lin, R.; Wang, J. Lathyrane-type diterpenoids from the seeds of Euphorbia lathyris. Phytochemistry 2014, 104, 79–88. [Google Scholar] [CrossRef] [PubMed]
  18. Duarte, N.; Varga, A.; Cherepnev, G.; Radics, R.; Molnar, J.; Ferreira, M.J. Apoptosis induction and modulation of P-glycoprotein mediated multidrug resistance by new macrocyclic lathyrane-type diterpenoids. Bioorg. Med. Chem. 2007, 15, 546–554. [Google Scholar] [CrossRef] [PubMed]
  19. Appendino, G.; Belloro, E.; Tron, G.C.; Jakupovic, J.; Ballero, M. Diterpenoids from euphorbia pithyusa subsp. cupanii. J. Nat. Prod. 1999, 62, 1399–1404. [Google Scholar] [CrossRef] [PubMed]
  20. Lin, M.; Tang, S.; Zhang, C.; Chen, H.; Huang, W.; Liu, Y.; Zhang, J. Euphorbia factor L2 induces apoptosis in A549 cells through the mitochondrial pathway. Acta Pharm. Sin. B 2017, 7, 59–64. [Google Scholar] [CrossRef] [PubMed]
  21. Zhang, J.Y.; Liang, Y.J.; Chen, H.B.; Zheng, L.S.; Mi, Y.J.; Wang, F.; Zhao, X.Q.; Wang, X.K.; Zhang, H.; Fu, L.W. Structure identification of Euphorbia factor L3 and its induction of apoptosis through the mitochondrial pathway. Molecules 2011, 16, 3222–3231. [Google Scholar] [CrossRef] [PubMed]
  22. Zhang, J.Y.; Lin, M.T.; Yi, T.; Tang, Y.N.; Fan, L.L.; He, X.C.; Zhao, Z.Z.; Chen, H.B. Apoptosis sensitization by Euphorbia factor L1 in ABCB1-mediated multidrug resistant K562/ADR cells. Molecules 2013, 18, 12793–12808. [Google Scholar] [CrossRef] [PubMed]
  23. Zhang, J.Y.; Mi, Y.J.; Chen, S.P.; Wang, F.; Liang, Y.J.; Zheng, L.S.; Shi, C.J.; Tao, L.Y.; Chen, L.M.; Chen, H.B.; et al. Euphorbia factor L1 reverses ABCB1-mediated multidrug resistance involving interaction with ABCB1 independent of ABCB1 downregualtion. J. Cell. Biochem. 2011, 112, 1076–1083. [Google Scholar] [CrossRef] [PubMed]
  24. Hu, J.; Zhang, X.; Wang, F.; Wang, X.; Yang, K.; Xu, M.; To, K.K.; Li, Q.; Fu, L. Effect of ceritinib (LDK378) on enhancement of chemotherapeutic agents in ABCB1 and ABCG2 overexpressing cells in vitro and in vivo. Oncotarget 2015, 6, 44643–44659. [Google Scholar] [CrossRef] [PubMed]
  25. Ciardiello, C.; Roca, M.S.; Noto, A.; Bruzzese, F.; Moccia, T.; Vitagliano, C.; Di Gennaro, E.; Ciliberto, G.; Roscilli, G.; Aurisicchio, L.; et al. Synergistic antitumor activity of histone deacetylase inhibitors and anti-ErbB3 antibody in NSCLC primary cultures via modulation of ErbB receptors expression. Oncotarget 2016, 7, 19559–19574. [Google Scholar] [CrossRef] [PubMed]
  26. Kang, J.H.; Lee, S.H.; Lee, J.S.; Nam, B.; Seong, T.W.; Son, J.; Jang, H.; Hong, K.M.; Lee, C.; Kim, S.Y. Aldehyde dehydrogenase inhibition combined with phenformin treatment reversed NSCLC through ATP depletion. Oncotarget 2016, 7, 49397–49410. [Google Scholar] [CrossRef] [PubMed]
  27. Sun, C.C.; Li, S.J.; Li, D.J. Hsa-miR-134 suppresses non-small cell lung cancer (NSCLC) development through down-regulation of CCND1. Oncotarget 2016, 7, 35960–35978. [Google Scholar] [CrossRef] [PubMed]
  28. Wang, F.; Chen, Y.; Huang, L.; Liu, T.; Huang, Y.; Zhao, J.; Wang, X.; Yang, K.; Ma, S.; Huang, L.; et al. Cetuximab enhanced the efficacy of chemotherapeutic agent in ABCB1/P-glycoprotein-overexpressing cancer cells. Oncotarget 2015, 6, 40850–40865. [Google Scholar] [CrossRef] [PubMed]
  29. Corte, C.M.D.; Ciaramella, V.; Mauro, C.D.; Castellone, M.D.; Papaccio, F.; Fasano, M.; Sasso, F.C.; Martinelli, E.; Troiani, T.; De Vita, F.; et al. Metformin increases antitumor activity of MEK inhibitors through GLI1 downregulation in LKB1 positive human NSCLC cancer cells. Oncotarget 2016, 7, 4265–4278. [Google Scholar] [CrossRef] [PubMed]
  30. Chen, S.; Wang, Y.; Zhou, W.; Li, S.; Peng, J.; Shi, Z.; Hu, J.; Liu, Y.C.; Ding, H.; Lin, Y.; et al. Identifying novel selective non-nucleoside DNA methyltransferase 1 inhibitors through docking-based virtual screening. J. Med. Chem. 2014, 57, 9028–9041. [Google Scholar] [CrossRef] [PubMed]
  31. Shen, B. A new golden age of natural products drug discovery. Cell 2015, 163, 1297–1300. [Google Scholar] [CrossRef] [PubMed]
  32. Xie, J.; Liu, J.; Liu, H.; Liang, S.; Lin, M.; Gu, Y.; Liu, T.; Wang, D.; Ge, H.; Mo, S.L. The antitumor effect of tanshinone IIA on anti-proliferation and decreasing VEGF/VEGFR2 expression on the human non-small cell lung cancer A549 cell line. Acta Pharm. Sin. B 2015, 5, 554–563. [Google Scholar] [CrossRef] [PubMed]
  33. Chen, D.; Shen, A.; Fang, G.; Liu, H.; Zhang, M.; Tang, S.; Xiong, B.; Ma, L.; Geng, M.; Shen, J. Tetrahydroisoquinolines as novel histone deacetylase inhibitors for treatment of cancer. Acta Pharm. Sin. B 2016, 6, 93–99. [Google Scholar] [CrossRef] [PubMed]
  34. Yan, X.; Zhang, L.; Cao, Y.; Yao, W.; Tang, Y.; Ding, A. An ingenol derived from Euphorbia kansui induces hepatocyte cytotoxicity by triggering G0/G1 cell cycle arrest and regulating the mitochondrial apoptosis pathway in vitro. Molecules 2016, 21, 813. [Google Scholar] [CrossRef] [PubMed]
  35. Ravindranath, N.; Ravinder, R.M.; Ramesh, C.; Ramu, R.; Prabhakar, A.; Jagadeesh, B.; Das, B. New lathyrane and podocarpane diterpenoids from Jatropha curcas. Chem. Pharm. Bull. (Tokyo) 2004, 52, 608–611. [Google Scholar] [CrossRef] [PubMed]
  36. Sousa, I.J.; Ferreira, M.J.; Molnar, J.; Fernandes, M.X. QSAR studies of macrocyclic diterpenes with P-glycoprotein inhibitory activity. Eur. J. Pharm. Sci. 2013, 48, 542–553. [Google Scholar] [CrossRef] [PubMed]
  37. Khodayari, N.; Mohammed, K.A.; Lee, H.; Kaye, F.; Nasreen, N. MicroRNA-302b targets Mcl-1 and inhibits cell proliferation and induces apoptosis in malignant pleural mesothelioma cells. Am. J. Cancer Res. 2016, 6, 1996–2009. [Google Scholar] [PubMed]
  38. Liu, X.; Lv, Z.; Zou, J.; Liu, X.; Ma, J.; Wang, J.; Sa, N.; Jing, P.; Xu, W. Afatinib down-regulates MCL-1 expression through the PERK-eIF2alpha-ATF4 axis and leads to apoptosis in head and neck squamous cell carcinoma. Am. J. Cancer Res. 2016, 6, 1708–1719. [Google Scholar] [PubMed]
  39. Huang, W.; Zhang, S.; Yang, Z.; Feng, B. Screening novel SAHA derivatives as anti-lung carcinoma agents: Synthesis, biological evaluation, docking studies and further mechanism research between apoptosis and autophagy. Anticancer Agents Med. Chem. 2015, 15, 1277–1284. [Google Scholar] [CrossRef] [PubMed]
  40. Lv, D.; Liu, J.; Guo, L.; Wu, D.; Matsumoto, K.; Huang, L. PRAS40 deregulates apoptosis in Ewing sarcoma family tumors by enhancing the insulin receptor/Akt and mTOR signaling pathways. Am. J. Cancer Res. 2016, 6, 486–497. [Google Scholar] [PubMed]
  41. Su, J.; Zhou, X.; Wang, L.; Yin, X.; Wang, Z. Curcumin inhibits cell growth and invasion and induces apoptosis through down-regulation of Skp2 in pancreatic cancer cells. Am. J. Cancer Res. 2016, 6, 1949–1962. [Google Scholar] [PubMed]
  42. Wu, X.; Li, L.; Li, Y.; Liu, Z. MiR-153 promotes breast cancer cell apoptosis by targeting HECTD3. Am. J. Cancer Res. 2016, 6, 1563–1571. [Google Scholar] [PubMed]
  43. Cho, Y.; Yoon, J.H.; Yoo, J.J.; Lee, M.; Lee, D.H.; Cho, E.J.; Lee, J.H.; Yu, S.J.; Kim, Y.J.; Kim, C.Y. Fucoidan protects hepatocytes from apoptosis and inhibits invasion of hepatocellular carcinoma by up-regulating p42/44 MAPK-dependent NDRG-1/CAP43. Acta Pharm. Sin. B 2015, 5, 544–553. [Google Scholar] [CrossRef] [PubMed]
  44. Sha, M.; Mao, G.; Wang, G.; Chen, Y.; Wu, X.; Wang, Z. DZNep inhibits the proliferation of colon cancer HCT116 cells by inducing senescence and apoptosis. Acta Pharm. Sin. B 2015, 5, 188–193. [Google Scholar] [CrossRef] [PubMed]
  45. Peng, X.; Yu, Z.; Liang, N.; Chi, X.; Li, X.; Jiang, M.; Fang, J.; Cui, H.; Lai, W.; Zhou, Y.; et al. The mitochondrial and death receptor pathways involved in the thymocytes apoptosis induced by aflatoxin B1. Oncotarget 2016, 7, 12222–12234. [Google Scholar] [CrossRef] [PubMed]
  46. Qiao, C.; Lu, N.; Zhou, Y.; Ni, T.; Dai, Y.; Li, Z.; Guo, Q.; Wei, L. Oroxylin A modulates mitochondrial function and apoptosis in human colon cancer cells by inducing mitochondrial translocation of wild-type p53. Oncotarget 2016, 7, 17009–17020. [Google Scholar] [CrossRef] [PubMed]
  47. Chuang, W.L.; Lin, P.Y.; Lin, H.C.; Chen, Y.L. The apoptotic effect of ursolic acid on SK-Hep-1 cells is regulated by the PI3K/Akt, p38 and JNK MAPK signaling pathways. Molecules 2016, 21, 460. [Google Scholar] [CrossRef] [PubMed]
  48. Wang, X.H.; Jia, D.Z.; Liang, Y.J.; Yan, S.L.; Ding, Y.; Chen, L.M.; Shi, Z.; Zeng, M.S.; Liu, G.F.; Fu, L.W. Lgf-YL-9 induces apoptosis in human epidermoid carcinoma KB cells and multidrug resistant KBv200 cells via reactive oxygen species-independent mitochondrial pathway. Cancer Lett. 2007, 249, 256–270. [Google Scholar] [CrossRef] [PubMed]
  49. Hanikoglu, F.; Cort, A.; Ozben, H.; Hanikoglu, A.; Ozben, T. Epoxomicin sensitizes resistant osteosarcoma cells to Trail induced apoptosis. Anticancer Agents Med. Chem. 2015, 15, 527–533. [Google Scholar] [CrossRef] [PubMed]
  50. Ye, W.; Chen, Y.; Li, H.; Zhang, W.; Liu, H.; Sun, Z.; Liu, T.; Li, S. Two trichothecene mycotoxins from myrothecium roridum induce apoptosis of HepG-2 cells via caspase activation and disruption of mitochondrial membrane potential. Molecules 2016, 21, 781. [Google Scholar] [CrossRef] [PubMed]
  51. Zhang, J.Y.; Tao, L.Y.; Liang, Y.J.; Chen, L.M.; Mi, Y.J.; Zheng, L.S.; Wang, F.; She, Z.G.; Lin, Y.C.; To, K.K.; et al. Anthracenedione derivatives as anticancer agents isolated from secondary metabolites of the mangrove endophytic fungi. Mar. Drugs 2010, 8, 1469–1481. [Google Scholar] [CrossRef] [PubMed]
  52. Tao, Y.W.; Lin, Y.C.; She, Z.G.; Lin, M.T.; Chen, P.X.; Zhang, J.Y. Anticancer activity and mechanism investigation of beauvericin isolated from secondary metabolites of the mangrove endophytic fungi. Anticancer Agents Med. Chem. 2015, 15, 258–266. [Google Scholar] [CrossRef] [PubMed]
  53. Goswami, A.; Shah, B.A.; Batra, N.; Kumar, A.; Guru, S.K.; Bhushan, S.; Malik, F.A.; Joshi, A.; Singh, J. Multiple pharmacological properties of a novel parthenin analog P16 as evident by its cytostatic and antiangiogenic potential against pancreatic adenocarcinoma PANC-1 cells. Anticancer Agents Med. Chem. 2016, 16, 771–780. [Google Scholar] [CrossRef] [PubMed]
  54. Zhang, J.Y.; Wu, H.Y.; Xia, X.K.; Liang, Y.J.; Yan, Y.Y.; She, Z.G.; Lin, Y.C.; Fu, L.W. Anthracenedione derivative 1403P-3 induces apoptosis in KB and KBv200 cells via reactive oxygen species-independent mitochondrial pathway and death receptor pathway. Cancer Biol. Ther. 2007, 6, 1413–1421. [Google Scholar] [CrossRef] [PubMed]
  55. Sun, J.; Wang, S.; Bu, W.; Wei, M.Y.; Li, W.W.; Yao, M.N.; Ma, Z.Y.; Lu, C.T.; Li, H.H.; Hu, N.P.; et al. Synthesis of a novel adamantyl nitroxide derivative with potent anti-hepatoma activity in vitro and in vivo. Am. J. Cancer Res. 2016, 6, 1271–1286. [Google Scholar] [PubMed]
  56. Wang, F.; Lin, J.; Hou, W.; Huang, M.Y.; Sun, P.H.; Chen, W.M. 5-Benzylidene-3,4-dihalo-furan-2-one derivatives inhibit human leukemia cancer cells through suppression of NF-kappaB and GSK-3beta. Anticancer Agents Med. Chem. 2015, 15, 744–754. [Google Scholar] [CrossRef] [PubMed]
  57. Wang, X.K.; He, J.H.; Xu, J.H.; Ye, S.; Wang, F.; Zhang, H.; Huang, Z.C.; To, K.K.; Fu, L.W. Afatinib enhances the efficacy of conventional chemotherapeutic agents by eradicating cancer stem-like cells. Cancer Res. 2014, 74, 4431–4445. [Google Scholar] [CrossRef] [PubMed]
  58. Zhang, J.Y.; Lin, M.T.; Zhou, M.J.; Yi, T.; Tang, Y.N.; Tang, S.L.; Yang, Z.J.; Zhao, Z.Z.; Chen, H.B. Combinational treatment of curcumin and quercetin against gastric cancer MGC-803 cells in vitro. Molecules 2015, 20, 11524–11534. [Google Scholar] [CrossRef] [PubMed]
  59. Zhang, J.Y.; Yi, T.; Liu, J.; Zhao, Z.Z.; Chen, H.B. Quercetin induces apoptosis via the mitochondrial pathway in KB and KBv200 cells. J. Agric. Food Chem. 2013, 61, 2188–2195. [Google Scholar] [CrossRef] [PubMed]
  60. Zhang, J.Y.; Lin, M.T.; Tung, H.Y.; Tang, S.L.; Yi, T.; Zhang, Y.Z.; Tang, Y.N.; Zhao, Z.Z.; Chen, H.B. Bruceine D induces apoptosis in human chronic myeloid leukemia K562 cells via mitochondrial pathway. Am. J. Cancer Res. 2016, 6, 819–826. [Google Scholar] [PubMed]
Sample Availability: Sample of the lathyrol-3-phenylacetate-5,15-diacetate are available from the authors.
Figure 1. (A) Chemical structure of lathyrol-3-phenylacetate-5,15-diacetate (deoxy Euphorbia factor L1, DEFL1); (B) Growth inhibition curve of DEFL1 against A549, KB and HCT116 cells.
Molecules 22 01412 g001
Figure 2. DEFL1 inhibition of A549 cells growth and migration. (A) Microscopic observation of A549 cells wound healing results after treatment of different concentrations for the indicated time; (B) Statistical analysis results of different concentration groups compared at 12, 24 and 48 h, respectively.** p < 0.01.
Molecules 22 01412 g002
Figure 3. DEFL1 treatment led to an increase of ROS levels in A549 cells in a time-course manner. (A) ROS generation increase was observed after exposured to 18.0 μM DEFL1 for the indicated time; (B) Intracellular ROS levels of A549 cells is expressed as a percentage of control. ** p < 0.01.
Molecules 22 01412 g003aMolecules 22 01412 g003b
Figure 4. Decrease of ΔΨm was observed after A549 cells were exposed to DEFL1 showing a time-dependent pattern. (A) Reduction of ΔΨm measured by flow cytometry; (B) A549 cells ΔΨm at different time was expressed as a percentage of control. ** p < 0.01.
Molecules 22 01412 g004
Figure 5. Exposure to DEFL1 resulted in release of cytochrome c. (A) Western blotting results of cytochrome c after various time of treatment; (B) Relative gray values of western blotting results were determined by Image J. ** p < 0.01.
Molecules 22 01412 g005
Figure 6. Caspase-9, -3 were activated and apoptosis character of Hoechst 33258 staining was observed. (A) Activities of caspase-9 and -3 in A549 cells were significantly enhanced by DEFL1 in time-dependent manner; (B) Hoechst 33258 staining confirmed the apoptosis, displaying morphological changes of apoptosis. ** p < 0.01.
Molecules 22 01412 g006aMolecules 22 01412 g006b
Figure 7. Proposed mechanism of DEFL1 regarding apoptosis inducement in A549 cells.
Molecules 22 01412 g007
Table 1. 1H- and 13C-NMR data of DEFL1 (δ, CDCl3, 500 and 125 MHz for 13C and 1H, respectively).
Position13C1HHMBC (H→C)
148.33.40 (1H, dd, J = 8, 14 Hz)
1.44 (1H, J = 14, 11 Hz)
2, 3, 4, 14, 15
237.42.01 (1H, m)1, 3, 4, 15, 16
380.65.60 (1H, t, J = 3 Hz)1, 1’, 15
452.22.79 (1H, dd, J = 3.6, 10 Hz)5, 6, 14
565.96.12 (1H, d, J = 10.4 Hz)4, 6, 7, 15, 5-CO
6144.4
735.02.11 (1H, m), 2.20 (1H, m)5, 6, 8, 9, 17
821.72.01 (1H, m), 1.71 (1H, m)6, 9
935.31.1 (1H , m)18, 19
1025.2
1129.01.40 (1H, dd, J = 8.4, 11.6 Hz)9, 10, 12, 13
12146.76.54 (1H, d, 11.2 Hz)9, 14, 20
13134.1
14196.8
1592.3
1613.70.73 (3H, d, J = 6.4 Hz)1, 2, 3
17115.65.01 (1H, s), 4.74 (1H, s)5, 6, 7
1828.41.19 (3H, s)9, 10, 11, 19
1916.81.18 (3H, s)9, 10, 11, 18
2012.41.70 (3H, s)12, 13, 14
5-COCH3CH321.31.96 (3H, s)5-CO
CO170.7
15-COCH3CH322.02.20 (3H, s)15-CO
CO169.8
3-OPhAc1′171.3
2’41.63.64 (1H, d, J = 15 Hz), 3.62 (1H, d, J = 15 Hz)1′, 3′, 4′, 8′
3′134.0
6′127.17.25 (1H, m)4′, 8′
4′, 8′129.57.31 (2H, m)2’, 3′
5′, 7′128.57.33 (2H, m)3′

