1. Introduction
Breast cancer is a complex disease that results from the interaction of multiple environmental, hormonal, and lifestyle risk factors with the individual’s genome [
1]. Although the inherited risk factors cannot be changed, most lifestyle factors are modifiable and the risks for many women to get breast cancer can be reduced. Approximately, one third of the cancer in women arises from the breast. In 2007, there were 3242 female breast cancer cases reported in Malaysia, which accounted for 18.1% of all cancer cases registered and 32.1% of all female cases. Tamoxifen is the drug of choice in the treatment of estrogen receptor positive breast cancer [
2]. Although chemoprevention using tamoxifen showed positive result in reduction of breast cancer patient’s mortality, women need to be informed of the adverse effects of tamoxifen. The adverse effects include vaginal discharge, hot flashes, and other significant risks for stroke (2-fold increased risk), endometrial cancer (2 per 1000 women per year), and life-threatening thromboembolic disease (2- to 3-fold increased risk) [
3]. Although tamoxifen is the drug of choice in the treatment of estrogen receptor positive breast cancer, breast cancer patients are often treated with combinations of other drugs like doxorubicin for their treatment. Doxorubicin may be utilized after relapse in patients treated with tamoxifen or in patients with estrogen receptor negative breast cancer [
4]. Doxorubicin is a powerful antitumoral drug and the effect of doxorubicin on tumor cells is mediated through multiple mechanisms. These include intercalation in DNA molecules, breaking of DNA strands by interaction with topoisomerase II, free radical formation and alteration of membrane structure [
5]. Although tamoxifen and doxorubicin have been utilized in combination, the advantage of this combination in terms of therapeutic efficacy remains controversial. According to an in vitro by study Woods et al. [
6], antagonistic effects between tamoxifen and doxorubicin were observed in the MCF-7 human breast cancer cell line. According to Woods et al. there are many factors that may influence the ultimate response to antitumor drugs in combination regimens like the clinical pharmacokinetics of the administered drugs, innate drug resistance and the extent of hormone dependency [
6].
For centuries, scientists and medical professionals have been investigating chemical constituents in all parts of
Morinda citrifolia (Noni or Yor).
Morinda citrifolia L. (Rubiaceae) is a small tree, known commercially as noni that grows widely throughout the Pacific and is one of the most significant sources of traditional medicines among Pacific Islander societies in Hawaii, Fiji, Vanuatu, New Guinea, New Caledonia, and the Solomon Islands. All parts of the plant, including the roots, barks, stems, leaves, and fruits have been used traditionally as folk medicines for the treatment of many diseases, including diabetes, hypertension, and cancer [
7]. According to Furusawa et al. [
8] noni fruit juice is not cytotoxic in cell cultures (Lewis lung carcinoma cell line, sarcoma 180 cells, human KB carcinoma cell line, or normal NIH/3T3 and BALB/3T3 cell lines), but the juice can indirectly kill the cancer cells via activation of the cellular immune system involving macrophages, natural killer cells and T cells. Hence, noni fruit juice is one the powerful antitumor immunostimulators of plant food origin without having toxicity. Anekpankul et al. [
9] reported that this plant contains several medicinally active components exhibiting various therapeutic effects. Roots of
Morinda citrifolia are the source of important compounds, i.e., anthraquinones, which have been proven to have anti-viral, anti-bacterial, and anti-cancer activities. The most medicinally valuable anthraquinone in the roots of this plant is damnacanthal, which has been used for the treatment of chronic diseases such as cancer and heart disease [
9].
It would be interesting if damnacanthal were used in combination with other drugs that are used in treating patients diagnosed with estrogen receptor positive breast cancer, since tamoxifen and doxorubicin shows antagonistic effects when used in combination on MCF-7 cells [
6]. Although there are reports on the clinical application of noni juice as a supplemental agent for cancer treatment [
10], there is no report on the effects of combining other anticancer drugs with damnacanthal. That study indicated that noni juice is able to enhance the therapeutic effect of the anticancer drug taxol on leukemia cells and this finding prompted the study on the use of a combination of anticancer drug with other phytochemical such as damnacanthal. Thus, the combination may be able to decrease the dose of synthetic anticancer drugs used, increase the tolerance of patients to the toxicity of anticancer drugs and increase the immune function. In this study, a combination of damnacanthal and doxorubicin were used to determine whether damnacanthal was able to enhance the therapeutic effect of doxorubicin or not. To achieve this objective, different concentrations of damnacanthal based on its CD
50 value (the concentration that inhibited 50% viability of the MCF-7 cell population by the treatment) were used to treat MCF-7 cells with or without the presence of doxorubicin.
3. Discussion
Doxorubicin is an anthracycline antibiotic, formed from natural products produced by species of the soil fungus
Streptomyces. It is used in breast cancer chemotherapy. However, the therapy using doxorubicin is of limited use due to its serious side effects such as bone marrow and considerable cumulative cardiac toxicity [
11]. Magrath [
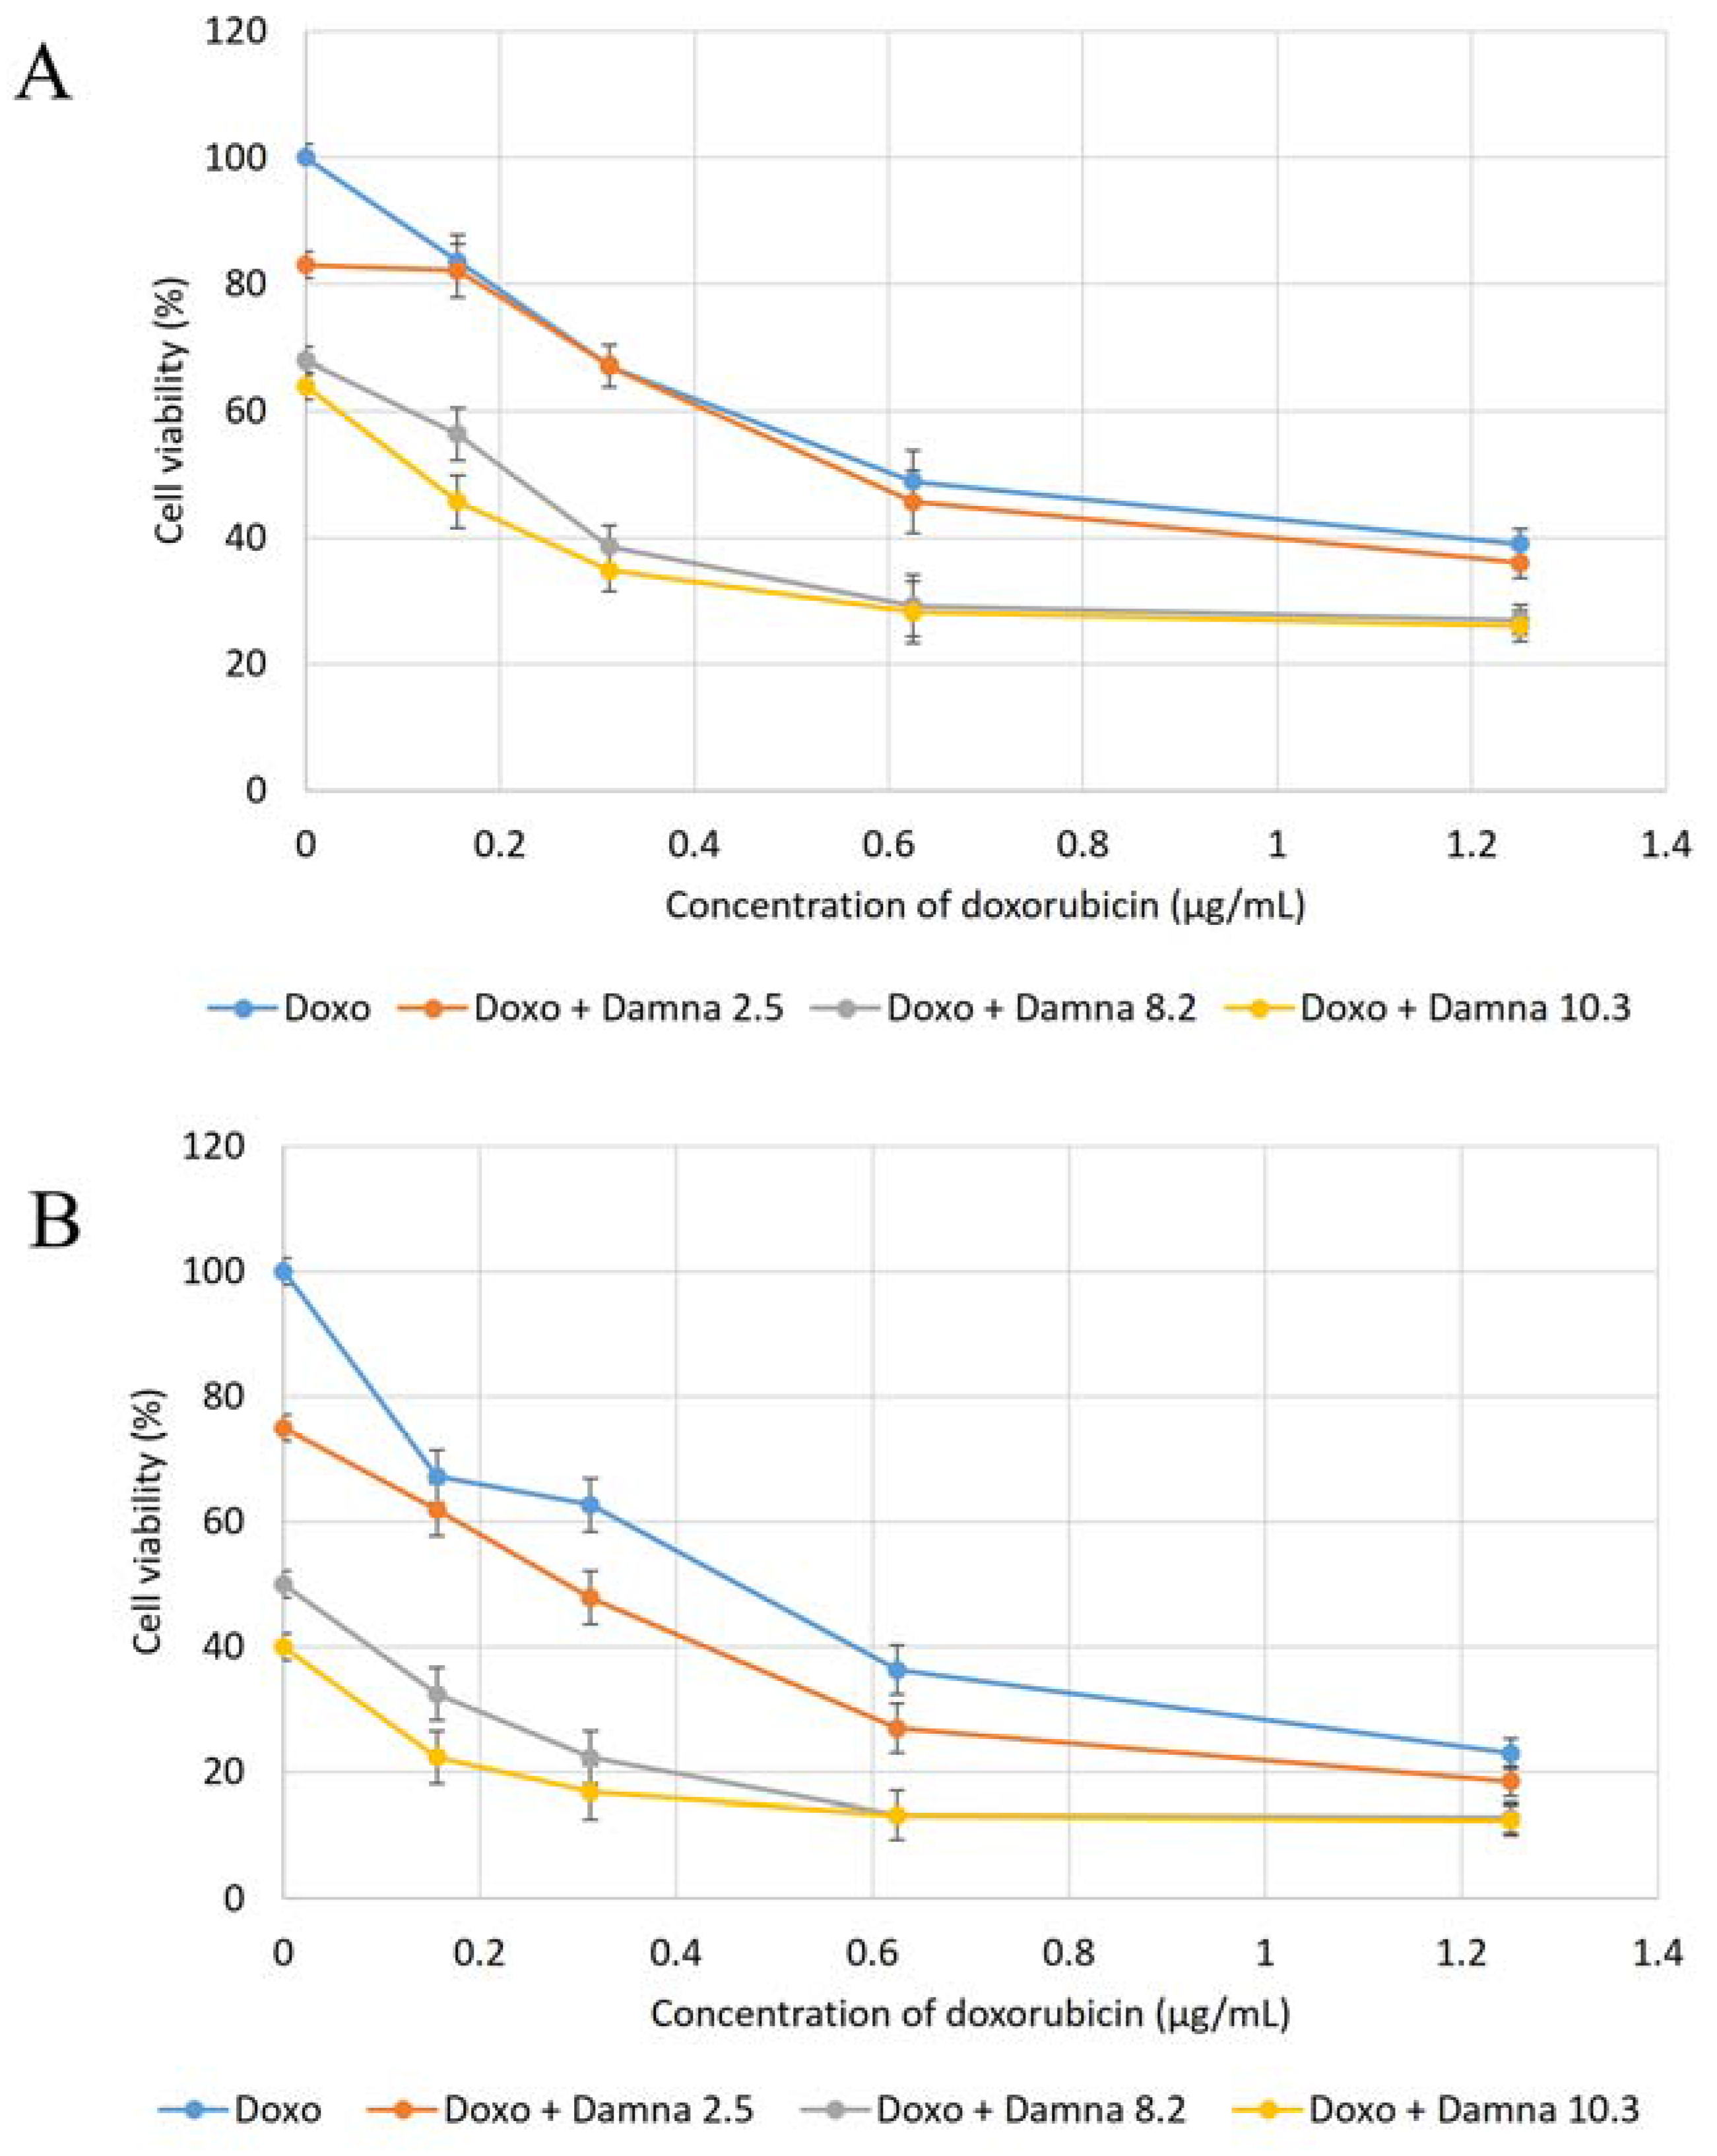
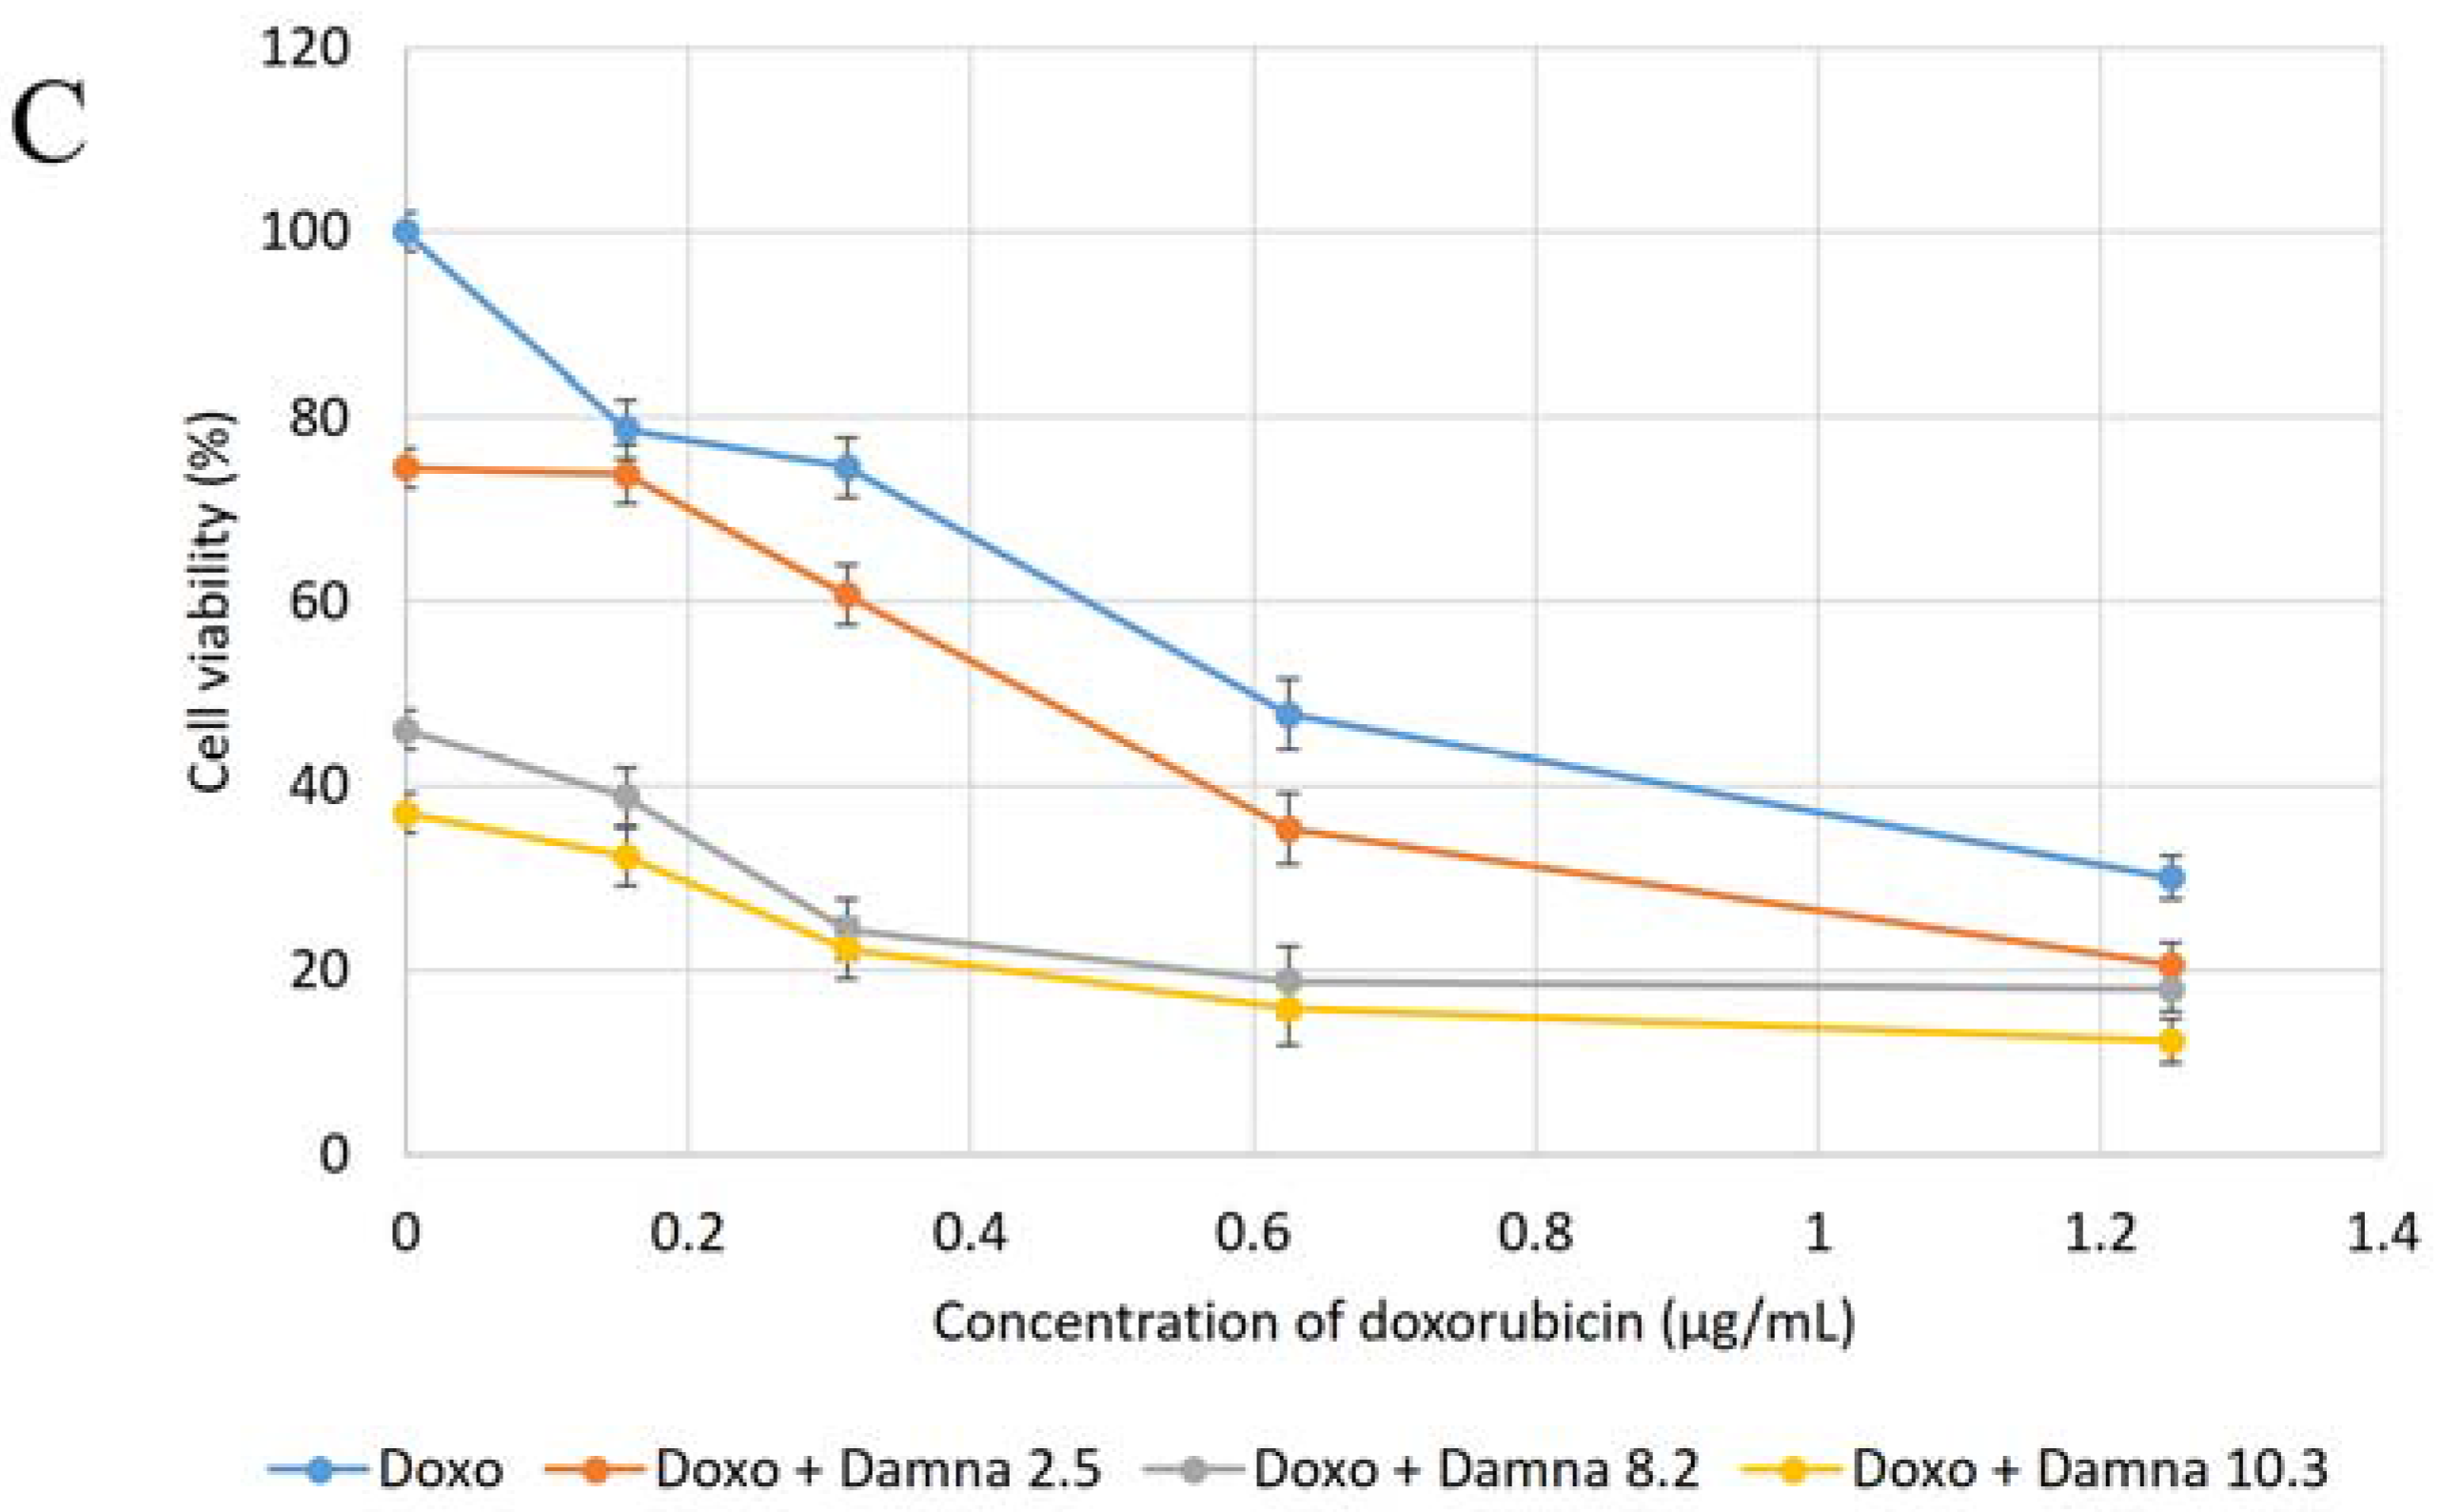
12] suggested that the conjugation of doxorubicin to a specific carrier molecule may reduce its side effects and also overcome drug-acquired tumor cell resistance. Therefore, this study aimed to investigate the potential cytotoxic effect of damnacanthal against MCF-7 cells and its interaction with doxorubicin. In the beginning, the cytotoxic effects of the combination of damnacanthal and doxorubicin on MCF-7 cells were determined using a slightly modified MTT assay. As demonstrated in
Figure 4A–C, the MCF-7 cells were treated with anti-cancer drug doxorubicin alone and its combination with damnacanthal. The results showed that the CD
50 value of doxorubicin toward MCF-7 cells dropped when the cells were treated in combination with damnacanthal. The concentrations of damnacanthal corresponding to its CD
25 (2.5 µg/mL), CD
50 (8.2 µg/mL) and CD
60 (10.3 µg/mL) values were determined based on the reported results. From the results, the population of MCF-7 cells decreased more when it was treated with the combination of doxorubicin and damnacanthal compared to the use of doxorubicin alone. The combination of damnacanthal and doxorubicin thus led to an enhancement of the cytotoxicity of doxorubicin. In principle, this result is similar to the cytotoxic effect of mistletoe (
Viscum album L.) extract combined with doxorubicin on Jurkat cells [
13]. It was reported that the extract’s interaction with doxorubicin produced synergistic effects when used in combination.
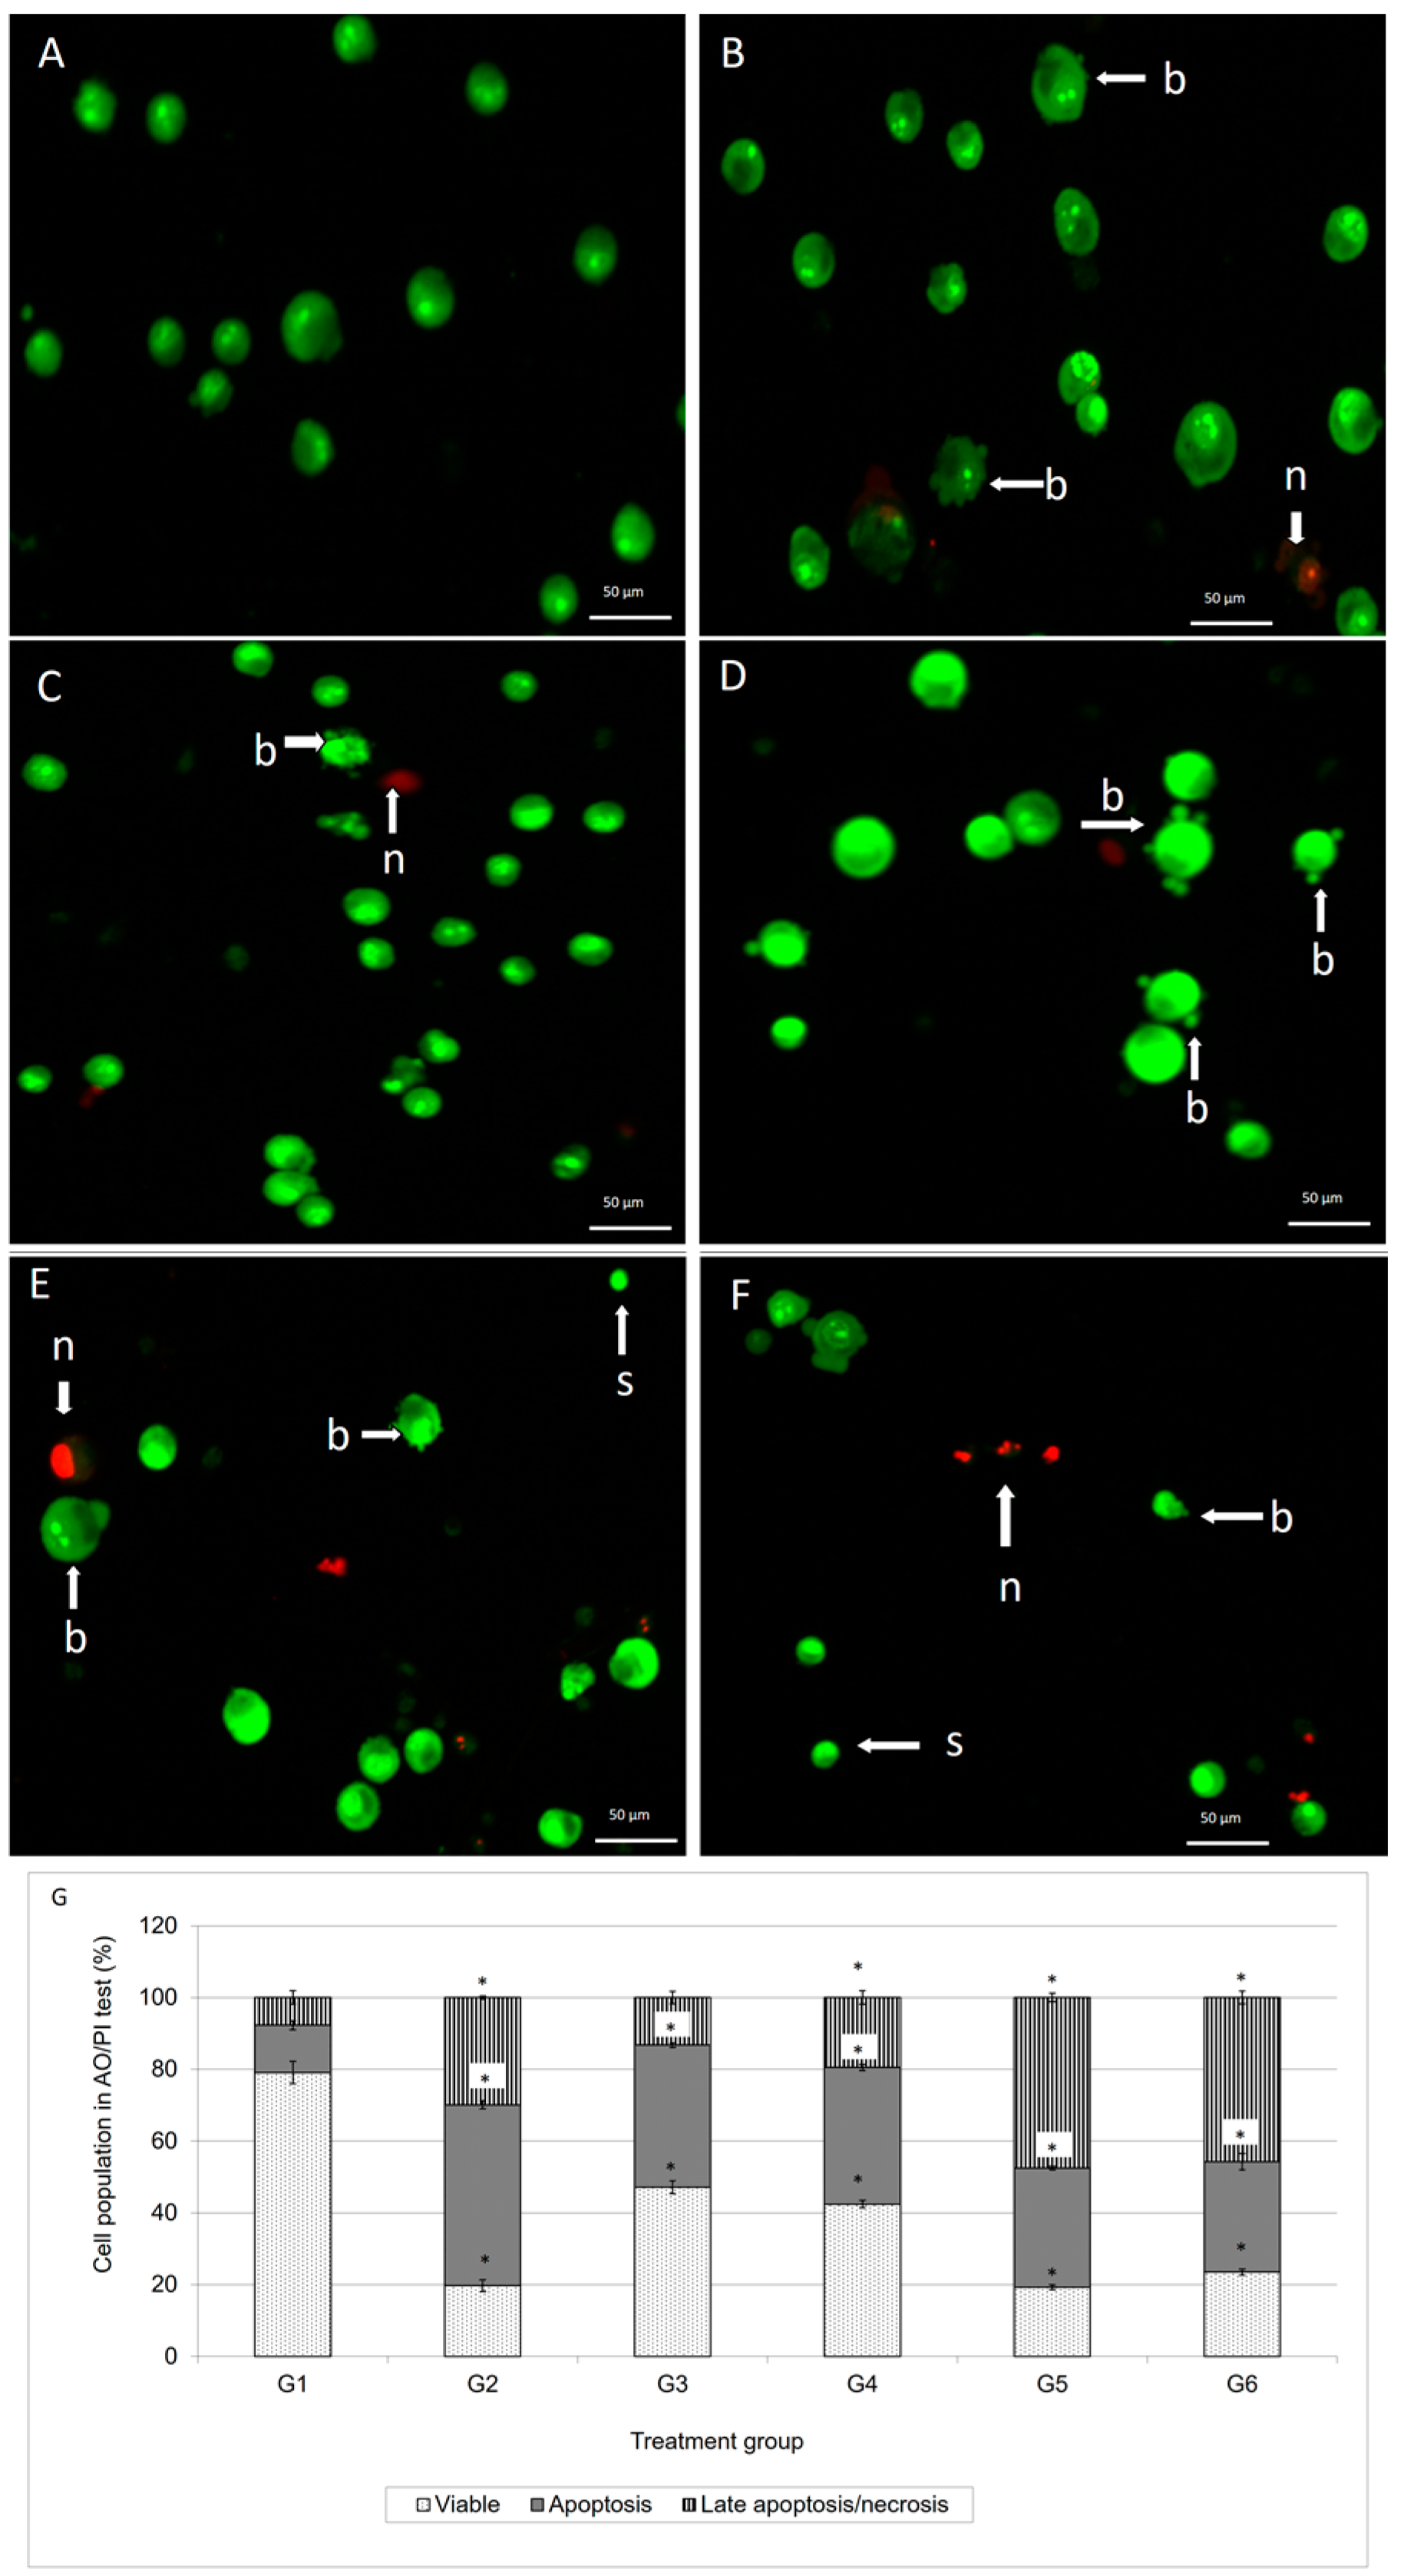
Staining of apoptotic cells with fluorescent dyes such as AO and PI is considered the appropriate method for evaluating the changes in nuclear morphology [
14]. This AO/PI staining primarily exhibits the entire aspect of cellular alterations, counting chromatin condensation and nuclear fragmentation [
15]. As demonstrated in
Figure 2, the AO/PI double staining procedure allowed us to distinguish several sub-populations of apoptotic cells from viable, early-membrane intact apoptotic and necrotic cell populations’ [
16] nuclear morphology such as perinuclear chromatin condensation, membrane blebbing, cell shrinkage, nuclear collapse and eventual DNA fragmentation of MCF-7 treated cells, while untreated MCF-7 cells appeared to have bright green nuclei with intact structures. These features were seen in the MCF-7 treated-population as dense as green areas in the cytoplasms. Furthermore, AO is a nucleic acid selective fluorescent cationic dye that develops a protonated positive charge when it cross the plasma membrane of viable and early apoptotic cells and intercalates into DNA and RNA to produce green fluorescence [
15,
17]. Meanwhile, PI interacts with nucleic acids in cells with lysed membranes making them appear orange [
15,
17]. As shown in
Figure 2, the MCF-7 cells treated with doxorubicin and its combination with damnacanthal underwent apoptosis, rather than necrosis. This suggested that their combination was able to enhance the cytotoxic effects on MCF-7 cells, probably causing apoptosis.
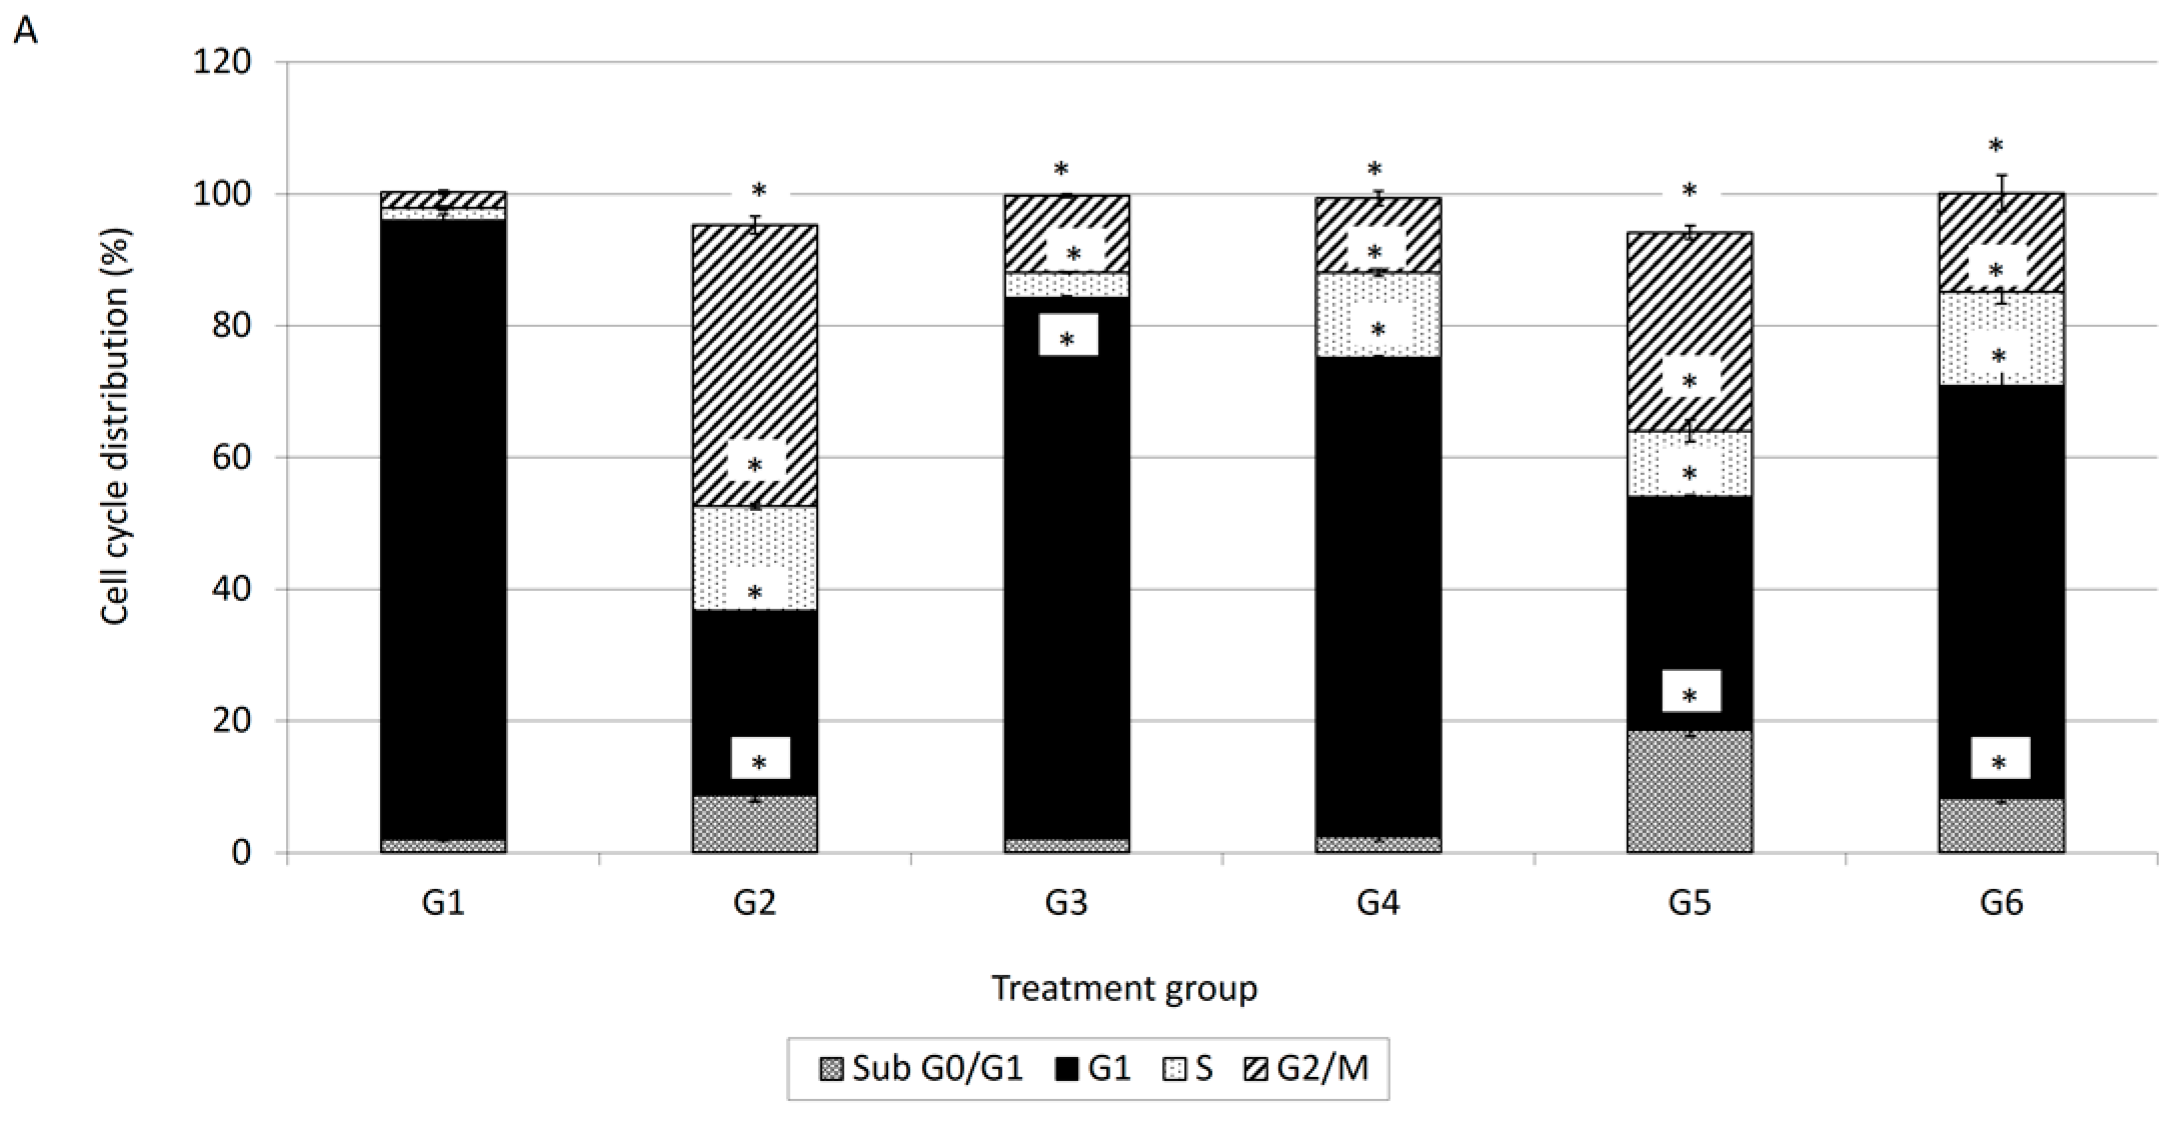
Cell cycle analysis is important for evaluating cell cycle parameters of surviving cells upon treatment or cell damage. When cells are damaged the cell cycle is interrupted at certain checkpoints and this prevents the normal cells from being transformed into cancer cells [
18]. It is a simple method to estimate apoptosis because the DNA fragmentation is a hallmark of apoptosis caused by cellular endonuclease. Nuclei of apoptotic cells contain less DNA than healthy G1 cells; as a result, a sub-G
0/G
1 peak will observed before the G
1 peak in the fluorescence histogram [
18]. Therefore, cell cycle analysis has been carried out to evaluate the effect of damnacanthal, doxorubicin or their combination on MCF-7 cells. In conjunction with the decrement of percentage of viable cells in the MTT assay, cell cycle analysis showed an increment in the sub-G
0/G
1 population, indicating the occurrence of apoptosis in MCF-7 cells treated with the combination of damnacanthal and doxorubicin. Cell cycle analysis revealed that MCF-7 cells treated with damnacanthal have induced apoptosis and cell cycle is arrested at the G
1 phase while MCF-7 cells treated with doxorubicin have induced apoptosis and cell cycle is arrested at the G2/M phase. This finding was similar to that of Ling et al. [
19]. They reported that doxorubicin-induced cytotoxicity is cell cycle dependent and is mediated, at least in part, by disturbance of the regulation of p34cdc2/cyclin B1 complex, thus leading to G2/M phase arrest. Andreas et al. [
20] reported that the cytotoxic effects on doxorubicin treated HepG2 cells are generally considered to be cell cycle specific where arrest occurs at the G2/M phase. In the present study, we found that the combination of damnacanthal and doxorubicin had a higher percentage of cells with hypo-diploid DNA content (sub-G
0/G
1). DNA histograms for MCF-7 cells treated with the combination of damnacanthal and doxorubicin exhibited a prominent decrease of the G
1 phase cell population at 72 h of incubation.
The early apoptosis process involves the alteration of cell membranes. In normal living cells, phosphatidylserine (PS) is located on the inner cytoplasmic surface of cell membrane. While apoptotic cells will expose PS on their intact cell membrane’s surface [
21,
22] the PS externalization can be detected by annexin V-FITC conjugation [
23]. With annexin V-FITC/PI, it is possible to detect live, viable cells (annexin V-FITC
−/PI
−), early apoptosis (annexin V-FITC
+/PI
−) and late apoptotic or necrotic cells (annexin V-FITC
+/PI
+) [
17]. However, flow cytometry cannot distinguish between late apoptotic and necrotic cells. Morphological analysis by light microscopy and/or AO/PI fluorescence microscopy should resolve this problem. This annexin V-FITC/PI analysis revealed the percentage of different cell characteristics for MCF-7 cells treated with either damnacanthal and doxorubicin alone or a combination of both. In
Figure 3B, the percentages of early apoptotic cells are relatively higher for damnacanthal and doxorubicin treatment rather than the combination of both treatments but the percentages of late apoptotic cells are higher for the combination of both treatments. Meanwhile, the percentages of late apoptotic cells are relatively higher for the combination of both treatments compared to damnacanthal or doxorubicin alone (
Figure 3B). The percentages of early apoptotic cell population were relatively higher compared to those obtained via the AO/PI double staining method. This is due to fact that the annexin V-FITC/PI method detected the earlier stage of cell apoptosis before the plasma membrane lost its integrity. While, the AO/PI double staining method targeted later stages of apoptosis than tests based on nuclear morphology [
16].
The expression of p21 gene is controlled by p53 protein. p21 is a potent cyclin-dependent kinase inhibitor (CKI) where it binds to and inhibits the activity of cyclin-CDK2 or -CDK1 complexes, and thus functions as a regulator of cell cycle progression at G
1 use consistent nomenclature (All cell cycle gap phases were change to G
0, G
1, G
2 to avoid confusion with the treatment groups) [
24]. Besides that, p21 acts as the stopper in the cell cycle that allows DNA repair and/or synthesis [
25] and also a promoter of cell death [
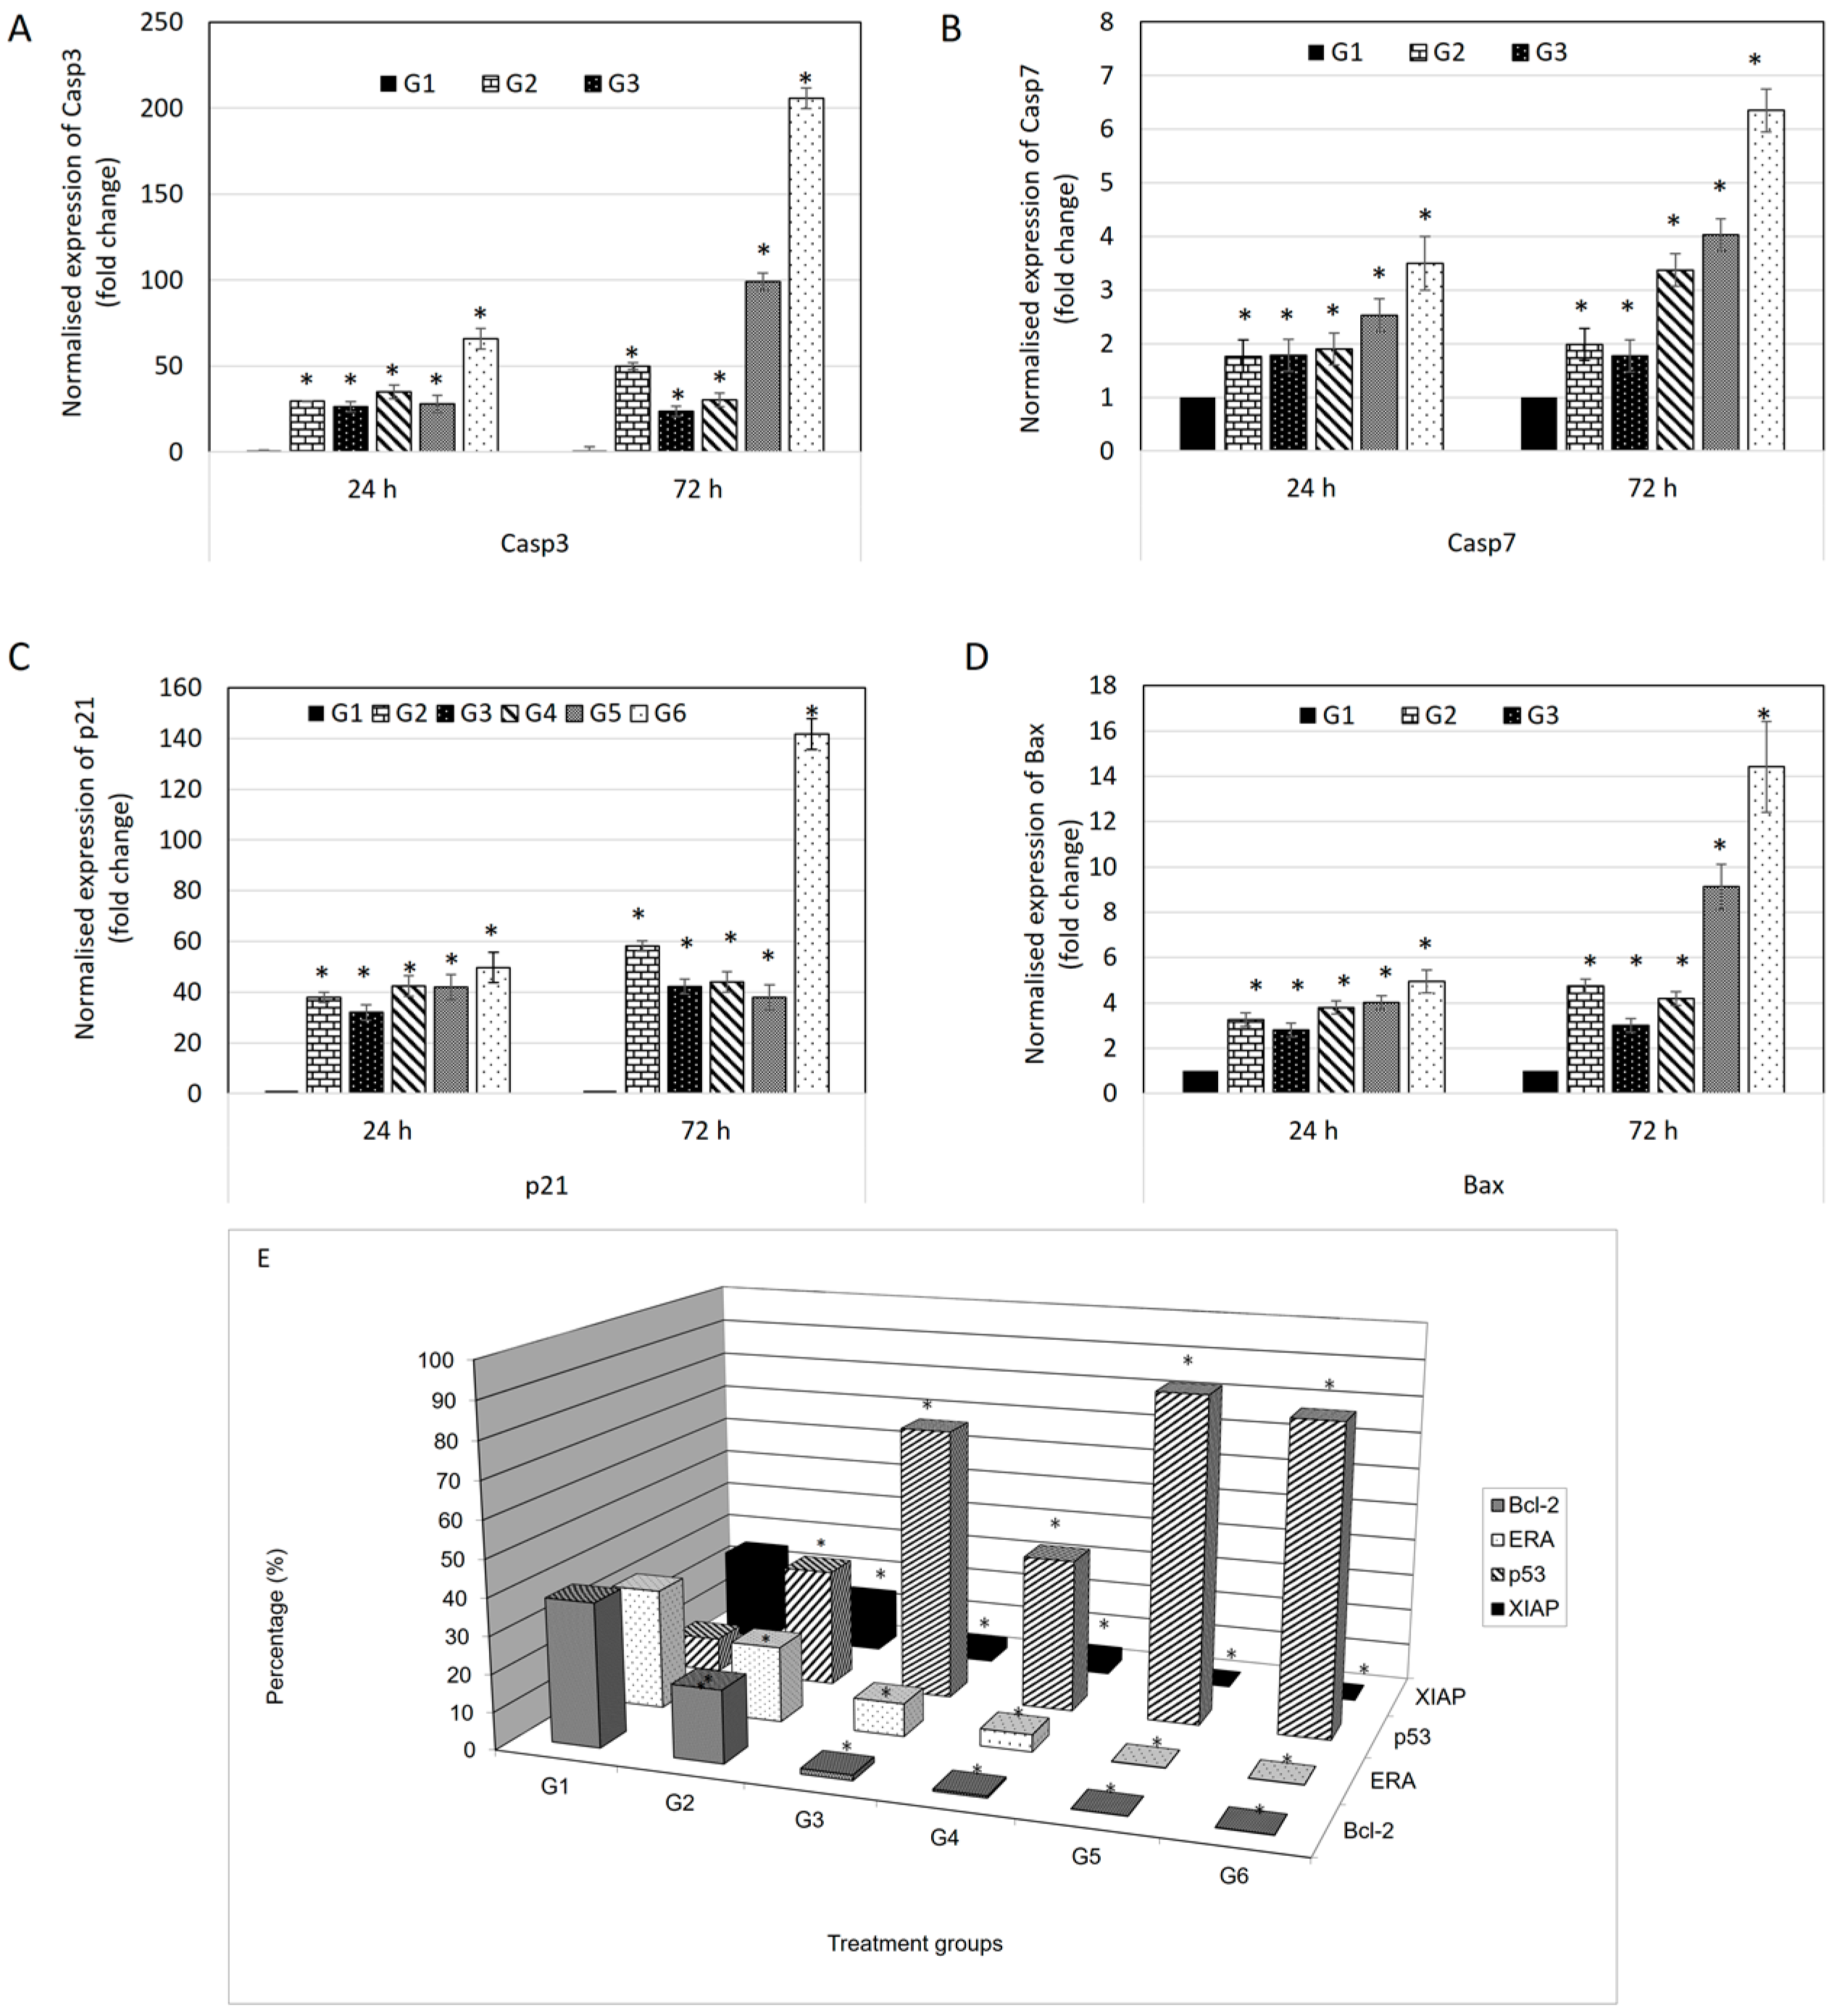
26]. In the evaluation of protein expression using a BD FACS Calibur multicolor flow cytometer, p53 protein showed increments in all treatments compared to control. This explains why expression of p21 also increased in the multiplex gene expression profiler (GeXP) system (Beckman Coulter, Brea, CA, USA). Additionally, BAX is a protein of Bcl-2 family which serves a pro-apoptotic function [
27]. Like p21 gene, the expression of BAX protein is also upregulated by the tumor suppressor protein p53. From the analysis, the expression levels of BAX are higher in all treatments compared to control. While BAX is a pro-apoptotic gene, Bcl-2 is an anti-apoptotic gene [
28]. This explains why the expression of Bcl-2 protein is higher in the control group and it is effectively down-regulated in treatment in protein evaluation using flow cytometry. BAX and Bcl-2 are involved in mitochondria-mediated apoptosis [
29]. Differences in expression levels between BAX and Bcl-2, can be an indicator of sensitivity to apoptotic inducers. Moreover, caspases are a family of cysteinyl aspartate-specific proteases which are central mediators of apoptotic and inflammatory pathways. Caspases are divided in two groups: initiator and effector caspases [
30]. Initiator caspases are activated when they bind to adaptor molecules, resulted in activation of effector caspases. The initiator caspase responsible for the mitochondrial pathway (intrinsic pathway) is caspase-9, while the initiator caspases for the transmembrane pathway (extrinsic pathway) are caspase-8 and -10. Both of these pathways share the effector caspases which are caspases-3, -6 and -7 [
30]. After up-regulation of BAX protein, the outer mitochondrial membrane becomes permeable; inducing the leakage of pro-apoptotic molecules include cytochrome c, Smac/DIABLO, HtrA2/Omi, apoptosis inducing factor (AIF) and endonuclease G (Endo G) from the mitochondrial intermembrane space [
31]. Cytochrome c induces the oligomeraization of apoptosis protease activating factor-1 (Apaf-1) [
32]. Apaf-1 then recruits procaspase-9 molecules in a complex called the ‘apoptosome’ resulted in autoactivation of procaspase-9 [
33]. The release of mature caspase-9 activates downstream caspase cascades include caspase-3 and -7 [
34].
4. Materials and Methods
4.1. Reagents and Chemicals
3-(4,5-Dimethylthiazol-2-yl)-2,5-diphenyl tetrazolium bromide (MTT), RPMI-1640, phosphate buffer saline (PBS), bovine serum albumin (BSA) and ethylenediaminetetraacetic acid (EDTA) were all purchased from Sigma (Sigma-Aldrich, St. Louis, MO, USA). Foetal bovine serum (FBS) was purchased from PAA (GE Healthcare Bio-Sciences, Pittsburgh, PA, USA) and was heat-activated for 30 min in a 56 °C water bath prior to use. Tryple E from Gibco Invitrogen (Gibco, Invitrogen, Thermo Scientific, Hudson, NH, USA), DMSO (Thermo Scientific, Hudson, NH, USA). 96-well and 6-well plates, FITC-conjugated Annexin V kit were purchased from (BD Biosciences, San Jose, CA, USA).
4.2. Cell Viability Assay
The effect of the combination of damnacanthal and doxorubicin treatment on cell viability of MCF-7 cells was determined using a colorimetric technique, which is an MTT assay on a 96-well plate (BD) in RPMI 1640 media with 10% of FBS per well at cell density 1 × 10
5 cell/wells incubated for 24 h, 48 h and 72 h (37 °C, 5% CO
2 and 95% humidity). One hundred µL of diluted doxorubicin at 10 µg/mL was added into row A and row B. A series of two-fold dilution of extract was carried out down from row B until row G. The row H was left untouched and the excess solution (100 µL) was discarded and 100 µL of diluted compound (at concentration CD
25: 2.5 µg/mL, CD
50: 8.2 µg/mL and CD
60: 10.3 µg/mL of damnacanthal towards MCF-7 cells after 48 h of incubation obtained from MTT results) was added into wells in the 96-well plate. Finally, the plate was read at 570 nm and 630 nm as reference wavelength by using a µ Quant ELISA Reader (Bio-tek Instruments, Maharashtra, India). The experiment was repeated for at least three times with triplicate samples for each experiment. The percentage of proliferation was calculated using the following formula:
4.3. Fluorescent Microscopy using Acridine Orange/Propidium Iodide (AO/PI) Double Staining Assay
MCF-7 cells (5 × 10
5 cells) were seeded in 6-well plates and incubated at 37 °C in a 5% CO
2 atmosphere. Twenty four h later, the medium in each well was removed and replaced with the various treatments (G1; control, G2; doxorubicin at 0.55 µg/mL, G3; damnacanthal at 2.5 µg/mL, G4; damnacanthal at 8.2 µg/mL, G5; doxorubicin at 0.55 µg/mL and damnacanthal at 2.5 µg/mL and G6; doxorubicin at 0.2 µg/mL and damnacanthal at 8.2 µg/mL). The concentration of doxorubicin at 0.55 µg/mL was obtained from the CD
50 value of doxorubicin toward MCF-7 cells and the concentration of doxorubicin at 0.2 µg/mL was obtained from the CD
25 value of doxorubicin towards MCF-7 cells. Meanwhile, the concentrations of damnacanthal used were same as in the cell viability assay described in
Section 4.2. The plates were incubated at 37 °C in an incubator with 5% CO
2 and 90% humidity for 24 and 72 h. After 24-h incubation, detached and anchored cells in the medium were collected. Anchored cells were detached with the use of tryple E (Gibco, Invitrogen, Thermo Scientific, Hudson, Waltham, MA, USA). The cell suspension was washed with PBS. Ten µL of the cells were then put on a glass slide and mixed with 10 µL of acridine orange (50 µg/mL) and propidium iodide (50 µg/mL) at a ratio of 1:1 in 1 mL of cells. Within 30 min, the slide was analyzed using fluorescent microscope (Nikon, Tokyo, Japan) using a combination of excitation and barrier filters at 450–490 nm and long pass filter.
4.4. DNA Cell Cycle Analysis
The perturbation in the distribution of cells in the different phases of the cell cycle was determined by flow cytometry. 5 × 10⁵ of MCF-7 cells were seeded into each well of a 6-well plate and incubated at 37 °C in 5% CO2 atmosphere. Twenty-four h later, the medium in each well was removed and replaced with the various treatments (G1; control, G2; doxorubicin at 0.55 µg/mL, G3; damnacanthal at 2.5 µg/mL, G4; damnacanthal at 8.2 µg/mL, G5; doxorubicin at 0.55 µg/mL and damnacanthal at 2.5 µg/mL and G6; doxorubicin at 0.2 µg/mL and damnacanthal at 8.2 µg/mL). The plate was incubated at 37 °C in an incubator with 5% CO2 and 90% humidity for 24 and 72 h. After the corresponding period, the samples were washed and transferred to a centrifuge tube (BD Biosciences). The cells were pelleted and fixed with 80% ethanol and incubated at 4 °C for 2 h. Then, the cells were re-pelleted and washed twice with PBS-sodium azide-EDTA buffer. The cell pellet was finally dissolved and stained in PBS buffer consisting of 0.1% Triton X-100, 10 mM EDTA, 50 µg/mL RNase and 2 µg/mL propidium iodide (PI) in the dark. The cell pellet was then incubated for half an hour in 4 °C prior to analysis by FACS-Calibur flow cytometer (BD Bioscience, San Jose, CA, USA). The analysis of stained cells by flow cytometer was conducted within 24 h. The experiment was repeated for three times with triplicate samples for each experiment.
4.5. Annexin V Binding Assay using Flow Cytometry
5 × 10
5 of MCF-7 cells were seeded into each well of a 6-well plate. After incubation for 24 h the cells were treated with various treatments (G1; control, G2; doxorubicin at 0.55 µg/mL, G3; damnacanthal at 2.5 µg/mL, G4; damnacanthal at 8.2 µg/mL, G5; doxorubicin at 0.55 µg/mL and damnacanthal at 2.5 µg/mL and G6; doxorubicin at 0.2 µg/mL and damnacanthal at 8.2 µg/mL) were added. Group treatments used were same as in the AO/PI staining assay (
Section 4.3). The plate was incubated at 37 °C in an incubator with, 5% CO
2 and 90% humidity for 24 and 72 h. After the corresponding incubation, cells were harvested, washed and stained with Annexin V-FITC (BD Biosciences) with propidium iodide (PI). The procedures were carried out according to the instructions provided by the manufacturer. Briefly, the culture was washed with PBS and re-suspended in 500 µL total volume that contain 100 µL of cells (5 × 10
5 cells/mL), 10 µL PI (Sigma), 5 µL AnnexinV-FITC (BD Bioscience) and 400 µL binding buffer (BD Bioscience). After 15-minute incubation in dark, the cells were analyzed with FACS-Calibur flow cytometer (BD Biosciences). The experiment was repeated for three times with triplicate samples for each experiment.
4.6. Cell Treatment, RNA Extraction and cDNA Conversion
The MCF-7 cells were treated with with various treatments (G1; control, G2; doxorubicin at 0.55 µg/mL, G3; damnacanthal at 2.5 µg/mL, G4; damnacanthal at 8.2 µg/mL, G5; doxorubicin at 0.4 µg/mL and damnacanthal at 2.5 µg/mL and G6; doxorubicin at 0.2 µg/mL and damnacanthal at 8.2 µg/mL). Meanwhile untreated (G1) was used as controls. The expression profiles were analyzed at two time points, 12 and 24 h. After the treatment period, cells were trypsinized and washed twice with PBS in order to prepare for RNA extraction. Total RNA was extracted from the treated and untreated cell lines for both time points using the RNeasy® Mini Kits (Qiagen, Valencia, CA, USA). The eluted RNA was kept in −80 °C for future use. After RNA extraction and quantification, RNA from each sample was reverse transcribed to cDNA using the GenomeLab™ GeXP Start Kit (Beckman Coulter, Brea, CA, USA). The RT reaction then was run in a thermal-cycler (PTC-225, MJ Research, Watertown, MA, USA) with the following program: 48 °C for 1 min; 37 °C for 5 min; 42 °C for 60 min; 95 °C for 5 min; hold at 4 °C.
4.7. Polymerase Chain Reaction (PCR) and GenomeLab GeXP Genetic Analysis System
Primers were designed by importing the target gene ID or sequence into the eXpress Designer module of the eXpress Profiler (
Table 1). The amplified products were designed to generate gene fragments with lengths between 150–350 nucleotides. An aliquot (9.3 μL) of the RT reaction was then transferred to the PCR reaction mix which contains MgCl
2, the gene-specific forward chimeric primer plex, fluorescently-labeled universal forward primer, unlabeled universal reverse primer and Thermo-Start
® DNA polymerase (ABgene Thermo Scientific, Hudson, NH, USA) (
Table 1). The 96-well plate containing the PCR reaction mixture was transferred to a thermal-cycler (PTC-225, MJ Research) and run under the following program: 1 cycle of 95 °C for 10 min followed by 35 cycles of 94 °C 30 s, 55 °C 30 s, 68 °C 1 min; hold at 4 °C. The level of the gene expression profiles of MCF-7 treated with doxorubicin and damnacanthal alone and combination at different time point (12 and 24 h) was assessed using GeXP. Subsequently, completed PCR product was mixed with 37.5 µL sample loading solution (SLS), 0.5 µL the DNA size standard-400 (GenomeLab™ GeXP Start Kit, Beckman Coulter, Brea, CA, USA) and overlaid with a layer of mineral oil before the sample was transferred to CEQ 8000 Genetic Analysis System (Beckman Coulter). By referring to the Frag-3 protocol, PCR products with fluorescently-labeled fragment were separated by 50 °C capillary gel electrophoresis according to their product size at 6.0 kV for 35 min, right after they undergo denaturation at 90 °C for 120 s and injection for 30 s at 2.0 kV. The raw data of separated product was first analyzed with the Fragment Analysis module of GenomeLab GeXP™ system software (version 10.2, Beckman Coulter, Brea, CA, USA). Then the information related to fragment of product, the height and area of the peak was imported into express Analysis module of the express Profiler software (version 8.0, Beckman Coulter, Brea, CA, USA) for analysis. With this software, housekeeping genes used in this experiment were checked for their consistency. GADPH was selected as reference gene for normalizing all data of targeted genes.
4.8. Flow Cytometry Intracellular Protein Detection
5 × 10⁵ of MCF-7 cells were seeded into each well of a 6-well plate and after incubation for 24 h the cells were treated with various treatments (G1; control, G2; doxorubicin at 0.55 µg/mL, G3; damnacanthal at 2.5 µg/mL, G4; damnacanthal at 8.2 µg/mL, G5; doxorubicin at 0.4 µg/mL and damnacanthal at 2.5 µg/mL and G6; doxorubicin at 0.2 µg/mL and damnacanthal at 8.2 µg/mL). The plate was incubated at 37 °C in an incubator with 5% CO2 and 90% humidity for 72 h. After the corresponding incubation, cells were harvested and washed. The fixation and permeabilisation was done by using BD Cytofix/CytopermTM Fixation/Permeabilisation (BD Bioscience). Briefly, the cells were resuspended thoroughly and 250 µL of Fixation/Permeabilisation solution were added into each tube and incubated for 20 min at 4 °C. After 20 min, the cells were washed twice by 1 × BD Perm/Wash™ buffer. For each treatment, the cells were divided into 4 centrifuge tube (BD Bioscience). Then, the cells were stained with fluorochrome-conjugated monoclonal anti-mouse p53 and Bcl-2 (Santa Cruz Biotechnology, Inc., Dallas, TX, USA), anti-mouse XIAP (BD Biosciences) and anti-mouse estrogen receptor alpha (ER α) (Abcam, Cambridge, UK). The cells were washed twice with PBS to remove non-specific binding materials. The cells were stained again with secondary fluorochrome-conjugated monoclonal antibody mouse anti-p53, anti-Bcl2, anti-XIAP and anti-ER α (Abcam, Cambridge, UK). After that, the cells were washed twice to remove non-specific binding. Finally, the cells were analyzed by BD FACS Calibur multicolor flow cytometer (BD Biosciences).
4.9. Statistical Analysis
Results were expressed as Mean ± Standard Error (S.E.M). Differences between means were evaluated using ANOVA test (one way) followed by Tukey’s test and (p < 0.05) was taken as statistically significant.


