
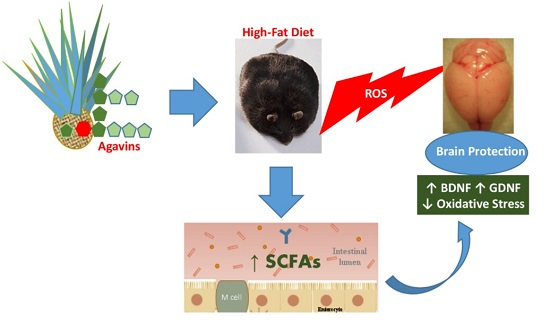
Agavins Increase Neurotrophic Factors and Decrease Oxidative Stress in the Brains of High-Fat Diet-Induced Obese Mice

Abstract
:
1. Introduction
2. Results and Discussion
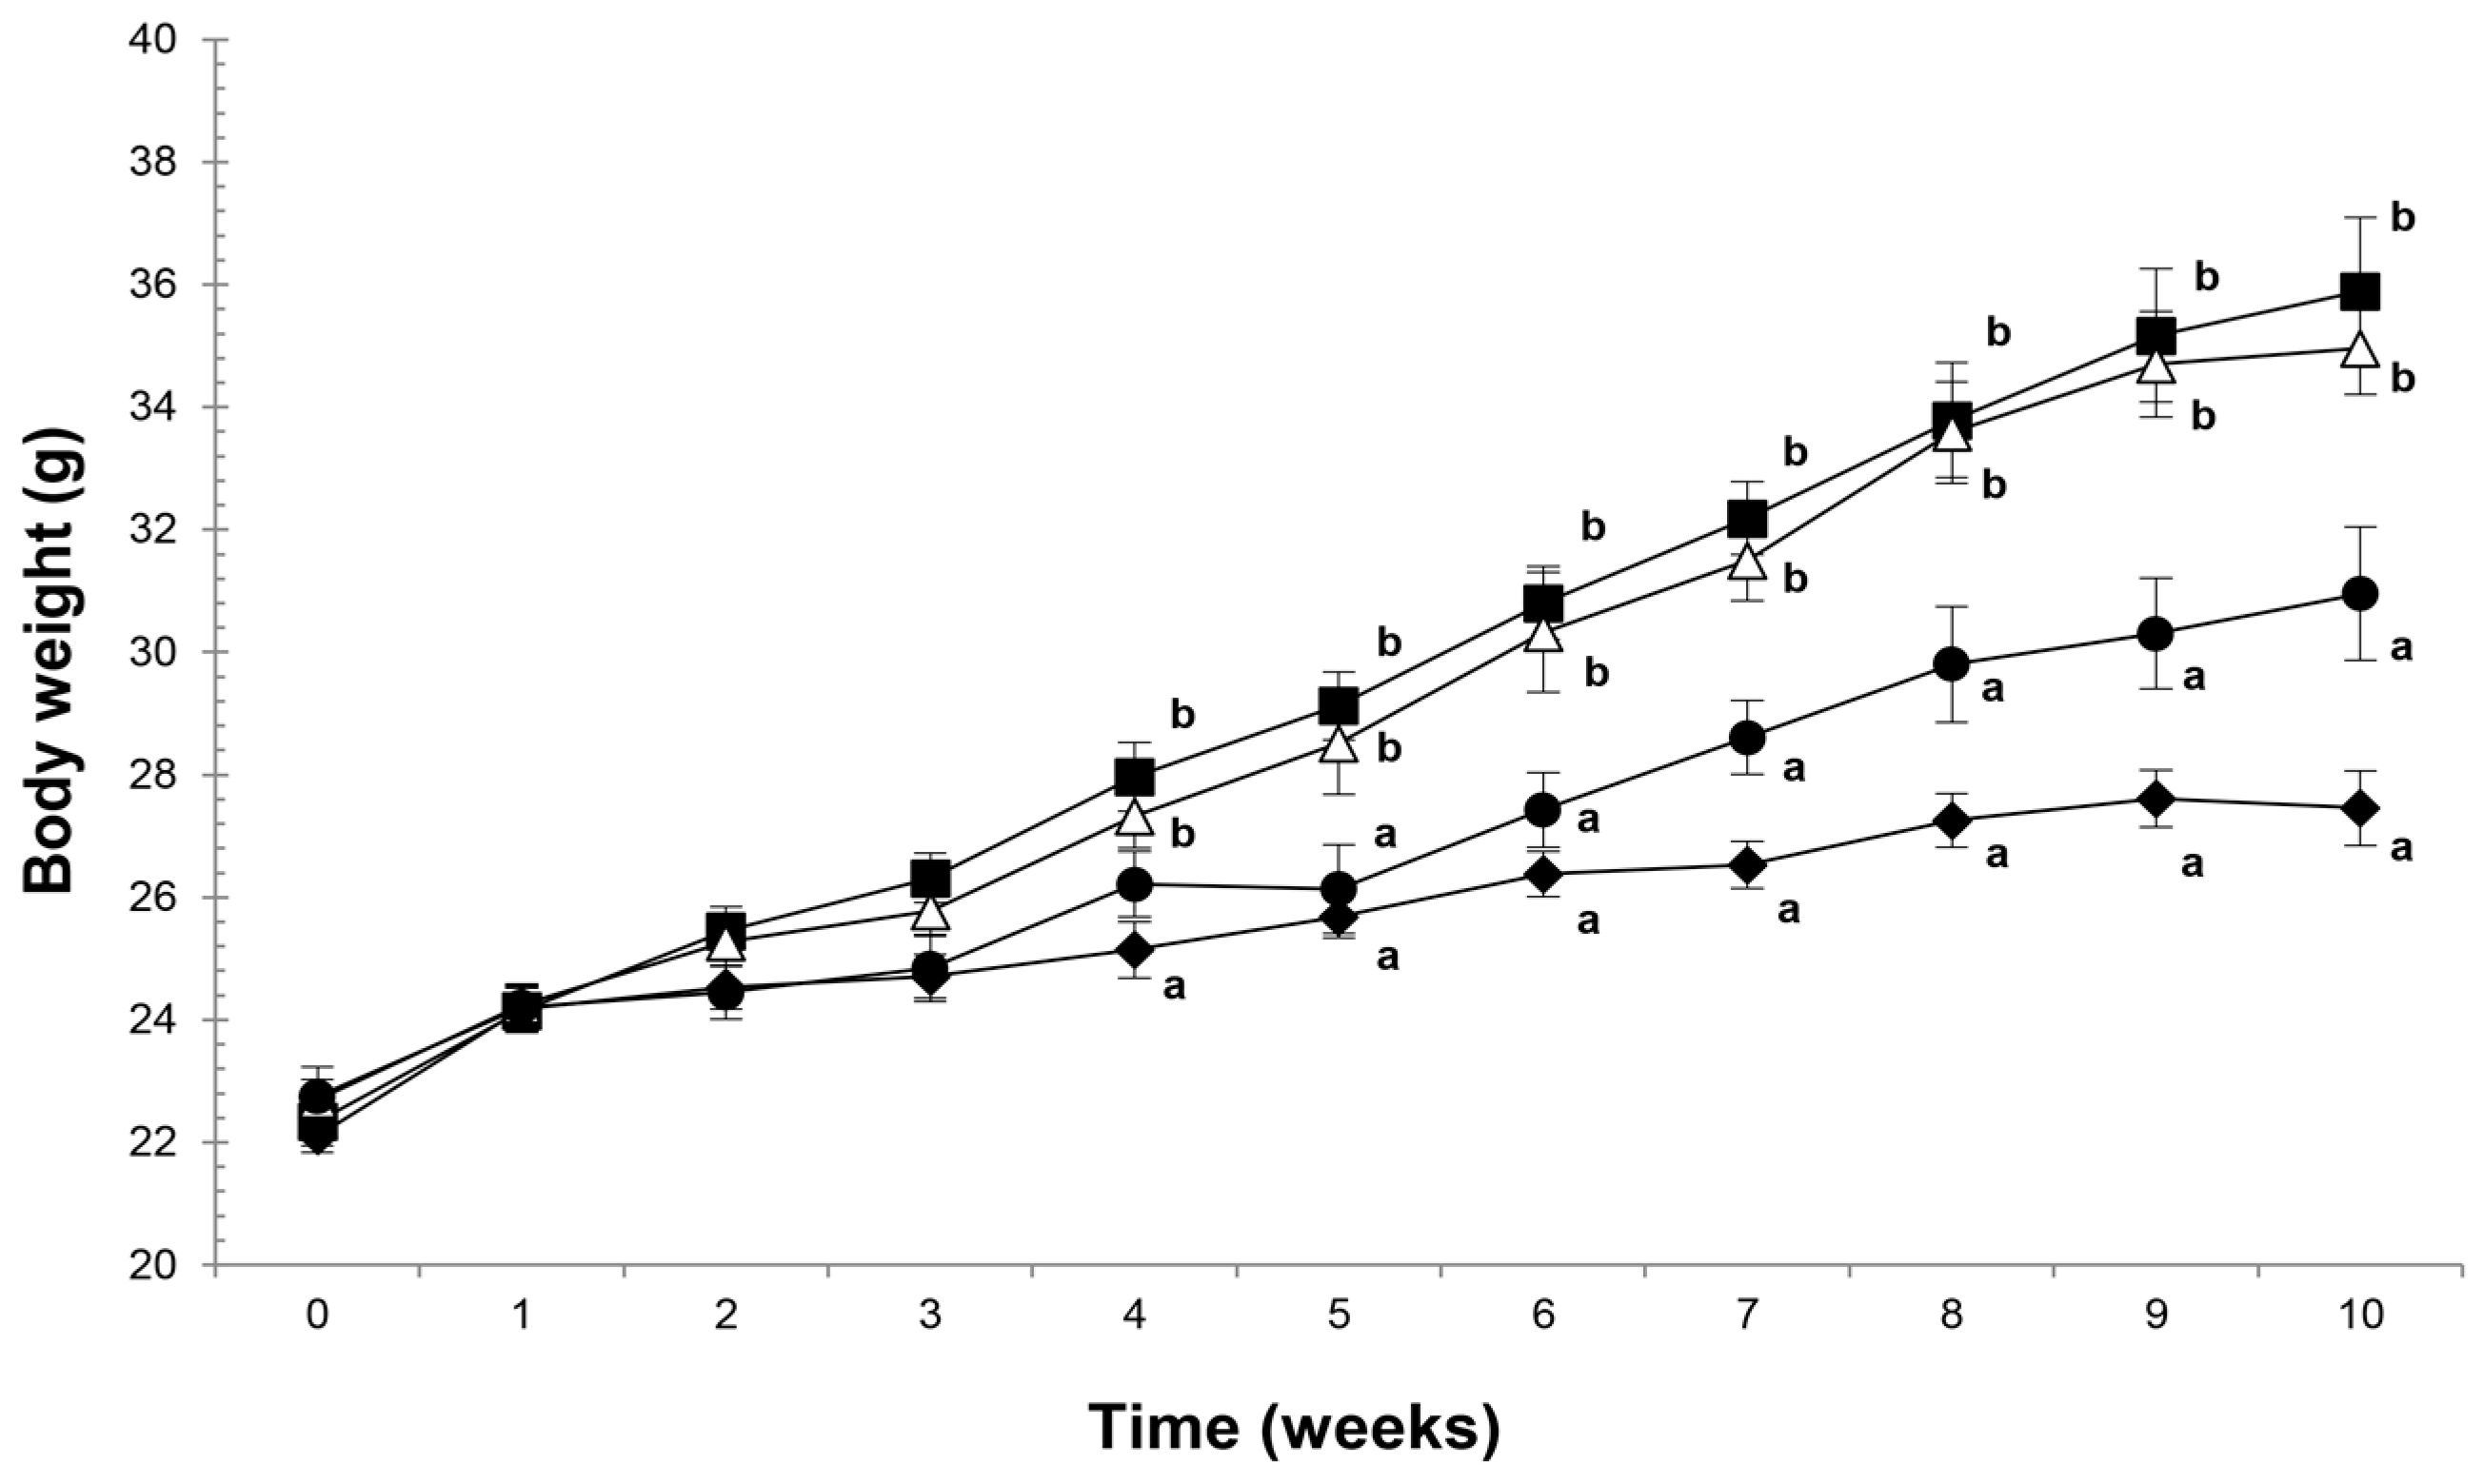
2.1. Agavins Supplementation Protects Against Body Weight Gain and Controls the Food Intake Mechanism from Diet-Induced Obesity
2.2. Agavins Reduces Triglycerides but Does Not Modify Glucose or Cholesterol in Mice Fed HFD
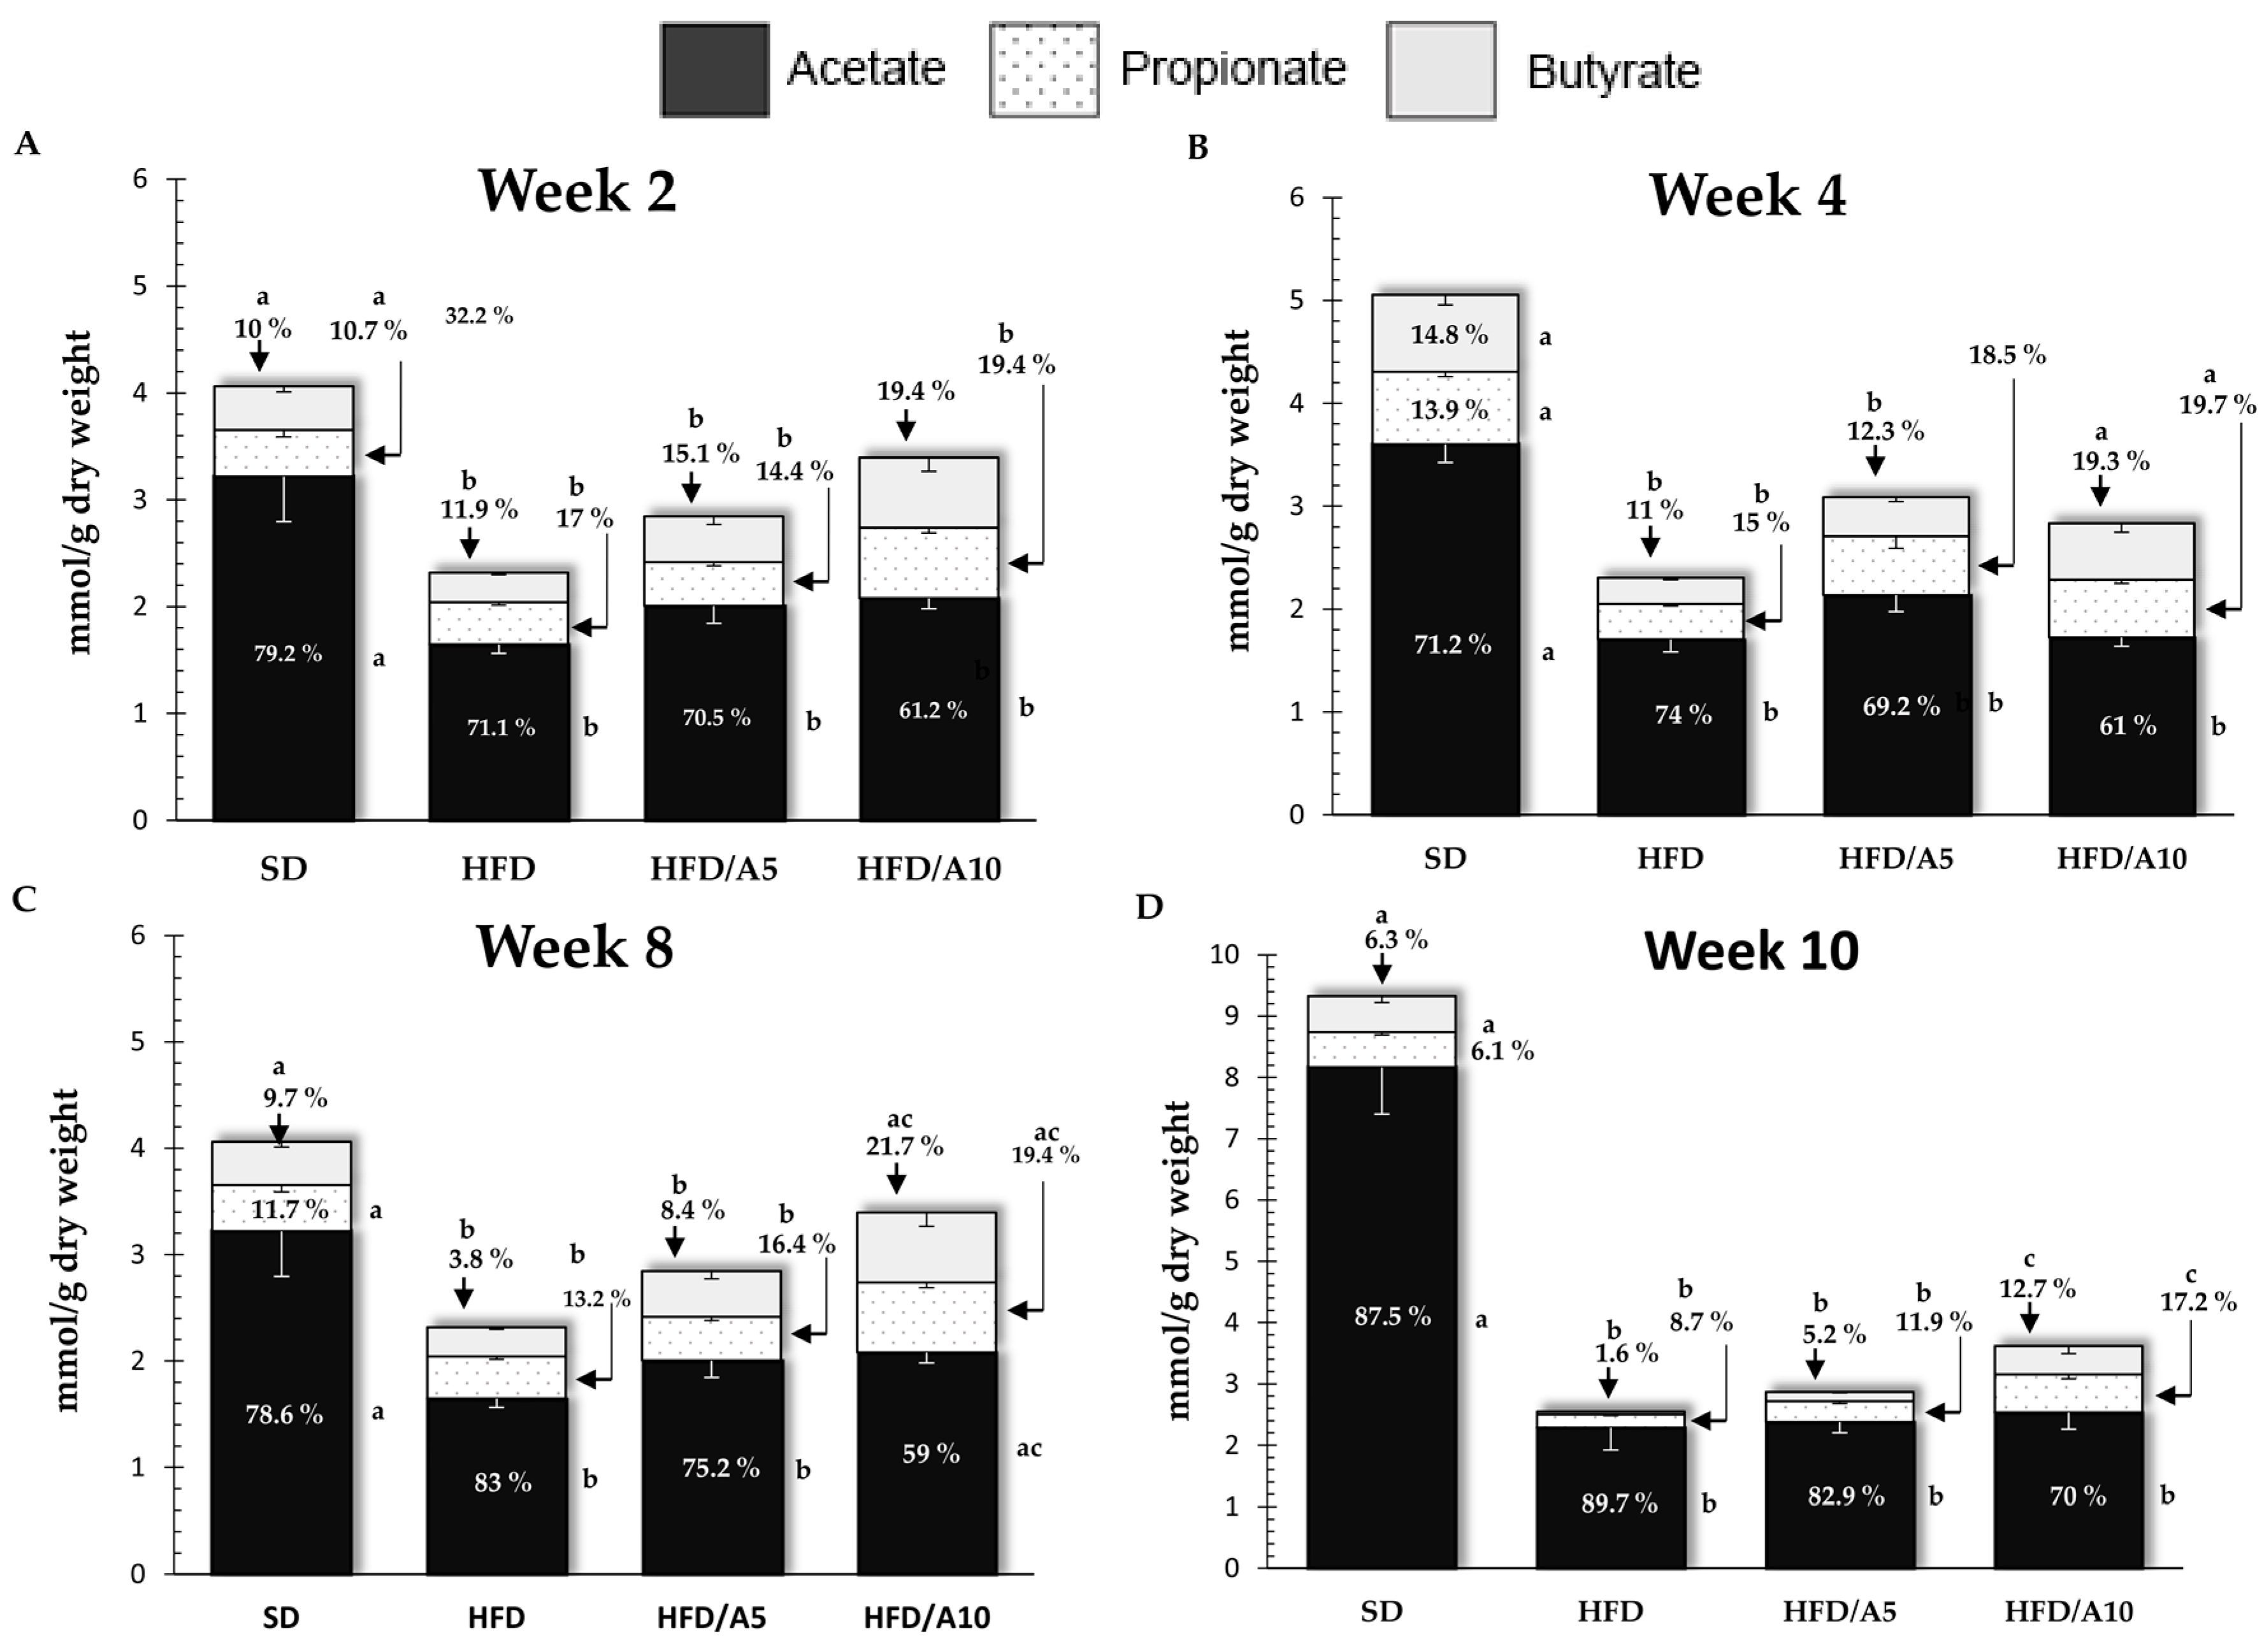
2.3. Agavin Fermentation Induced SCFAs Production
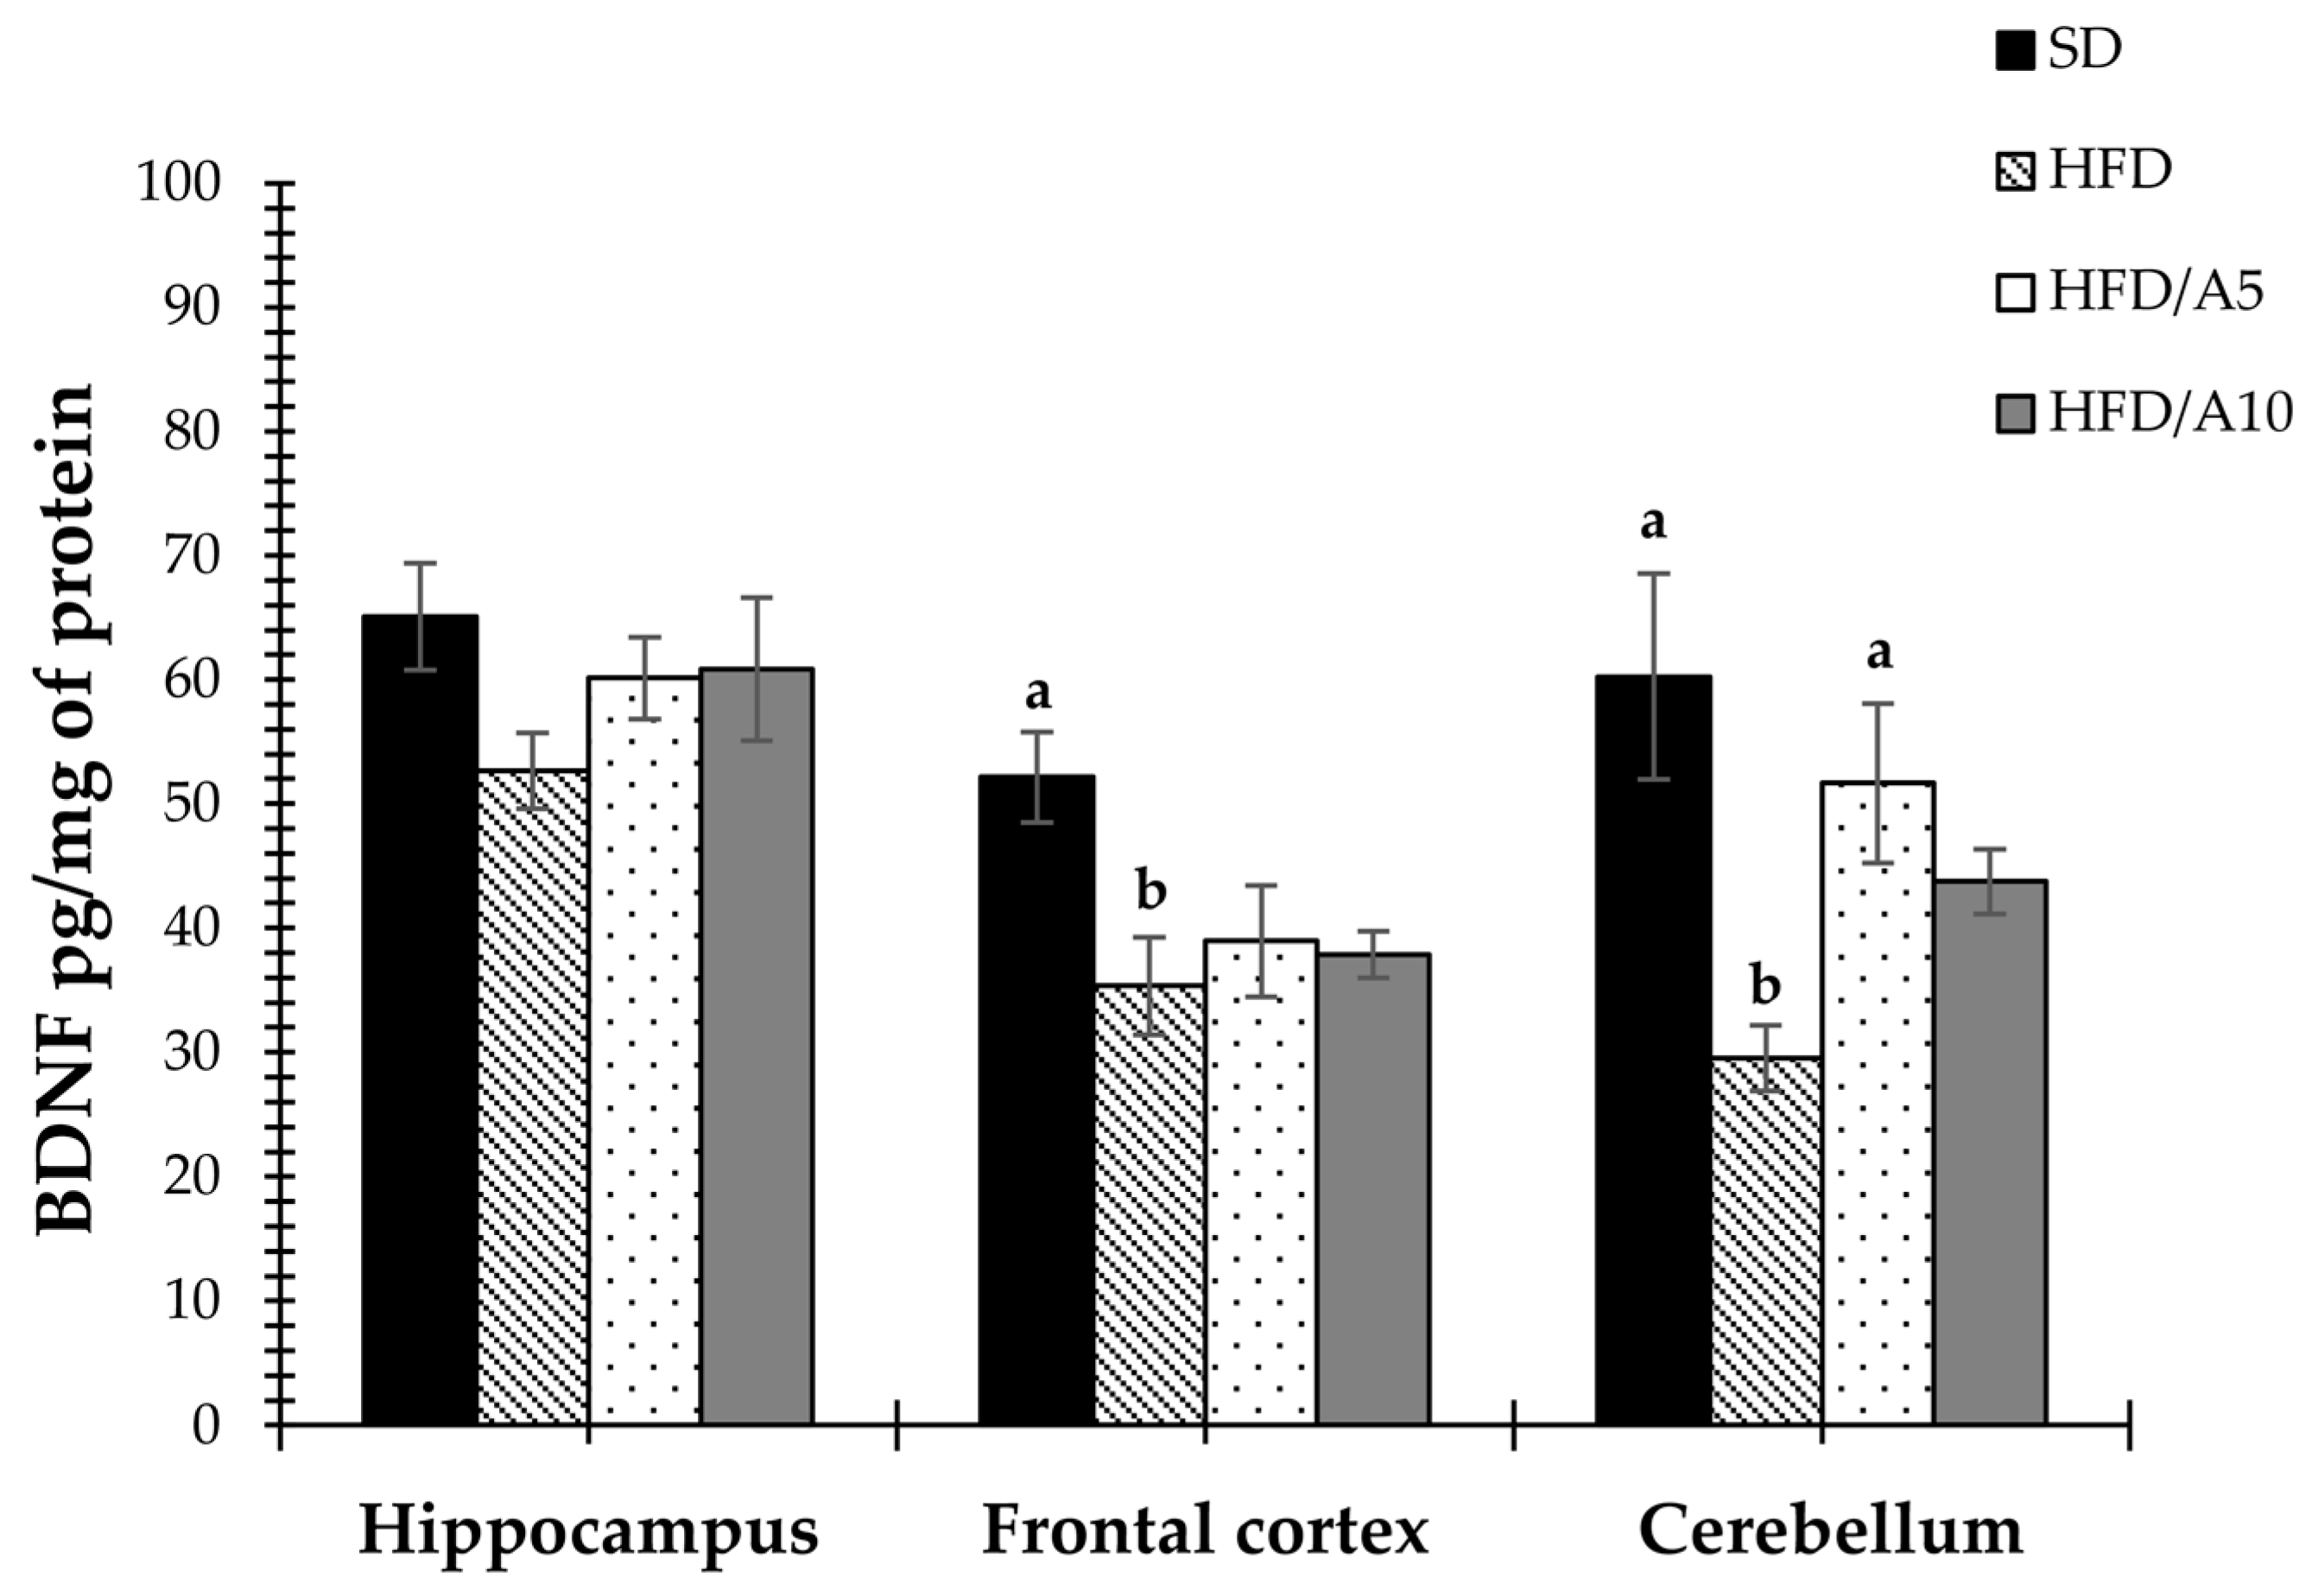
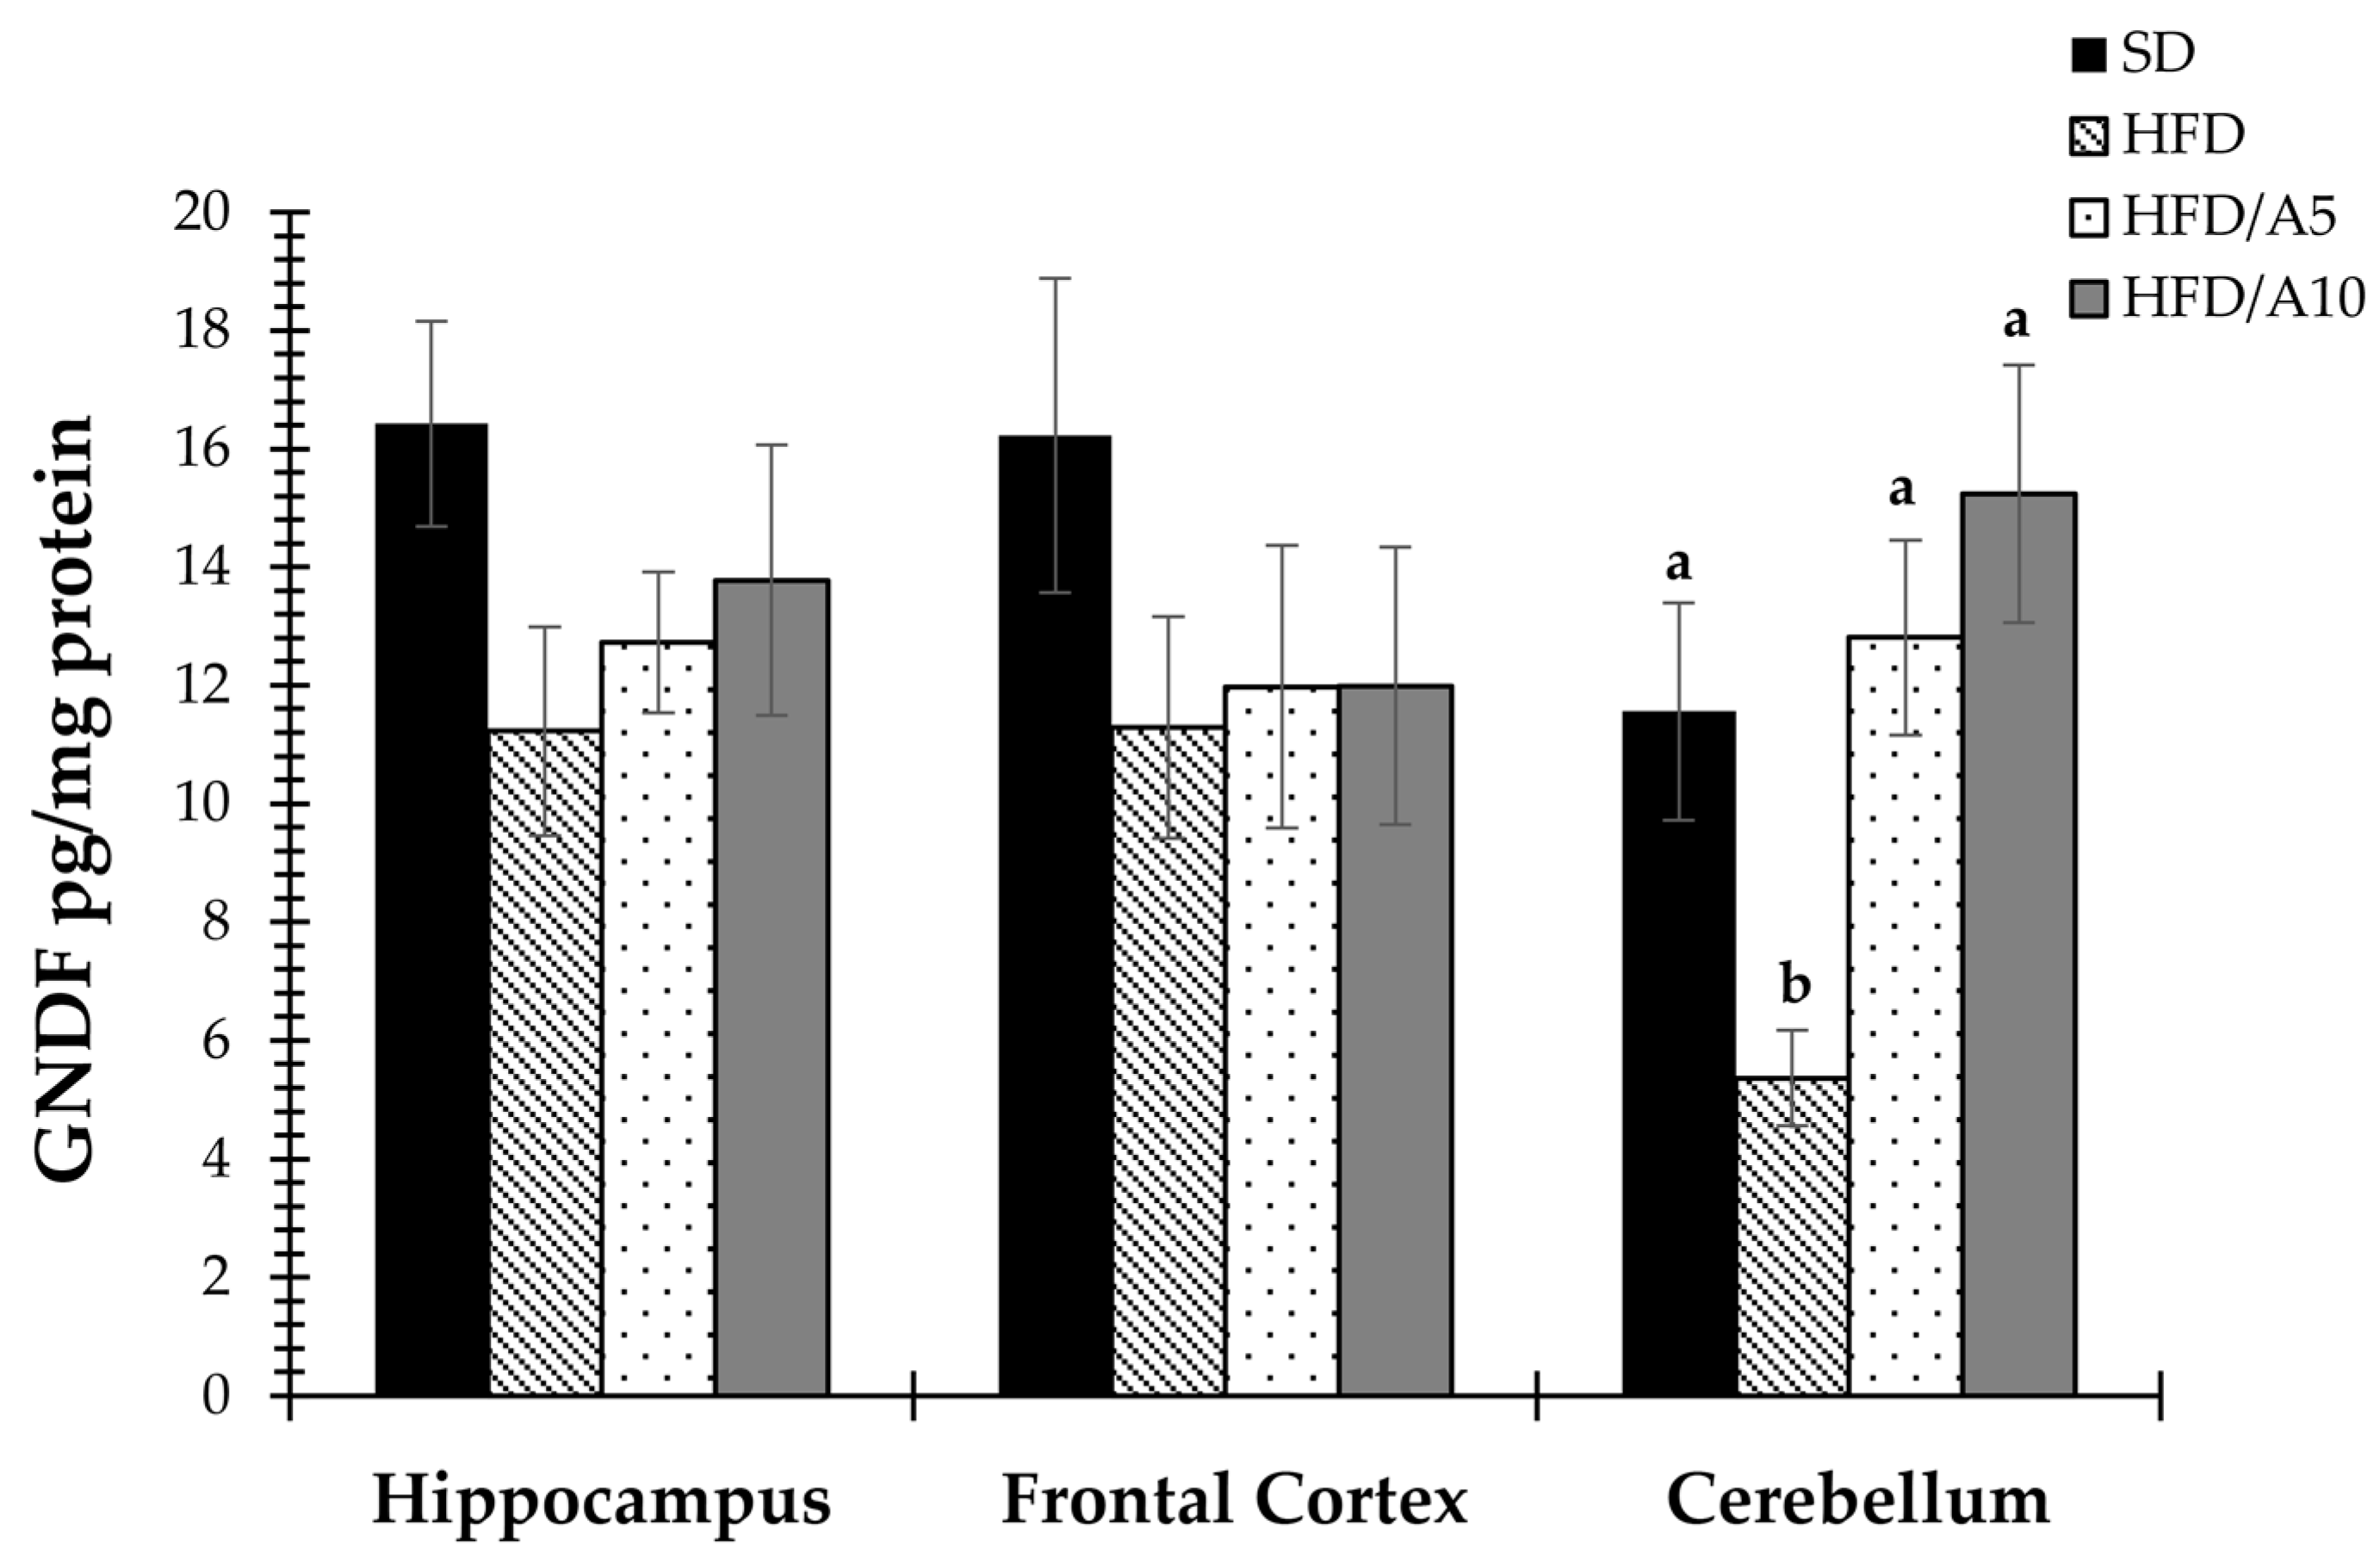
2.4. Prevention of Decrease in the Levels of BDNF and GDNF Caused by Fat Intake
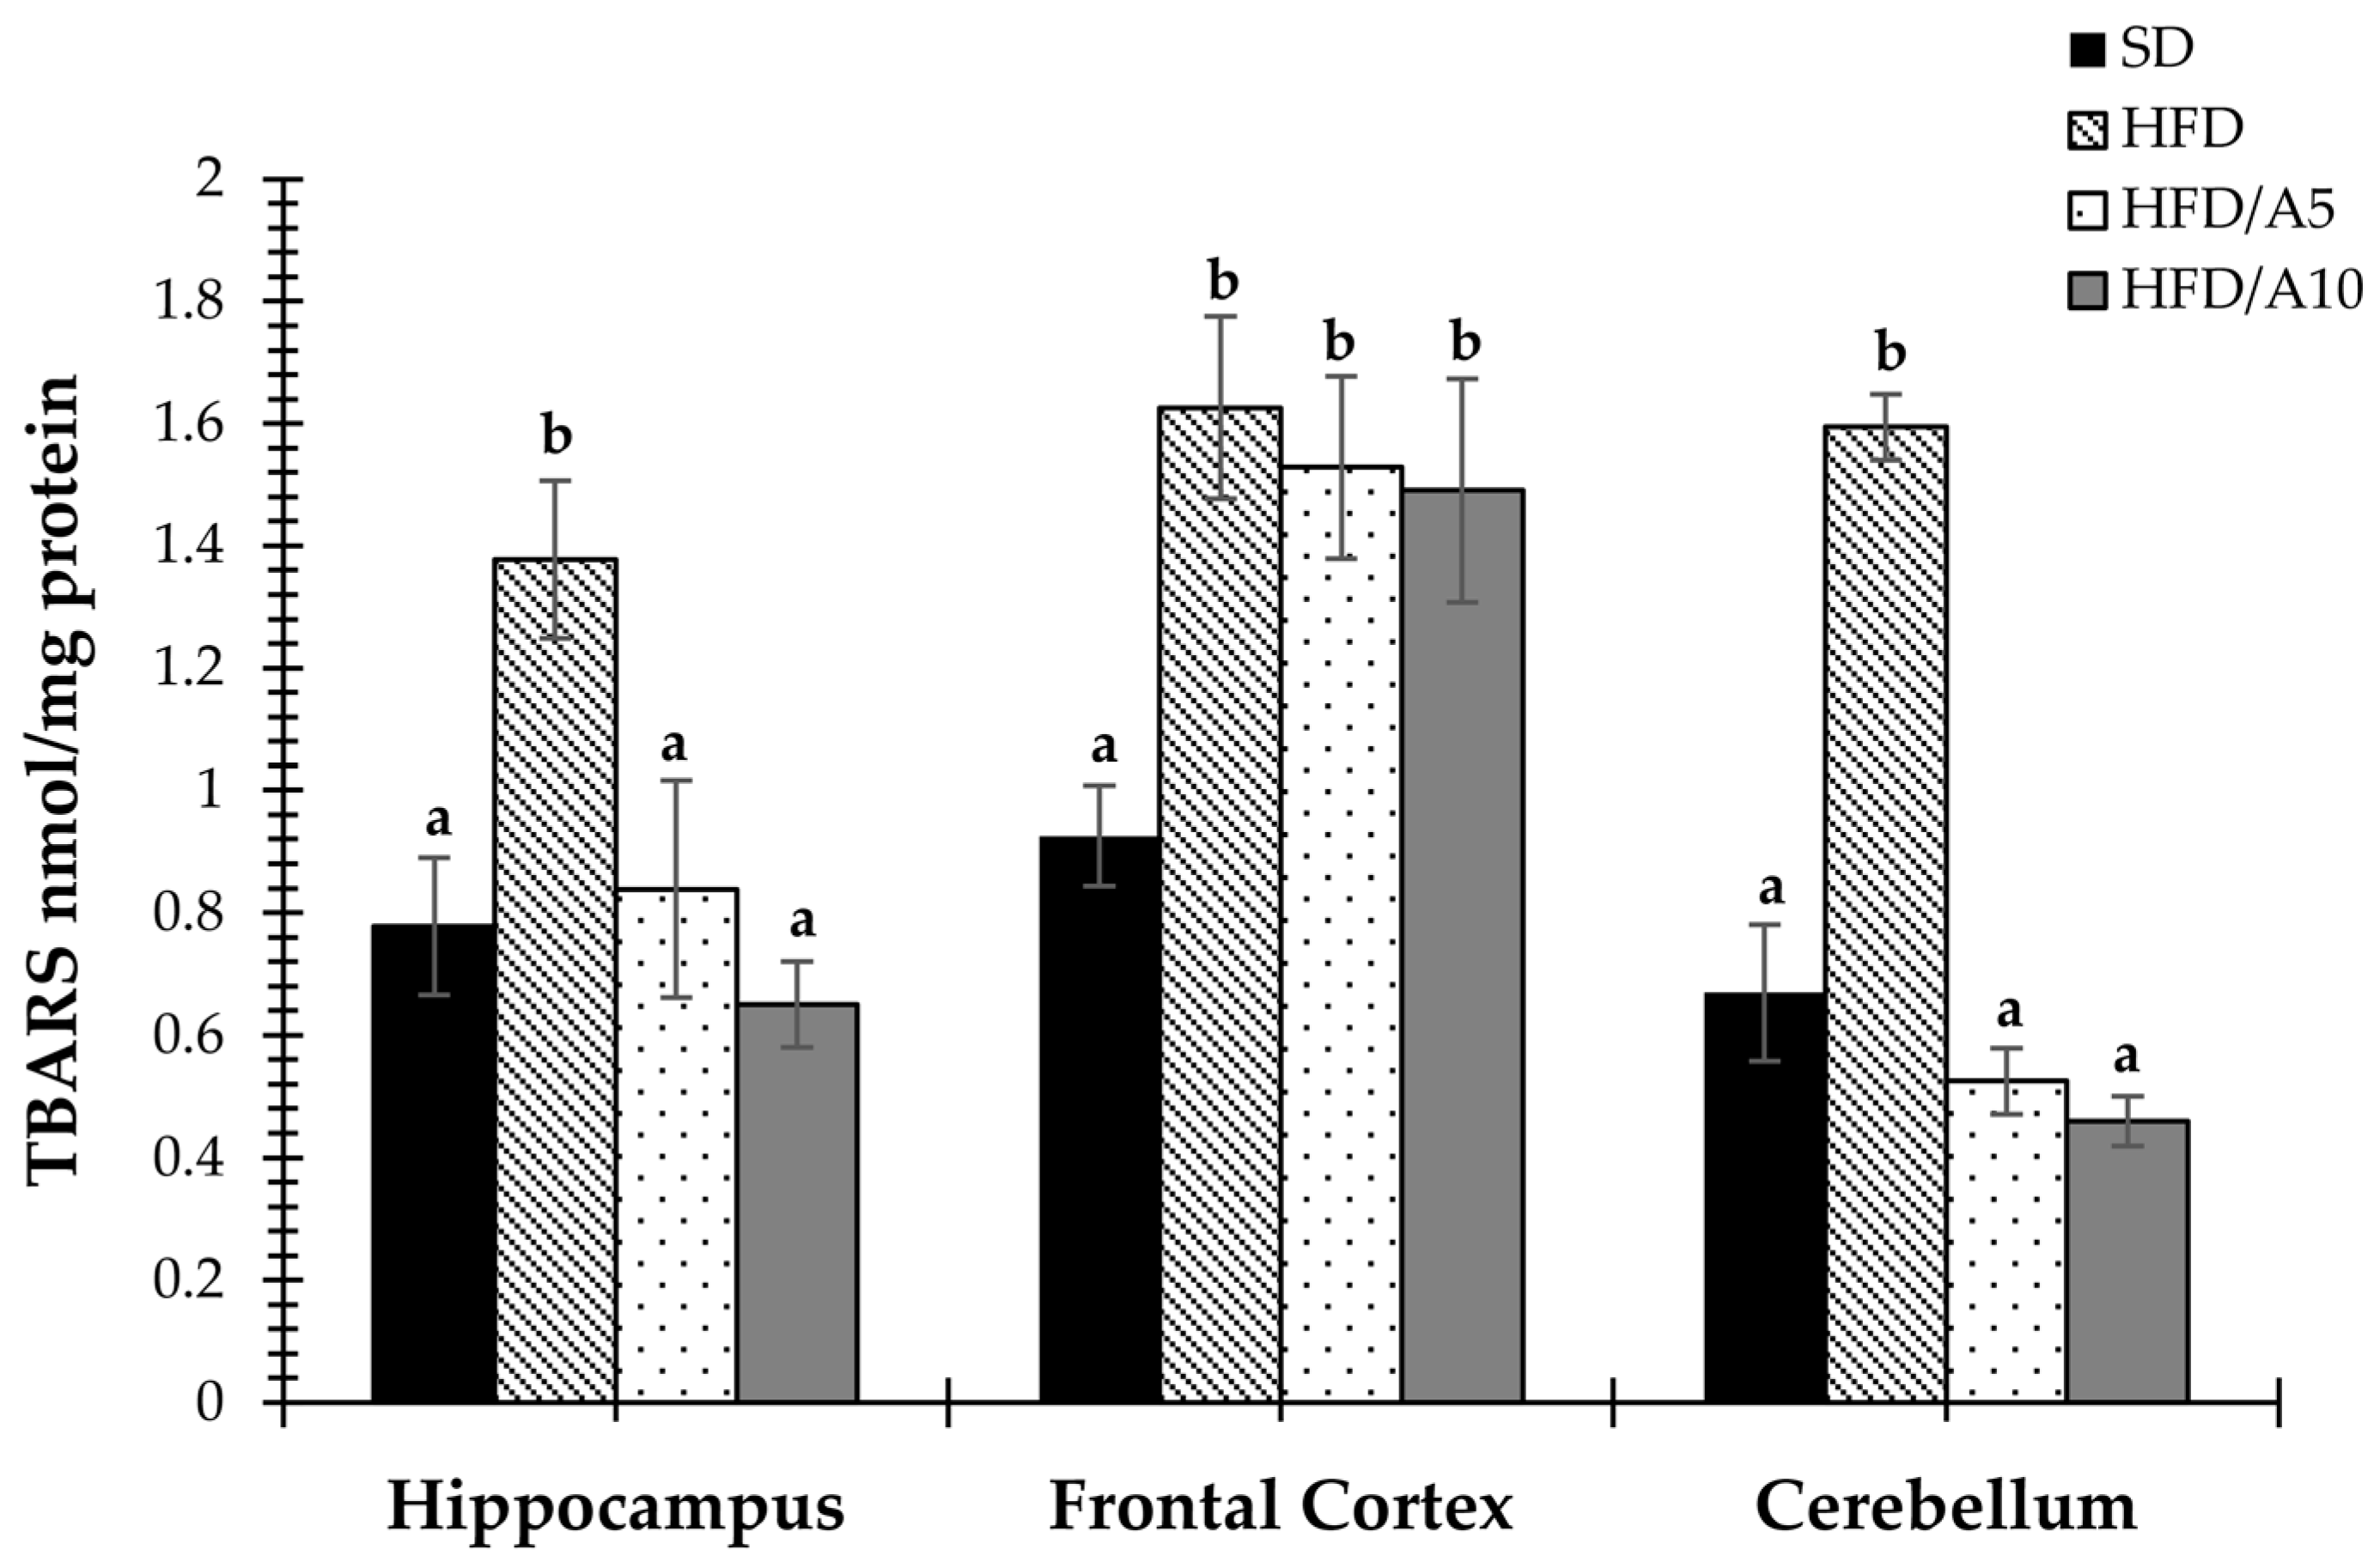
2.5. Agavins Decreased Lipid Peroxidation in Regions Involved in Memory and Learning
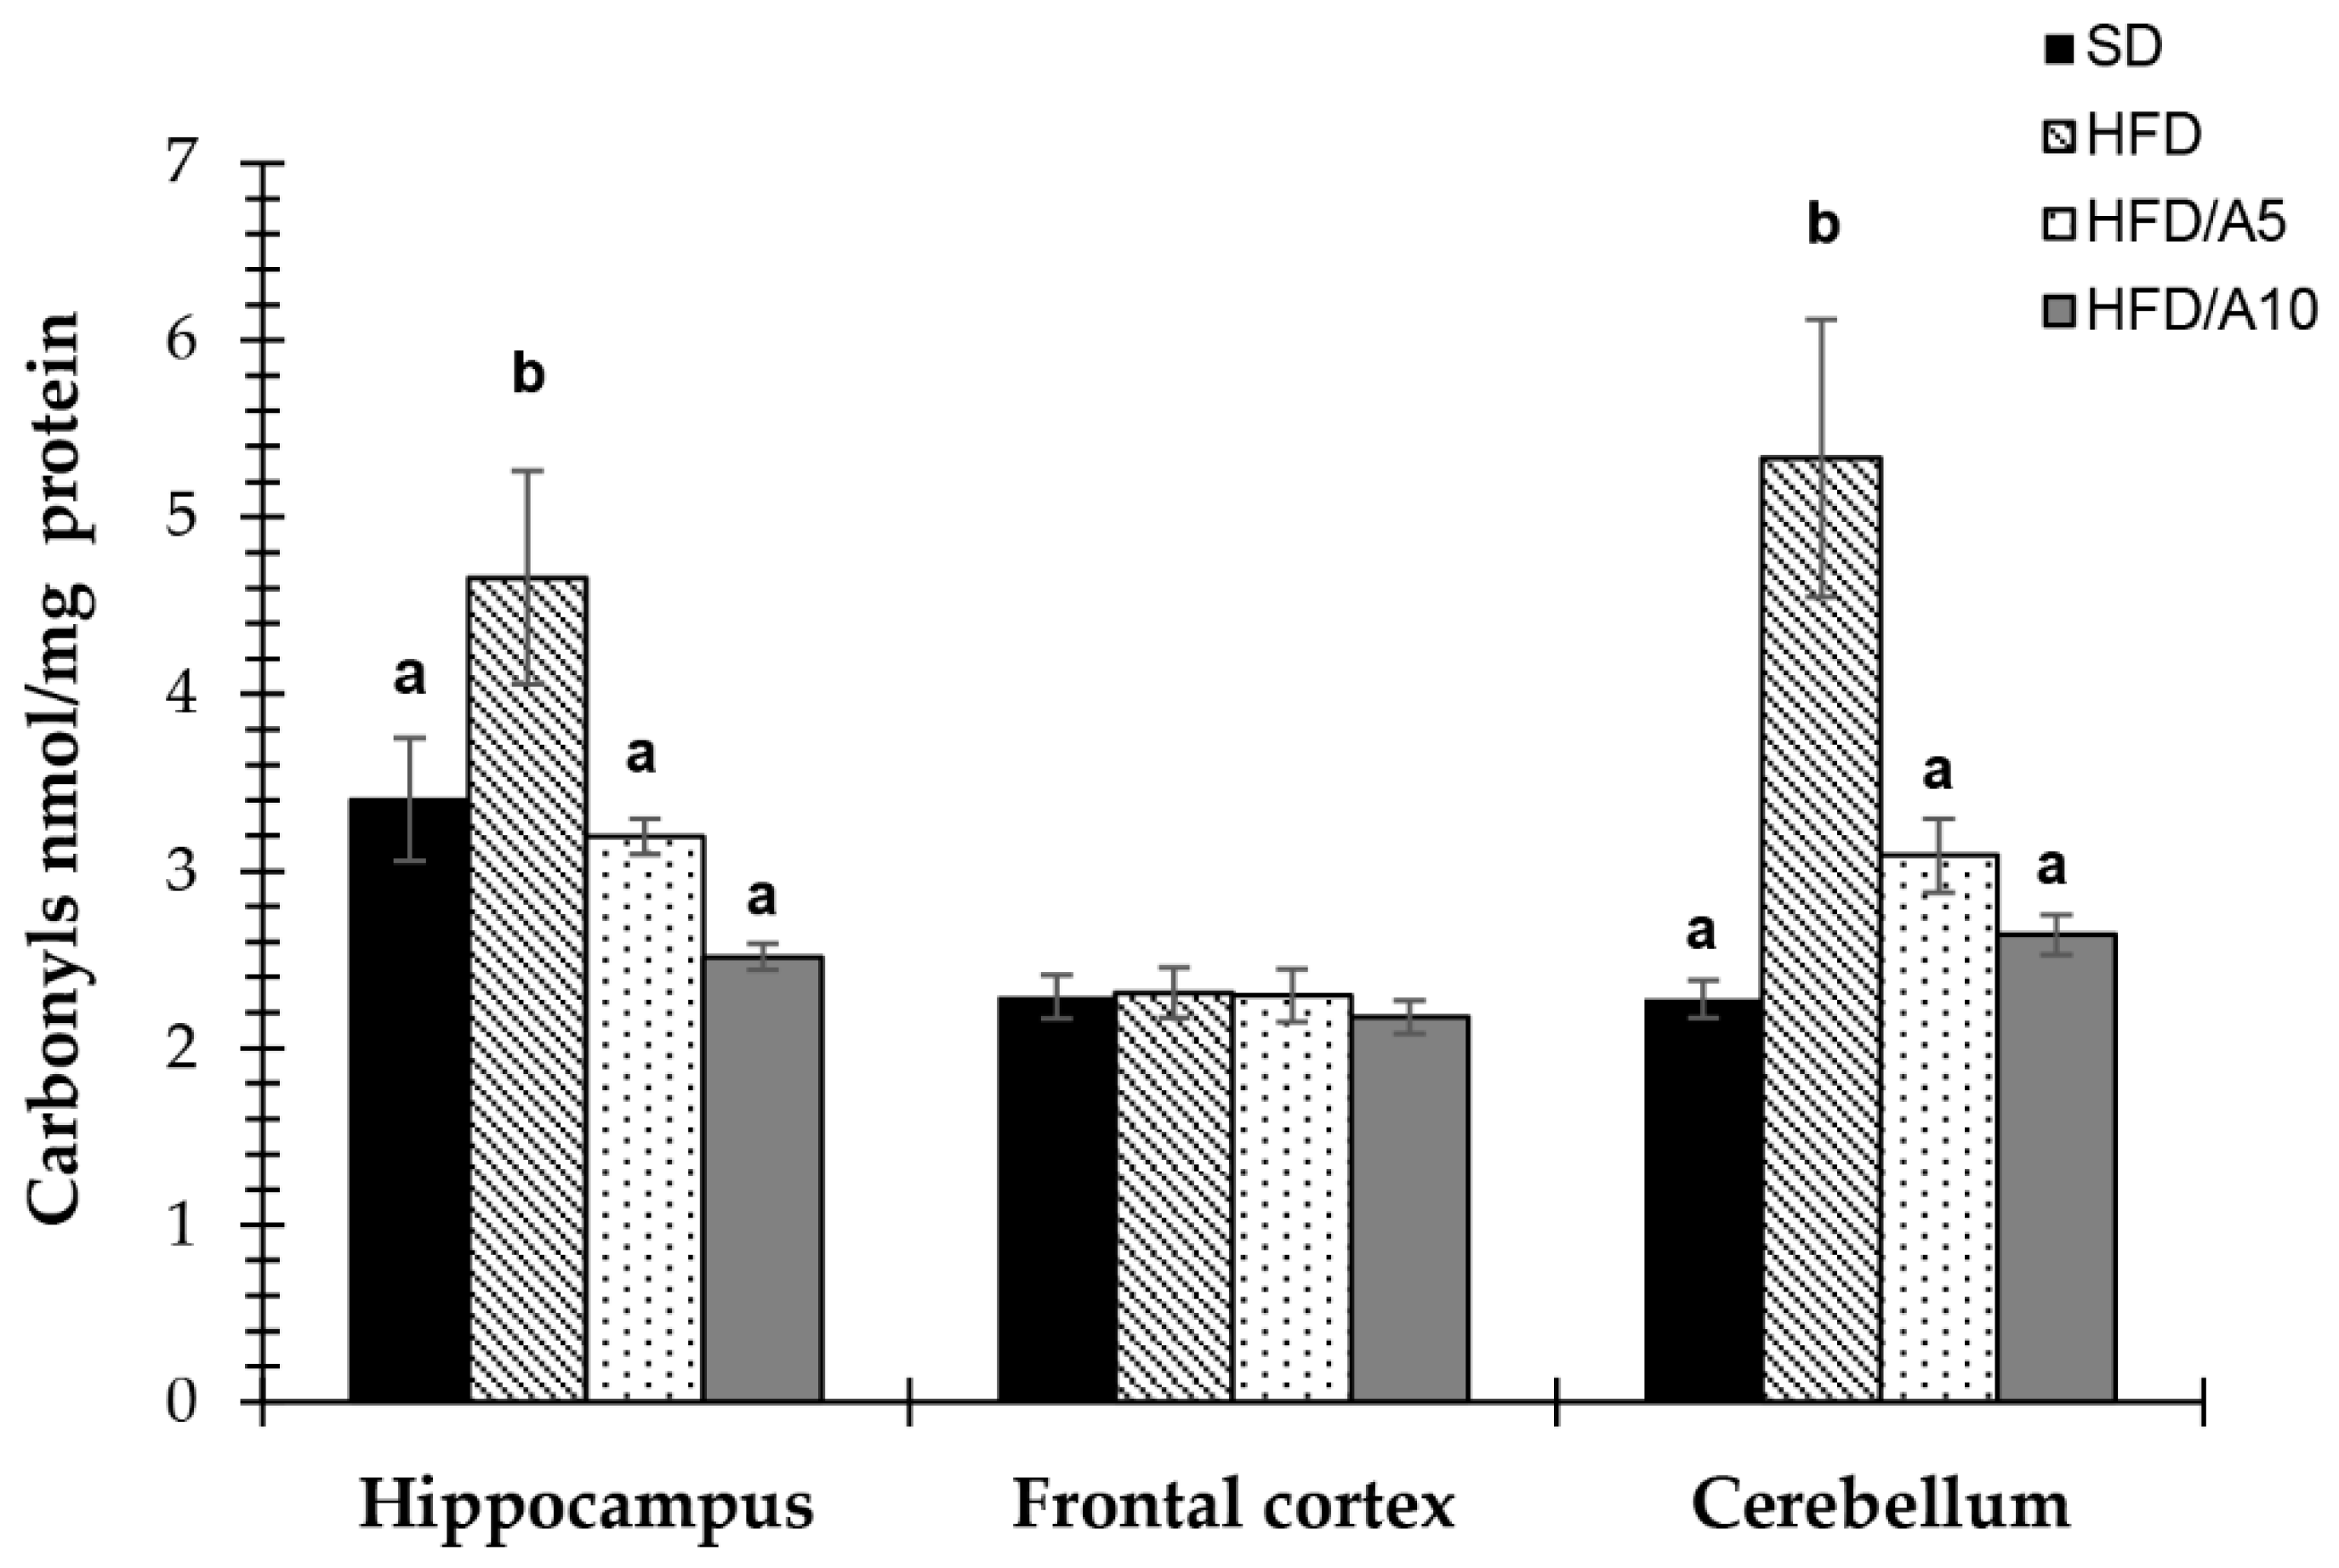
2.6. Protection against Protein Oxidative Damage in Specific Brain Regions
3. Experimental
3.1. Animals and Diets
3.2. Measurement of Body Weight Gain and Glucose, Triglyceride and Total Cholesterol Serum Levels
3.3. Quantification of Short-Chain Fatty Acids (SCFAs) in Feces
3.4. Tissue Homogenization and Measurement of Protein Concentration
3.5. Measurement of BDNF and GDNF Levels
3.6. Determination of Thiobarbituric Acid Reactive Substances (TBARS) in the Brain
3.7. Measurement of Oxidized Protein
3.8. Statistical Analysis
4. Conclusions
Acknowledgments
Author Contributions
Conflicts of Interest
References
- Malik, V.S.; Willett, W.C.; Hu, F.B. Global obesity: Trends, risk factors and policy implications. Nat. Rev. Endocrinol. 2013, 9, 13–27. [Google Scholar] [CrossRef] [PubMed]
- Hill, J.O.; Wyatt, H.R.; Peters, J.C. Energy balance and obesity. Circulation 2012, 126, 126–132. [Google Scholar] [CrossRef] [PubMed]
- López, M.G.; Mancilla-Margalli, N.A.; Mendoza-Díaz, G. Molecular structures of fructans from Agave tequilana Weber var. Azul. J. Agric. Food Chem. 2003, 51, 7835–7840. [Google Scholar] [CrossRef] [PubMed]
- Mancilla-Margalli, N.A.; López, M.G. Water-soluble carbohydrates and fructan structure patterns from Agave and Dasylirion species. J. Agric. Food Chem. 2006, 54, 7832–7839. [Google Scholar] [CrossRef] [PubMed]
- Marquez-Aguirre, A.L.; Camacho-Ruiz, R.M.; Arriaga-Alba, M.; Padilla-Camberos, E.; Kirchmayr, M.R.; Blasco, J.L.; Gonzalez-Avila, M. Effects of Agave tequilana fructans with different degree of polymerization profiles on the body weight, blood lipids and count of fecal Lactobacilli/Bifidobacteria in obese mice. Food Funct. 2013, 4, 1237–1244. [Google Scholar] [CrossRef] [PubMed]
- Huazano-García, A.; López, M.G. Agavins reverse the metabolic disorders in overweigth mice through the increment of short chain fatty acids and hormones. Food Funct. 2015. [Google Scholar] [CrossRef] [PubMed]
- Santiago-García, P.A.; López, M.G. Agavins from Agave angustifolia and Agave potatorum affect food intake, body weight gain and satiety-related hormones (GLP-1 and ghrelin) in mice. Food Funct. 2014, 5, 3311–3319. [Google Scholar] [CrossRef] [PubMed]
- Franco-Robles, E.; López, M.G. Implication of fructans in health: Immunomodulatory and antioxidant mechanisms. Sci. World J. 2015, 2015, 15. [Google Scholar] [CrossRef] [PubMed]
- Van den Ende, W.; Peshev, D.; de Gara, L. Disease prevention by natural antioxidants and prebiotics acting as ROS scavengers in the gastrointestinal tract. Trends Food Sci. Technol. 2011, 22, 689–697. [Google Scholar] [CrossRef]
- Zhang, L.; Bruce-Keller, A.J.; Dasuri, K.; Nguyen, A.T.; Liu, Y.; Keller, J.N. Diet-induced metabolic disturbances as modulators of brain homeostasis. Biochim. Biophys. Acta 2009, 1792, 417–422. [Google Scholar] [CrossRef] [PubMed]
- Kanoski, S.E.; Davidson, T.L. Western diet consumption and cognitive impairment: Links to hippocampal dysfunction and obesity. Physiol. Behav. 2011, 103, 59–68. [Google Scholar] [CrossRef] [PubMed]
- Lindqvist, A.; Mohapel, P.; Bouter, B.; Frielingsdorf, H.; Pizzo, D.; Brundin, P.; Erlanson-Albertsson, C. High-fat diet impairs hippocampal neurogenesis in male rats. Eur. J. Neurol. 2006, 13, 1385–1388. [Google Scholar] [CrossRef] [PubMed]
- Kanoski, S.E.; Meisel, R.L.; Mullins, A.J.; Davidson, T.L. The effects of energy-rich diets on discrimination reversal learning and on bdnf in the hippocampus and prefrontal cortex of the rat. Behav. Brain Res. 2007, 182, 57–66. [Google Scholar] [CrossRef] [PubMed]
- Stranahan, A.M.; Norman, E.D.; Lee, K.; Cutler, R.G.; Telljohann, R.S.; Egan, J.M.; Mattson, M.P. Diet-induced insulin resistance impairs hippocampal synaptic plasticity and cognition in middle-aged rats. Hippocampus 2008, 18, 1085–1088. [Google Scholar] [CrossRef] [PubMed]
- Allen, S.J.; Watson, J.J.; Shoemark, D.K.; Barua, N.U.; Patel, N.K. GDNF, NGF and BDNF as therapeutic options for neurodegeneration. Pharmacol. Ther. 2013, 138, 155–175. [Google Scholar] [CrossRef] [PubMed]
- Bekinschtein, P.; Cammarota, M.; Medina, J.H. BDNF and memory processing. Neuropharmacology 2014, 76, 677–683. [Google Scholar] [CrossRef] [PubMed]
- Lee, J.; Seroogy, K.B.; Mattson, M.P. Dietary restriction enhances neurotrophin expression and neurogenesis in the hippocampus of adult mice. J. Neurochem. 2002, 80, 539–547. [Google Scholar] [CrossRef] [PubMed]
- Savignac, H.M.; Corona, G.; Mills, H.; Chen, L.; Spencer, J.P.E.; Tzortzis, G.; Burnet, P.W.J. Prebiotic feeding elevates central brain derived neurotrophic factor, N-methyl-d-aspartate receptor subunits and d-serine. Neurochem. Inter. 2013, 63, 756–764. [Google Scholar] [CrossRef] [PubMed]
- Manfredsson, F.P.; Tumer, N.; Erdos, B.; Landa, T.; Broxson, C.S.; Sullivan, L.F.; Rising, A.C.; Foust, K.D.; Zhang, Y.; Muzyczka, N.; et al. Nigrostriatal rAAV-mediated GDNF overexpression induces robust weight loss in a rat model of age-related obesity. Mol. Ther. 2009, 17, 980–991. [Google Scholar] [CrossRef] [PubMed]
- Maswood, N.; Grondin, R.; Zhang, Z.; Stanford, J.A.; Surgener, S.P.; Gash, D.M.; Gerhardt, G.A. Effects of chronic intraputamenal infusion of glial cell line-derived neurotrophic factor (GDNF) in aged rhesus monkeys. Neurobiol. Aging 2002, 23, 881–889. [Google Scholar] [CrossRef]
- Tumer, N.; Scarpace, P.J.; Dogan, M.D.; Broxson, C.S.; Matheny, M.; Yurek, D.M.; Peden, C.S.; Burger, C.; Muzyczka, N.; Mandel, R.J. Hypothalamic rAAV-mediated GDNF gene delivery ameliorates age-related obesity. Neurobiol. Aging 2006, 27, 459–470. [Google Scholar] [CrossRef] [PubMed]
- Mwangi, S.M.; Nezami, B.G.; Obukwelu, B.; Anitha, M.; Marri, S.; Fu, P.; Epperson, M.F.; Le, N.A.; Shanmugam, M.; Sitaraman, S.V.; et al. Glial cell line-derived neurotrophic factor protects against high-fat diet-induced obesity. Am. J. Physiol. Gastro Liver Physiol. 2014, 306, G515–G525. [Google Scholar] [CrossRef] [PubMed]
- Birben, E.; Sahiner, U.M.; Sackesen, C.; Erzurum, S.; Kalayci, O. Oxidative stress and antioxidant defense. World Allergy Organ J. 2012, 5, 9–19. [Google Scholar] [CrossRef] [PubMed]
- Park, H.R.; Park, M.; Choi, J.; Park, K.Y.; Chung, H.Y.; Lee, J. A high-fat diet impairs neurogenesis: Involvement of lipid peroxidation and brain-derived neurotrophic factor. Neurosci. Lett. 2010, 482, 235–239. [Google Scholar] [CrossRef] [PubMed]
- Beltowski, J.; Wojcicka, G.; Gorny, D.; Marciniak, A. The effect of dietary-induced obesity on lipid peroxidation, antioxidant enzymes and total plasma antioxidant capacity. J. Physiol. Pharmacol. 2000, 51, 883–896. [Google Scholar] [PubMed]
- Morrison, C.D.; Pistell, P.J.; Ingram, D.K.; Johnson, W.D.; Liu, Y.; Fernandez-Kim, S.O.; White, C.L.; Purpera, M.N.; Uranga, R.M.; Bruce-Keller, A.J.; et al. High fat diet increases hippocampal oxidative stress and cognitive impairment in aged mice: Implications for decreased Nrf2 signaling. J. Neurochem. 2010, 114, 1581–1589. [Google Scholar] [CrossRef] [PubMed]
- Dewulf, E.M.; Cani, P.D.; Claus, S.P.; Fuentes, S.; Puylaert, P.G.; Neyrinck, A.M.; Bindels, L.B.; de Vos, W.M.; Gibson, G.R.; Thissen, J.P.; et al. Insight into the prebiotic concept: Lessons from an exploratory, double blind intervention study with inulin-type fructans in obese women. Gut 2013, 62, 1112–1121. [Google Scholar] [CrossRef] [PubMed]
- Salazar, N.; Dewulf, E.M.; Neyrinck, A.M.; Bindels, L.B.; Cani, P.D.; Mahillon, J.; de Vos, W.M.; Thissen, J.-P.; Gueimonde, M.; de los Reyes-Gavilán, C.G.; et al. Inulin-type fructans modulate intestinal Bifidobacterium species populations and decrease fecal short-chain fatty acids in obese women. Clin. Nutr. 2015, 34, 501–507. [Google Scholar] [CrossRef] [PubMed]
- Cani, P.D.; Dewever, C.; Delzenne, N.M. Inulin-type fructans modulate gastrointestinal peptides involved in appetite regulation (glucagon-like peptide-1 and ghrelin) in rats. Br. J. Nutr. 2004, 92, 521–526. [Google Scholar] [CrossRef] [PubMed]
- Rozan, P.; Nejdi, A.; Hidalgo, S.; Bisson, J.F.; Desor, D.; Messaoudi, M. Effects of lifelong intervention with an oligofructose-enriched inulin in rats on general health and lifespan. Br. J. Nutr. 2008, 100, 1192–1199. [Google Scholar] [CrossRef] [PubMed]
- Urías-Silvas, J.E.; Cani, P.D.; Delmee, E.; Neyrinck, A.; López, M.G.; Delzenne, N.M. Physiological effects of dietary fructans extracted from Agave tequilana Gto. and Dasylirion spp. Br. J. Nutr. 2008, 99, 254–261. [Google Scholar] [CrossRef] [PubMed]
- Cani, P.D.; Knauf, C.; Iglesias, M.A.; Drucker, D.J.; Delzenne, N.M.; Burcelin, R. Improvement of glucose tolerance and hepatic insulin sensitivity by oligofructose requires a functional glucagon-like peptide 1 receptor. Diabetes 2006, 55, 1484–1490. [Google Scholar] [CrossRef] [PubMed]
- Everard, A.; Lazarevic, V.; Derrien, M.; Girard, M.; Muccioli, G.G.; Neyrinck, A.M.; Possemiers, S.; van Holle, A.; Francois, P.; de Vos, W.M.; et al. Responses of gut microbiota and glucose and lipid metabolism to prebiotics in genetic obese and diet-induced leptin-resistant mice. Diabetes 2011, 60, 2775–2786. [Google Scholar] [CrossRef] [PubMed]
- Sakaguchi, E.; Sakoda, C.; Toramaru, Y. Caecal fermentation and energy accumulation in the rat fed on indigestible oligosaccharides. Br. J. Nutr. 1998, 80, 469–476. [Google Scholar] [CrossRef] [PubMed]
- Daubioul, C.A.; Taper, H.S.; de Wispelaere, L.D.; Delzenne, N.M. Dietary oligofructose lessens hepatic steatosis, but does not prevent hypertriglyceridemia in obese zucker rats. J. Nutr. 2000, 130, 1314–1319. [Google Scholar] [PubMed]
- Delmee, E.; Cani, P.D.; Gual, G.; Knauf, C.; Burcelin, R.; Maton, N.; Delzenne, N.M. Relation between colonic proglucagon expression and metabolic response to oligofructose in high fat diet-fed mice. Life Sci. 2006, 79, 1007–1013. [Google Scholar] [CrossRef] [PubMed]
- Jamieson, J.A.; Ryz, N.R.; Taylor, C.G.; Weiler, H.A. Dietary long-chain inulin reduces abdominal fat but has no effect on bone density in growing female rats. Br. J. Nutr. 2008, 100, 451–459. [Google Scholar] [CrossRef] [PubMed]
- Cani, P.D.; Possemiers, S.; van de Wiele, T.; Guiot, Y.; Everard, A.; Rottier, O.; Geurts, L.; Naslain, D.; Neyrinck, A.; Lambert, D.M.; et al. Changes in gut microbiota control inflammation in obese mice through a mechanism involving GLP-2-driven improvement of gut permeability. Gut 2009, 58, 1091–1103. [Google Scholar] [CrossRef] [PubMed]
- Kleessen, B.; Schwarz, S.; Boehm, A.; Fuhrmann, H.; Richter, A.; Henle, T.; Krueger, M. Jerusalem artichoke and chicory inulin in bakery products affect faecal microbiota of healthy volunteers. Br. J. Nutr. 2007, 98, 540–549. [Google Scholar] [CrossRef] [PubMed]
- Layden, B.T.; Angueira, A.R.; Brodsky, M.; Durai, V.; Lowe, W.L., Jr. Short chain fatty acids and their receptors: New metabolic targets. Transl. Res. 2013, 161, 131–140. [Google Scholar] [CrossRef] [PubMed]
- Alexiou, H.; Franck, A. Prebiotic inulin-type fructans: Nutritional benefits beyond dietary fibre source. Nutr. Bull. 2008, 33, 227–233. [Google Scholar] [CrossRef]
- Flint, H.J.; Scott, K.P.; Louis, P.; Duncan, S.H. The role of the gut microbiota in nutrition and health. Nat. Rev. Gastroenterol. Hepatol. 2012, 9, 577–589. [Google Scholar] [CrossRef] [PubMed]
- Galisteo, M.; Duarte, J.; Zarzuelo, A. Effects of dietary fibers on disturbances clustered in the metabolic syndrome. J. Nutr. Biochem. 2008, 19, 71–84. [Google Scholar] [CrossRef] [PubMed]
- Slavin, J. Whole grains and human health. Nutr. Res. Rev. 2004, 17, 99–110. [Google Scholar] [CrossRef] [PubMed]
- Sayago-Ayerdi, S.G.; Mateos, R.; Ortiz-Basurto, R.I.; Largo, C.; Serrano, J.; Granado-Serrano, A.B.; Sarria, B.; Bravo, L.; Tabernero, M. Effects of consuming diets containing Agave tequilana dietary fibre and jamaica calyces on body weight gain and redox status in hypercholesterolemic rats. Food Chem. 2014, 148, 54–59. [Google Scholar] [CrossRef] [PubMed]
- Cani, P.D.; Neyrinck, A.M.; Fava, F.; Knauf, C.; Burcelin, R.G.; Tuohy, K.M.; Gibson, G.R.; Delzenne, N.M. Selective increases of bifidobacteria in gut microflora improve high-fat-diet-induced diabetes in mice through a mechanism associated with endotoxaemia. Diabetologia 2007, 50, 2374–2383. [Google Scholar] [CrossRef] [PubMed]
- Anastasovska, J.; Arora, T.; Sanchez Canon, G.J.; Parkinson, J.R.; Touhy, K.; Gibson, G.R.; Nadkarni, N.A.; So, P.W.; Goldstone, A.P.; Thomas, E.L.; et al. Fermentable carbohydrate alters hypothalamic neuronal activity and protects against the obesogenic environment. Obesity 2012, 20, 1016–1023. [Google Scholar] [CrossRef] [PubMed]
- Jackson, K.G.; Taylor, G.R.; Clohessy, A.M.; Williams, C.M. The effect of the daily intake of inulin on fasting lipid, insulin and glucose concentrations in middle-aged men and women. Br. J. Nutr. 1999, 82, 23–30. [Google Scholar] [CrossRef] [PubMed]
- Balcazar-Munoz, B.R.; Martinez-Abundis, E.; Gonzalez-Ortiz, M. Effect of oral inulin administration on lipid profile and insulin sensitivity in subjects with obesity and dyslipidemia. Rev. Med. Chile 2003, 131, 597–604. [Google Scholar] [PubMed]
- Delzenne, N.M.; Kok, N. Effects of fructans-type prebiotics on lipid metabolism. Am. J. Clin. Nutr. 2001, 73, 456s–458s. [Google Scholar] [PubMed]
- Kok, N.; Roberfroid, M.; Robert, A.; Delzenne, N. Involvement of lipogenesis in the lower VLDL secretion induced by oligofructose in rats. Br. J. Nutr. 1996, 76, 881–890. [Google Scholar] [CrossRef] [PubMed]
- Cryan, J.F.; O’Mahony, S.M. The microbiome-gut-brain axis: From bowel to behavior. Neurogastroenterol. Motil. 2011, 23, 187–192. [Google Scholar] [CrossRef] [PubMed]
- Sam, A.H.; Troke, R.C.; Tan, T.M.; Bewick, G.A. The role of the gut/brain axis in modulating food intake. Neuropharmacology 2012, 63, 46–56. [Google Scholar] [CrossRef] [PubMed]
- Schellekens, H.; Finger, B.C.; Dinan, T.G.; Cryan, J.F. Ghrelin signalling and obesity: At the interface of stress, mood and food reward. Pharmacol. Ther. 2012, 135, 316–326. [Google Scholar] [CrossRef] [PubMed]
- Burokas, A.; Moloney, R.D.; Dinan, T.G.; Cryan, J.F. Chapter one—Microbiota regulation of the mammalian gut–brain axis. In Advances in Applied Microbiology; Sima, S., Geoffrey Michael, G., Eds.; Academic Press: Cambridge, MS, USA, 2015; Volume 91, pp. 1–62. [Google Scholar]
- Pelleymounter, M.A.; Cullen, M.J.; Wellman, C.L. Characteristics of BDNF-induced weight loss. Exp. Neurol. 1995, 131, 229–238. [Google Scholar] [CrossRef]
- Lapchak, P.A.; Hefti, F. BDNF and NGF treatment in lesioned rats: Effects on cholinergic function and weight gain. Neuroreport 1992, 3, 405–408. [Google Scholar] [CrossRef] [PubMed]
- Franco-Robles, E.; Campos-Cervantes, A.; Murillo-Ortiz, B.O.; Segovia, J.; Lopez-Briones, S.; Vergara, P.; Perez-Vazquez, V.; Solis-Ortiz, M.S.; Ramirez-Emiliano, J. Effects of curcumin on brain-derived neurotrophic factor levels and oxidative damage in obesity and diabetes. Appl. Physiol. Nutr. Metab. 2014, 39, 211–218. [Google Scholar] [CrossRef] [PubMed]
- Sample Availability: Not available.


| Parameters | Control Groups | Treatment Groups | ||
|---|---|---|---|---|
| SD (n = 10) | HFD (n = 10) | HFD/A5 (n = 10) | HFD/A10 (n = 10) | |
| Body weight gain (g) | 5.35 ± 0.19 a | 13.34 ± 0.12 b | 12.26 ± 0.18 b | 8.20 ± 0.18 a |
| Food intake (kJ/day/mice) | 56.09 ± 2.08 | 59.54 ± 2.48 b | 56.15 ± 2.38 b | 52.66 ± 2.63 a |
| Daily water intake (mL/day/mice) | 5.45 ± 0.46 a | 4.79 ± 0.41 b | 4.45 ± 0.40 b | 4.32 ± 0.36 b |
| Blood Metabolites (mM) | Control Groups | Treatment Groups | ||
|---|---|---|---|---|
| SD (n = 10) | HFD (n = 10) | HFD/A5 (n = 10) | HFD/A10 (n = 10) | |
| Glucose | 7.50 ± 0.34 | 8.84 ± 0.44 | 8.75 ± 0.38 | 8.72 ± 0.29 |
| Triglycerides | 6.77 ± 0.11 a | 8.96 ± 0.79 b | 7.28 ± 0.28 a | 7.04 ± 0.17 a |
| Total cholesterol | 9.10 ± 0.07 | 9.22 ± 0.06 | 9.24 ± 0.04 | 9.26 ± 0.07 |
| Group/Week | 1 | 2 | 3 | 4 | 5 | 6 | 7 | 8 | 9 | 10 |
|---|---|---|---|---|---|---|---|---|---|---|
| Acetic acid (mmol/g) | ||||||||||
| SD | 2.50 ± 0.24 | 3.21 ± 0.42 a | 4.48 ± 0.76 a | 3.60 ± 0.17 a | 3.24 ± 0.36 a | 4.14 ± 0.60 a | 2.90 ± 0.27 a | 4.37 ± 0.46 a | 3.72 ± 0.59 a | 8.16 ± 2.42 a |
| HFD | 1.85 ± 0.18 a | 1.64 ± 0.08 b | 1.36 ± 0.10 b | 1.70 ± 0.12 b | 0.81 ± 0.05 b | 0.90 ± 0.07 b | 1.48 ± 0.24 b | 0.90 ± 0.07 b | 1.59 ± 0.09 b | 2.28 ± 0.36 b |
| HFD/A5 | 2.70 ± 0.26 | 2.00 ± 0.16 b | 1.89 ± 0.15 b | 2.13 ± 0.16 b | 1.25 ± 0.07 b | 1.91 ± 0.12 b | 1.13 ± 0.09 b | 1.43 ± 0.04 b | 2.33 ± 0.18 b | 2.37 ± 0.17 b |
| HFD/A10 | 3.15 ± 0.38 b | 2.08 ± 0.09 b | 2.12 ± 0.16 b | 1.72 ± 0.08 b | 1.43 ± 0.08 b | 2.62 ± 0.39 | 1.16 ± 0.12 b | 2.20 ± 0.19 a,c | 2.68 ± 0.17 | 2.53 ± 0.27 b |
| Propionionic acid (mmol/g) | ||||||||||
| SD | 0.41 ± 0.04 | 0.43 ± 0.06 a | 0.90 ± 0.15 a | 0.70 ± 0.04 a | 0.79 ± 0.18 a | 0.75 ± 0.12 a | 0.48 ± 0.04 | 0.65 ± 0.07 a | 1.79 ± 0.25 a | 0.57 ± 0.04 a |
| HFD | 0.40 ± 0.02 | 0.39 ±0.02 a | 0.30 ± 0.01 b | 0.34 ± 0.02 b | 0.13 ± 0.02 b | 0.13 ± 0.01 b | 0.32 ± 0.04 | 0.14 ± 0.01 b | 0.35 ± 0.13 b | 0.22 ± 0.02 b |
| HFD/A5 | 0.37 ± 0.02 a | 0.40 ± 0.03 b | 0.44 ± 0.04 b | 0.57 ± 0.11 | 0.26 ± 0.02 b | 0.47 ± 0.16 b | 0.27 ± 0.01 | 0.31 ± 0.03 b | 0.58 ± 0.09 b | 0.34 ± 0.04 b |
| HFD/A10 | 0.68 ± 0.12 b | 0.65± 0.04 c | 0.76 ± 0.06 a | 0.55 ± 0.03 | 0.69 ± 0.09 | 0.71 ± 0.22 a,c | 0.31 ± 0.08 | 0.72 ± 0.11 a,c | 1.09 ± 0.14 c | 0.62 ± 0.07 a,c |
| Butyric acid (mmol/g) | ||||||||||
| SD | 0.37 ± 0.05 | 0.40 ± 0.05 | 1.10 ± 0.40 | 0.74 ± 0.09 a | 0.88 ± 0.22 a | 0.52 ± 0.07 a | 0.52 ± 0.09 a | 0.53 ± 0.07 a | 2.25 ± 0.30 a | 0.58 ± 0.10 a |
| HFD | 0.42 ± 0.06 | 0.27 ± 0.01 a | 0.35 ± 0.13 | 0.25 ± 0.01 b | 0.02 ± 0.004 b | 0.04 ± 0.003 b | 0.15 ± 0.02 b | 0.04 ± 0.004 b | 0.14 ± 0.04 b | 0.04 ± 0.006 b |
| HFD/A5 | 0.33 ± 0.04 | 0.43 ± 0.07 | 0.41 ± 0.05 | 0.37 ± 0.04 b,c | 0.21 ± 0.02 b | 0.26 ± 0.05 a,b | 0.12 ± 0.01 b | 0.16 ± 0.02 b | 0.43 ± 0.11 b | 0.15 ± 0.01 b |
| HFD/A10 | 0.61 ± 0.15 | 0.65 ± 0.12 b | 0.60 ± 0.08 | 0.54 ± 0.08 a | 0.68 ± 0.17 c | 0.86 ± 0.16 c | 0.24 ± 0.08 b | 0.81 ± 0.16 a,c | 1.11 ± 0.19 c | 0.45 ± 0.12 a,c |
© 2016 by the authors. Licensee MDPI, Basel, Switzerland. This article is an open access article distributed under the terms and conditions of the Creative Commons Attribution (CC-BY) license ( http://creativecommons.org/licenses/by/4.0/).
Share and Cite
Franco-Robles, E.; López, M.G. Agavins Increase Neurotrophic Factors and Decrease Oxidative Stress in the Brains of High-Fat Diet-Induced Obese Mice. Molecules 2016, 21, 998. https://doi.org/10.3390/molecules21080998
Franco-Robles E, López MG. Agavins Increase Neurotrophic Factors and Decrease Oxidative Stress in the Brains of High-Fat Diet-Induced Obese Mice. Molecules. 2016; 21(8):998. https://doi.org/10.3390/molecules21080998
Chicago/Turabian StyleFranco-Robles, Elena, and Mercedes G. López. 2016. "Agavins Increase Neurotrophic Factors and Decrease Oxidative Stress in the Brains of High-Fat Diet-Induced Obese Mice" Molecules 21, no. 8: 998. https://doi.org/10.3390/molecules21080998
APA StyleFranco-Robles, E., & López, M. G. (2016). Agavins Increase Neurotrophic Factors and Decrease Oxidative Stress in the Brains of High-Fat Diet-Induced Obese Mice. Molecules, 21(8), 998. https://doi.org/10.3390/molecules21080998