Abstract
Despite prevention and treatment options, breast cancer (BC) has become one of the most important issues in the present day. Therefore, the need for more specific and efficient compounds remains paramount. We evaluated four previously isolated aryltetralin lignans: 5′-demethoxy-β-peltatin-A-methylether (1), acetylpodophyllotoxin (2), 5′-demethoxydeoxypodophyllotoxin (3), and 7′,8′-dehydroacetylpodophyllotoxin (4) for cytotoxicity, clonogenicity, and selectivity against three BC cell lines: MCF-7, MDA-MB-231, and BT-549, as well as the non-tumorigenic mammary epithelial cell line MCF-10A. Cytotoxicity was evaluated after 72 h of treatment, and clonogenicity was determined at 72 h post-treatment; experiments were performed using the sulforhodamine B staining assay. Selective-index (SI) was calculated by comparing pure compound IC50 values in MCF-10A cell line against the IC50 of the same compound in cancer cell lines. Structural similarities among lignans and controls (podophyllotoxin and etoposide) were analyzed using the Tanimoto coefficient (Tc). Lignans were cytotoxic against all tested cell lines (0.011–7.22 µM) and clonogenicity testing showed a dose-dependent cytocidality for all lignans (≥0.08 µg/mL); compounds 2 and 3 were more potent (14.1 and 7.6 respectively) than etoposide in BT-549 cell line, while compound 2 displayed selectivity (SI = 28.17) in BT-549 cell line. Tc values of lignans suggested a greater similarity with podophyllotoxin structure.
1. Introduction
Cancer is a group of diseases responsible for 8.2 million deaths (13% of all deaths worldwide), according to data collected by the World Health Organization (WHO) in 2012. Unfortunately, the WHO has estimated that this number will increase to 30 million in the next 20 years. Among different cancers, breast cancer has become one of the most important issues, as 25% of female cancer patients suffer from it [1]. This is considered a public health problem because of the high costs of treatment. Therefore, even though several prevention and treatment options are available, the search for more specific and efficient compounds remains paramount in order to avoid adverse effects caused by typical treatments [2]. Breast cancers are routinely classified by stage, pathology, grade, and by the expression of estrogen receptor (ER), progesterone receptor (PgR), or human epidermal growth factor receptor (Her2/neu) [3].
Some of the chemical compounds used for cancer treatment are natural molecules isolated from plants or semisynthetic drugs, natural compounds chemically treated and modified to achieve a better activity or/and less toxicity. Podophyllotoxin (POD), a lignan compound initially isolated from Podophyllum peltatum [4], has been used as a folk medicine; owing to its severe toxic side effects, this compound is limited to topical applications [5,6,7]. However, in the last century, different modifications on its chemical structure resulted in the development of the epipodophyllotoxin semisynthetic drug “etoposide” (also called VP-16) [8]. This compound is less toxic than POD and it is used as an anticancer drug against several cancers, such as lung, ovarian, and testicular cancer, as well as lymphoma [9]. By binding to β-tubulin, the POD mechanism of action is through the inhibition of the mitotic spindle during mitosis, resulting in cell cycle arrest in the G2/M phase and consequent programmed cell death [10,11,12]. On the other hand, VP-16 has a different mechanism of action associated with the inhibition of DNA-topoisomerase II. By forming a ternary complex with the enzyme [13], it prevents the re-ligation of DNA, inducing a pre-mitotic blockage in the late S or early G2 stages [14,15].
Structurally, podophyllotoxins consist of a five rings system (A to E) including a dioxol ring (A), tetralin rings (B and C), γ-lactone ring (D), and an aromatic ring (E) of α configuration (Figure 1) [10]. Several studies have shown that only the A and E rings are essential for podophyllotoxins activity and that aromatization of the C ring leads to a loss of activity [5]. VP-16, unlike POD, undergoes a stereotransformation at C-7 from an α to a β configuration (epipodophyllotoxins), and a demethylation at C-4′ in the E ring [14,16]. These main structural changes indicate how the action mechanism, from a cytotoxic compound that interacts with tubulin (POD) to a compound that blocks the topoisomerases II action (VP-16), could be affected [15,17].

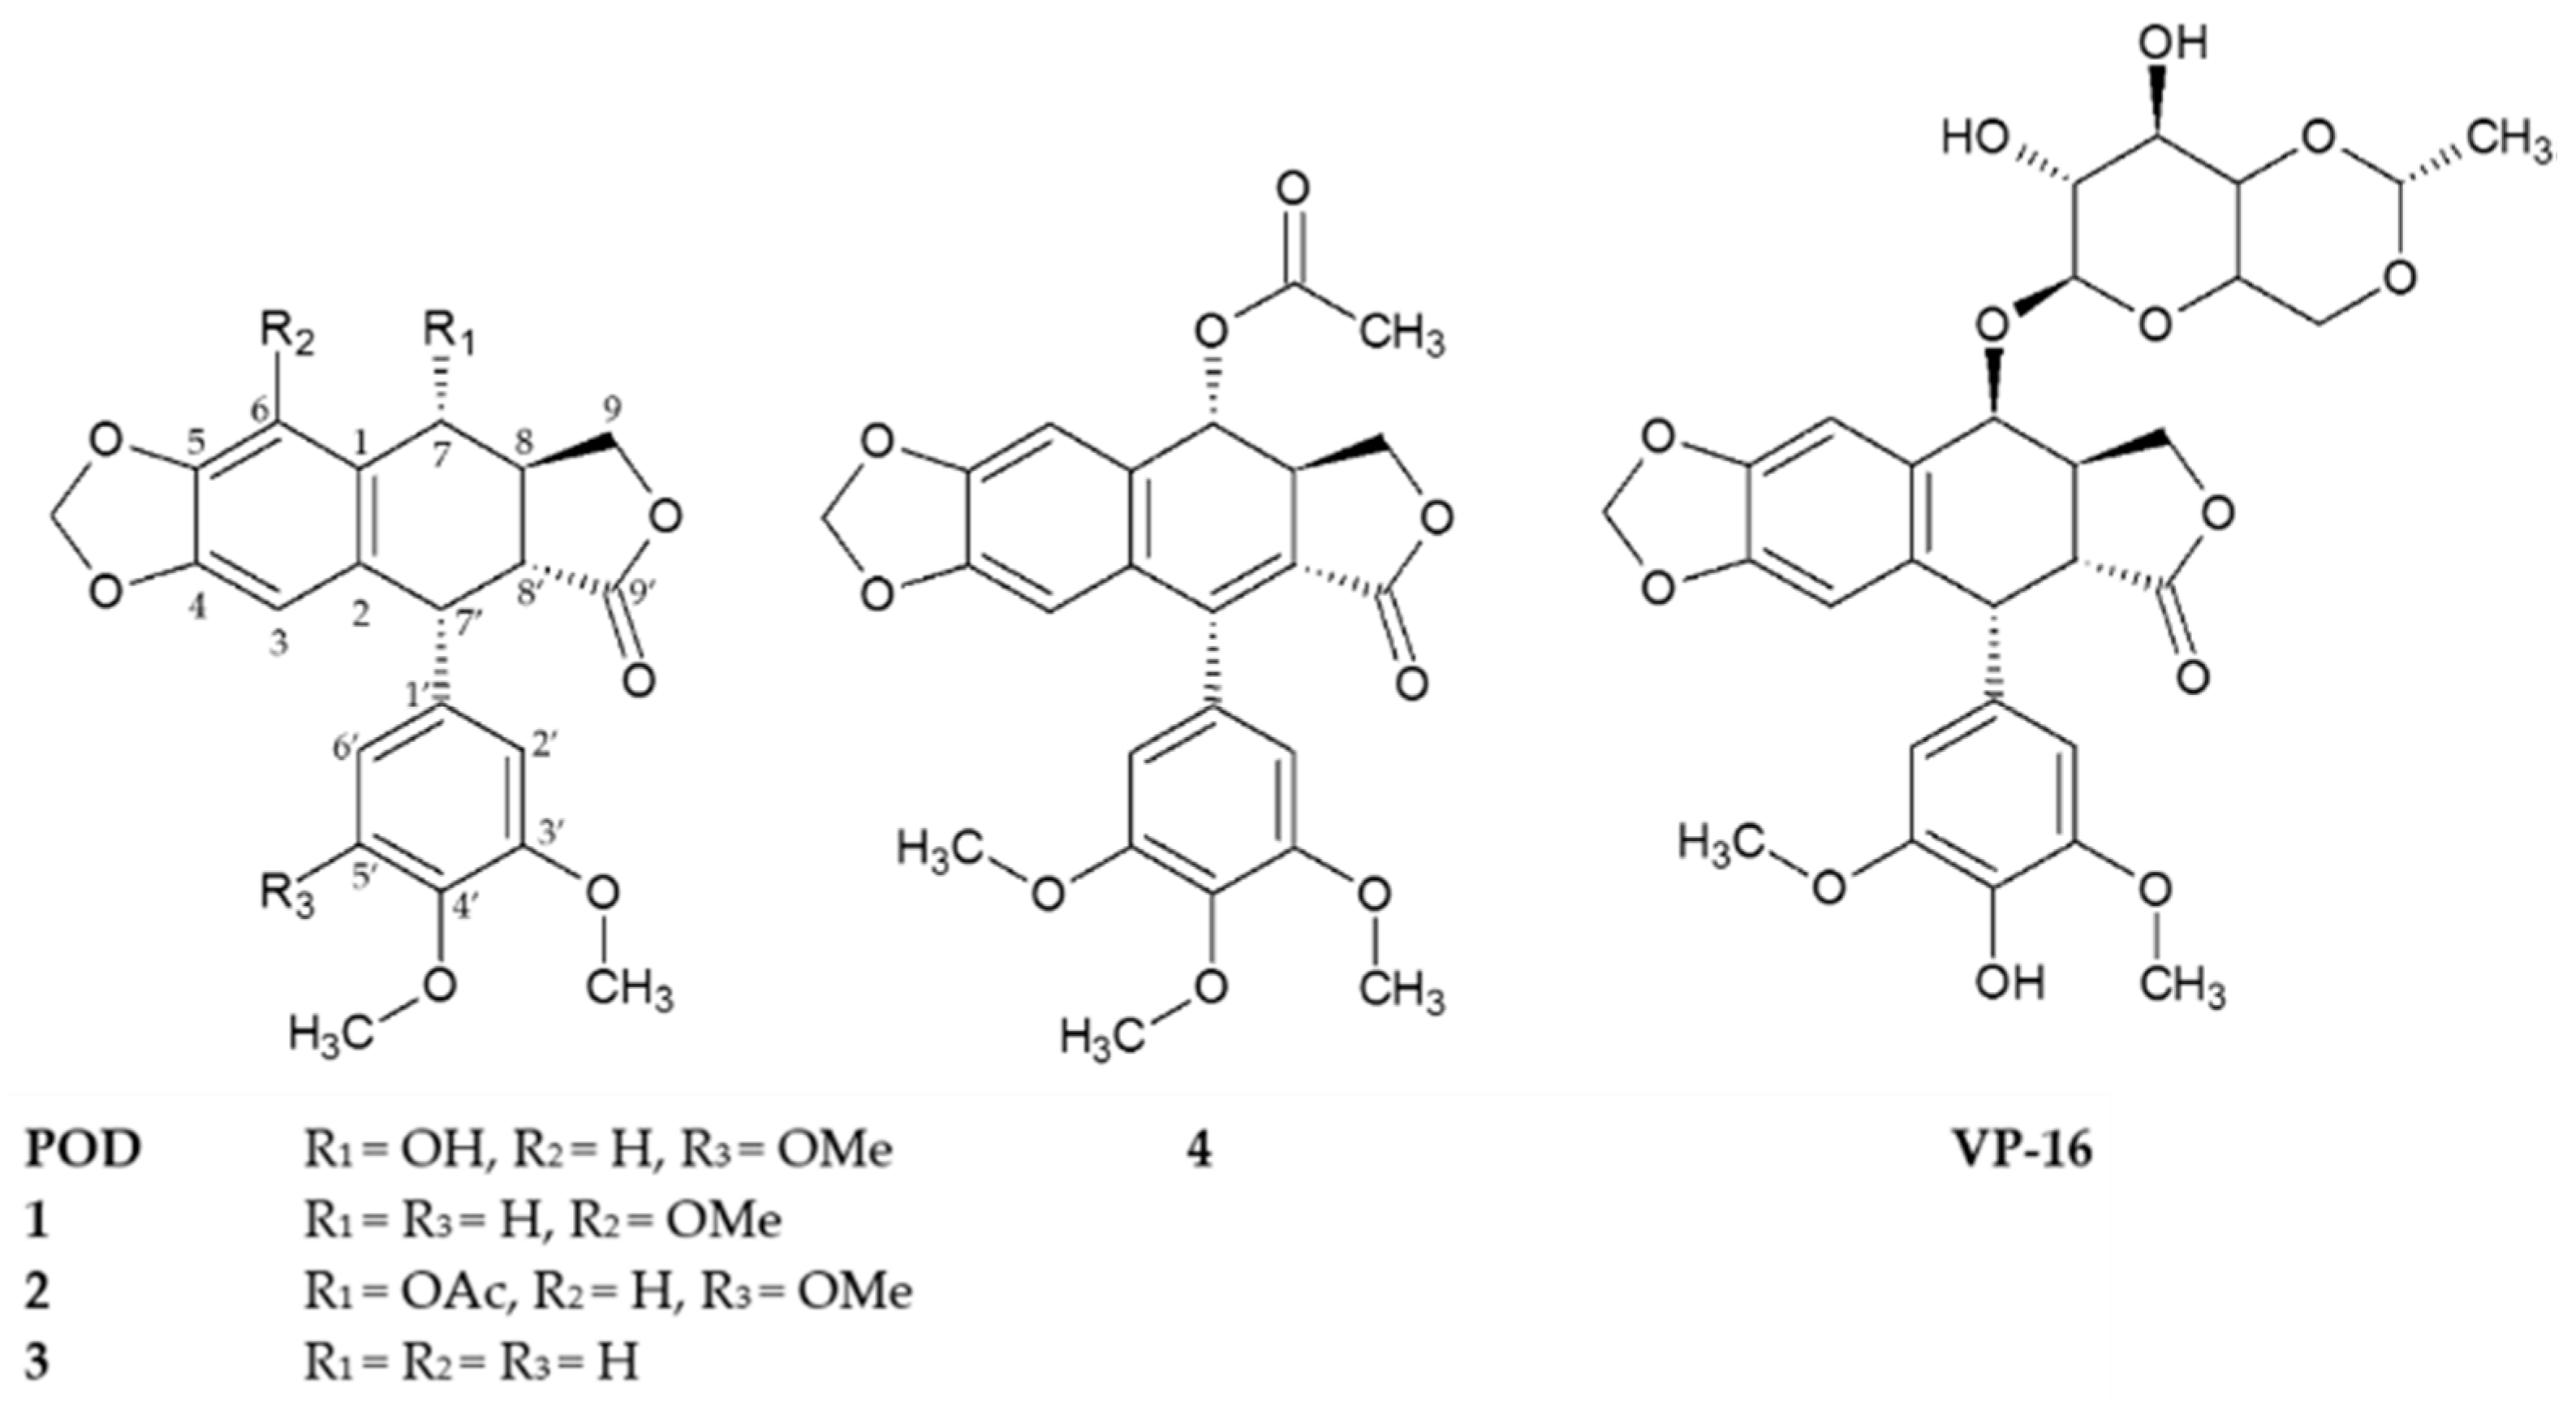
Figure 1.
Chemical structures of compounds 1–4 isolated from the stem bark of Bursera fagaroides var. fagaroides, and the positives controls podophyllotoxin (POD) and etoposide (VP-16).
In the present study, we explored the cytotoxic effects of lignans 1–4 on the breast cancer cell line MCF-7, which is an ER-positive/PgR-positive luminal mammary carcinoma, endocrine responsive and often chemotherapy responsive. These compounds were also tested on the breast cancer (BC) cell line MDA-MB-231, characterized as a triple-negative/basal-B mammary invasive ductal adenocarcinoma, and the BC cell line BT-549, which is a triple-negative/basal-B mammary papillary invasive ductal carcinoma, and a mucin producer type. These triple negative cell lines possess an intermediate response to chemotherapy [3,18,19]. Triple negative breast cancer (TNBC) cells represent one of the most aggressive and difficult to treat subtypes of human breast cancer. Moreover, their ability to breach the basement membrane of the epithelial barrier and migrate distinguishes highly metastatic TNBC cells from non-metastatic breast cancer cells. The molecular basis for the aggressiveness of TNBC are largely unknown and yet to be clarified [20,21,22].
Compounds 1, 2, and 4 were previously isolated and characterized by Rojas-Sepulveda and collaborators and Antúnez and collaborators in 2012 and 2016 respectively [23,24]. Briefly, the compounds, namely 5′-demethoxy-β-peltatin-A-methylether (1), acetylpodophyllotoxin (2), 5′-demethoxydeoxypodophyllotoxin (3), and 7′,8′-dehydroacetylpodophyllotoxin (4), were isolated through a bioactivity-directed study of the stem bark of Bursera fagaroides var. fagaroides (Burseraceae) through chromatographic methods and by 1D- and 2D-NMR, as well as FAB-MS analyses (Figure 1). Both the Rojas-Sepulveda and Antúnez research teams reported the cytotoxic potential of compounds 1, 2, and 4 against four human carcinoma cell lines (nasopharyngeal, KB; colon, HF-6; breast, MCF-7; and prostate, PC-3). Based on these preliminary results, this work continues with the cytotoxic study of compounds 1, 2, and 4, in addition with the not previously evaluated compound 3, focusing specifically against breast cancer. Furthermore, these compounds were evaluated in their clonogenicity and selectivity against three BC cell lines: MCF-7, MDA-MB-231, and BT-549, as well as the non-tumorigenic mammary epithelial cell line MCF-10A.
2. Results
2.1. Cytotoxicity and Clonogenicity Assays, and the Selctive-index
Treatment of MCF-7, MDA-MB-231, BT-549, and MCF-10A (Figure 2a,g,m,s, respectively) with different POD concentrations resulted in the arrest of cell proliferation, which persisted even after the toxic agent was removed.
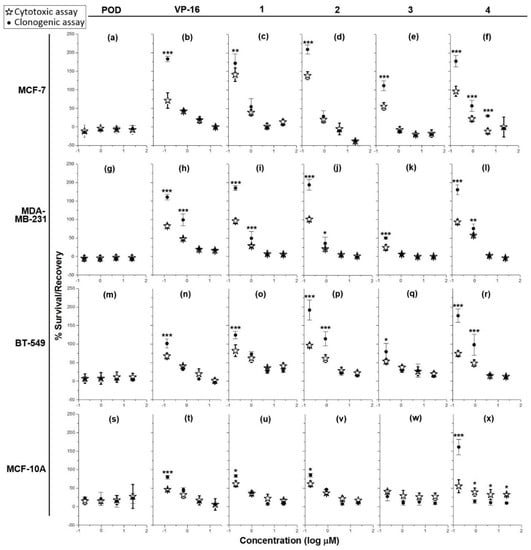
Figure 2.
Graphs showing cell survival rates in cytotoxic assay after 72 h of treatment (✰) with controls (POD and VP-16) and lignans (compounds 1–4), and recovery rates in clonogenic assay (●) (cytocidal and/or cytostatic activity) after 72 h post-treatment against four cell lines: MCF-7 (a–f), MDA-MB-231 (g–l), BT-549 (m–r), and MCF-10A (s–x) (n = 3). Percentages of survival and recovery were compared with a one-way ANOVA and Bonferroni correction (* = p < 0.05, ** = p < 0.01, and *** = p < 0.001).
On the other hand, treatment of MCF-7, BT-549, and MCF-10A with VP-16 (Figure 2b,n,t, respectively) resulted in a concentration-dependent effect. Cells treated with 10, 2, and 0.4 µg/mL did not recover proliferation after treatment, as shown by the lack of significant difference (p < 0.05) between the percentage of survival and the percentage of recovery. However, VP-16 at 0.08 µg/mL showed a significant difference between the percentage of survival (MCF-7 = 71% ± 20.7%; BT-549 = 67% ± 7.5%; MCF-10A = 46% ± 2.8%), and the percentage of recovery (MCF-7 = 183% ± 7.4%; BT-549 = 101% ± 11.7%; MCF-10A = 79% ± 5.1%). In the MDA-MB-231 cell line, VP-16 (Figure 2h) displayed dose-dependent behavior but only higher concentrations (10 and 2 µg/mL) caused inhibition of proliferation and cell recovery in clonogenic assay; treatments with 0.4 and 0.08 µg/mL of VP-16 presented a survival of48% ± 2.4% and 82% ± 5.6% respectively, and a recovery rate of 98% ± 16.1% and 160% ± 7.4% respectively.
Addition of compound 1 to MCF-7, BT-549, and MCF-10A cell lines (Figure 2c,o,u, respectively showed a dose-dependent cytotoxic effect at concentrations of 10, 2, and 0.4 µg/mL, which persisted after removal of the treatment, as inferred by the lack of statistical significance between the cytotoxic and cytostatic data. The percentage of survival of cells treated with the lowest concentration (0.08 µg/mL) of compound 1 was as follows: MCF-7 = 130% ± 18.55%; BT-549 = 82% ± 15.7%; and MCF-10A = 61% ± 7.9%. On the other hand, the percentage of recovery was: MCF-7 = 172% ± 24.5%; BT-549 = 124% ± 9.7%; and MCF-10A = 83% ± 3.3%. In the MDA-MB-231 cell line (Figure 2i), concentrations of 10 and 2 µg/mL inhibited proliferation and blocked recovery, while treatment with 0.4 and 0.08 µg/mL of compound 1 resulted in a percentage of survival of 28% ± 3.1% and 96% ± 6.9% respectively, and a percentage of recovery of 49% ± 18.6% and 184% ± 6.4% respectively.
Addition of compound 2 to MCF-7 and MCF-10A (concentrations of 10, 2, and 0.4 µg/mL) dose-dependently inhibited the proliferation and the recovery of cells (Figure 2d,v). However, treatment with 0.08 µg/mL resulted in a 121% ± 10.8% of survival and 209% ± 12.4% of recovery in MCF-7 cells and a 61% ± 7.8% of survival and 85% ± 4.5% of recovery in MCF-10A cells. Treatment of MDA-MB-231 and BT-549 (Figure 2j,p) with 10 and 2 µg/mL of compound 2 completely inhibited proliferation and prevented recovery. Conversely, addition of 0.4 and 0.08 µg/mL to MDA-MB-231 resulted in a survival rate of 21% ± 0.6% and 101% ± 5.7% respectively. Addition of the same concentrations to BT-549 cells resulted in a survival rate of 61% ± 10.6% and 96% ± 5.5% respectively. The percentage of recovery of MDA-MB-231 treated with 0.4 and 0.8 µg/mL was 36% ± 16.8% and 194% ± 14.7% respectively; the recovery rate of BT-549 at the same concentrations was around 114% ± 18.5% and 191% ± 27.1% respectively.
Compound 3 was the most toxic of the tested lignans. Addition of 10, 2, and 0.4 µg/mL on MCF-7, MDA-MB-231, and BT-549 cells (Figure 2e,k,q) resulted in cytotoxicity with a lack of recovery; treatment of MCF-7 with 0.08 µg/mL of compound 3 resulted in a survival rate of 55% ± 9.9% and a recovery rate of 111% ± 13%. In the case of the MCF-10A cell line, the four tested concentrations of compound 3 completely inhibited proliferation in the cytotoxicity and clonogenicity assays (Figure 2w).
Tested on MCF-7, compound 4 (Figure 2f) at the highest concentration (10 µg/mL) did not exhibited differences between percentages of survival and recovery but at lower concentrations a dose-dependent activity was observed. Indeed, at 2, 0.4, and 0.08 µg/mL, the survival rate was 11% ± 7.6%, 21% ± 7.2%, and 96% ± 13.5%, while the recovery rate was 29% ± 0.7%, 57% ± 14.5%, and 177% ± 15.6%, respectively. Addition of compound 4 to MDA-MB-231 and BT-549 (Figure 2l,r), also showed an inhibitory effect on the survival and recovery at concentrations of 10 and 2 µg/mL; however, this was not the case when lower concentrations were added. In the latter case, the percentages of survival obtained at 0.4 and 0.08 µg/mL were: MDA-MB-231 = 57% ± 1.4% and 93% ± 6.9%; BT-549 = 48% ± 8.8% and 74% ± 7.4% respectively. At the same concentrations, the percentages of recovery were: MDA-MB-231 = 75% ± 12.2% and 180% ± 13.5%; BT-549 = 98% ± 27.9% and 176% ± 18% respectively). In the MCF-10A control cell line, compound 4 (10, 2, and 0.4 µg/mL) exhibited a concentration-independent effect (Figure 2x). However, while there were statistically significant differences (p < 0.05), these were the result of a decrease in the % of recovery compared with the % of survival. At the lowest concentration (0.08 µg/mL), the % of survival was about 55% ± 17.2%, while the % of recovery was 160% ± 21%.
With the aim of comparing the effects of compounds 1–4 and controls, their half inhibitory concentration (IC50) value was calculated. The cytotoxic activity assay was repeated in order to obtain a larger cytotoxicity spectrum (Figure 3).
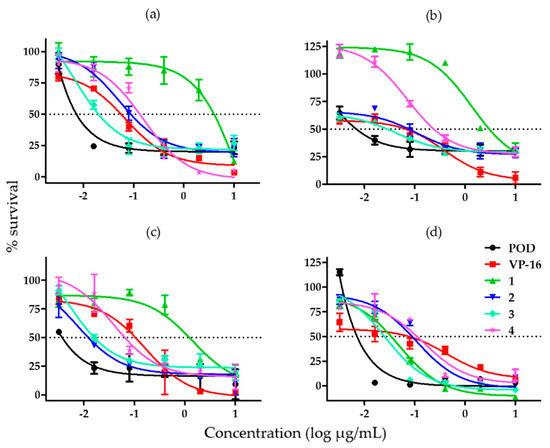
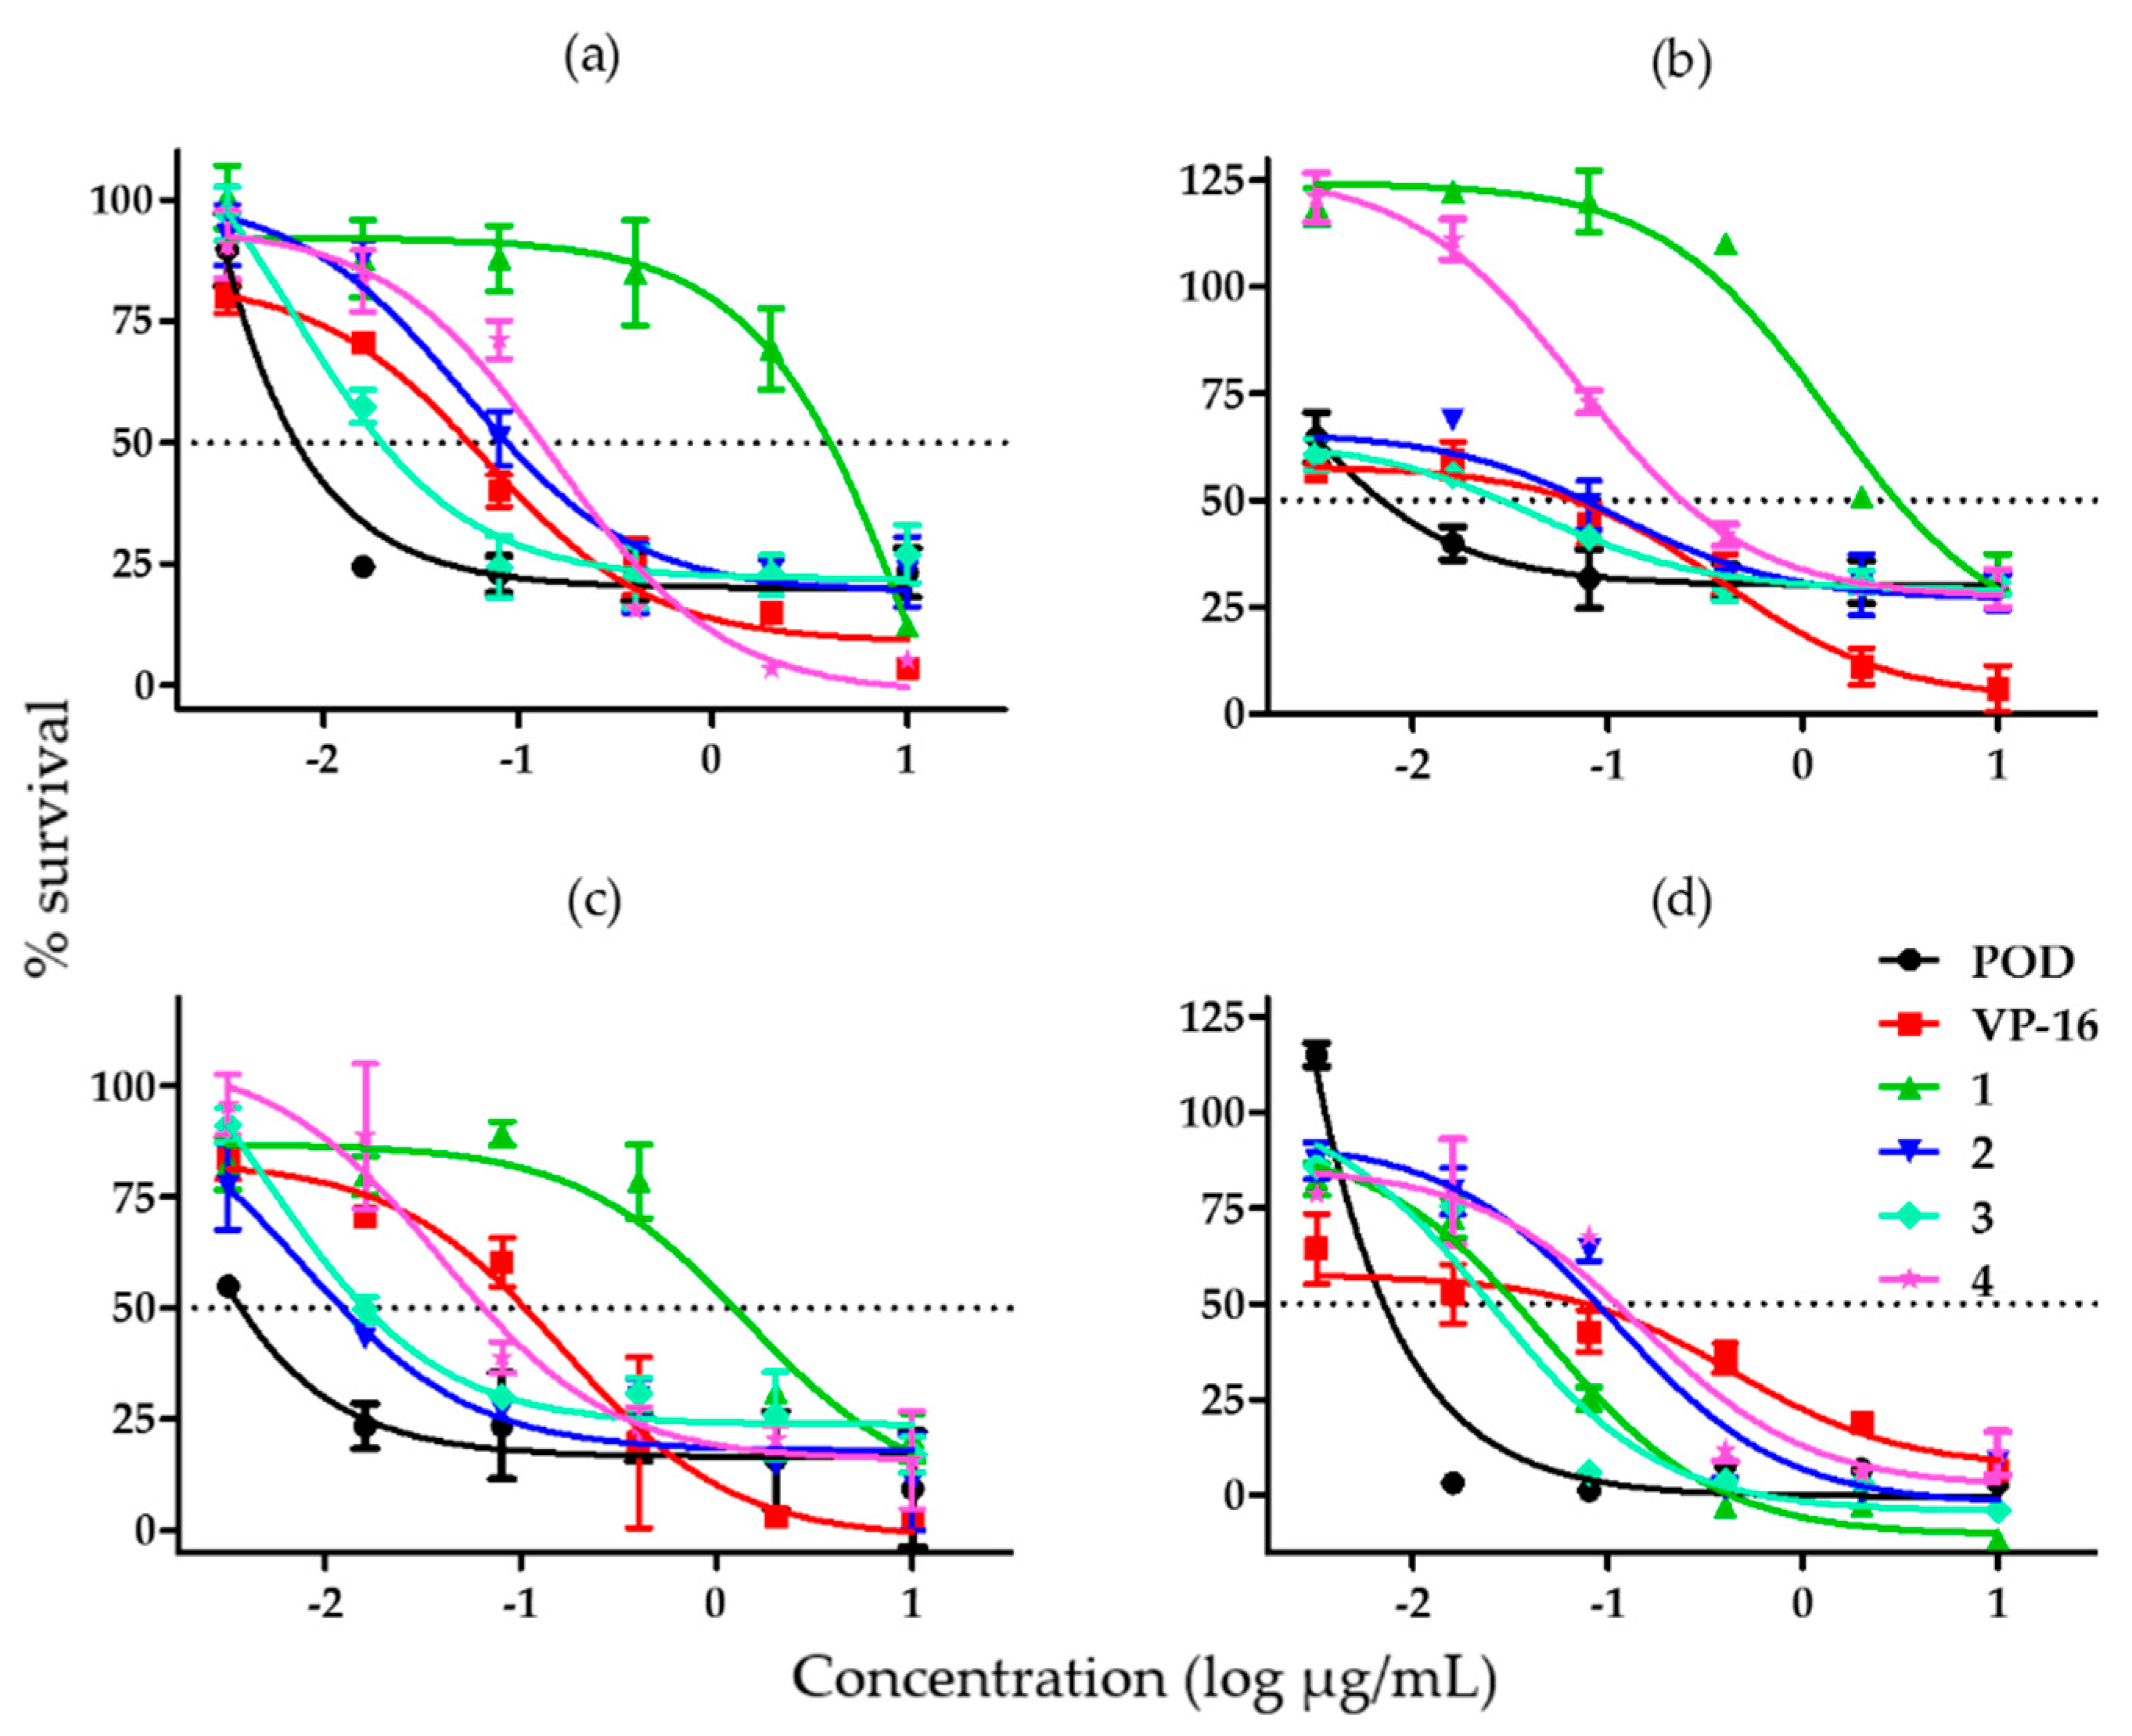
Figure 3.
Graphs showing cell survival rates obtained by adding different concentrations of lignans from B. fagaroides var. fagaroides to (a) MCF-7 cells; (b) MDA-MB-231 cells; (c) BT-549 cells; and (d) MCF-10A cells (n = 3).
When we tested the effect of each compound on the MCF-7 cell line, we found that compound 3 was the most potent and compound 1 was the least potent amongst the substances tested against MCF-7 (Figure 3a). Figure 3b shows the effects of the compounds against the MDA-MB-231 cell line, which were similar to the ones obtained for MCF-7. Compound 2 was the most potent against BT-594, but its effect was comparable to that of compound 3; compound 1 was once more the least potent (Figure 3c). In Figure 3d, showing the effects of the compounds in MCF-10A cells, we can appreciate that compounds 1 and 3 have a similar high potency, just as compounds 2 and 4 have a similar low potency.
Table 1 summarizes the estimated IC50 values of all compounds analyzed in this study on the cancer cell lines MCF-7, MDA-MB-231, and BT-549, and on the non-tumorigenic immortalized cell line MCF-10A. Compound 1 showed the highest IC50, indicating a low potency against all cancer cell lines (MCF-7 = 7.22 ± 0.09 µM; MDA-MB-231 = 2.44 ± 0.08 µM; and BT-549 = 1.26 ± 0.08 µM). Compound 3 showed the lowest IC50 against MCF-7 = 0.04 ± 0.01 µM; MDA-MB-231 = 0.145 ± 0.04 µM; and MCF-10A = 0.09 ± 0.009 µM. However, the IC50 of compounds 1, 2, and 3 on BT-549 cells were comparable. As shown in Table 1 POD presented a lower IC50 than VP-16 in all cell lines.

Table 1.
Cytotoxic activity (IC50 µM) of lignans. IC50 values are mean of three independent experiments ± S.D.
Table 2 summarizes the results of the comparison between potencies of compounds 1–4 with positive controls. We observed that compounds 2, 3, and 4 had higher potency than VP-16 on the BT-549 cell line (14.1, 7.6, and 2.6 respectively); their potency on the other cell lines was comparable with that of either POD or VP-16.
Table 2.
Potency of compounds (1–4) compared to controls (POD and VP-16).
The immortalized human mammary epithelial cell line MCF-10A, was used as a control in the selectivity analysis due to its non-tumorigenic origin [25]. The in vitro activity of the tested compounds on the MCF-10A cell line was used to estimate the selectivity index with the formula described in the Materials and Methods section (Equation (2)). As shown in Table 3, compounds 2 and 4 presented the best selectivity index against the BT-549 cell line (28.1 and 7.43 respectively). However, according to the “selectivity criteria” only compound 2 could be considered a selective compound against BT-549. Compounds 3, 4, and POD showed a selectivity index < 10 on BT-549 cell line. Compounds with SIs lower than 10 but higher than 1 could be considered as non-selective.
Table 3.
Selectivity index of compounds (1–4) and controls (POD and VP-16).
2.2 Similarity Analysis of Compounds
Tanimoto coefficients (Tc) are summarized in Table 4. According to the used descriptors, and the binary strings analysis (Tables S1 and S2), all the analyzed compounds have greater similarity to POD (Tc > 0.38 but < 0.50) than to VP-16 (Tc > 0.18 but < 0.38). Compounds 2 and 3 have a Tc of 0.50 indicating a 50% structural similarity with POD, in contrast, compound 3 has a Tc of 0.38 when compared to VP-16. POD and VP-16 have a Tc of 0.33 when compared between them.
Table 4.
Structural similarity coefficients (Tc). The compounds were compared against the controls, according to calculated coefficients.
3. Discussion
3.1. Cytotoxicity and Clonogenicity Assays, and the Selective-Index
The results comparing cytotoxicity and clonogenicity assays (Figure 2) showed that all tested compounds had dose-dependent activity, and both cytostatic and cytocidal activities against the breast cell lines tested treatment have been observed. Here, we have evaluated the capacity of lignans and controls to inhibit proliferation after 72 h of treatment, and determined if the duration and concentration were sufficient to stimulate cell death or senescence processes.
Podophyllotoxin (POD) is the most potent compound to inhibit cell growth of both tumor and non-tumor cells; furthermore, its effect is such that cells do not recover after treatment with this compound, even at the lowest concentration (0.08 µg/mL). VP-16 also showed an inhibitory effect on all cell lines; however, this effect was concentration-dependent. An effect on recovery was observed in the four breast cell lines when 0.08 µg/mL was used, suggesting that VP-16 may be acting as a cytostatic compound that inhibits cell growth when present at a medium to low concentration, but, when it is removed, would not affect the proliferation of the remaining cells.
Compounds 1 and 2 showed a concentration-dependent inhibitory effect. However, at concentrations of 10 and 2 µg/mL, the effect was so strong that it did not allow surviving cells to recover and proliferate (MCF-7 and MDA-MB-231). On the other hand, the concentration of 0.08 µg/mL had no effect on the inhibition of proliferation, since it was still at 100%; likewise, the recovery was very close to 200%, which corresponded to the value of proliferating cells in the presence of dimethyl sulfoxide (DMSO) alone (vehicle). Compound 3 had a higher effect since it inhibited cell proliferation at 10, 2, and 0.4 µg/mL, and cell recovery after treatment with this compound was not observed. Compound 4 is a substance with low water solubility and consequently, after treatment, it was found to have partially crystallized in the culture medium. However, low concentrations (0.4 and 0.08 µg/mL) of 4 had a dose-dependent cytostatic effect in the four cell lines tested; on the other hand, higher concentrations (2 and 10 µg/mL) promoted cytocidal activity. In all cases, inhibition of proliferation and deficit in recovering could result in cell death or cellular senescence, which did not involve protein degradation, as seen from the SRB assay quantification results. Compounds 3 and 4 showed an inverse percentage of recovery compared to the percentage of survival in the MCF-10A cell line (Figure 2w,x), suggesting that this could be the result of a cytotoxic effect that needed a longer time to display low protein levels.
Treatment with POD resulted in an interesting effect on cancer cell lines. MCF-10A cell treated with POD showed about 20% survival even at high concentrations (10, 2, 0.4, 0.08, and 0.016 µg/mL), and did not reach zero survival. Possible explanations for this may be because degradation of proteinaceous material had not yet been initiated, or that the cells were not subjected to cell death involving protein degradation. In the literature, POD has been considered a very toxic compound when administrated in vitro and in vivo, and that was observed in our results, as POD presented the highest potency compared to lignans or VP-16 (Table 2). Conversely, POD demonstrated non-selective activity in our selectivity analysis.
Treatment of MCF-7, MDA-MB-231, BT-549, and MCF-10A cells with VP-16 showed a direct dose-dependent effect. The MDA-MB-231 cell line was the most sensitive to VP-16 treatment, which was a non-selective compound according to analysis of selectivity.
Based on testing in cancer cell lines, compound 1 presented the lowest cancer cell proliferation inhibition activity. A high concentration of 1 was needed to obtain half inhibition (MCF-7 = 7.2 µM; MDA-MB-231 = 2.4 µM; and BT-549 = 1.2 µM). In contrast, a low concentration of compound 1 (0.13 µM) was needed to obtain half inhibition in MCF-10A cells.
Compound 2 is the most promising for continued research in BT-549 cells, due to its potency of 14.1 times stronger when compared with VP-16, but also for its selectivity index of about 28.1 in the same cell line. As shown in Figure 3a–c, the compound 2 activity spectrum could be considered similar to that of POD, specifically at the highest concentrations where survival did not reach zero. It is important to remember that BT-549 is a triple negative breast cancer (TNBC) cell line and represents one of the most aggressive and difficult to treat subtypes of human breast cancer.
Results from testing on MCF-7, MDA-MB-231, and MCF-10A cell lines showed that compound 3 was the most potent. However, it exhibited potency comparable to that of compound 2 (Figure 3c) in the BT-549 cell line. Compound 3 is a non-selective compound (SI = 4.4) in the BT-549 cell line. Likewise, compound 3 exhibited an activity spectrum similar to that of POD.
Finally, compound 4 presented high activity (IC50) in cancer cells (MCF-7 = 0.35 µM; MDA-MB-231 = 0.16 µM; and BT-549 = 0.46 µM). When compared with VP-16, compound 4 was 2.6-fold more potent in the BT-549 cell line, and showed an SI value of 7.6.
Cells are not all affected in similar ways by different compounds, and that was observed in our results, despite the fact that the chemical structures of our compounds were comparable. Cancer cell lines have a resistance to death. For example, the MCF-7 cell line obtained from the American Type Culture Collection (ATCC) does not express the caspase-3 protein [26], and therefore cannot activate apoptosis by that downstream pathway. However, MCF-7 could potentially activate other cell death mechanisms. The MDA-MB-231 and BT-549 cell lines have altered p53 activity, which in normal conditions is activated in response to DNA damage [27]. POD, as a tubulin polymerization inhibitor [11], leads to cellular arrest, but our results indicate that the cells could have rendered senescent due to cytotoxic treatment. Although senescent cells do not proliferate, they remain metabolically active [28].
In several different studies, acetylpodophyllotoxin (2) has been part of quantitative high-throughput screening (qHTS) experiments in the cell line DT40, where it was found to have inhibitory activity against the repairing human protein tyrosyl-DNA phosphodiesterase 1 (TDP1), which has been proposed as a new target for anticancer drug development. TDP1 is not an essential protein, but during treatment with a topoisomerase I inhibitor (e.g., camptothecin), TDP1 was a critical factor for cell survival [29]. In contrast, it has been found that 2 interferes in the internalization process in a concentration-response assay for anthrax lethal toxin in a qHTS test in ME-180 cells [30]. The 5′-demethoxydeoxypodophyllotoxin compound (3), also called morelensin, has been part of studies associated with in vivo anticancer drug screening against intraperitoneal inoculation of melanoma (B16 cell line) and leukemia (L1210 cell line). However, subcutaneous inoculation in a model of Lewis lung carcinoma did not show biological activities [31].
3.2 Similarity Analysis of Compounds
According to the coefficients obtained with the Tanimoto equation (Table 4), compounds 2 and 3 shared 50% structural similarity with POD, while compound 4 had the lowest similarity. However, all the structures contained the five rings (A, B, C, D, and E, and therefore exhibited the characteristic cytotoxic potential of the podophyllotoxin type lignans. It has been suggested that higher or lower potency derives from the structural changes present in the molecules, which are closely related to their conformer at their site of action. Martin and collaborators demonstrated in 2002 [32] that structurally similar compounds have similar biological activity, and that as the structural similarity increases, the biological similarity increases as well. Nevertheless, despite the fact that the resemblance of compounds and controls is very high, their mechanism of action are distinct. According to the literature, lignan compounds (podophyllotoxins) isolated from B. fagaroides var. fagaroides have the structural ability to act as tubulin inhibitors mainly because of the C-7 α configuration; the missing methoxy group in C-3′ (ring E) in compounds 1 and 3 does not change their in vitro activities. The C-6 methoxy addition in 1 and the acetyl group in C-7 in 2 are essential for the inhibition of the mitotic spindle. Furthermore, the double bond between C-7′ and C-8′ in compound 4 does not affect its anti-tubulin activity [10,16,33]. Unlike podophyllotoxins, epipodophyllotoxins like VP-16 do not affect microtubule assembly and do not arrest cells in mitosis, but rather exert their maximal effects later, in the S or G2 phase, and prevent cells from entering mitosis [34]. Beers and collaborators, in 1988 [35], concluded that a non-aromatized ring C is structurally required for the potent inhibitory activity against topoisomerase II, and that a free OH at C-4’ contributes to significant cytotoxicity.
Controls used were selected due to structural similarities among them (both lignan type compounds with A, B, C, D, and E rings). However, according to the Tanimoto coefficient (using our descriptors) they presented 33% similitude. POD and VP-16 have no usefulness in clinics against breast cancer. Nevertheless, we have continued research of compounds 1 to 4 owing to preliminary results against MCF-7 and their low solubility in water (lipophilicity). All these compounds could be used in breast cancer treatment, considering that among the many different cell types surrounding breast cancer cells, the most abundant are those comprising mammary adipose tissue [36].
Several of these compounds known as podophyllotoxins have been isolated from plants, and have been the starting point for subsequent structural changes. Nevertheless, only epipodophyllotoxins (etoposide and teniposide) have been used in the clinic as anticancer agents. However, treatment failure due to the increased resistance of tumor cells, and adverse effects caused by treatment, have prompted the search for therapeutic alternatives. Therefore, it is very important to find bioactive and selective compounds in order to ameliorate patient conditions, specifically during adverse effects associated to the chemotherapy, in addition to bioactive compounds that could prevent tumor cell proliferation.
4. Materials and Methods
The compounds (1–4) used in this study were isolated and fractionated by Laura Alvarez-Berber. Spectroscopic, spectrometric, and purity data of compounds 1, 2, and 4 have been previously reported by Alvarez-Berber and collaborators [23,24,37]. 5′-desmethoxydesoxypodophyllotoxin (3), also known as morelensin, was obtained by chromatographic methods by Álvarez-Berber and collaborators from the active fraction two (F-2) in their previously described work [23,37]. Compound 3 was obtained as a yellowish amorphous powder, mp 180–182 °C; −126.0° (c 0.014, CHCl3). 1H-RMN (400 MHz, CDCl3), δ ppm: 6.55 (s, 1H), 6.51 (s, 1H), 2.2 (dd, 1H, J = 8 Hz), 2.3 (dd, 1H, J = 7.2 Hz), 2.6 (m, 2H), 4.01 (m, 2H, J = 16 Hz), 4.14 (m, 2H, J = 15.8 Hz), 6.75 (s, 1H), 6.68 (d, 1H, J = 8 Hz), 6.5, (s 1H), 4.2 (d, 1H, J = 2 Hz), 2.60 (m, 2H), 5.92 (s, 2H), 3.81 (s, 3H), 3.85 (s, 3H). 13C-RMN (100 MHz CDCl3), δ ppm: 128.02 (C-1), 129.81 (C-2), 109.23 (C-3), 146.64 (C-4), 146.95 (C-5), 121.76 (C-6), 32.08 (C-7), 34.4 (C-8), 64.17 (C-9), 129.73 (C-1′), 111.07 (C-2′), 149.43 (C-3′), 148.03 (C-4′), 108.24 (C-5′), 111.96 (C-6′), 62.5 (C-7′), 33.91 (C-8′), 174.88 (C-9′), 105.258 (O-CH2-O), 55.95 (CH3O-C-3′), 55.95 (CH3O-C-4′). FABHRMS m/z 370 [M + H]+ (calcd for C21H20O6, [M + H]+ 368.38). These data match the physicochemical and spectroscopic data from the literature [38,39].
The MCF-7 cell line (HTB-22) was donated by Maria Luisa Villarreal-Ortega; cell lines MDA-MB-231 (ATCC: HTB-26), BT-549 (ATCC: HTB-122), and MCF-10A (ATCC: CRL-10317) were purchased from the American Type Culture Collection (ATCC, Manassas, VA, USA). Cancer cells cultures were grown in RPMI-1640 medium (Sigma-Aldrich, Saint Louis, MO, USA) supplemented with: 10% fetal bovine serum (Mexico origin, USDA approved) (Biowest, Nualillé, France); 2 g/L NaHCO3 (Sigma-Aldrich, cat. S8761), and incubated in a 5% CO2 incubator at 37 °C; MCF-10A were cultured in MEGM medium (Lonza BulletKit, Basel, Switzerland) using the above incubating conditions. Cells were thawed according to the standard methods and a cell bank was developed for each cell line. All experiments were performed using freshly thawed cells after three passages.
4.1. Cytotoxicity and Clonogenicity Assays
In vitro cytotoxicity and clonogenicity assays were performed using the sulforhodamine B (SRB) (MP Biomedicals, LLC) protein staining assay [40,41,42,43], using the cell lines described before. Briefly, cells were seeded in 384- or 96-well microtiter plates at a density of 1 × 10⁴ cells/mL, and placed in an incubator (5% CO2 and 37 °C) for 8 h. Afterward, different concentrations (0.08, 0.4, 2, and 10 µg/mL) of pure compounds and positive controls (POD and VP-16) were added in triplicate and incubated for 72 h.
Afterward, cells were fixed with cold trichloroacetic acid (30% in water) and stained with SRB (0.4% in a 1% of acetic acid solution). Cells were washed with 1% of acetic acid solution. Finally, the bound colorant was solubilized with Tris-base to obtain optical density (ODsample). The bound colorant was proportional with either total protein or cells amount. DMSO (final concentration of 0.5%) was used as vehicle and blank (ODblank). The total protein concentration in a single plate with cells at the beginning of the assay was considered as zero (ODzero). Microtiter plates were incubated for 72 h after which the total protein concentration was determined with Equation (1). This assay measures the respective absorbance at 490 nm using a spectrophotometer (Molecular Devices, SPECTRA max plus 384).
% survival/proliferation = (ODsample − ODzero)/(ODblank − ODzero) × 100
To determine the recovery percentage, an in vitro clonogenicity assay was performed. Cells were seeded, incubated, and treated in microtiter plates under the previously described conditions. After 72 h of treatment, the culture media of each well was removed, followed by two washes with phosphate buffered saline (PBS), before warm media supplemented with FBS was added to the cells and incubated for an additional 72 h in the same conditions. The percentage of proliferation was then determined using Equation (1).
We have defined percentage of recovery as the percentage of survival at 72 h of treatment added to the percentage of proliferation calculated 72 h post-treatment. This is outlined in Equation (2) and Figure 4:
% recovery = % survival (cytotoxicity assay) + % proliferation (clonogenicity assay)

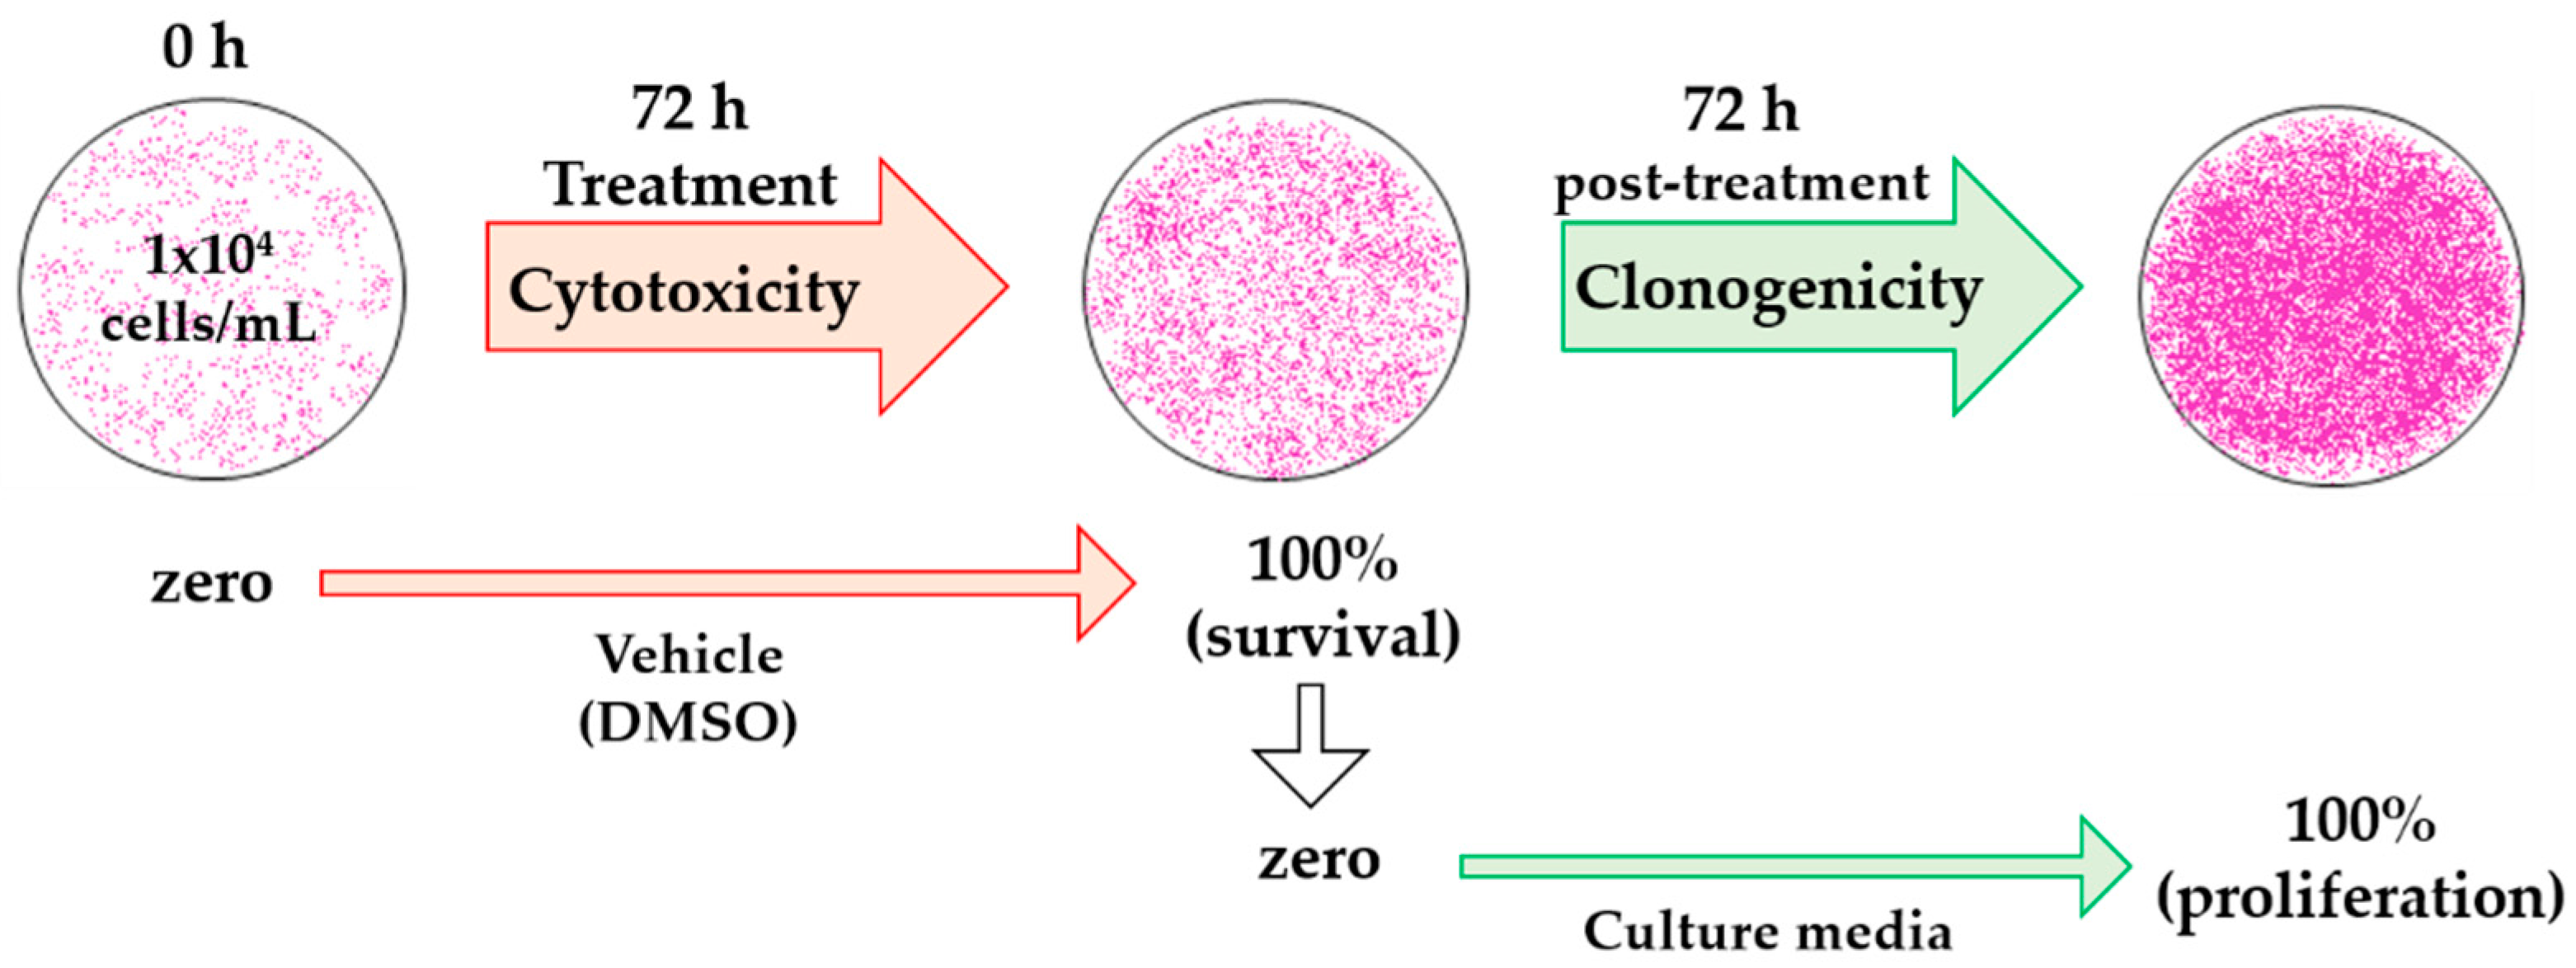
Figure 4.
Schematic diagram of the analysis with dimethyl sulfoxide (DMSO) treatment for cytotoxic and clonogenic determinations. The optical density (OD) of initially plated cells was measured as zero (ODzero) in the cytotoxicity assay, OD after 72 h of treatment with vehicle was considered as 100% cell survival (ODblank). In the clonogenic assay, OD at 100% cell survival was considered as zero, since these were the initial cells (ODzero), and OD at 72 h vehicle post-treatment was measured as 100% cell proliferation (ODblank).
The half inhibitory concentrations of lignans and controls were calculated from six concentrations (0.0032, 0.016, 0.08, 0.4, 2, and 10 µg/mL). Data analysis was performed using the relationship between the % of survival cells (total protein, Equation (1)) and the relative optical density vs. concentration as a logarithm expression. The IC50 values were reported as a mean of three independent experiments ± standard deviation (S.D.).
4.2. Selective-Index
To determine the cytotoxic selectivity of the substances tested, the selectivity index (SI) was calculated according to the following equation:
where a SI ≥ 10 was considered to belong to a selective compound, according to Quispe and collaborators [44] and Valdés-García and collaborators [45].
SI = IC50no cancer cells/IC50cancer cells
4.3. Similarity Analysis of Compounds
The similarity among compounds was obtained manually in an Excel sheet, employing the Tanimoto coefficient (Tc); we used fifteen structural fragments as molecular descriptors (available in the supplementary material); the Tc of each compound was analyzed and compared to that of POD and VP-16. The Tc ranges remain between 0.00 and 1.00, where 0.00 indicates no similarity and 1.00 indicates 100% similarity with the reference [46,47].
The equation for the Tanimoto coefficient is:
where a—Bits set in reference structure. b—Bits set in enquiry structure. c—Bits set in common between the reference structure and enquiry structure.
Tc = c/(a + b − c)
4.4. Statistical Analysis
To analyze the difference between the cytotoxic effect and recovery, the averages in the percentage of survival and percentage of recovery were compared with a one-way ANOVA and Bonferroni correction, using the statistical program GraphPad Prism, Version 5.00 (GraphPad Software, Inc., La Jolla, CA, USA).
Graphs were obtained using the relationship between the logarithm of the molar concentration vs. the percentage of survival; the curves were analyzed with a mathematical sigmoid model and the IC50 was determined by a sigmoidal fit with the function of Boltzmann. VP-16 results were analyzed by fitting a straight line and performing a linear regression to determine the IC50; both analyses were performed using OriginPro version 9.0.0 (OriginLab Corp., Northampton, MA, USA). For all statistical tests, significance was established at p < 0.05.
5. Conclusions
In conclusion, the lignans (1–4) evaluated in this study isolated from B. fagaroides var. fagaroides demonstrated cytotoxic (IC50 range = 0.011–7.22 µM) and cytocidal (≥0.08 µg/mL) activity against the breast cell lines MCF-7, MDA-MB-231, BT-549, and MCF-10A. Compounds 2 and 3 were more potent (14.1 and 7.6 respectively) than VP-16 in the BT-549 cell line.
The in vitro activity of acetylpodophyllotoxin (2) indicate a selective activity on BT-549 (SI = 28.17), a TNBC type of cell line, that represent one of the most aggressive and difficult to treat subtypes of human breast cancer. Hence, this preliminary result suggests that future experiments are indeed required.
Structural similarity of the compounds, according to Tc, suggested a greater similarity with podophyllotoxin structure than that of VP-16, suggesting a possible mechanism of action through the inhibition of the mitotic spindle.
Supplementary Materials
Supplementary materials can be accessed at: http://www.mdpi.com/1420-3049/21/8/1013/s1.
Acknowledgments
This study was partially funded by CONACyT (SEP-2004-CO2-47266/A-1) and PROMEP-Redes, and by the Secretaría de Investigación UAEM, through “apoyo para proyectos de investigación individuales 2013”. Omar A. Peña-Morán is grateful to CONACyT for a doctoral scholarship (237942).
Author Contributions
Omar A. Peña-Morán contributed to the design of the study, performed the experiments, and wrote the paper; María L. Villarreal-Ortega partially contributed with reagents and materials for cell culturing and to the cytotoxic assay; moreover, she donated the MCF-7 cell line; Laura Álvarez-Berber donated the compounds 1 to 4 and interpreted the results; Angélica Meneses-Acosta analyzed and interpreted the results; and Véronica Rodríguez-López conceived and designed the experiments, and contributed with regents and materials.
Conflicts of Interest
The authors declare no conflict of interest.
Abbreviations
The following abbreviations are used in this manuscript:
| SI | Selectivity index |
| WHO | World Health Organization |
| ER | Estrogen receptor |
| PgR | Progesterone receptor |
| Her2/neu | Human epidermal growth factor receptor 2 |
| IUPAC | International Union of Pure and Applied Chemistry |
| NMR | Nuclear Magnetic Resonance |
| FAB-MS | Fast Bombardment-mass spectrometry |
| DSMO | Dimethyl sulfoxide |
| SRB | Sulforhodamine B |
| qHTS | quantitative High Throughput Screening |
| TDP1 | Tyrosil-DNA-Phosphodiesterase 1 |
| NIH | National Institutes of Health |
| NCI | National Cancer Institute |
| PBS | Phosphate Buffered Saline |
| ANOVA | Analysis Of Variance |
| MEGM | Mammary Epithelial Cell Growth Medium |
| RPMI | Roswell Park Memorial Institute medium |
References
- Ferlay, J.; Soerjomataram, I.; Ervik, M.; Dikshit, R.; Eser, S.; Mathers, C.; Rebelo, M.; Parkin, D.M.; Forman, D.; Bray, F. Cancer incidence and mortality worldwide: IARC cancer base No. 11. IARC. 2013. Available online: http://globocan.iarc.fr (accessed on 7 April 2016).
- Advani, P.; Moreno-Aspitia, A. Current strategies for the prevention of breast cancer. Breast Cancer 2014, 6, 59–71. [Google Scholar] [PubMed]
- Tate, C.; Rhodes, L.; Segar, C.; Driver, J.; Pounder, N.; Burow, M.; Collins-Burow, B. Targeting triple-negative breast cancer cells with the histone deacetylase inhibitor panobinostat. Breast Cancer Res. 2012, 14. [Google Scholar] [CrossRef] [PubMed]
- Podwyssotzki, V. Pharmakologische studien über Podophyllum peltatum. Arch. Exp. Pathol. Pharmakol. 1880, 13, 29–52. [Google Scholar] [CrossRef]
- Xu, H.; Lv, M.; Tian, X. A review on hemisynthesis, biosynthesis, biological activities, mode of action, and structure-activity relationship of podophyllotoxins: 2003–2007. Curr. Med. Chem. 2009, 16, 327–349. [Google Scholar] [CrossRef] [PubMed]
- Gordaliza, M.; Castro, M.A.; Miguel del Corral, J.M.; San Feliciano, A. Antitumor properties of podophyllotoxin and related compounds. Curr. Pharm. Des. 2000, 6, 1811–1839. [Google Scholar] [CrossRef] [PubMed]
- Damayanthi, Y.; Lown, W. Podophyllotoxins: Current status and recent developments. Curr. Med. Chem. 1998, 5, 205–252. [Google Scholar] [PubMed]
- Stähelin, H.; von Wartburg, A. The chemical and biological route from podophyllotoxin glucoside to etoposide: Ninth Cain memorial award lecture. Cancer Res. 1991, 51, 5–15. [Google Scholar] [PubMed]
- Hande, K.R. Etoposide: Four decades of development of a topoisomerase II inhibitor. Eur. J. Cancer 1998, 34, 1514–1521. [Google Scholar] [CrossRef]
- Guerram, M.; Jiang, Z.-Z.; Zhang, L.-Y. Podophyllotoxin, a medicinal agent of plant origin: Past, present and future. Chin. J. Nat. Med. 2012, 10, 161–169. [Google Scholar] [CrossRef]
- Ravelli, R.; Gigant, B.; Curmi, A.; Jourdain, I.; Lachkar, S.; Sobel, A.; Knossow, M. Insight into tubulin regulation from a complex with colchicines and a stathmin-like domain. Nature 2004, 428, 198–202. [Google Scholar] [CrossRef] [PubMed]
- Tseng, C.J.; Wang, Y.J.; Liang, Y.C.; Jeng, J.H.; Lee, W.S.; Lin, J.K.; Chen, C.H.; Liu, I.C.; Ho, Y.S. Microtubule damaging agents induce apoptosis in HL 60 cells and G2/M cell cycle arrest in HT 29 cells. Toxicology 2002, 175, 123–142. [Google Scholar] [CrossRef]
- Wu, C.C.; Li, T.K.; Farh, L.; Lin, L.Y.; Lin, T.S.; Yu, Y.J.; Yen, T.J.; Chiang, C.W.; Chan, N.L. Structural basis of type II topoisomerase inhibition by the anticancer drug etoposide. Science 2011, 333, 459–462. [Google Scholar] [CrossRef] [PubMed]
- Montecucco, A.; Biamonti, G. Cellular response to etoposide treatment. Cancer Lett. 2007, 252, 9–18. [Google Scholar] [CrossRef] [PubMed]
- Canel, C.; Moraes, R.; Dayan, F.; Ferreira, D. Molecules of interest: Podophyllotoxin. Phytochemistry 2000, 54, 115–120. [Google Scholar] [CrossRef]
- Lv, M.; Xu, H. Recent advances in semisynthesis, biosynthesis, biological activities, mode of action, and structure-activity relationship of podophyllotoxins: An update (2008–2010). Mini Rev. Med. Chem. 2011, 11, 901–909. [Google Scholar] [CrossRef] [PubMed]
- Liu, Y.Q.; Tian, K.; Zhao, X.B.; Morris-Natschke, S.; Yang, L.; Nan, X.; Tian, X.; Lee, K.H. Recent progress on C-4 modified podophyllotoxin analogs as potent antitumor agents. Med. Res. Rev. 2015, 35. [Google Scholar] [CrossRef] [PubMed]
- Holliday, D.; Speirs, V. Choosing the right cell line for breast cancer research. Breast Cancer Res. 2011, 13. [Google Scholar] [CrossRef] [PubMed]
- Kennya, P.A.; Leea, G.Y.; Myersa, C.A.; Nevea, R.M.; Semeiksa, J.R.; Spellmana, P.T.; Lorenza, K.; Leea, E.H.; Barcellos-Hoff, M.H.; Petersenb, O.W.; et al. The morphologies of breast cancer cell lines in three-dimensional assays correlate with their profiles of gene expression. Mol. Oncol. 2007, 1, 84–96. [Google Scholar] [CrossRef] [PubMed]
- Bailey, C.K.; Mittal, M.K.; Misra, S.; Chaudhuri, G. High motility of triple-negative breast cancer cells is due to repression of plakoglobin gene by metastasis modulator protein SLUG. J. Biol. Chem. 2012, 287, 19472–19486. [Google Scholar] [CrossRef] [PubMed]
- Lehmann, B.D.; Bauer, J.A.; Chen, X.; Sanders, M.E.; Chakravarthy, A.B.; Shyr, Y.; Pietenpol, J.A. Identification of human triple-negative breast cancer subtypes and preclinical models for selection of targeted therapies. J. Clin. Investig. 2011, 121, 2750–2767. [Google Scholar] [CrossRef] [PubMed]
- Lacroix, M.; Leclercq, G. Relevance of breast cancer cell lines as models for breast tumours: An update. Breast Cancer Res. Treat 2004, 83, 249–249. [Google Scholar] [CrossRef] [PubMed]
- Rojas-Sepúlveda, A.M.; Mendieta-Serrano, M.; Antúnez Mojica, M.Y.; Salas-Vidal, E.; Marquina, S.; Villarreal, M.L.; Puebla, A.M.; Delgado, J.; Alvarez, L. Cytotoxic podophyllotoxin type-lignans from the steam bark of Bursera fagaroides var. fagaroides. Molecules 2012, 17, 9506–9519. [Google Scholar] [CrossRef] [PubMed]
- Antúnez, M.M.; León, A.; Rojas-Sepúlveda, M.; Marquina, S.; Mendieta-Serrano, M.A.; Salas-Vidal, E.; Villarreal, M.L.; Alvarez, L. Aryldihydronaphthalene-type lignans from Bursera fagaroides var. fagaroides and their antimitotic mechanism of action. RSC Adv. 2016, 6, 4950–4959. [Google Scholar]
- Liu, S.; Lin, Y.C. Transformation of MCF-10A human breast epithelial cells by zeranol and estradiol-17β. Breast J. 2004, 10, 514–521. [Google Scholar] [CrossRef] [PubMed]
- Jänicke, R.U. MCF-7 breast carcinoma cells do not express caspase-3. Breast Cancer Res. Treat 2009, 117, 219–222. [Google Scholar] [CrossRef] [PubMed]
- Bartek, J.; Iggo, R.; Gannon, J.; Lane, D.P. Genetic and immunochemical analysis of mutant p53 in human breast cancer cell lines. Oncogene 1990, 5, 893–899. [Google Scholar] [PubMed]
- Portugal, J.; Bataller, M.; Mansilla, S. Cell death pathways in response to antitumor therapy. Tumori 2009, 95, 409–421. [Google Scholar] [PubMed]
- NCBI, National Center for Biotechnology Information. PubChem BioAssay Database. 2013; AID=686981. Available online: https://pubchem.ncbi.nlm.nih.gov/bioassay/686981 (accessed on 30 March 2016). [Google Scholar]
- NCBI, National Center for Biotechnology Information. PubChem BioAssay Database. 2007; AID=942. Available online: https://pubchem.ncbi.nlm.nih.gov/bioassay/942 (accessed on 30 March 2016). [Google Scholar]
- NCBI, National Center for Biotechnology Information. PubChem BioAssay Database. 2007; AID=192, 256 and 270. Available online: https://pubchem.ncbi.nlm.nih.gov/bioassay/192, 256, and 270 (accessed on 30 March 2016). [Google Scholar]
- Martin, Y.; Kofron, J.; Traphagen, L. Do structurally similar molecules have similar biological activity? J. Med. Chem. 2002, 45, 4350–4358. [Google Scholar] [CrossRef] [PubMed]
- Magedov, I.; Evdokimov, N.; Karki, M.; Peretti, A.; Lima, D.; Frolova, L.; Reisenauer, M.; Romero, A.; Tongwa, P.; Fonari, A.; et al. Reengineered epipodophyllotoxin. Chem. Commun. 2012, 48, 10416–10418. [Google Scholar] [CrossRef] [PubMed]
- Chen, G.L.; Liu, Y.; Rowe, T.C.; Halligan, D.; Tewey, K.M.; Liu, L.F. Nonintercalative antitumor drugs interfere with the breakage-reunion reaction of mammalian DNA topoisomerase II. J. Biol. Chem. 1984, 259, 13560–13566. [Google Scholar] [PubMed]
- Beers, S.; Imakura, Y.; Dai, H.-J.; Li, D.-H.; Cheng, Y.-C.; Lee, K.-H. Antitumor agents, 99. Synthetic ring C aromatized podophyllotoxin analogues as potential inhibitors of human DNA topoisomerase II. J. Nat. Prod. 1988, 51, 901–905. [Google Scholar] [CrossRef] [PubMed]
- Wang, Y.-Y.; Lehuédé, C.; Laurent, V.; Dirat, B.; Dauvillier, S.; Bochet, L.; Le Gonidec, S.; Escourrou, G.; Valet, P.; Muller, C. Adipose tissue and breast epithelial cells: A dangerous dynamic duo in breast cancer. Cancer Lett. 2012, 324, 142–151. [Google Scholar] [CrossRef] [PubMed]
- Rojas-Sepúlveda, A.M. Búsqueda de metabolitos con actividad citotóxica y antitumoral en Bursera fagaroides var. fagaroides y Bursera morelensis, y evaluación de su efecto como inhibidor de ciclo celular en el modelo de pez cebra. Ph.D. Thesis, Centro de Investigaciones Químicas. Universidad Autónoma del Estado de Morelos, Cuernavaca, Morelos, Mexico, 2012. [Google Scholar]
- Da Silva, R.; Gomes, H.V.C.; Albuquerque, S.; Kenupp, B.J.; Andrade, S.M.L.; Marcos, D.P.; da Silva, G.V.J. Complete assignment of 1H- and 13C-NMR data for three aryltretalin lignan lactones. Magn. Reson. Chem. 2004, 42, 985–989. [Google Scholar] [CrossRef] [PubMed]
- Jolad, S.D.; Wiedhopf, R.M.; Cole, J.R. Cytotoxic agents from Bursera morelensis (Burseraceae): Deoxypodophyllotoxin and a new lignan, 5′-desmethoxydeoxypodophyllotoxin. J. Pharm. Sci. 1977, 66, 892–893. [Google Scholar] [CrossRef] [PubMed]
- Geran, R.I.; Greenberg, H.M.; McDonald, M.; Abbott, B.J. Protocols for Screening Chemical Agents and Natural Products against Animal Tumors and Other Biological Systems. Cancer Chemother. Rep. 1972, 3, 51–61. [Google Scholar]
- Shekan, P.; Storeng, R.; Scudiero, D.; Monks, A.; McMahon, J.; Vistica, D.; Warren, J.; Bokesch, H.; Kenney, S.; Boyd, M. New colorimetric cytotoxicity assay for anticancer-drug screening. J. Natl. Cancer Inst. 1990, 82, 1107–1112. [Google Scholar]
- Houghton, P.J.; Morton, C.L.; Tucker, C.; Payne, D.; Favours, E.; Cole, C.; Gorlick, R.; Kolb, E.A.; Zhang, W.; Lock, R.; et al. The pediatric preclinical testing program: Description of models and early testing results. Pediatr Blood Cancer 2007, 49, 928–940. [Google Scholar] [CrossRef] [PubMed]
- Suffness, M.; Pezzuto, J.M. Methods in Plant Biochemistry; Academic Press: San Diego, CA, USA, 1991; pp. 71–134. [Google Scholar]
- Quispe, A.; Zavala, C.; Rojas, J.; Posso, M.; Vaisberg, A. Efecto citotóxico selectivo in vitro de murcin H (acetogenina de Annona muricata) en cultivos celulares de cáncer de pulmón. Rev. Peru. Med. Exp. Salud Pública 2006, 23, 265–269. [Google Scholar]
- Valdés-García, S.; Del barrio-Alonso, G.; Gutiérrez-Gaitén, Y.; Morier-Díaz, L. Evaluación preliminar de la actividad antiviral del extracto acuoso de Phyllathus orbicularis frente al virus VHS-1. Rev. Cuba. Med. Trop. 2003, 55, 169–173. [Google Scholar]
- Megantara, S.; Iwo, M.; Levita, J.; Ibrahim, S. Determination of ligand position in aspartic proteases by correlating tanimoto coefficient and binding affinity with root mean square deviation. J. Appl. Pharm. Sci. 2016, 6, 125–129. [Google Scholar] [CrossRef]
- Radifar, M.; Yuniarti, N.; Istyastono, P. PyPLIF: Python-based protein-ligand interaction fingerprinting. Bioinformation 2013, 9, 325–328. [Google Scholar] [CrossRef] [PubMed]
- Sample Availability: Samples of the compounds 1–4 are available from the authors.

© 2016 by the authors. Licensee MDPI, Basel, Switzerland. This article is an open access article distributed under the terms and conditions of the Creative Commons Attribution (CC-BY) license ( http://creativecommons.org/licenses/by/4.0/).