Abstract
DNA repair enzyme O6-methylguanine-DNA methyltransferase (MGMT), which plays an important role in inducing drug resistance against alkylating agents that modify the O6 position of guanine in DNA, is an attractive target for anti-tumor chemotherapy. A series of MGMT inhibitors have been synthesized over the past decades to improve the chemotherapeutic effects of O6-alkylating agents. In the present study, we performed a three-dimensional quantitative structure activity relationship (3D-QSAR) study on 97 guanine derivatives as MGMT inhibitors using comparative molecular field analysis (CoMFA) and comparative molecular similarity indices analysis (CoMSIA) methods. Three different alignment methods (ligand-based, DFT optimization-based and docking-based alignment) were employed to develop reliable 3D-QSAR models. Statistical parameters derived from the models using the above three alignment methods showed that the ligand-based CoMFA (Qcv2 = 0.672 and Rncv2 = 0.997) and CoMSIA (Qcv2 = 0.703 and Rncv2 = 0.946) models were better than the other two alignment methods-based CoMFA and CoMSIA models. The two ligand-based models were further confirmed by an external test-set validation and a Y-randomization examination. The ligand-based CoMFA model (Qext2 = 0.691, Rpred2 = 0.738 and slope k = 0.91) was observed with acceptable external test-set validation values rather than the CoMSIA model (Qext2 = 0.307, Rpred2 = 0.4 and slope k = 0.719). Docking studies were carried out to predict the binding modes of the inhibitors with MGMT. The results indicated that the obtained binding interactions were consistent with the 3D contour maps. Overall, the combined results of the 3D-QSAR and the docking obtained in this study provide an insight into the understanding of the interactions between guanine derivatives and MGMT protein, which will assist in designing novel MGMT inhibitors with desired activity.
1. Introduction
A number of alkylating agents, such as methylating agents (e.g., temozolomide, dacarbazine and procarbazine) and chloroethylating agents (e.g., carmustine, nimustine, lomustine and laromustine), are frequently used in the clinical treatment of malignant tumors [1,2,3]. These agents attack the O6 position of guanine in DNA and result in forming a series of O6-alkylguanine lesions, which are believed to be crucial DNA adducts related to the anticancer activity of chemotherapies. For example, O6-methylguanine (O6-MG) lesion is produced by temozolomide. O6-chloroethylguanine is generated by chloroethylnitrosoureas and subsequently rearranges to N1,O6-ethanoguanine, which further undergoes the second alkylation on the complementary cytosine to form a DNA interstrand crosslink [2,3,4,5]. The cytotoxic effects of anti-tumor alkylating agents are primarily derived from these DNA lesions [5,6,7]. However, a unique DNA repair enzyme, O6-methylguanine-DNA methyltransferase (MGMT), also called O6-alkylguanine-DNA alkyltransferase (AGT), can repair the O6-lesion of guanine by transferring the O6-alkyl groups to the active center at the Cys145 residue and restore normal DNA. The repair was demonstrated to result in drug resistance in tumor cells [3,4]. After accepting the lesion groups, MGMT is rapidly degraded by a ubiquitination-dependent proteolysis [8,9,10]. One MGMT molecule can only repair one lesion, so it is considered as a “suicide enzyme”. Previous studies indicated that there was an inverse relationship between the levels of MGMT expression and the sensitivity to O6-guanine alkylating agents [1,11,12,13,14]. The increasing of MGMT level correlates well with the enhancement of tumor resistance to these alkylating agents [4,12].
Since high expression of MGMT can cause strong resistance to the guanine O6-alkylating agents, a series of MGMT inhibitors were synthesized and were used as adjuvants to improve the chemotherapeutic effects [13,14,15,16,17,18,19,20,21,22,23,24,25,26]. Although numerous inhibitors have been described, only two compounds, O6-benzylguanine (O6-BG) and O6-(4-bromothenyl)guanine (O6-4-BTG), entered clinical trials [3,4,27,28,29]. Unfortunately, phase II clinical trials of the two inhibitors in combination with guanine O6-alkylating agents exhibited only limited response even though the nontoxicity of the inhibitors to the host was confirmed in early trials [27,28,29,30]. The severe myelosuppression induced by the two MGMT inhibitors limits the dose of alkylating agents given in the combination treatments, which finally leads to the failure of the chemotherapy [4]. Therefore, it is necessary to develop novel MGMT inhibitors with high efficacy and selectivity to cancer cells.
Three-dimensional quantitative structure activity relationship (3D-QSAR) describes the linkage between the structural features and the bioactivities of compounds and also points to suggestions for designing novel inhibitors of enzymes [31,32,33,34]. Comparative molecular field analysis (CoMFA) has become one of the most widely used 3D-QSAR methods in rational drug design since it was first introduced by Cramer et al. in 1988 [35]. Comparative molecular similarity indices analysis (CoMSIA) is another widely used 3D-QSAR method, which describes the similarities and differences between ligands and correlates them with changes in the binding affinity by involving steric, electrostatic, hydrophobic and hydrogen-bond donor and receptor fields [36,37,38,39].
In this study, we built 3D-QSAR models for a series of guanine derivatives as MGMT inhibitors by CoMFA and CoMSIA analysis to reveal the relationship between the structural features of the substrates and the MGMT-inhibitory activity. A docking study was performed to gain insights into the binding interactions of the inhibitors and MGMT protein. This study will not only assist in the understanding of the mechanism of MGMT inhibition by guanine derivatives, but also provide useful information for designing novel MGMT inhibitors with desired activity.
2. Results and Discussion
2.1. Model Validation
The predictability and reliability of a 3D-QSAR model can be evaluated by checking several statistical parameters, including cross-validated correlation coefficient (Qcv2), non-cross-validated correlation coefficient (Rncv2), standard error of estimate (SEE) and F test value. For the chiral molecules in the training set, the R-isomers were used to construct the QSAR models. The QSAR models established using the S-isomers gave similar results (see Figure S1, Tables S1 and S2 in the Supplementary Materials). Table 1 lists the statistical parameters of the 3D-QSAR models constructed in this study. For the CoMFA analysis, the ligand-based model yielded a Qcv2 of 0.672, optimal number of principal components (ONC) of 8, Rncv2 of 0.997, SEE of 0.089 and F value of 1096.142. However, the other two CoMFA models derived from DFT optimization-based and docking-based alignments gave the Qcv2 and Rncv2 values below the standard of an eligible model.

Table 1.
Statistical parameters of the CoMFA and CoMSIA models derived from three alignment methods.
Since the five CoMSIA descriptor fields—namely steric (S), electrostatic (E), hydrophobic (H), hydrogen bond donor (D) and acceptor (A)—are not totally independent from each other, different combinations of the five fields were used to obtain the best model [34,40,41]. The results of the 31 possible field combinations were shown in Figure 1 and the Qcv2 value was used to assess the statistical qualities of these 3D-QSAR models. The SEDA, SD and SEH field combinations with the highest Qcv2 values were selected for generating the best CoMSIA models using ligand-based, DFT optimization-based and docking-based alignment methods, respectively. Similar to the CoMFA model, the ligand-based CoMSIA model generated from the SEDA field combination gave a Qcv2 value of 0.703 and Rncv2 value of 0.946 that satisfies the statistical criterion of Qcv2 > 0.5 and Rncv2 > 0.9. The CoMSIA models derived neither from the DFT optimization-based alignment nor from the docking-based alignment meet the statistical criterion (Table 1). Therefore, only the CoMFA and CoMSIA models obtained from the ligand-based alignment were employed for further validation.
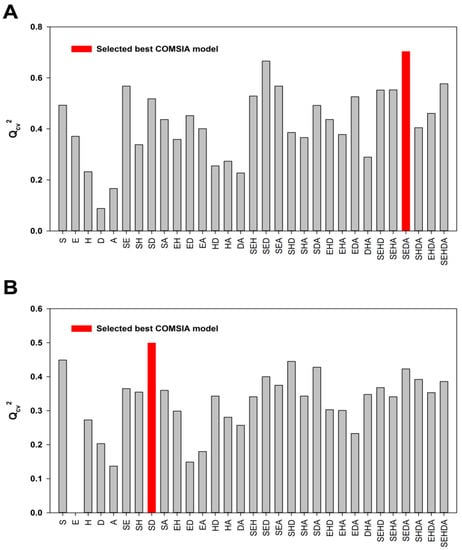
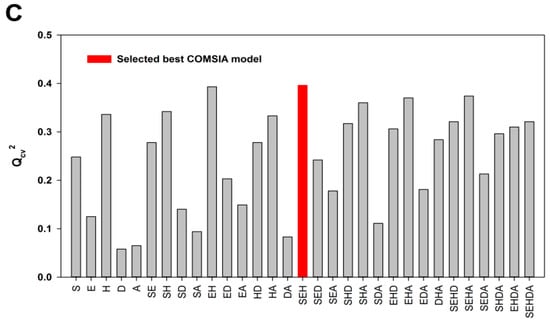
Figure 1.
The statistical results of the possible field combinations. (A) The Qcv2 values of the ligand-based CoMSIA models; (B) The Qcv2 values of the DFT optimization-based CoMSIA models; (C) The Qcv2 values of the docking-based CoMSIA models.
2.2. External Test Set Validation and Y-Randomization Test
Although the CoMFA and CoMSIA models derived from ligand-based alignment were both observed with Qcv2 > 0.5 and Rncv2 > 0.9, a 3D-QSAR model with acceptable predictability also requires to meet other statistical criterions, including external validation correlation coefficient (Qext2 > 0.5), predictive correlation coefficient (Rpred2 > 0.6) and slope k (0.85 ≤ k ≤ 1.15) [42]. So, a test set containing 25 compounds independent from the training set was used for an external validation to confirm the predictability of the obtained CoMFA and CoMSIA models. Table 2 lists the predicted pIC50 values of the training and the test sets, as well as the residues between the experimental and predicted pIC50 values. The linear correlations between the experimental and predicted pIC50 values for the CoMFA and CoMSIA models were shown in Figure 2A,B, respectively. The Qext2, Rpred2 and k values are 0.691, 0.738 and 0.91 for the CoMFA model, respectively; and are 0.307, 0.4 and 0.719 for the CoMSIA model, respectively. A few outliers, such as compounds 82 and 91 in the test set, were observed with comparatively high residues between the experimental and the predicted activities. There are two possible reasons that may account for the failure of the models in outliers. Firstly, limited structural information on the C8 position of guanine (compound 82) can be obtained from the 3D-QSAR models. Secondly, there is a unique structural difference of R1 group in compound 91 when compared to the other guanine derivatives in the training set. The results of the external validation using the test set suggested that the CoMFA model was more satisfying than the CoMSIA model derived from ligand-based alignment method.
Table 2.
Comparison of the experimental pIC50 values, predicted pIC50 values and residual values of the 97 compounds for CoMFA and CoMSIA models derived from the ligand-based alignment method.
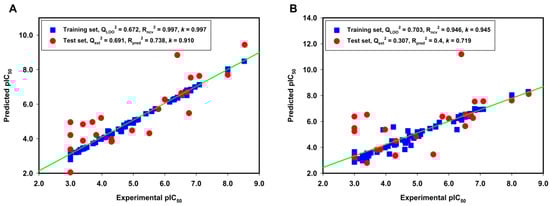
Figure 2.
The linear correlation between the experimental and predicted pIC50 values for the training set (blue square) and the test set (red circle) based on (A) the CoMFA model and (B) the CoMSIA model derived from the ligand-based alignment method.
A Y-randomization test was also performed to evaluate the possibility of the chance correlation in the CoMFA model [43]. The dependent variables (pIC50 values) were randomly shuffled and new QSAR models were constructed using the original independent variable matrix. If the QSAR models obtained by shuffling the pIC50 values gave lower Qcv2 values than the original model, we considered that the CoMFA model was not affected by any chance correlation. As shown in Table 3, none of the Qcv2 values was higher than 0.3 for 15 tests, which further indicated that the resulting CoMFA model derived from the ligand-based alignment was robust.
Table 3.
Statistical parameters of the CoMFA models derived from Y-randomization tests.
2.3. 3D Contour Map Analysis
The information visualization by 3D contour maps is an attractive feature of 3D-QSAR modeling, which can provide information about how to increase or decrease the biological activity of the investigated compounds. Different colors in 3D contour maps help to understand the relationship between the diversified steric and electrostatic field related to the activity of the compounds. As shown in Table 1, the steric and electrostatic fields account for 55.3% and 44.7% of the field contribution, respectively. Figure 3 displays the steric and electrostatic contour maps of the resulting CoMFA model. The steric field was presented in green and yellow colors, and the electrostatic field was shown in blue and red colors.
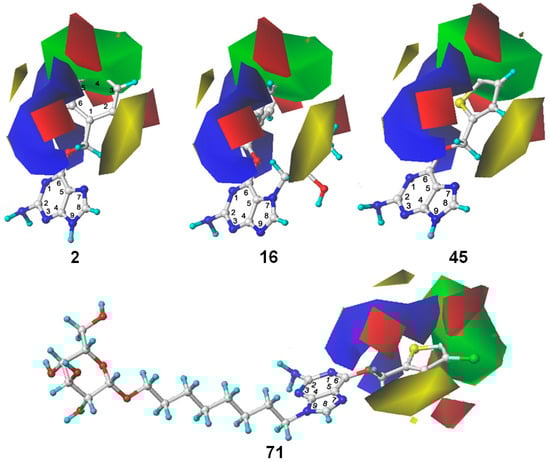
Figure 3.
The CoMFA STDEV*COEFF contour maps for compounds 2, 16, 45 and 71. The green and yellow region represent the sterically favorable and unfavorable properties, respectively. The blue and red region represent the electropositive and electronegative favorable properties, respectively.
For the steric field, the green and yellow regions represent the sterically favorable and unfavorable properties, respectively. A yellow region was observed around the N7 position of guanine, which suggested that the bulky substitution in this region was unfavorable for the inhibitory activity to MGMT. This explains the relatively low inhibitory activities of compounds 14–16 and 30 with -CH2COOCH2CH3, -CH2CONH2, -CH2CH(OH)CH2CH3 and methyl groups, respectively, at the N7 position when compared to compound 2 without any N7-substituent group. Another yellow region near the ortho-position of the benzene ring of compound 2 suggested that bulky substitution in this region also contributed to the decrease of the inhibitory activity. On the other hand, a big green polyhedron-like region was found around the C3´-C5´ positions of the benzene ring. This could be the reason why compounds 2–4, 19–23, 40 and 41 exhibited higher activities than compounds 42, 43 and 44 with substituent groups on the ortho-position of benzene ring. Furthermore, the higher activities of compounds 2–4, 19–23, 40 and 41 than compounds 1, 8 and 32 are also in accordance with this conclusion.
For the electrostatic field, the blue and red regions represent the electropositivity and electronegativity favorable properties, respectively. The major blue region was found at the left wing as shown in the reference molecules, which indicated that electropositive substituent groups in this region were favorable for high inhibitory activity. For example, compound 2 was observed with higher activity than compound 31 bearing an electronegative nitrogen atom in the pyridine group. Four red regions were located near the plane of the benzene ring of compound 2 and the thenyl ring of compound 45. This explains the reason why most benzyl- or thenyl-substituted guanine derivatives were more potent than alkyl-substituted guanine derivatives. Moreover, it can be seen from the contour maps that the C8 and N9 position of guanine is relatively well tolerated.
2.4. Docking Analysis
Molecular docking studies were performed to predict the binding mode of the inhibitors with MGMT protein using the GOLD Suite 5.2 software (Cambridge Structural Database System). The crystal structure of MGMT protein with PDB entry of 1QNT (1.9 Å resolution) was selected for the docking studies [44]. We conducted the docking for all 97 compounds including the training and the test sets. The pose of each compound was selected according to the fitness score and the orientation. The binding affinities of the compounds with the receptor were presented by the docking scores [45]. The detailed docking results are listed in Table 4. Most of the compounds, which were docked into the active pocket of MGMT protein, presented a similar conformation as the ligand in the crystal structure of MGMT (PDB entry: 1T38) and agreed with the repairing mechanism of MGMT [46].
Table 4.
The docking results of the 97 compounds in the training and test sets.
Figure 4 shows the optimal docked conformations of several representative molecules (1, 2, 14, 15, 40, 41, 45, 60 and 72) with MGMT protein. Three hydrogen bonds were formed between compound 1 (O6-MG) and the receptor, while four hydrogen bonds were formed between compound 2 (O6-BG) and the receptor. The resulting pose of 14 was far away from the active pocket of the receptor due to the steric effect. Although 15 can be docked into the active pocket, there is a strong steric clash between the N7-substituent group and residues Arg135 and Ser159. All N7-substituted guanine derivatives exhibited low binding affinities with the receptor, which accounted for the low inhibitory activities of compounds 14–16, 30 and 75. This is consistent with the 3D contour map analysis that a sterically unfavorable region was observed around the N7 position of guanine. By comparing compounds 2, 40, 41 and 45, we found that there were four residues (Tyr114, Cys145, Val148 and Ser159) in the active pocket involved in the hydrogen-bonding formation of 2, 40 and 45 with the receptor, whereas an additional hydrogen bond was formed between the –NH2 group of 41 and the oxygen atom of Asn137. Combined with the binding affinities, the results explain why the inhibitory activity follows the order of 45 > 41 > 40 > 2. The higher potency of 40 and 41 than 2 was also supported by the 3D contour map where a big green polyhedron-like region was found around the C3´-C5´ positions of the benzene ring. It is worth noting that compound 60 displays an opposite orientation compared to the pose of the ligand in the crystal structure of MGMT (PDB entry: 1T38) [46], which leads to the loss of inhibitory activity. Compound 72 monosaccharide-conjugated on the N9 position forms eight hydrogen bonds with the Tyr114, Gln115, Cys145, Val148, Ser151 and Ser159 residues of MGMT protein, which results in the highly potent activity of 72 (pIC50 = 8.00). Figure S3 in the Supplementary Materials displays the ligand-binding surface of MGMT protein with the compounds described above, which helps to further visualize the docking results.
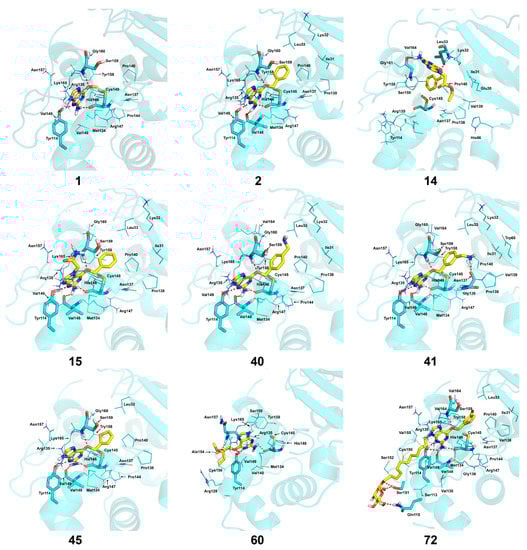
Figure 4.
The optimal docking conformations of the representative molecules with MGMT protein (PDB entry: 1QNT). The protein is displayed as a cartoon model in cyan color. The ligands are depicted as stick models with yellow representing carbon atoms. The hydrogen bonds between ligands and receptor are represented by red dotted lines and the residues forming hydrogen bonds are presented in stick model with cyan for carbon atoms. The remaining residues in the active pocket are displayed as line models with cyan representing carbon atom. Nonpolar hydrogens were hidden. All figures were generated using PyMOL software (Educational version; www.pymol.org; DeLano Scientific, San Carlos, CA, USA).
Besides, the formation of hydrogen bonds suggests that the -NH2 group on the C2 position of guanine is essential for high inhibitory activity, which explains the low activities of compounds 13, 29, 37–39, 83, 84, 96 and 97 when compared to compound 2. Similarly, the hydrogen bond formed between the O6 atom of guanine and Ser159 accounts for the higher inhibitory activity of compound 2 than compounds 17 and 18 with the O6 atom replaced by sulphur. Furthermore, a narrow space was found between the C2 or C8 atom of guanine and the active pocket of the receptor, suggesting large substituent groups not allowed in these sites. On the contrary, a wide entrance near the N9 position of guanine indicates that a bulky substituent group in this site is tolerated. Docking studies identified the key residues in the active pocket of the receptor such as Tyr114, Gln115, Arg135, Asn137, Cys145, Val148, Ser151, Tyr158 and Ser159. These residues are main contributors to the interactions between the inhibitors and MGMT protein.
3. Experimental Section
3.1. Data Set
A set of 97 guanine derivatives with different inhibitory activity against MGMT, which were chosen from literatures [17,18,19,22,23,25,26], were used as a data set for molecular modeling. The activities of all compounds were tested in vitro under the same experimental conditions in terms of half maximal inhibitory concentration (IC50) values. All original IC50 values were converted into the corresponding pIC50 values (pIC50 = −logIC50) and were used as the dependent variables in 3D-QSAR analysis. The pIC50 values for the data set range from 3.00 to 8.54, suggesting an adequate data collection for the 3D-QSAR study. The chemical structures and the pIC50 values for all compounds are listed in Table 5. Figure 5 dispalys the general structures for these compounds. The 97 compounds were randomly divided into two subsets, a training set including 72 compounds used for constructing the 3D-QSAR models and a test set including 25 compounds used for evaluating the external predictive ability of the models. Since the chirality of molecules 12, 16, 26–28, 80 and 87 are unknown, we performed two parallel QSAR studies including the R-isomers and the S-isomers.
Table 5.
Chemical structures and experimental activity values (pIC50) of the MGMT inhibitors.
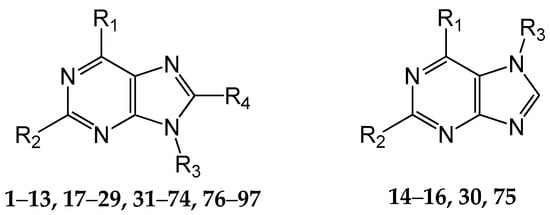
Figure 5.
The general structures of all compounds used in this study.
3.2. Molecular Modeling and Alignment
The 3D structures of all molecules in the data set were constructed using SYBYL 8.0 molecular modeling package (Tripos Inc., St. Louis, MO, USA). Energy minimizations were performed by Tripos force field [47] with Powell conjugate gradient descent method [48] and the partial atomic charges were added using Gasteiger-Huckel method [49]. The energy minimization was terminated when the energy gradient convergence criterion of 0.001 kcal/mol Å was reached and the maximum number of optimization steps was set to 1000.
The quality of 3D-QSAR models is usually sensitive to a specific alignment method [41,50]. In this study, three different alignment methods were employed to construct the 3D-QSAR models. Firstly, a ligand-based alignment (superimposition I) was used for the 3D-QSAR analysis. We chose compound 45 with the highest activity as a template to fit the remaining compounds of the training and test set using the “align database” function. The common substructure of the template molecule and the other molecules is depicted in Figure 6A with blue color. The resulting alignment conformations are shown in Figure 6B. Secondly, a DFT optimization-based alignment (superimposition II) was employed by performing geometry optimization on all molecules using the density functional theory (DFT) method with the B3LYP/6-31G+(d,p) basis set (GAUSSIAN-09 program package, Gaussian Inc., Wallingford, CT, USA) [51]. The 3D structures of all molecules were added with Gasteiger-Huckel partial atomic charges using SYBYL package and the alignment procedure is the same to superimposition I. The obtained alignment conformations are shown in Figure 6C. Thirdly, a docking-based alignment (superimposition III) was performed and the obtained alignment conformations were shown in Figure 6D. The active conformation of each compound was obtained from molecular docking by considering binding orientation and scoring. The selected conformation was added with Gasteiger-Huckel partial atomic charges followed by the alignment as described in superimposition I and II. The conformations of the inhibitors obtained from the three alignment methods are similar and agree with the repairing mechanism mediated by MGMT [5,44,46].
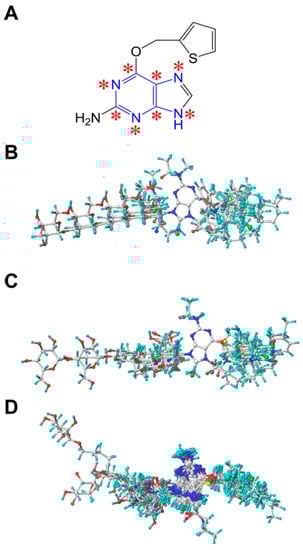
Figure 6.
(A) Structure of the template molecule (compound 45) used for the alignment. The common substructure atoms are marked with asterisks. Alignments of all molecules using (B) ligand-based, (C) DFT optimization-based and (D) docking-based alignment method.
3.3. 3D-QSAR Studies
The 3D-QSAR models were constructed using CoMFA and CoMSIA methods. Steric and electrostatic potential fields for CoMFA were calculated at each lattice intersection of a regularly spaced grid of 2.0 Å. An sp3 hybridized carbon atom with a charge of +1.0 was used as the probe atom to calculate the CoMFA steric and electrostatic fields. The cut-off value was set to 30 kcal/mol. For CoMSIA analysis, in addition to steric and electrostatic fields, hydrophobic, hydrogen bond donor and acceptor fields were also considered. The descriptors of CoMSIA were calculated using the same lattice box as that employed in CoMFA calculations. The similarity indices of all the five fields (steric, electrostatic, hydrophobic, hydrogen bond donor and acceptor) were calculated using a sp3 hybridized carbon atom with a radius of 1.0 Å and +1.0 charge, +1.0 hydrophobicity, +1.0 hydrogen bond donor and +1.0 hydrogen bond acceptor properties. The attenuation factor was set to the default value of 0.3. A Gaussian function was employed to calculate the distance between the probe atom and each atom of the molecule.
A partial least squares (PLS) regression [52] was used to obtain statistically significant 3D-QSAR models. For PLS analysis, the CoMFA and CoMSIA descriptors were used as the independent variables, and the pIC50 values were used as the dependent variables. Leave-one-out (LOO) method was used to perform a cross-validation analysis, in which one molecule is removed from the data set and its activity is predicted by the model derived from the remaining molecules of the data set. Then, the cross-validated correlation coefficient (Qcv2) and the optimal number of principal components (ONC) were determined. After getting the ONC, a non-cross-validation analysis was performed to obtain the conventional correlation coefficient (Rncv2), standard error of estimate (SEE) and F value. Finally, the 3D-QSAR models were generated.
The test set of the compounds, which are not included in model generation, were used to evaluate the robustness and statistical significance of the 3D-QSAR models [42,43,53]. The pIC50 values of the test set were predicted based on the constructed models and then the predictive correlation coefficient (Rpred2) was calculated using Formula (1) [38,42].
where SD is the sum of squared deviations between the activities of the test set molecules and the mean activity of the training set molecules. Predicted residual sum of squares (PRESS) is the sum of squared deviation between the predicted and the actual activity of each molecule in test set.
Rpred2 = (SD-PRESS)/SD
3.4. Molecular Docking
Molecular docking study was carried out using GOLD Suite 5.2 software. We selected the crystal structure of MGMT with PDB entry of 1QNT (1.90 Å resolution) [44] as a receptor for docking study. In order to validate the docking approach, self-docking was conducted using the X-ray crystal structure of human MGMT with PDB entry of 1T38 (3.2 Å resolution), which is a protein-ligand complex with MGMT bounding to DNA containing O6-MG. In the crystal structure of 1T38, the Cys145 residue was experimentally mutated to serine to avoid the covalent transferring of the methyl group on O6-MG [46]. For the self-docking, the protein-DNA complex model of 1T38 was simplified by removing the DNA double strands except for the O6-MG substrate and deleting the solvent molecules in the X-ray crystal. Hydrogen atoms were added to the protein and Gold score was chosen as a scoring function. The docking was performed by the “cytochrome P450 mode” in GOLD software and the active site was located at the Cys145 residue. The root mean square deviation (RMSD) of the docked pose was 0.0882 Å when compared to the pose in the crystal complex (see Figure S2 in the Supplementary Materials), which suggested that the docking conformation produced by GOLD closely resembled the crystal structure. Thus, GOLD is suitable for performing the docking of guanine derivatives to MGMT protein.
4. Conclusions
A 3D-QSAR study was performed based on a series of guanine derivatives as MGMT inhibitors using CoMFA and CoMSIA methods. Three different alignment methods were used to overlap the molecules. The optimal 3D-QSAR model was derived from CoMFA with the ligand-based alignment. The 3D contour maps provide crucial information of the steric and electrostatic field for the design of novel guanine derivatives with high MGMT-inhibitory activity. Molecular docking study was performed to explore the binding mode between the guanine derivatives and MGMT protein. The docking results suggest that the key residues in the active pocket of the receptor, including Tyr114, Gln115, Arg135, Asn137, Cys145, Val148, Ser151, Tyr158 and Ser159, play important roles in the interactions of the ligands and receptor. The oxygen atom at the C6 position and the -NH2 group at the C2 position of guanine are essential for high MGMT-inhibitory activity. The substituent groups on the N7 position of guanine are unfavorable for the inhibitory activity due to the steric effect. A substituent group with limited size is allowed for the C8 position of guanine, while the N9 potion of guanine is highly tolerated. The combined analysis of the 3D contour maps and the docking results provide valuable information for the further understanding of the structure–activity relationship of guanine derivatives as MGMT inhibitors, which will assist in designing novel MGMT inhibitors with high activity.
Supplementary Materials
Supplementary materials can be accessed at: http://www.mdpi.com/1420-3049/21/7/823/s1.
Acknowledgments
This study was supported by grants from the National Natural Science Foundation of China (No. 21277001), Natural Science Foundation of Beijing (No. 7162015), Beijing Municipal Education Commission Science and Technology Project (No. PXM2015_014204_500175), and the Jinghua Talent Project of Beijing University of Technology (015000514115001).
Author Contributions
Guohui Sun, Tengjiao Fan and Lijiao Zhao conceived and designed the experiments; Guohui Sun and Tengjiao Fan performed the experiments and analyzed the data; Na Zhang and Rugang Zhong contributed analysis tools and helped in the “Results and Discussion Section”; Guohui Sun, Tengjiao Fan and Lijiao Zhao wrote the paper. All authors read and approved the manuscript.
Conflicts of Interest
The authors declare no conflict of interest.
References
- Hegi, M.E.; Liu, L.L.; Herman, J.G.; Stupp, R.; Wick, W.; Weller, M.; Mehta, M.P.; Gilbert, M.R. Correlation of O6-Methylguanine methyltransferase (MGMT) promoter methylation with clinical outcomes in glioblastoma and clinical strategies to modulate MGMT activity. J. Clin. Oncol. 2008, 26, 4189–4199. [Google Scholar] [CrossRef] [PubMed]
- Kaina, B.; Margison, G.P.; Christmann, M. Targeting O6-methylguanine-DNA methyltransferase with specific inhibitors as a strategy in cancer therapy. Cell. Mol. Life Sci. 2010, 67, 3663–3681. [Google Scholar] [CrossRef] [PubMed]
- Sun, G.H.; Zhao, L.J.; Zhong, R.G. The induction and repair of DNA interstrand crosslinks and implications in cancer chemotherapy. Anti Cancer Agents Med. Chem. 2016, 16, 221–246. [Google Scholar]
- Pegg, A.E. Multifaceted roles of alkyltransferase and related proteins in DNA repair, DNA damage, resistance to chemotherapy, and research tools. Chem. Res. Toxicol. 2011, 24, 618–639. [Google Scholar] [CrossRef] [PubMed]
- Goldstein, M.; Kastan, M.B. The DNA damage response: Implications for tumor responses to radiation and chemotherapy. Annu. Rev. Med. 2015, 66, 129–143. [Google Scholar] [CrossRef] [PubMed]
- Naumann, S.C.; Roos, W.P.; Jost, E.; Belohlavek, C.; Lennerz, V.; Schmidt, C.W.; Christmann, M.; Kaina, B. Temozolomide- and fotemustine-induced apoptosis in human malignant melanoma cells: Response related to MGMT, MMR, DSBs, and p53. Br. J. Cancer 2009, 100, 322–333. [Google Scholar] [CrossRef] [PubMed]
- Roos, W.P.; Kaina, B. DNA damage-induced cell death: From specific DNA lesions to the DNA damage response and apoptosis. Cancer Lett. 2013, 332, 237–248. [Google Scholar] [CrossRef] [PubMed]
- Srivenugopal, K.S.; Yuan, X.H.; Friedman, H.S.; AliOsman, F. Ubiquitination-dependent proteolysis of O6-methylguanine-DNA methyltransferase in human and murine tumor cells following inactivation with O6-benzylguanine or 1,3-bis(2-chloroethyl)-1-nitrosourea. Biochemistry 1996, 35, 1328–1334. [Google Scholar] [CrossRef] [PubMed]
- Xu-Welliver, M.; Pegg, A.E. Degradation of the alkylated form of the DNA repair protein, O6-alkylguanine-DNA alkyltransferase. Carcinogenesis 2002, 23, 823–830. [Google Scholar] [CrossRef] [PubMed]
- Philip, S.; Swaminathan, S.; Kuznetsov, S.G.; Kanugula, S.; Biswas, K.; Chang, S.; Loktionova, N.A.; Haines, D.C.; Kaldis, P.; Pegg, A.E. Degradation of BRCA2 in alkyltransferase-mediated DNA repair and its clinical implications. Cancer Res. 2008, 68, 9973–9981. [Google Scholar] [CrossRef] [PubMed]
- Belanich, M.; Pastor, M.; Randall, T.; Guerra, D.; Kibitel, J.; Alas, L.; Li, B.; Citron, M.; Wasserman, P.; White, A.; et al. Retrospective study of the correlation between the DNA repair protein alkyltransferase and survival of brain tumor patients treated with carmustine. Cancer Res. 1996, 56, 783–788. [Google Scholar] [PubMed]
- Gerson, S.L. Clinical relevance of MGMT in the treatment of cancer. J. Clin. Oncol. 2002, 20, 2388–2399. [Google Scholar] [CrossRef] [PubMed]
- Ishiguro, K.; Zhu, Y.L.; Shyam, K.; Penketh, P.G.; Baumann, R.P.; Sartorelli, A.C. Quantitative relationship between guanine O6-alkyl lesions produced by Onrigin™ and tumor resistance by O6-alkylguanine-DNA alkyltransferase. Biochem. Pharmacol. 2010, 80, 1317–1325. [Google Scholar] [CrossRef] [PubMed]
- Sun, G.H.; Zhao, L.J.; Fan, T.J.; Li, S.S.; Zhong, R.G. Investigations on the effect of O6-benzylguanine on the formation of dG-dC interstrand cross-links induced by chloroethylnitrosoureas in human glioma cells using stable isotope dilution high-performance liquid chromatography electrospray ionization tandem mass spectrometry. Chem. Res. Toxicol. 2014, 27, 1253–1262. [Google Scholar] [PubMed]
- Dolan, M.E.; Moschel, R.C.; Pegg, A.E. Depletion of mammalian O6-alkylguanine-DNA alkyltransferase activity by O6-benzylguanine provides a means to evaluate the role of this protein in protection against carcinogenic and therapeutic alkylating agents. Proc. Natl. Acad. Sci. USA 1990, 87, 5368–5372. [Google Scholar] [CrossRef] [PubMed]
- Dolan, M.E.; Mitchell, R.B.; Mummert, C.; Moschel, R.C.; Pegg, A.E. Effect of O6-benzylguanine analogs on sensitivity of human tumor cells to the cytotoxic effects of alkylating agents. Cancer Res. 1991, 51, 3367–3372. [Google Scholar] [PubMed]
- Moschel, R.C.; McDougall, M.G.; Dolan, M.E.; Stine, L.; Pegg, A.E. Structural features of substituted purine derivatives compatible with depletion of human O6-alkylguanine-DNA alkyltransferase. J. Med. Chem. 1992, 35, 4486–4491. [Google Scholar] [CrossRef] [PubMed]
- Chae, M.Y.; McDougall, M.G.; Dolan, M.E.; Swenn, K.; Pegg, A.E.; Moschel, R.C. Substituted O6-benzylguanine derivatives and their inactivation of human O6-alkylguanine-DNA alkyltransferase. J. Med. Chem. 1994, 37, 342–347. [Google Scholar] [CrossRef] [PubMed]
- Chae, M.Y.; Swenn, K.; Kanugula, S.; Dolan, M.E.; Pegg, A.E.; Moschel, R.C. 8-Substituted O6-benzylguanine, substituted 6(4)-(benzyloxy)pyrimidine, and related derivatives as inactivators of human O6-alkylguanine-DNA alkyltransferase. J. Med. Chem. 1995, 38, 359–365. [Google Scholar] [CrossRef] [PubMed]
- McElhinney, R.S.; Donnelly, D.J.; McCormick, J.E.; Kelly, J.; Watson, A.J.; Rafferty, J.A.; Elder, R.H.; Middleton, M.R.; Willington, M.A.; McMurry, T.B.H.; et al. Inactivation of O6-alkylguanine-DNA alkyltransferase. 1. Novel O6-(hetarylmethyl)guanines having basic rings in the side chain. J. Med. Chem. 1998, 41, 5265–5271. [Google Scholar] [CrossRef] [PubMed]
- Terashima, I.; Kohda, K. Inhibition of human O6-alkylguanine-DNA alkyltransferase and potentiation of the cytotoxicity of chloroethylnitrosourea by 4(6)-(benzyloxy)-2,6(4)-diamino-5-(nitro or nitroso)pyrimidine derivatives and analogues. J. Med. Chem. 1998, 41, 503–508. [Google Scholar] [CrossRef] [PubMed]
- Griffin, R.J.; Arris, C.E.; Bleasdale, C.; Boyle, F.T.; Calvert, A.H.; Curtin, N.J.; Dalby, C.; Kanugula, S.; Lembicz, N.K.; Newell, D.R.; et al. Resistance-modifying agents. 8. Inhibition of O6-alkylguanine-DNA alkyltransferase by O6-alkenyl-, O6-cycloalkenyl-, and O6-(2-oxoalkyl)guanines and potentiation of temozolomide cytotoxicity in vitro by O6-(1-cyclopentenylmethyl)guanine. J. Med. Chem. 2000, 43, 4071–4083. [Google Scholar] [CrossRef] [PubMed]
- Reinhard, J.; Hull, W.E.; von der Lieth, C.W.; Eichhorn, U.; Kliem, H.C.; Kaina, B.; Wiessler, M. Monosaccharide-linked inhibitors of O6-methylguanine-DNA methyltransferase (MGMT): Synthesis, molecular modeling, and structure-activity relationships. J. Med. Chem. 2001, 44, 4050–4061. [Google Scholar] [CrossRef] [PubMed]
- Nelson, M.E.; Loktionova, N.A.; Pegg, A.E.; Moschel, R.C. 2-amino-O4-benzylpteridine derivatives: Potent inactivators of O6-alkylguanine-DNA alkyltransferase. J. Med. Chem. 2004, 47, 3887–3891. [Google Scholar] [CrossRef] [PubMed]
- Wei, G.P.; Loktionova, N.A.; Pegg, A.E.; Moschel, R.C. β-Glucuronidase-cleavable prodrugs of O6-benzylguanine and O6-benzyl-2′-deoxyguanosine. J. Med. Chem. 2005, 48, 256–261. [Google Scholar] [CrossRef] [PubMed]
- Pauly, G.T.; Loktionova, N.A.; Fang, Q.M.; Vankayala, S.L.; Guida, W.C.; Pegg, A.E. Substitution of aminomethyl at the meta-position enhances the inactivation of O6-alkylguanine-DNA alkyltransferase by O6-benzylguanine. J. Med. Chem. 2008, 51, 7144–7153. [Google Scholar] [CrossRef] [PubMed]
- Gajewski, T.F.; Sosman, J.; Gerson, S.L.; Liu, L.L.; Dolan, E.; Lin, S.; Vokes, E.E. Phase II trial of the O6-alkylguanine DNA alkyltransferase inhibitor O6-benzylguanine and 1,3-bis(2-chloroethyl)-1-nitrosourea in advanced melanoma. Clin. Cancer Res. 2005, 11, 7861–7865. [Google Scholar] [CrossRef] [PubMed]
- Warren, K.E.; Gururangan, S.; Geyer, J.R.; McLendon, R.E.; Poussaint, T.Y.; Wallace, D.; Balis, F.M.; Berg, S.L.; Packer, R.J.; Goldman, S.; et al. A phase II study of O6-benzylguanine and temozolomide in pediatric patients with recurrent or progressive high-grade gliomas and brainstem gliomas: A Pediatric Brain Tumor Consortium study. J. Neuro Oncol. 2012, 106, 643–649. [Google Scholar] [CrossRef] [PubMed]
- Ranson, M.; Middleton, M.R.; Bridgewater, J.; Lee, S.M.; Dawson, M.; Jowle, D.; Halbert, G.; Waller, S.; McGrath, H.; Gumbrell, L.; et al. Lomeguatrib, a potent inhibitor of O6-alkylguanine-DNA-alkyltransferase: Phase I safety, pharmacodynamic, and pharmacokinetic trial and evaluation in combination with temozolomide in patients with advanced solid tumors. Clin. Cancer Res. 2006, 12, 1577–1584. [Google Scholar] [CrossRef] [PubMed]
- Schilsky, R.L.; Dolan, M.E.; Bertucci, D.; Ewesuedo, R.B.; Vogelzang, N.J.; Mani, S.; Wilson, L.R.; Ratain, M.J. Phase I clinical and pharmacological study of O6-benzylguanine followed by carmustine in patients with advanced cancer. Clin. Cancer Res. 2000, 6, 3025–3031. [Google Scholar] [PubMed]
- Thareja, S. Steroidal 5α-reductase inhibitors: A comparative 3D-QSAR study review. Chem. Rev. 2015, 115, 2883–2894. [Google Scholar] [CrossRef] [PubMed]
- Lu, P.; Wei, X.; Zhang, R.S. CoMFA and CoMSIA 3D-QSAR studies on quionolone caroxylic acid derivatives inhibitors of HIV-1 integrase. Eur. J. Med. Chem. 2010, 45, 3413–3419. [Google Scholar] [CrossRef] [PubMed]
- Moonsamy, S.; Dash, R.C.; Soliman, M.E.S. Integrated computational tools for identification of CCR5 antagonists as potential HIV-1 entry inhibitors: Homology modeling, virtual screening, molecular dynamics simulations and 3D QSAR analysis. Molecules 2014, 19, 5243–5265. [Google Scholar] [CrossRef] [PubMed]
- Yu, R.; Wang, J.; Wang, R.; Lin, Y.; Hu, Y.; Wang, Y.Q.; Shu, M.; Lin, Z.H. Combined pharmacophore modeling, 3D-QSAR, homology modeling and docking studies on CYP11B1 inhibitors. Molecules 2015, 20, 1014–1030. [Google Scholar] [CrossRef] [PubMed]
- Cramer, R.D.; Patterson, D.E.; Bunce, J.D. Comparative molecular-field analysis (CoMFA). 1. effect of shape on binding of steroids to carrier proteins. J. Am. Chem. Soc. 1988, 110, 5959–5967. [Google Scholar] [CrossRef] [PubMed]
- Klebe, G.; Abraham, U.; Mietzner, T. Molecular similarity indexes in a comparative-analysis (CoMSIA) of drug molecules to correlate and predict their biological-activity. J. Med. Chem. 1994, 37, 4130–4146. [Google Scholar] [CrossRef] [PubMed]
- Klebe, G.; Abraham, U. Comparative Molecular Similarity Index Analysis (CoMSIA) to study hydrogen-bonding properties and to score combinatorial libraries. J. Comput. Aid. Mol. Des. 1999, 13, 1–10. [Google Scholar] [CrossRef]
- Bohm, M.; Sturzebecher, J.; Klebe, G. Three-dimensional quantitative structure-activity relationship analyses using comparative molecular field analysis and comparative molecular similarity indices analysis to elucidate selectivity differences of inhibitors binding to trypsin, thrombin, and factor Xa. J. Med. Chem. 1999, 42, 458–477. [Google Scholar] [PubMed]
- Doytchinova, I.A.; Flower, D. A comparative molecular similarity index index analysis (CoMSIA) study identifies an HLA-A2 binding supermotif. J. Comput. Aid. Mol. Des. 2002, 16, 535–544. [Google Scholar] [CrossRef]
- Balasubramanian, P.K.; Balupuri, A.; Gadhe, C.G.; Cho, S.J. 3D QSAR modeling study on 7-aminofuro [2,3-c] pyridine derivatives as TAK1 inhibitors using CoMFA and CoMSIA. Med. Chem. Res. 2015, 24, 2347–2365. [Google Scholar] [CrossRef]
- Liu, X.; Chen, X.W.; Zhang, L.Z.; Zhan, P.; Liu, X.Y. 3D-QSAR and docking studies on piperidine-substituted diarylpyrimidine analogues as HIV-1 reverse transcriptase inhibitors. Med. Chem. Res. 2015, 24, 3314–3326. [Google Scholar] [CrossRef]
- Golbraikh, A.; Tropsha, A. Beware of q2! J. Mol. Graph. 2002, 20, 269–276. [Google Scholar] [CrossRef]
- Tropsha, A.; Gramatica, P.; Gombar, V.K. The importance of being earnest: Validation is the absolute essential for successful application and interpretation of QSPR models. QSAR Comb. Sci. 2003, 22, 69–77. [Google Scholar] [CrossRef]
- Wibley, J.E.A.; Pegg, A.E.; Moody, P.C.E. Crystal structure of the human O6-alkylguanine-DNA alkyltransferase. Nucleic Acids Res. 2000, 28, 393–401. [Google Scholar] [CrossRef] [PubMed]
- Verdonk, M.L.; Cole, J.C.; Hartshorn, M.J.; Murray, C.W.; Taylor, R.D. Improved protein-ligand docking using GOLD. Proteins 2003, 52, 609–623. [Google Scholar] [CrossRef] [PubMed]
- Daniels, D.S.; Woo, T.T.; Luu, K.X.; Noll, D.M.; Clarke, N.D.; Pegg, A.E.; Tainer, J.A. DNA binding and nucleotide flipping by the human DNA repair protein AGT. Nat. Struct. Mol. Biol. 2004, 11, 714–720. [Google Scholar] [CrossRef] [PubMed]
- Clark, M.; Cramer, R.D.; Vanopdenbosch, N. Validation of the general-purpose tripos 5.2 force-field. J. Comput. Chem. 1989, 10, 982–1012. [Google Scholar] [CrossRef]
- Powell, M.J.D. Restart procedures for conjugate gradient method. Math. Progr. 1977, 12, 241–254. [Google Scholar] [CrossRef]
- Gasteiger, J.; Marsili, M. Iterative partial equalization of orbital electronegativity-a rapid access to atomic charges. Tetrahedron 1980, 36, 3219–3228. [Google Scholar] [CrossRef]
- Wang, F.F.; Yang, W.; Shi, Y.H.; Le, G.W. Structural analysis of selective agonists of thyroid hormone receptor beta using 3D-QSAR and molecular docking. J. Taiwan Inst. Chem. Eng. 2015, 49. [Google Scholar] [CrossRef]
- Frisch, M.J.; Trucks, G.W.; Schlegel, H.B.; Scuseria, G.E.; Robb, M.A.; Cheeseman, J.R.; Scalmani, G.; Barone, V.; Mennucci, B.; Petersson, G.A.; et al. Gaussian 09; Revision A.01; Gaussian Inc.: Wallingford, CT, USA, 2009. [Google Scholar]
- Wold, S.; Ruhe, A.; Wold, H.; Dunn, W.J. The collinearity problem in linear-regression. The partial least-squares (PLS) approach to generalized inverses. SIAM J. Sci. Stat. Comput. 1984, 5, 735–743. [Google Scholar] [CrossRef]
- Golbraikh, A.; Shen, M.; Xiao, Z.Y.; Xiao, Y.D.; Lee, K.H.; Tropsha, A. Rational selection of training and test sets for the development of validated QSAR models. J. Comput. Aid. Mol. Des. 2003, 17, 241–253. [Google Scholar] [CrossRef]
- Sample Availability: Not Available.


© 2016 by the authors. Licensee MDPI, Basel, Switzerland. This article is an open access article distributed under the terms and conditions of the Creative Commons Attribution (CC-BY) license ( http://creativecommons.org/licenses/by/4.0/).