Abstract
Chitosan was reacted with four concentrations (2.5, 5, 10 and 20 mmol) of glutamic acid resulting in four types of glutamic-chitosan hydrogels (GCs), the activity of the resulted compounds on the removal of copper(II) and nickel(II) from wastewater were tested. The results indicated that by increasing glutamic acid concentration from GCs-1 to GCs-4, the efficiency of removing Cu(II) and Ni(II) were decreased, which may be due to a decrease in the pore size of the hydrogels as a result of the increased degree of crosslinking.
1. Introduction
The huge increase in the use of heavy metals over the past few decades has resulted in an unwanted increased presence of heavy metals in the environment, for example, industrial wastewater which contains high amount of heavy metals can pollute water resources. Heavy metals which include zinc, copper, nickel, mercury, cadmium, lead and chromium are one of the most toxic types of water pollutants. At least 20 metals are considered to be toxic and approximately half of these metals are emitted to the environment in quantities that are risky to the surroundings, in addition to the human health. A majority of heavy metals are non-biodegradable and highly toxic [1], so their concentrations have to be reduced to acceptable levels before discharge into the environment; otherwise, they can pose a threat to the health of animals and humans.
Wastewater containing heavy metals results mainly from metal plating facilities, mining operations, batteries, paper, fertilizer, tanneries, pesticide industries, stabilizers, thermoplastics, and pigment manufacture [2]. These industries discharge heavy metals directly or indirectly into the environment, especially in developing countries. Heavy metals tend to accumulate in living organisms [3] causing numerous diseases and disorders due to their toxicity and non-biodegradability [4]. Nickel is a chemically active metal used for preparing a large number of nickel alloys and also used in many other industries. The excessive intake of nickel may cause carcinogenesis, mutagenesis and dermatogenic effects as a result of bioaccumulation [5,6]. Copper (Cu(II)) is micronutrient element that plays an important role in bone formation together with certain proteins and enzymes [7]. However, the consumption of food or water containing high copper concentrations can cause several diseases such as gastrointestinal symptoms, liver toxicity, osteoporosis, Wilson’s, and Alzheimer’s diseases [8,9,10]. Excessive intake of copper can also cause hemolysis, hepatotoxicity, nephrotoxicity, vomiting, cramps, and convulsions [4].
The high cost and complexity, high energy consumption and secondary pollution problems [11] of most of the treatment processes that are used to remove heavy metals from wastewater are considered to be major problems [12]; for those reasons, a number of studies were carried out on the use of low-cost adsorbents for the removal of heavy metals from natural resources [13] such as chitosan, which also is a biodegradable and biocompatible polymer. Chitosan consists mainly of β-(1→4)-2-acetamido-2-deoxy-d-glucose units which are produced by deacetylation of chitin [14]. Chitosan is the second most abundant biopolymer on Earth after cellulose [15], it is widely distributed in crustacean shells and cell walls of fungus. Several methods have been reported for the chemical modification of chitosan, one of which is the crosslinking of chitosan with various substances such as dialdehydes and dicarboxylic acids. Chitosan was modified with several dicarboxylic acids including glutamic acid by reacting both carboxylic acid groups with the amino groups of chitosan [6]. In the present work, chitosan was reacted with four different amounts of glutamic acid, resulting in four types of glutamic-chitosan (GC) hydrogels, the resulting crosslinking polymers were tested for the removal of copper(II) and nickel(II) from wastewater.
2. Results and Discussion
2.1. Synthesis of Glutamic-Chitosan Cross Linked Hydrogels (GCs)
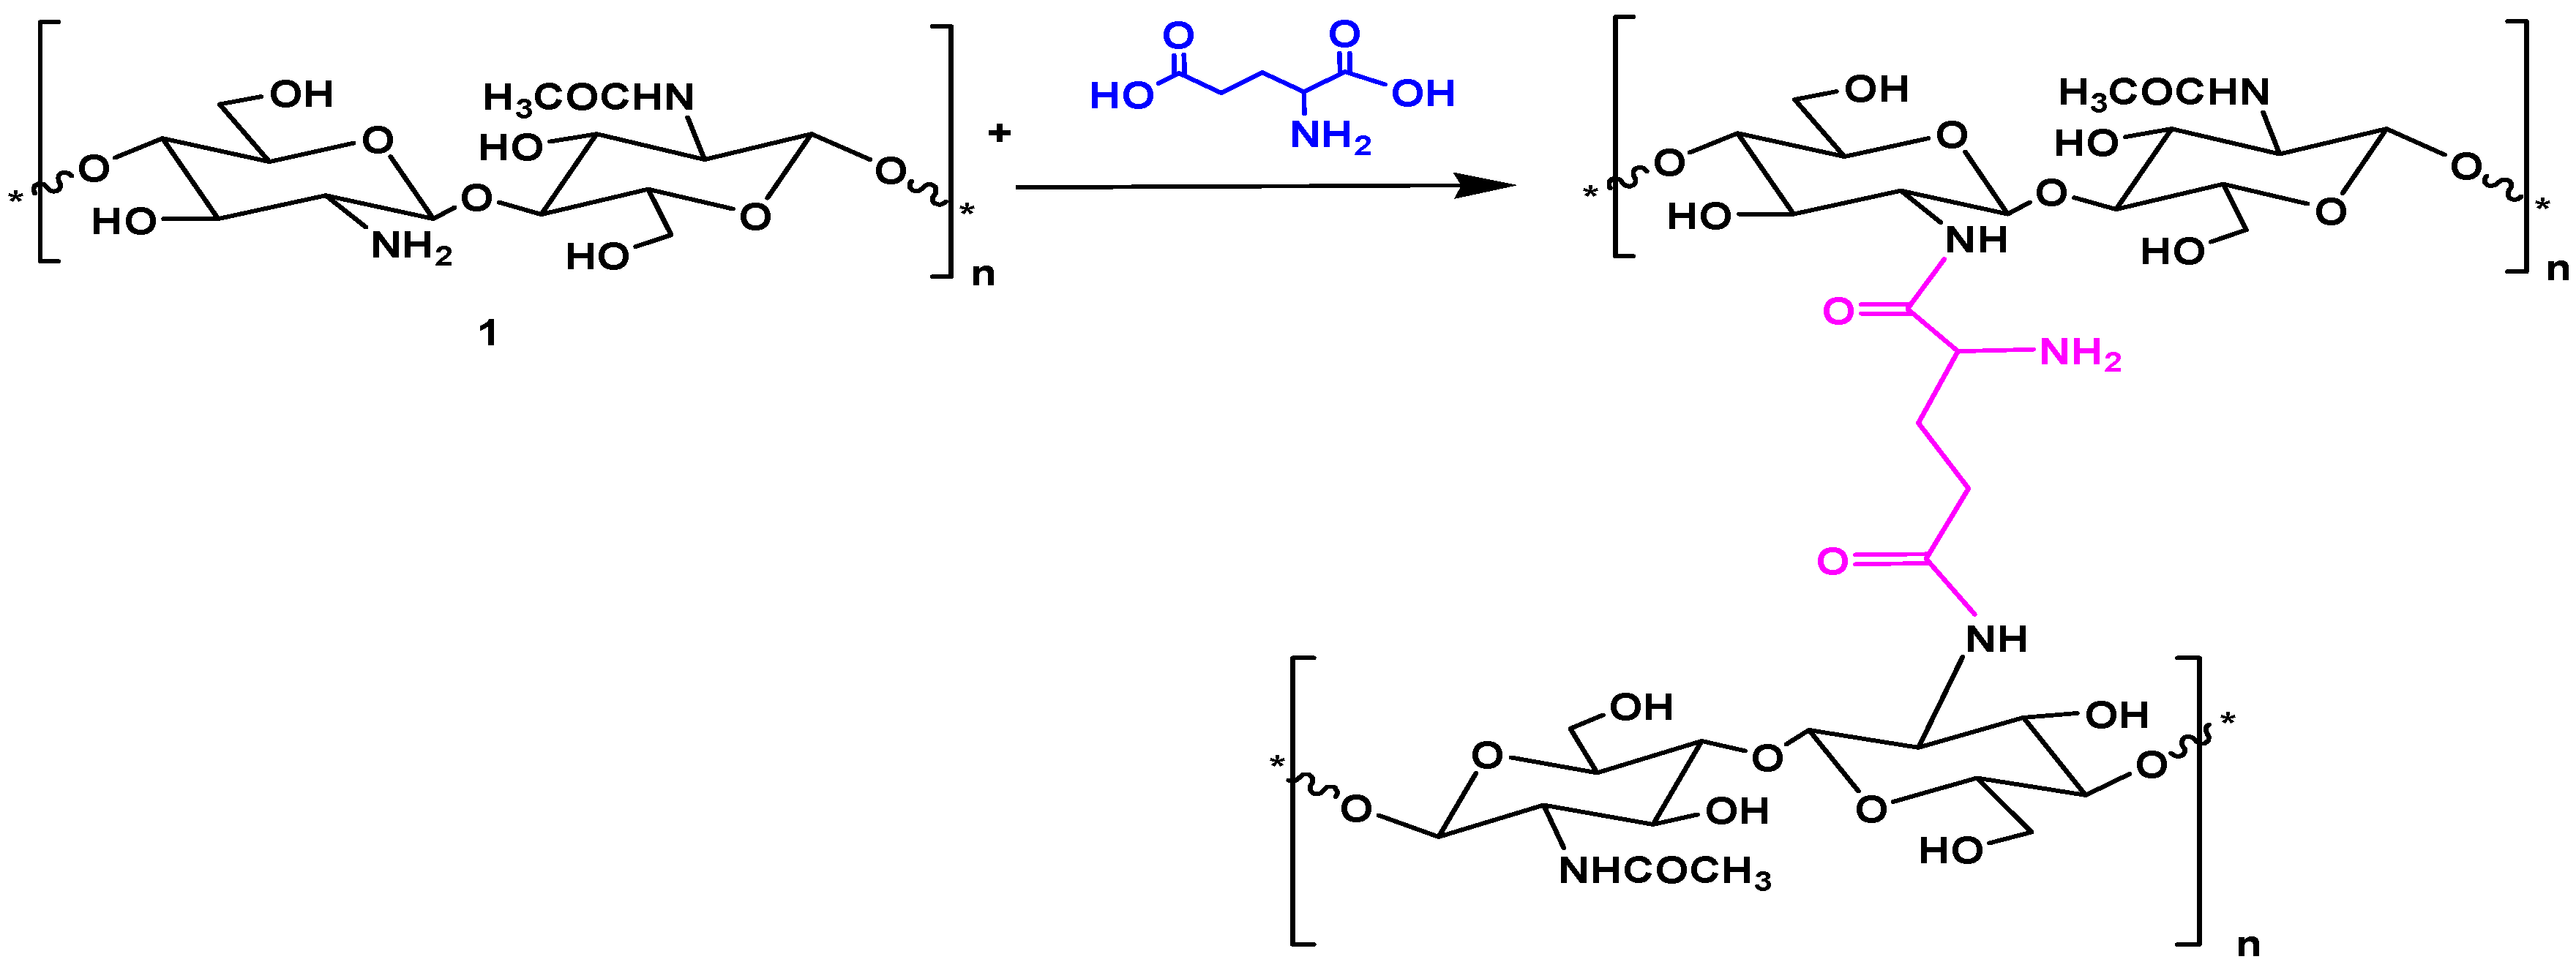
Chitosan was modified with glutamic acid, whereby the carboxylate groups of glutamic acid reacted with the amino groups of chitosan (Scheme 1). The amount of glutamic acid with respect to chitosan was varied to produce four new cross-linked glutamic-chitosan hydrogels (Scheme 1) designated as: glutamic-chitosan-1 (GCs-1), glutamic-chitosan-2 (GCs-2), glutamic-chitosan-3 (GCs-3), and glutamic-chitosan-4 (GCs-4) with increasing degrees of cross linking, respectively. All the prepared derivatives are produced in a nearly quantitative yield (89%–96.4%).

Scheme 1.
Synthesis of glutamic-chitosan hydrogel.
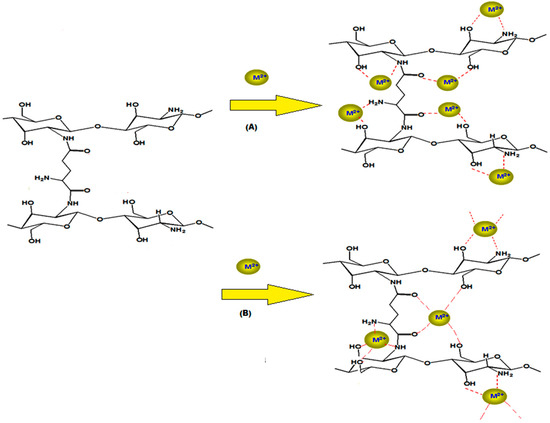
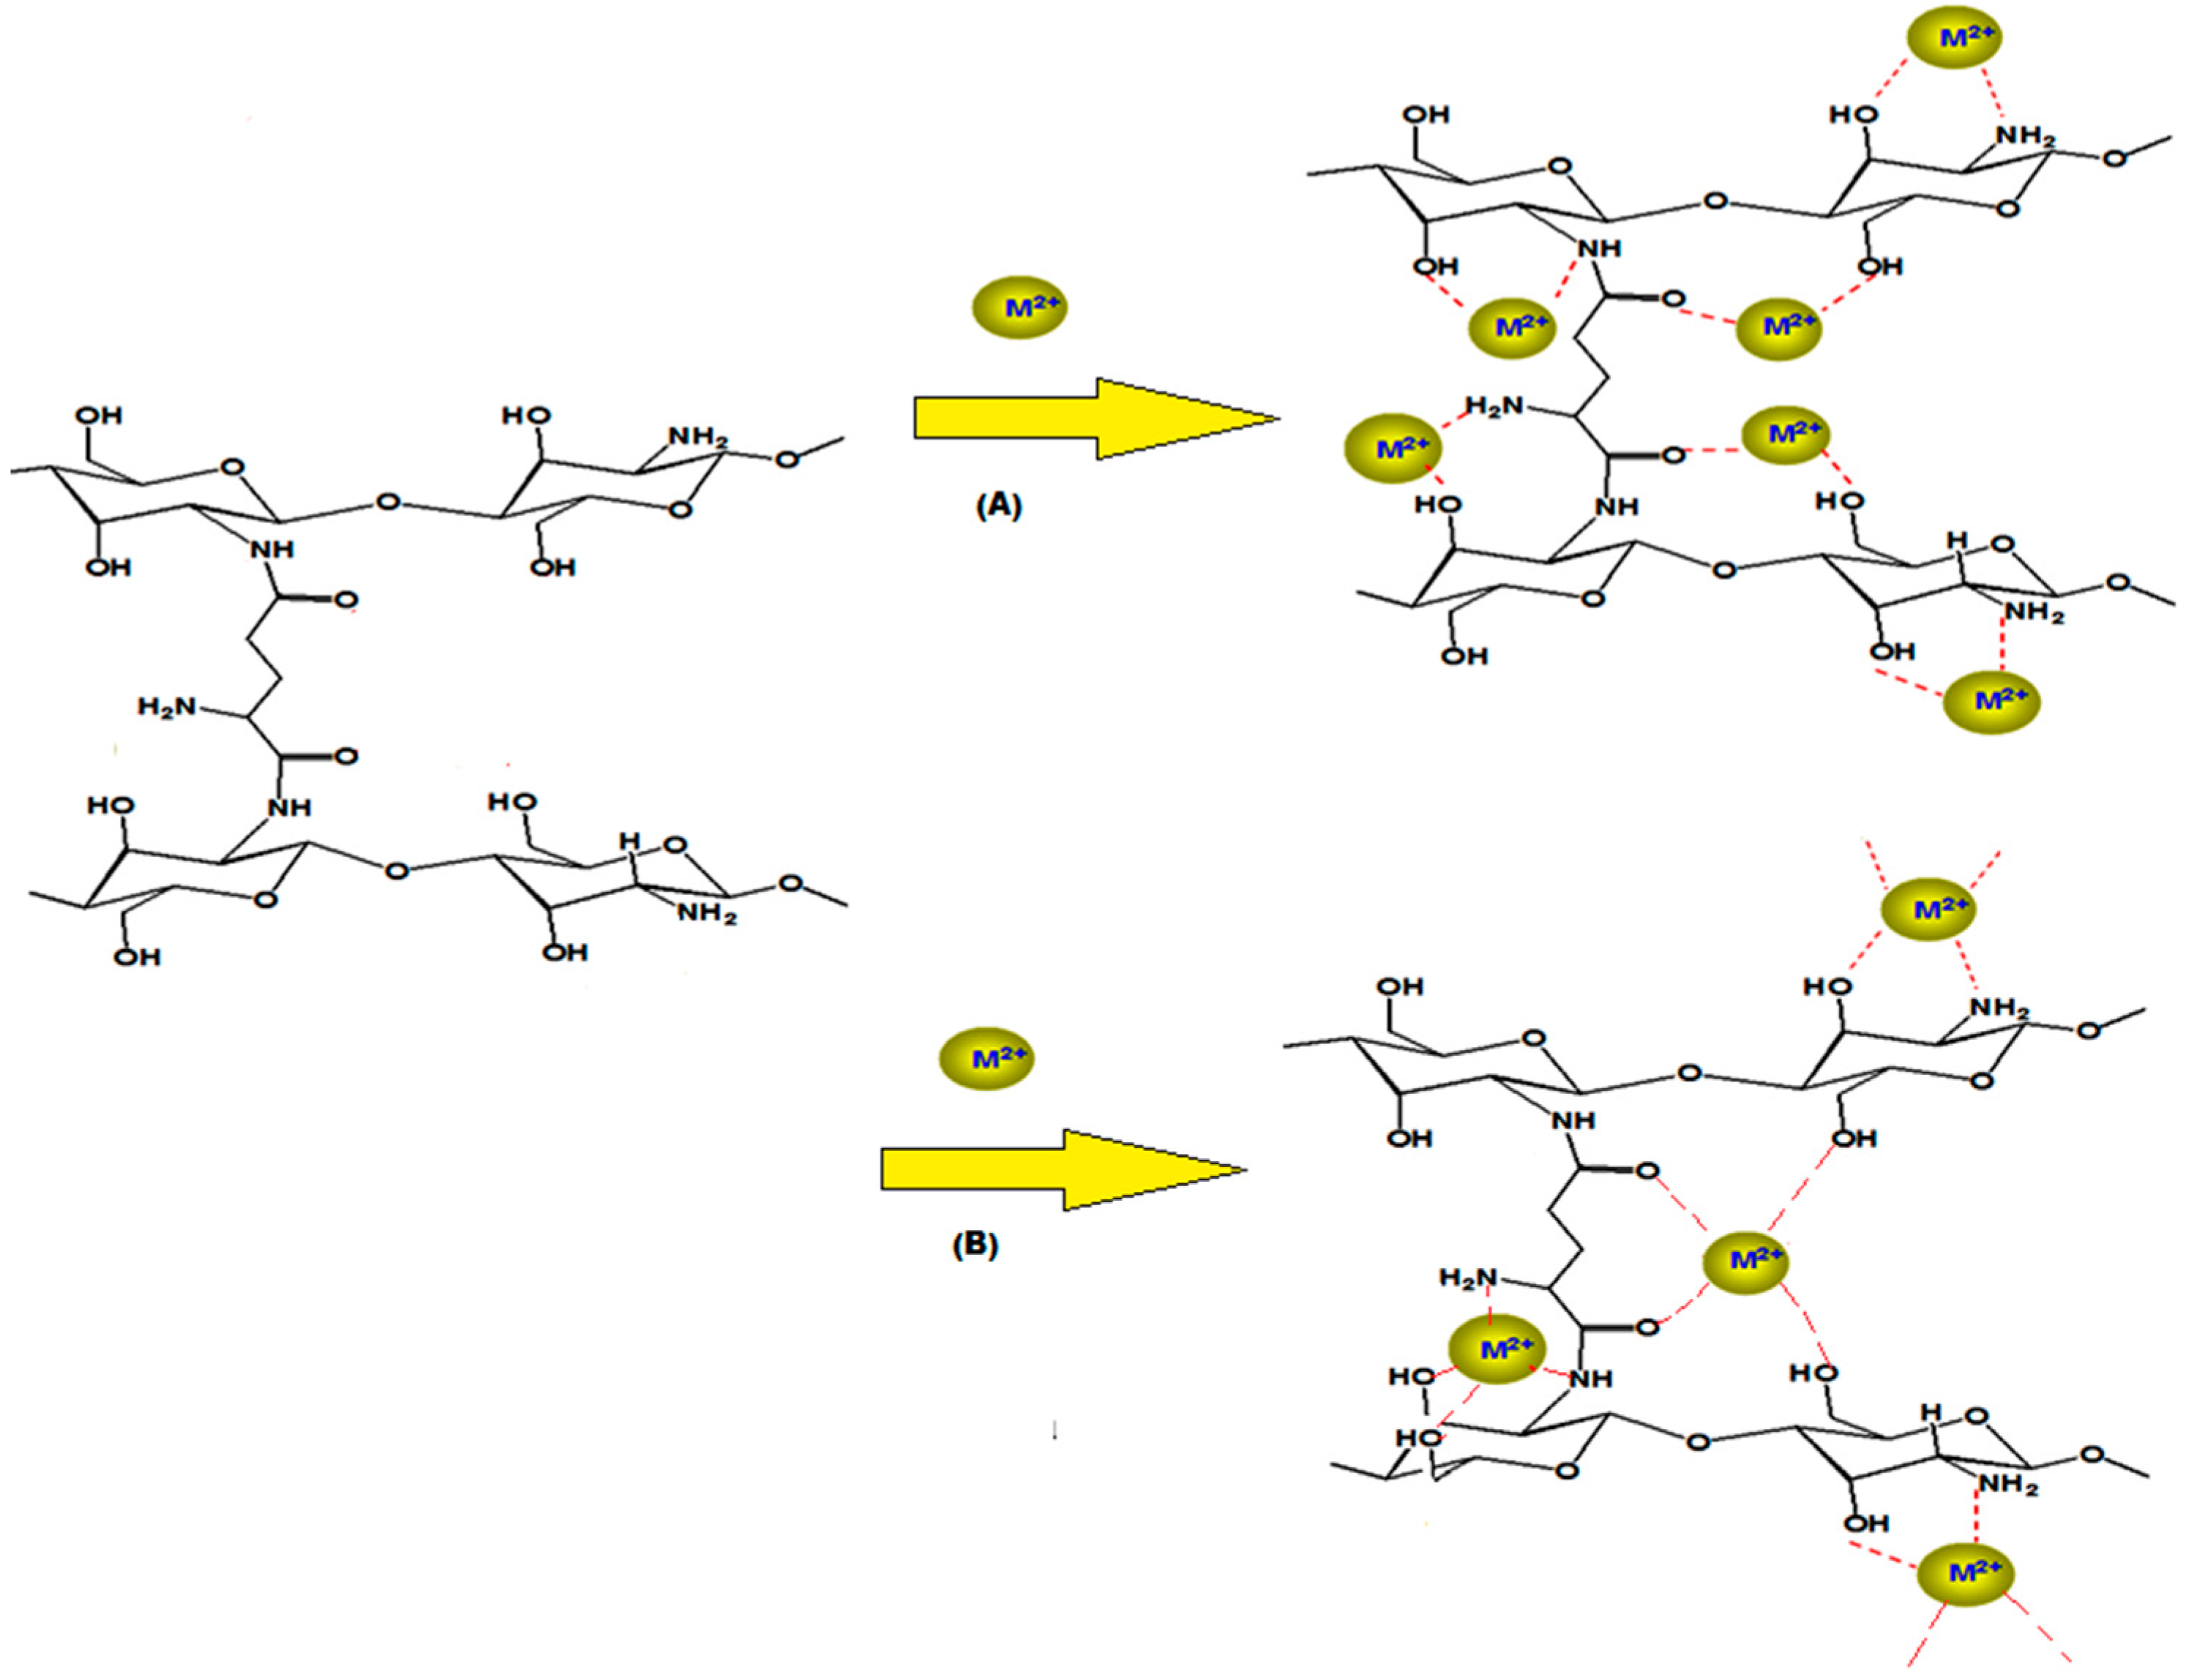
The modification of chitosan with crosslinking reactions leads to formation of chitosan derivatives with better resistance in extreme media conditions [16]. On the other hand, the crosslinking modification slightly decreases the adsorption capacity of chitosan; to overcome this difficulty we choose glutamic acid as crosslinker since glutamic acid will increase the amino (-NH2) and the carbonyl (C=O) groups [17]. Increasing the abundance of these groups in the target molecule will facilitate increased complex formation with Ni(II) and Cu(II). The proposed adsorption mechanism of Ni(II) and Cu(II) on chitosan-glutamic hydrogel is illustrated in Scheme 2.
Scheme 2.
The proposed mechanism, M2+ for (A) nickel and (B) copper.
2.2. Fourier Transform Infrared Spectroscopy (FTIR) Characterization of G-Cs
Glutamic-chitosan formation was confirmed using Fourier transform infrared spectroscopy. The FTIR spectrum of chitosan showed four strong absorption peaks at 1157.8, 1076.6, 1030, and 895.7 cm−1 which are characteristic peaks of the saccharide structure, where the OH and NH functions showed a very strong broad absorption peak around 3600–3200 cm−1. Primary amines showed two absorption peaks at 1650.4 and 1598.9 cm−1, which indicated that chitosan had a high degree of deacetylation [18].
The FTIR spectra of the GC hydrogels showed the broad band between 3450 and 3470 cm−1 due to the OH and NH groups. In addition, the characteristic absorbance of NH2 at 1650.4 and 1598.9 cm−1 was also seen. The spectra also showed a broad absorption band around 1637 cm−1 which corresponds to the (CONH) amide group, and the intensity of this band increased with increasing cross-linking density of the hydrogels, i.e., from GCs-1 to GCs-4 (see Table 1).

Table 1.
IR spectral data of compounds 1–4.
2.3. Elemental Characterization of GCs
Elemental analyses of the GC derivatives is another confirmation of GC formation; the elemental analysis data are shown in Table 2.
Table 2.
Elemental analyses and % yield of G-chitosan hydrogels.
2.4. 1H-NMR Characterization of GC Hydrogels
The structure of compounds GCs-1 to GCs-4 is further proved by 1H-NMR spectroscopy, which showed the two (NH) protons as a singlet at δ 7.77, the 1′-OH proton at 4.00, and the rest of the sugar protons at the range 3.29–3.33 ppm, as well as the appearance of the two (NH2) protons f at 3.29 (see Experimental). After shaking of compounds 1–4 with D2O, their 1H-NMR spectra showed the disappearance of the (NH2) and (NH) protons as well as (OH) protons [18].
2.5. Scanning Electron Microscopy Observations of G-Chitosan Hydrogels
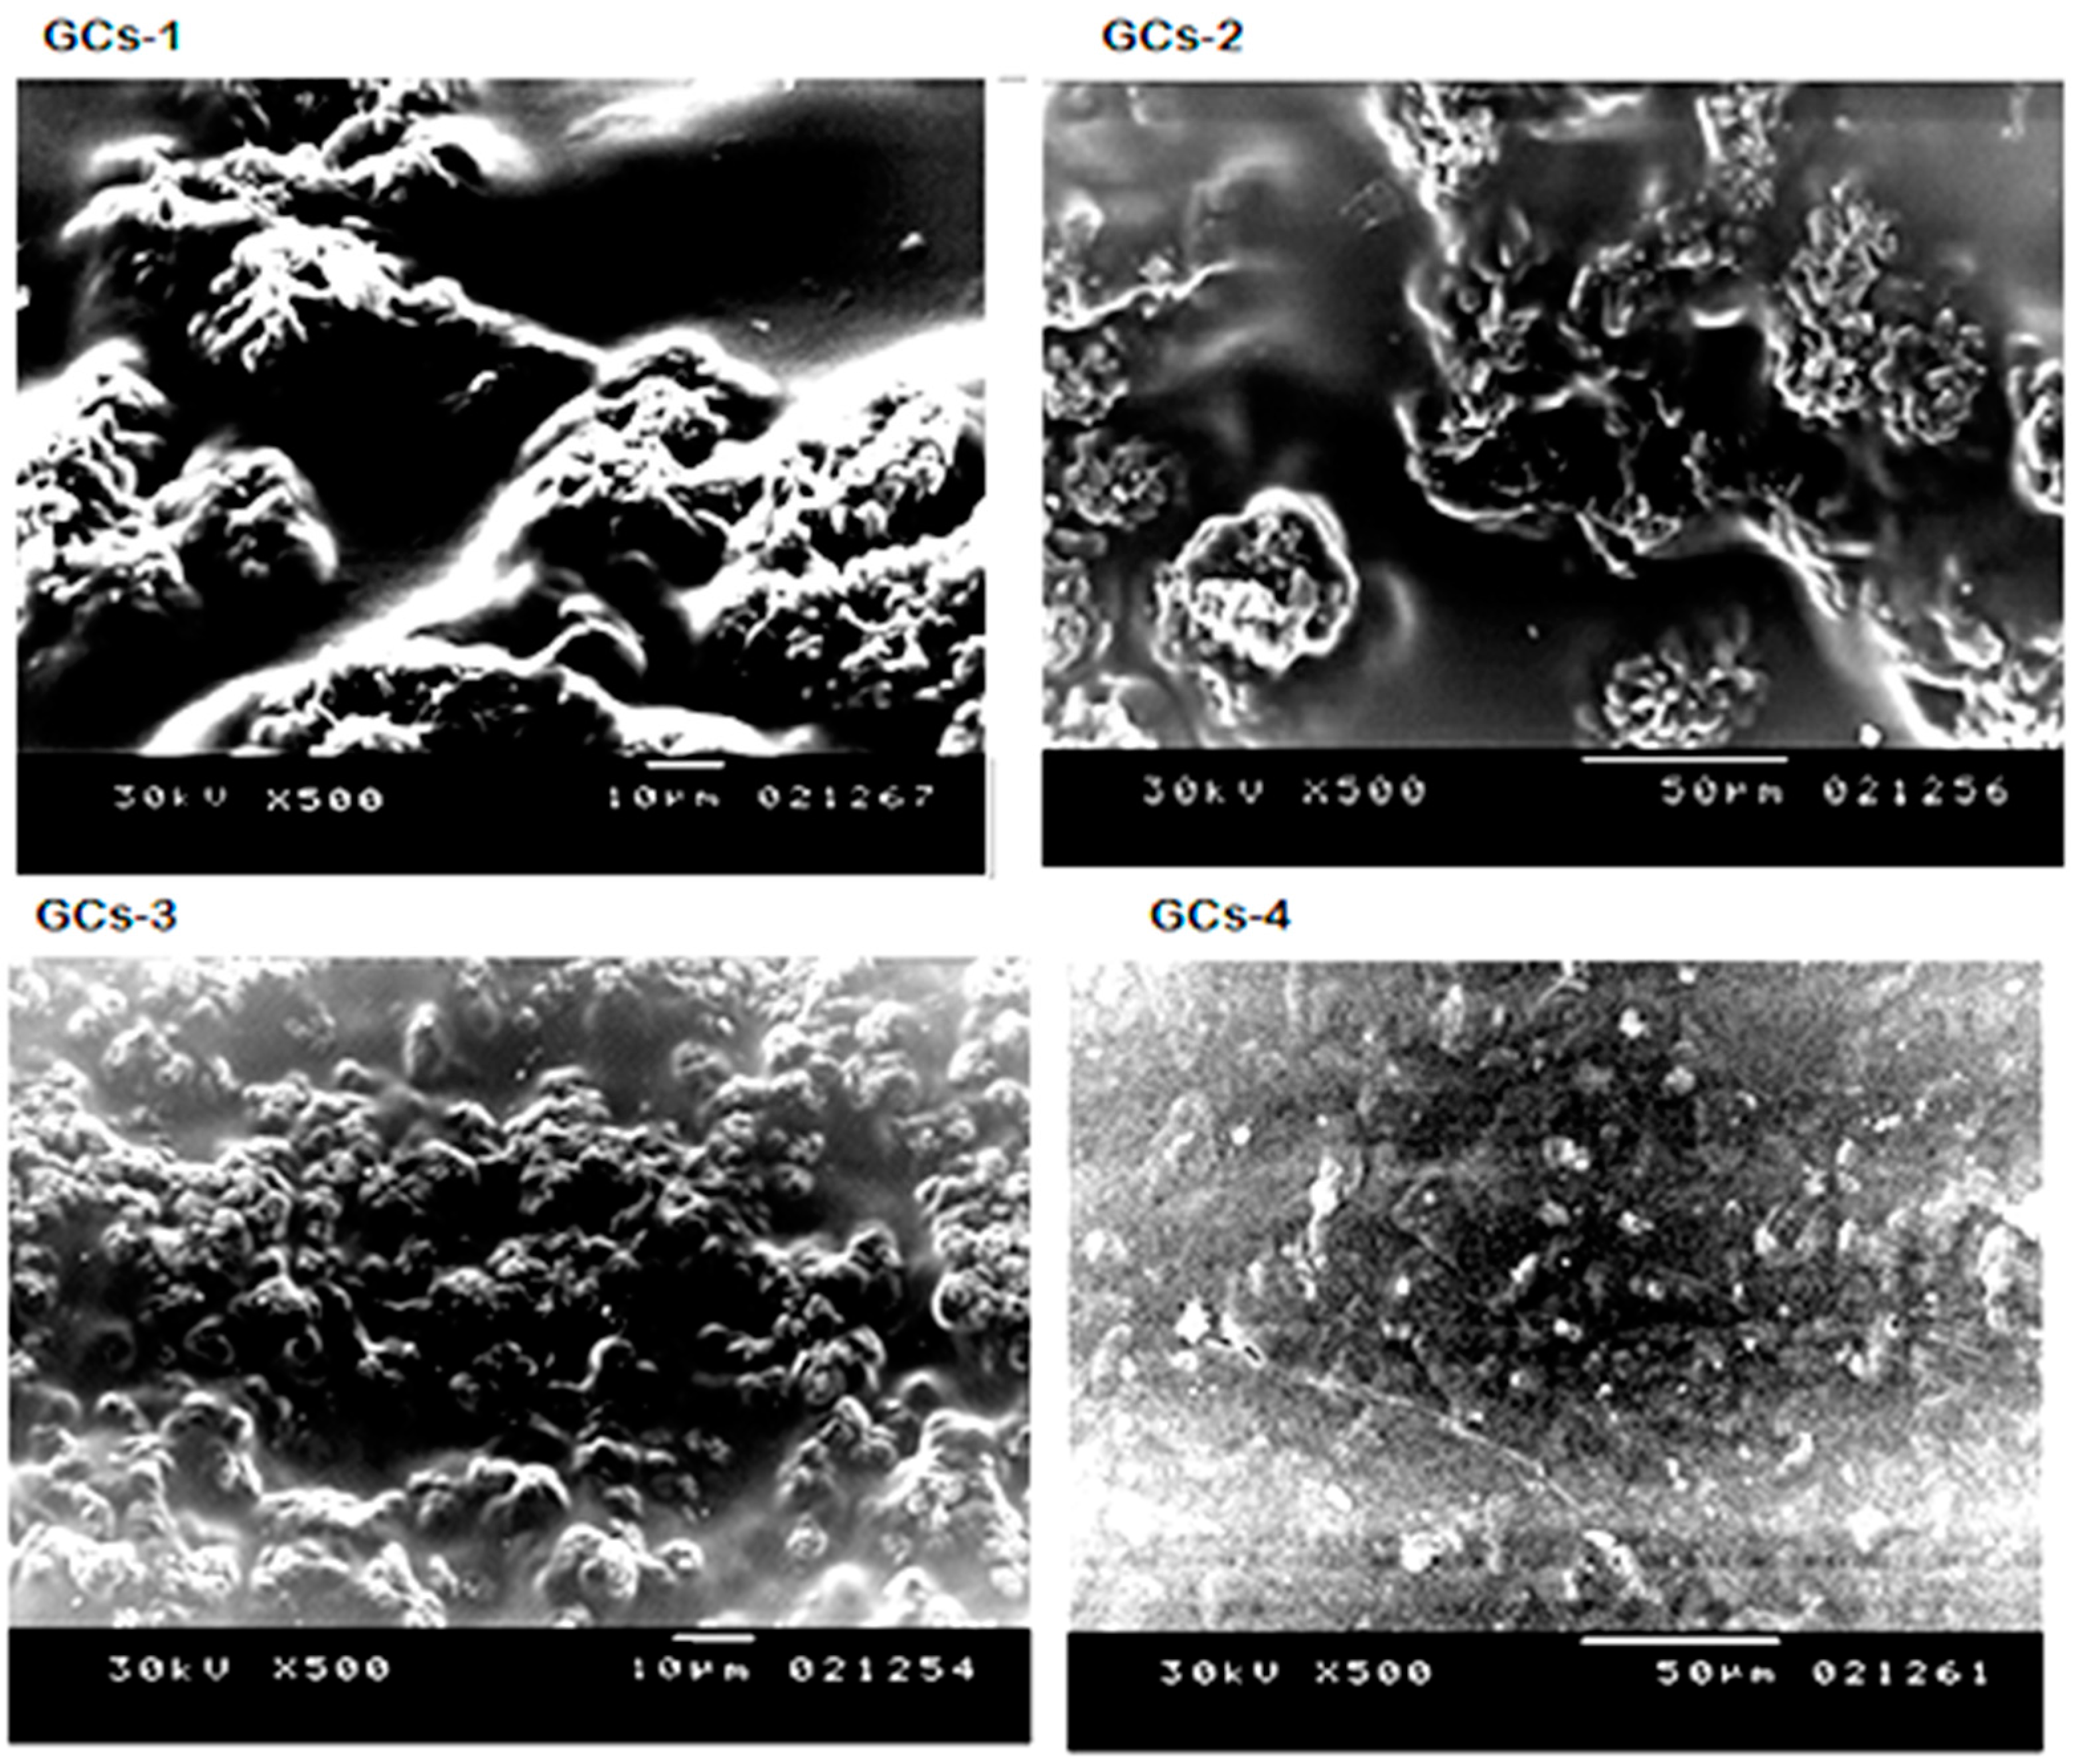
Microstructures of the hydrogels surface were investigated by scanning electron microscopy as presented in Figure 1. It could be seen that the hydrogels have a similar surface appearance, but the distribution and the size of their pores are different. The porosity distribution became more uniform and dense with increasing concentration of glutamic acid.
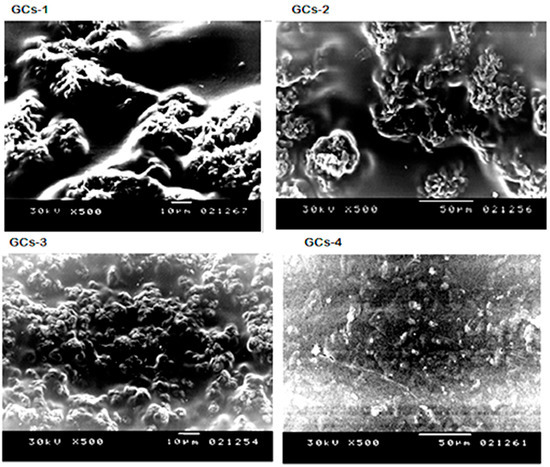
Figure 1.
Scanning electron microscopy of G-chitosan hydrogels.
The extremely porous surface structure of the hydrogels could lead to high surface areas. The pore size of the hydrogels decreased with increasing the cross-linking density of the hydrogels from GCs-1 to GCs-4 hydrogel.
2.6. Solubility of G-Chitosan Hydrogels
The solubility of the new hydrogels was studied in different solvents at room temperature. The results show that the hydrogels are insoluble in acetic acid solution (1% v/v), dimethylformamide, dimethyl sulfoxide, tetrahydrofuran, N-methylpyrrolidone, chloroform, methylene chloride, acetone and methanol since no soluble fractions of the hydrogels were obtained. This indicates a successful formation of crosslinked networks in these hydrogels.
2.7. Sorption Studies of Ni(II) and Cu(II)
2.7.1. Influence of G-chitosan Amount
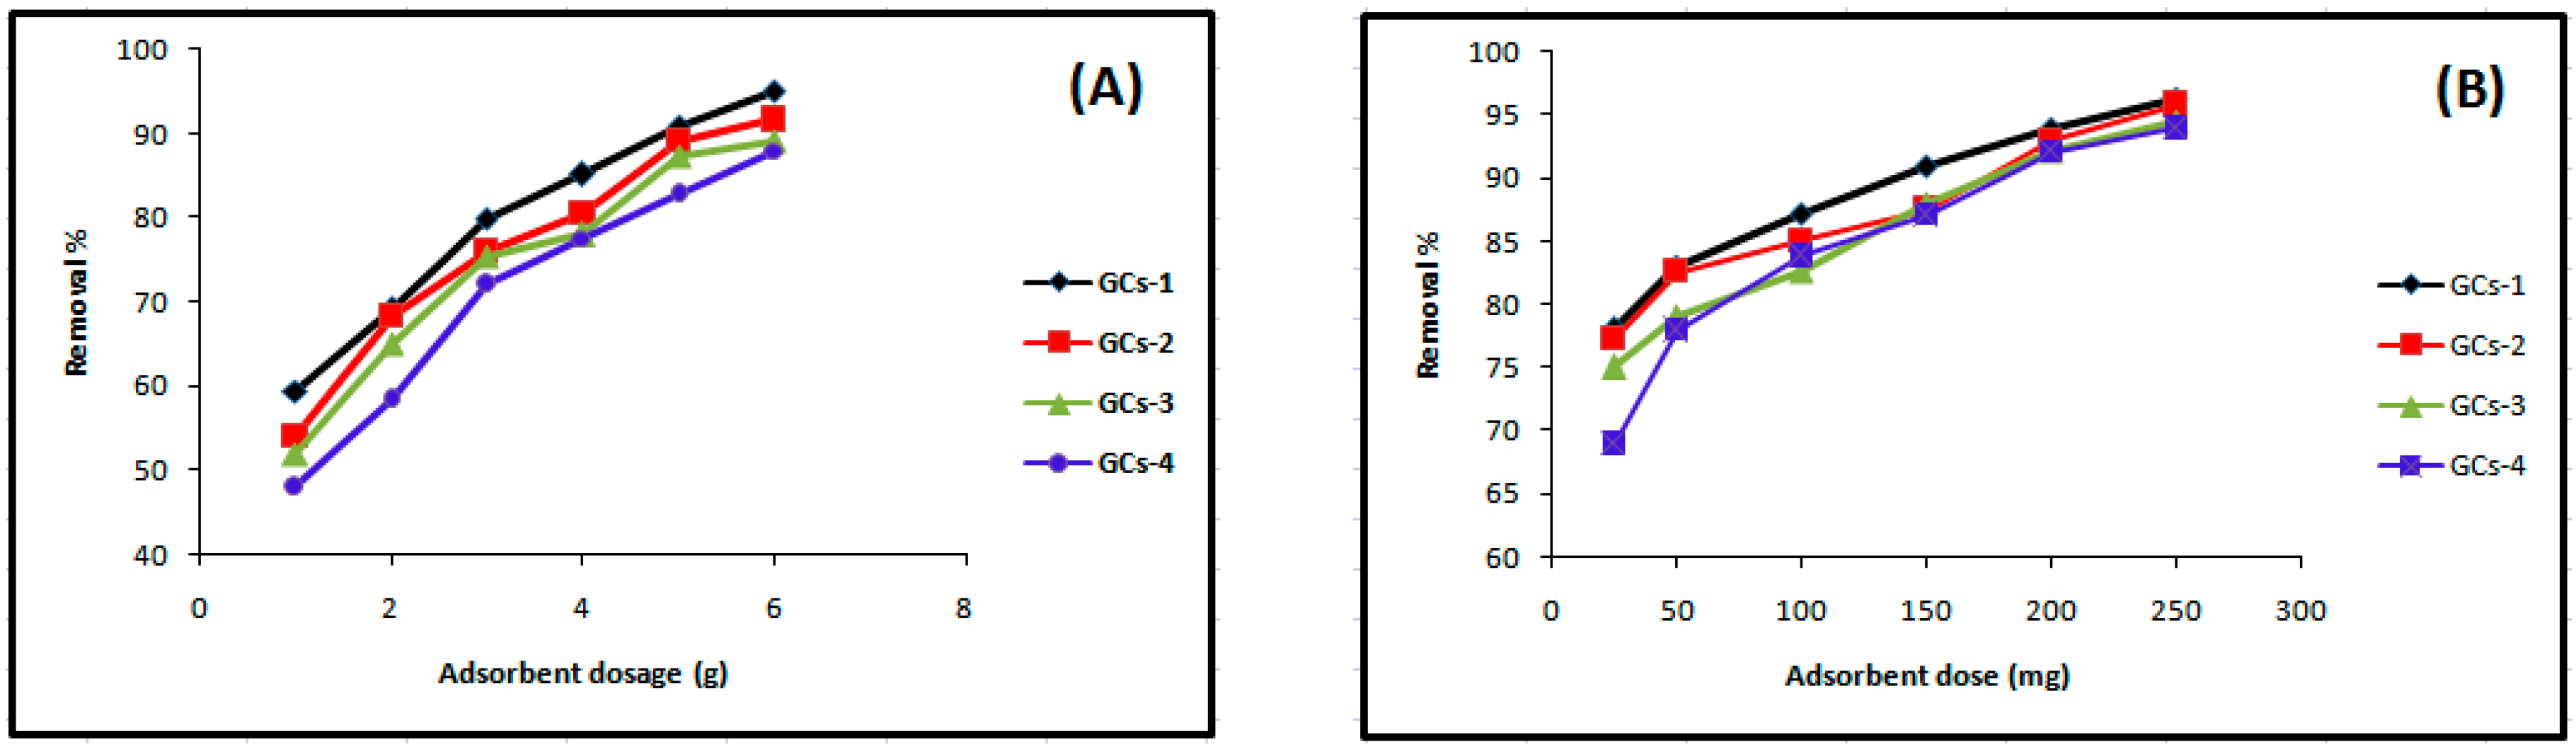
The dependence of Ni(II) sorption on G-chitosan amount was studied by varying the amount of the adsorbent from 1 g to 5 g while keeping the other parameters such as pH, metal solution volume (100 mL), concentration (200 mg/L), and contact time (60 min) constant. Figure 2A shows that the percentage removal of nickel increases with increasing adsorbent dose from 48% to 95%.
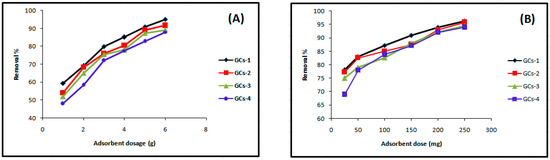
Figure 2.
Influence of GCs amount on (A) nickel and (B) copper sorption.
Figure 2B shows that the removal efficiency of copper was improved on increasing adsorbent doses; this may occur due to the fact that the higher dose of adsorbents in the solution provides the greater availability of exchangeable sites for the ions. The maximum % removal of Cu(II) was 95.17% at the dosage of 250 mg.
2.7.2. Influence of pH
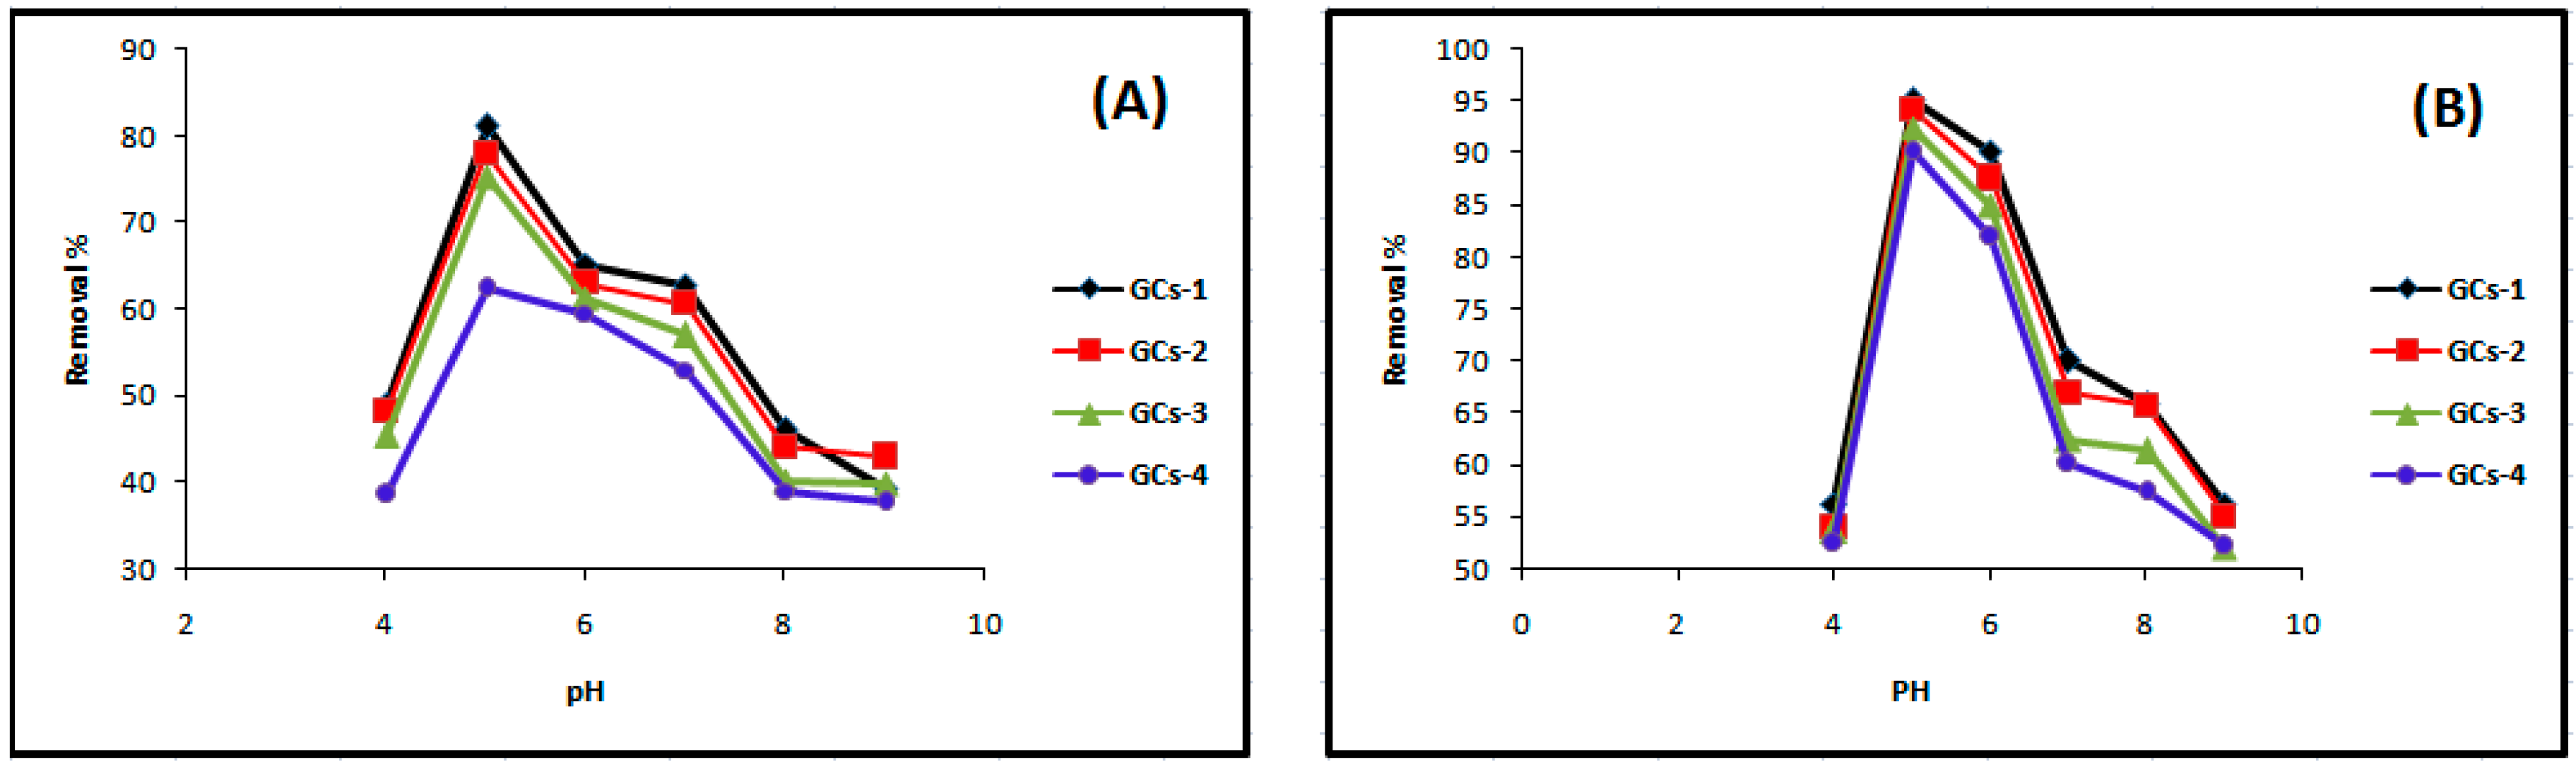
The effect of pH on the adsorption of Ni is presented in Figure 3A. The pH of the aqueous solution is an important parameter in the adsorption process because it affects the concentration of the counter ions on the functional groups of the adsorbent, the solubility of the metal ions and the degree of ionization of the adsorbate during reaction [12]. The active sites on an adsorbent can either be protonated or deprotonated depending on the pH while at the same time the adsorbate speciation in solution depends on the pH too.
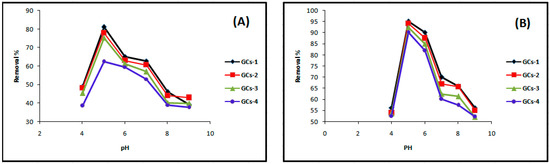
Figure 3.
Influence of pH on (A) nickel and (B) copper sorption.
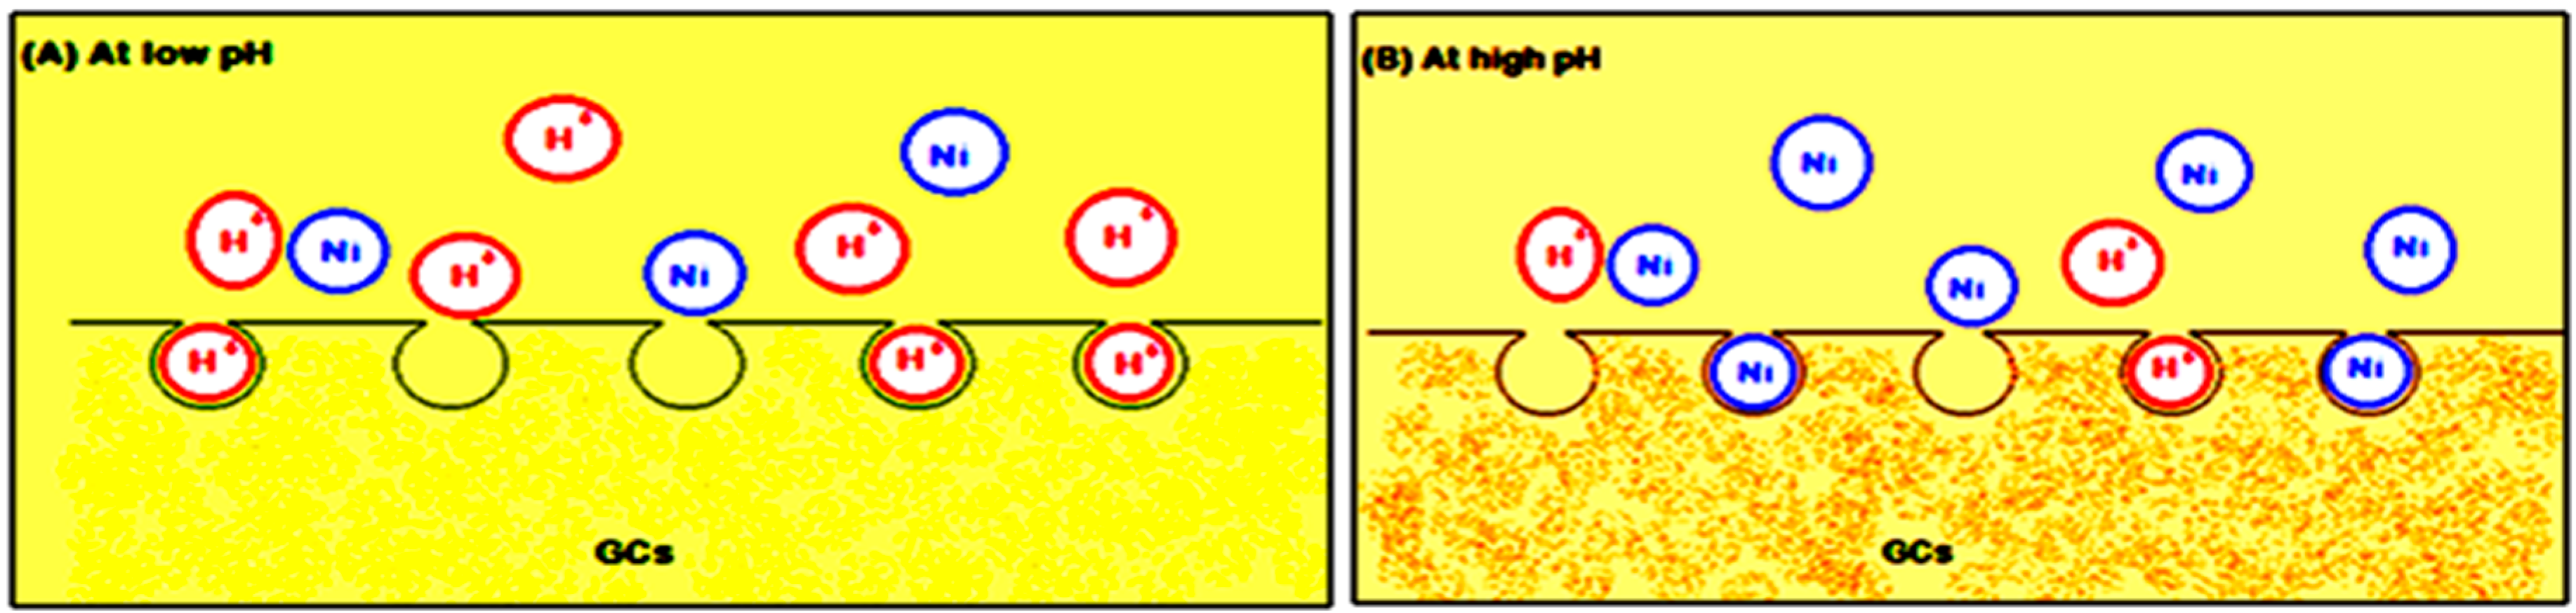
At low pH (2–4), less metal ion uptake was observed due to the competitive adsorption of the H+ and Ni(II) ions on the G-chitosan compounds surface. At low pH values, the adsorbent is positively charged with higher H+ ion concentration, reducing the number of binding sites for metal ion (Figure 4). In addition, the protonation of amino groups in acidic solution induces an electrostatic repulsion of metal cations that reduces the number of binding sites available for metallic ions [13]. However, Ni(II) uptake increased as the pH increased to pH 9, as most active sites on the adsorbent are deprotonated resulting to a more net attractive force which is responsible for high nickel removal from aqueous solution. The optimum adsorption takes place at pH 5. Further increase in pH leads to the precipitation of nickel hydroxide complexes which inhibits the adsorption process.
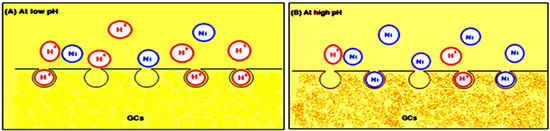
Figure 4.
Metal ion uptake (A) at low pH and (B) at high pH.
Figure 3B as shown above illustrated that pH obviously influenced the removal efficiency of the copper ions in the aqueous solution; the results indicated that Cu(II) removal was increased to maximum and then decreased with pH variation from 4 to 9 at 25°C and agitation speed of 100 rpm. The maximum % removal of Cu(II) was 95% at pH 5. The dominant species of copper was free Cu(II) and was mainly involved in the adsorption process when the pH was lower than 5. With the pH greater than 5, copper ions started to precipitate as Cu (OH) [13]. Increases in metal removal with increased pH can be explained on the basis of the decrease in competition between proton and metal cations, which results in a lower electrostatic repulsion between surface and metal ions. Decrease in adsorption at higher pH (>5) is due to the formation of soluble hydroxyl complexes [15].
2.7.3. Influence of Contact Time
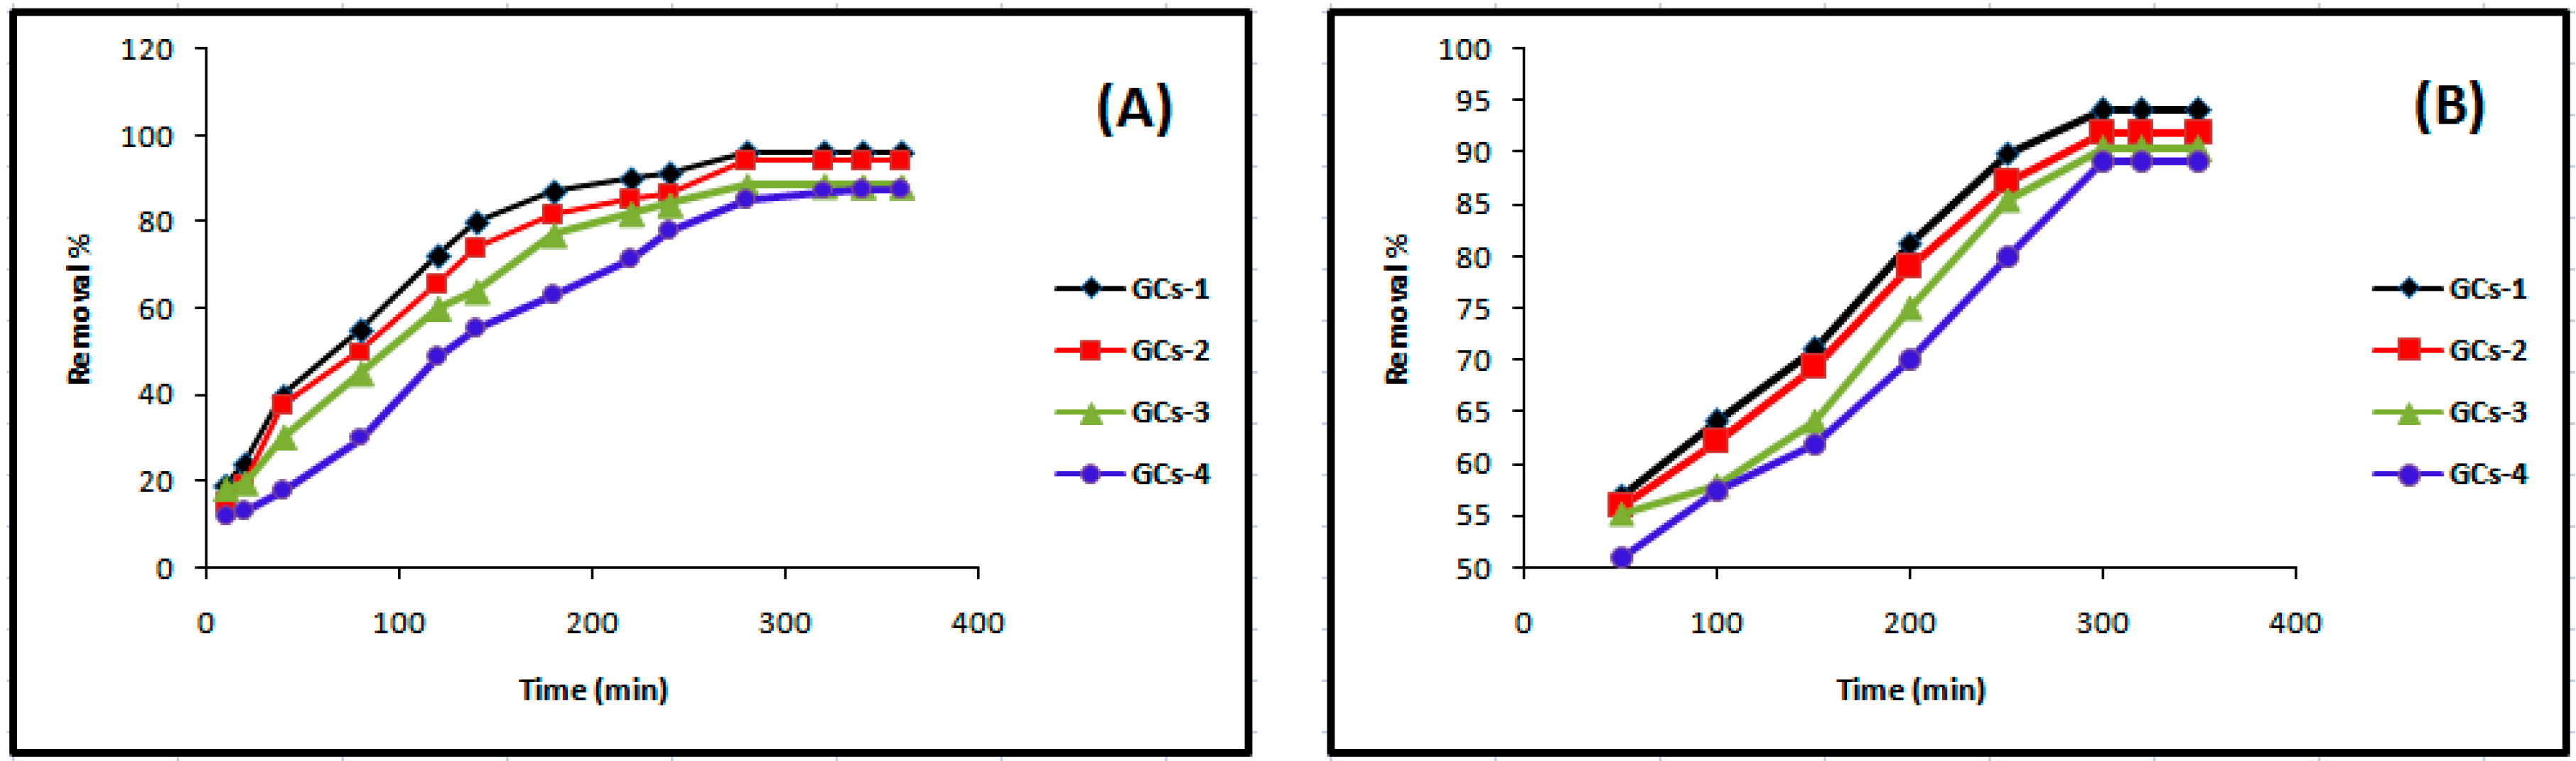
Contact time is one of the effective factors in the batch adsorption process. Keeping other parameters including temperature (25 °C), pH 5, adsorbent dose (1 g/100 mL), initial nickel concentration (200 mg/L) and agitation speed (250 rpm) constant, the adsorption of nickel on glutamic-chitosan compounds was studied in the range 10–360 min. The effect of contact time on nickel adsorption efficiency is shown in Figure 5A. Adsorption rate initially increased rapidly, and the optimal removal efficiency was reached within 280 min. No change in nickel concentration after 280–360 min was observed. The availability of sufficient vacant adsorbing sites in the beginning of the removal process is possibly the cause of the higher initial removal; afterwards, the removal percent rate decreased due to the limited vacant adsorption sites.
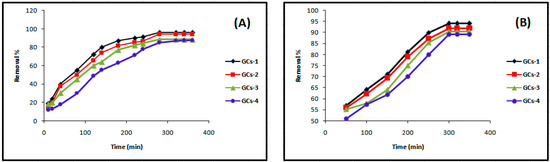
Figure 5.
Influence of contact time on (A) nickel and (B) copper sorption.
Figure 5B indicates that Cu(II) removal was increased from 50% to 92% as the contact time varied from 10 min to 360 min. The optimum contact time for maximum removal (92%) of Cu(II) was 300 min.
2.7.4. Influence of Initial Concentration
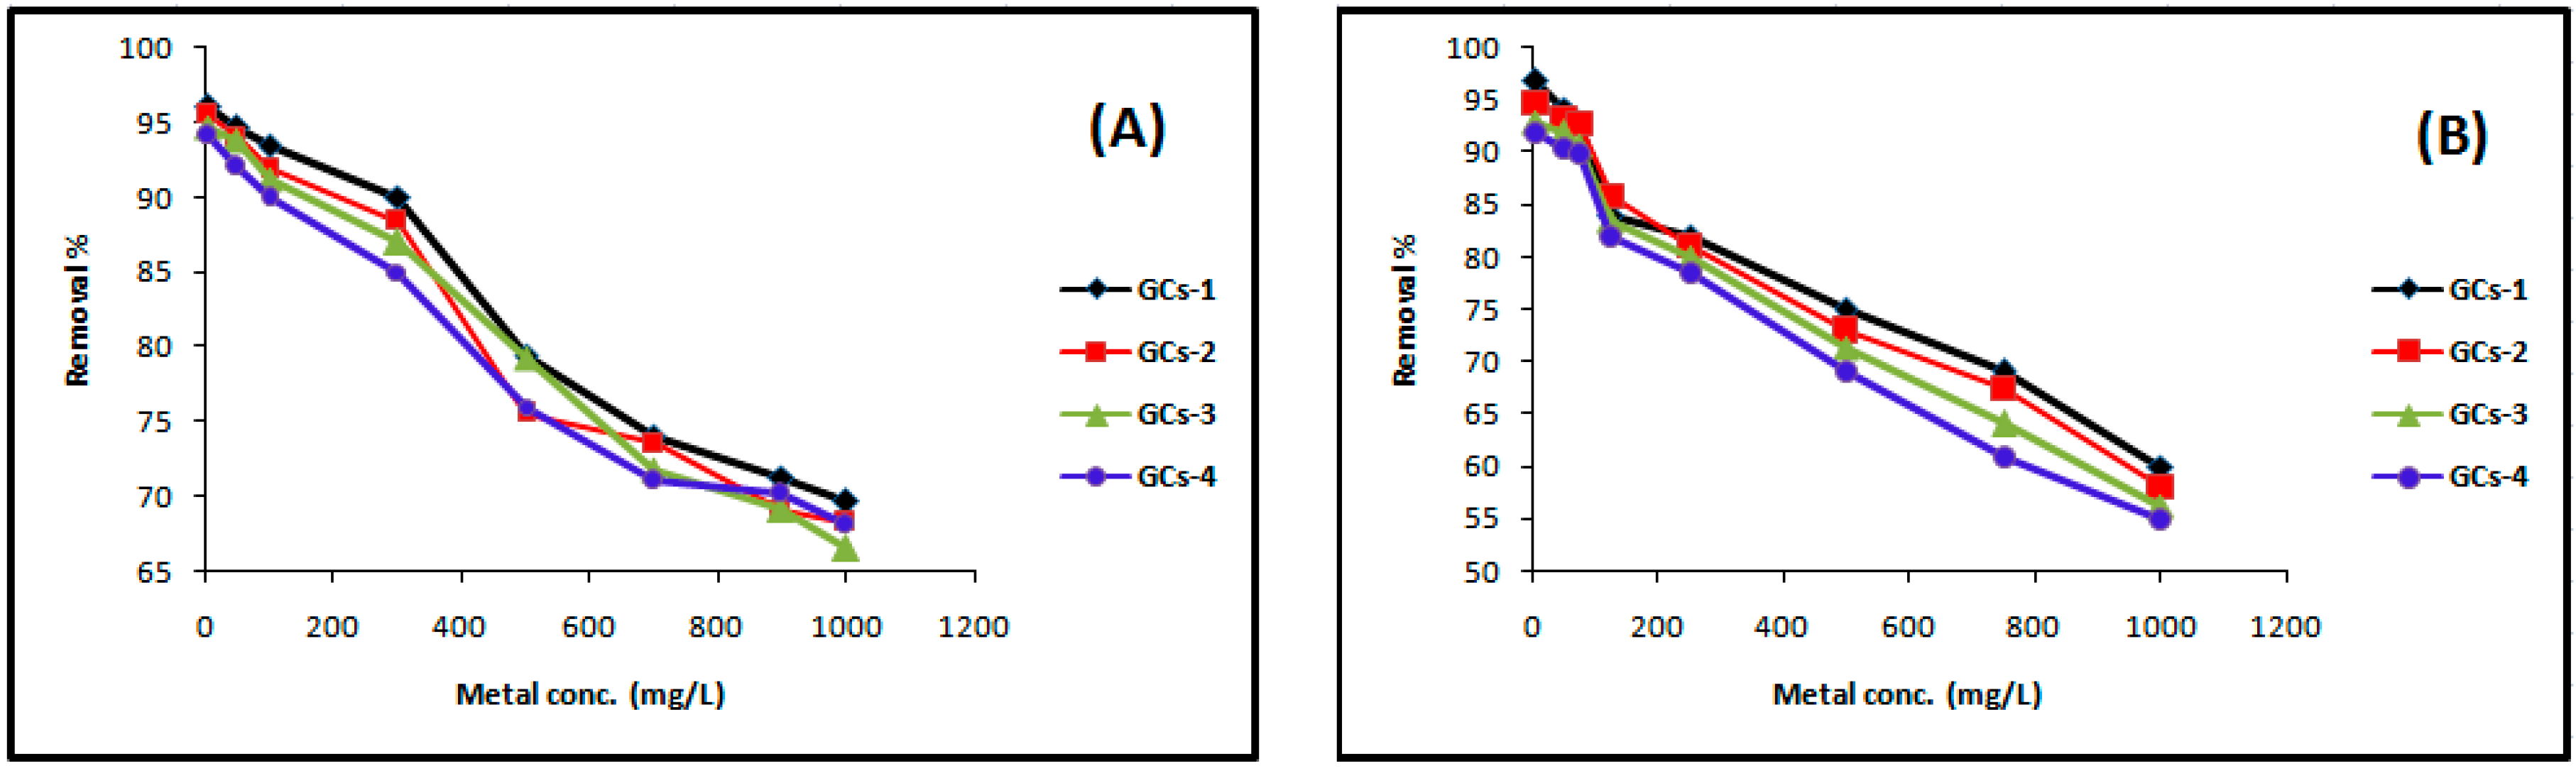
The experimental results of the effect of initial nickel concentration on removal efficiency are presented in Figure 6A. The experiment was conducted using the volumes of solutions as 100 mL, initial concentrations of metal as 5, 50, 100, 300, 500, 700, 900 and 1000 mg/L solution of Ni(II) in conical flasks, were gently shaken with 1 g of G-chitosan compounds for 60 min with 250 rpm in the orbit mechanical shaker, with initial pH of the solution 5. Figure 6A shows the nickel removal efficiency decreased with the increase in initial nickel concentration. In the case of low nickel concentrations, the ratio of the initial number of moles of nickel ions to the available surface area of adsorbent is large. However, at higher concentrations, the available sites of adsorption become fewer and hence the percentage removal of metal ions which depends on the initial concentration decreases [2]. The removal percentage decreases from 96% to 66% as the concentration increases.
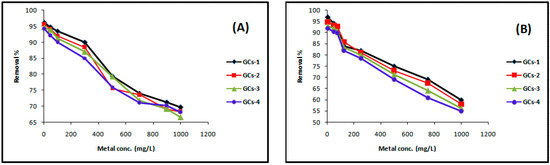
Figure 6.
Influence of the initial concentration on (A) nickel and (B) copper sorption.
The experimental results of the effect of initial copper concentration on removal efficiency were presented in Figure 6B, which showing that the copper removal efficiency decreased with the increase in initial copper concentration [19]. The removal percentage decreases from 92%–55%, 93%–56%, 95%–58% and 97%–60% as the concentration increases.
2.8. Sorption Isotherm Studies
2.8.1. Langmuir Sorption Isotherm
The maximum amount of Ni(II) or Cu(II) ion adsorption on the modified polymer is defined by the corresponding adsorption isotherms [17]. The Langmuir isotherm is based on the assumption that the adsorbent surface has sites with identical energy and has equal affinities for the adsorbate molecules, which mean that each adsorbate molecule is assumed to be located on a single site. Langmuir model predicts the formation of the monolayer of the adsorbate [20]. The experimental adsorption data are fitted according to the Langmuir isotherm models, from the equation:
where Ce is the equilibrium concentration of the adsorbate (mg/L), Qm is the maximum adsorption capacity of the adsorbent and KL is the Langmuir adsorption constant related to capacity and energy of adsorption, respectively; Qe is the adsorption quantity (mg/g) which calculated by the following equation:
where C0 is the initial Ni(II) or Cu(II) concentration (mg/L), C is final concentration after the adsorption; V is the solution volume (L); and W is the weight of the used adsorbent (g).
Ce/Qe = Ce/Qm + 1/(KL × Qm)
Qe = [(C0 – C)V]/W
Figure 7 shows the Langmuir adsorption isotherm of adsorption of nickel ions on chitosan derivatives GCs-1, GCs-2, GCs-3 and GCs-4 using Ni(II) concentrations (100–1300 mg/L) at pH 5 and 1 g of adsorbent, where Figure 8 shows the Langmuir adsorption isotherm of adsorption of copper ions on chitosan derivatives GCs-1, GCs-2, GCs-3 and GCs-4 using Cu(II) concentrations (75–1300 mg/L) at pH 5 and 1 g of adsorbent.
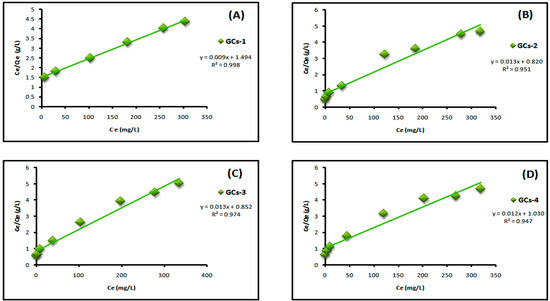
Figure 7.
Langmuir isotherm for Ni(II) adsorption using (A) GCs-1; (B) GCs-2; (C) GCs-3 and (D) GCs-4.
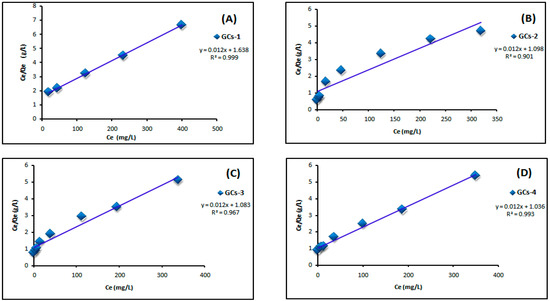
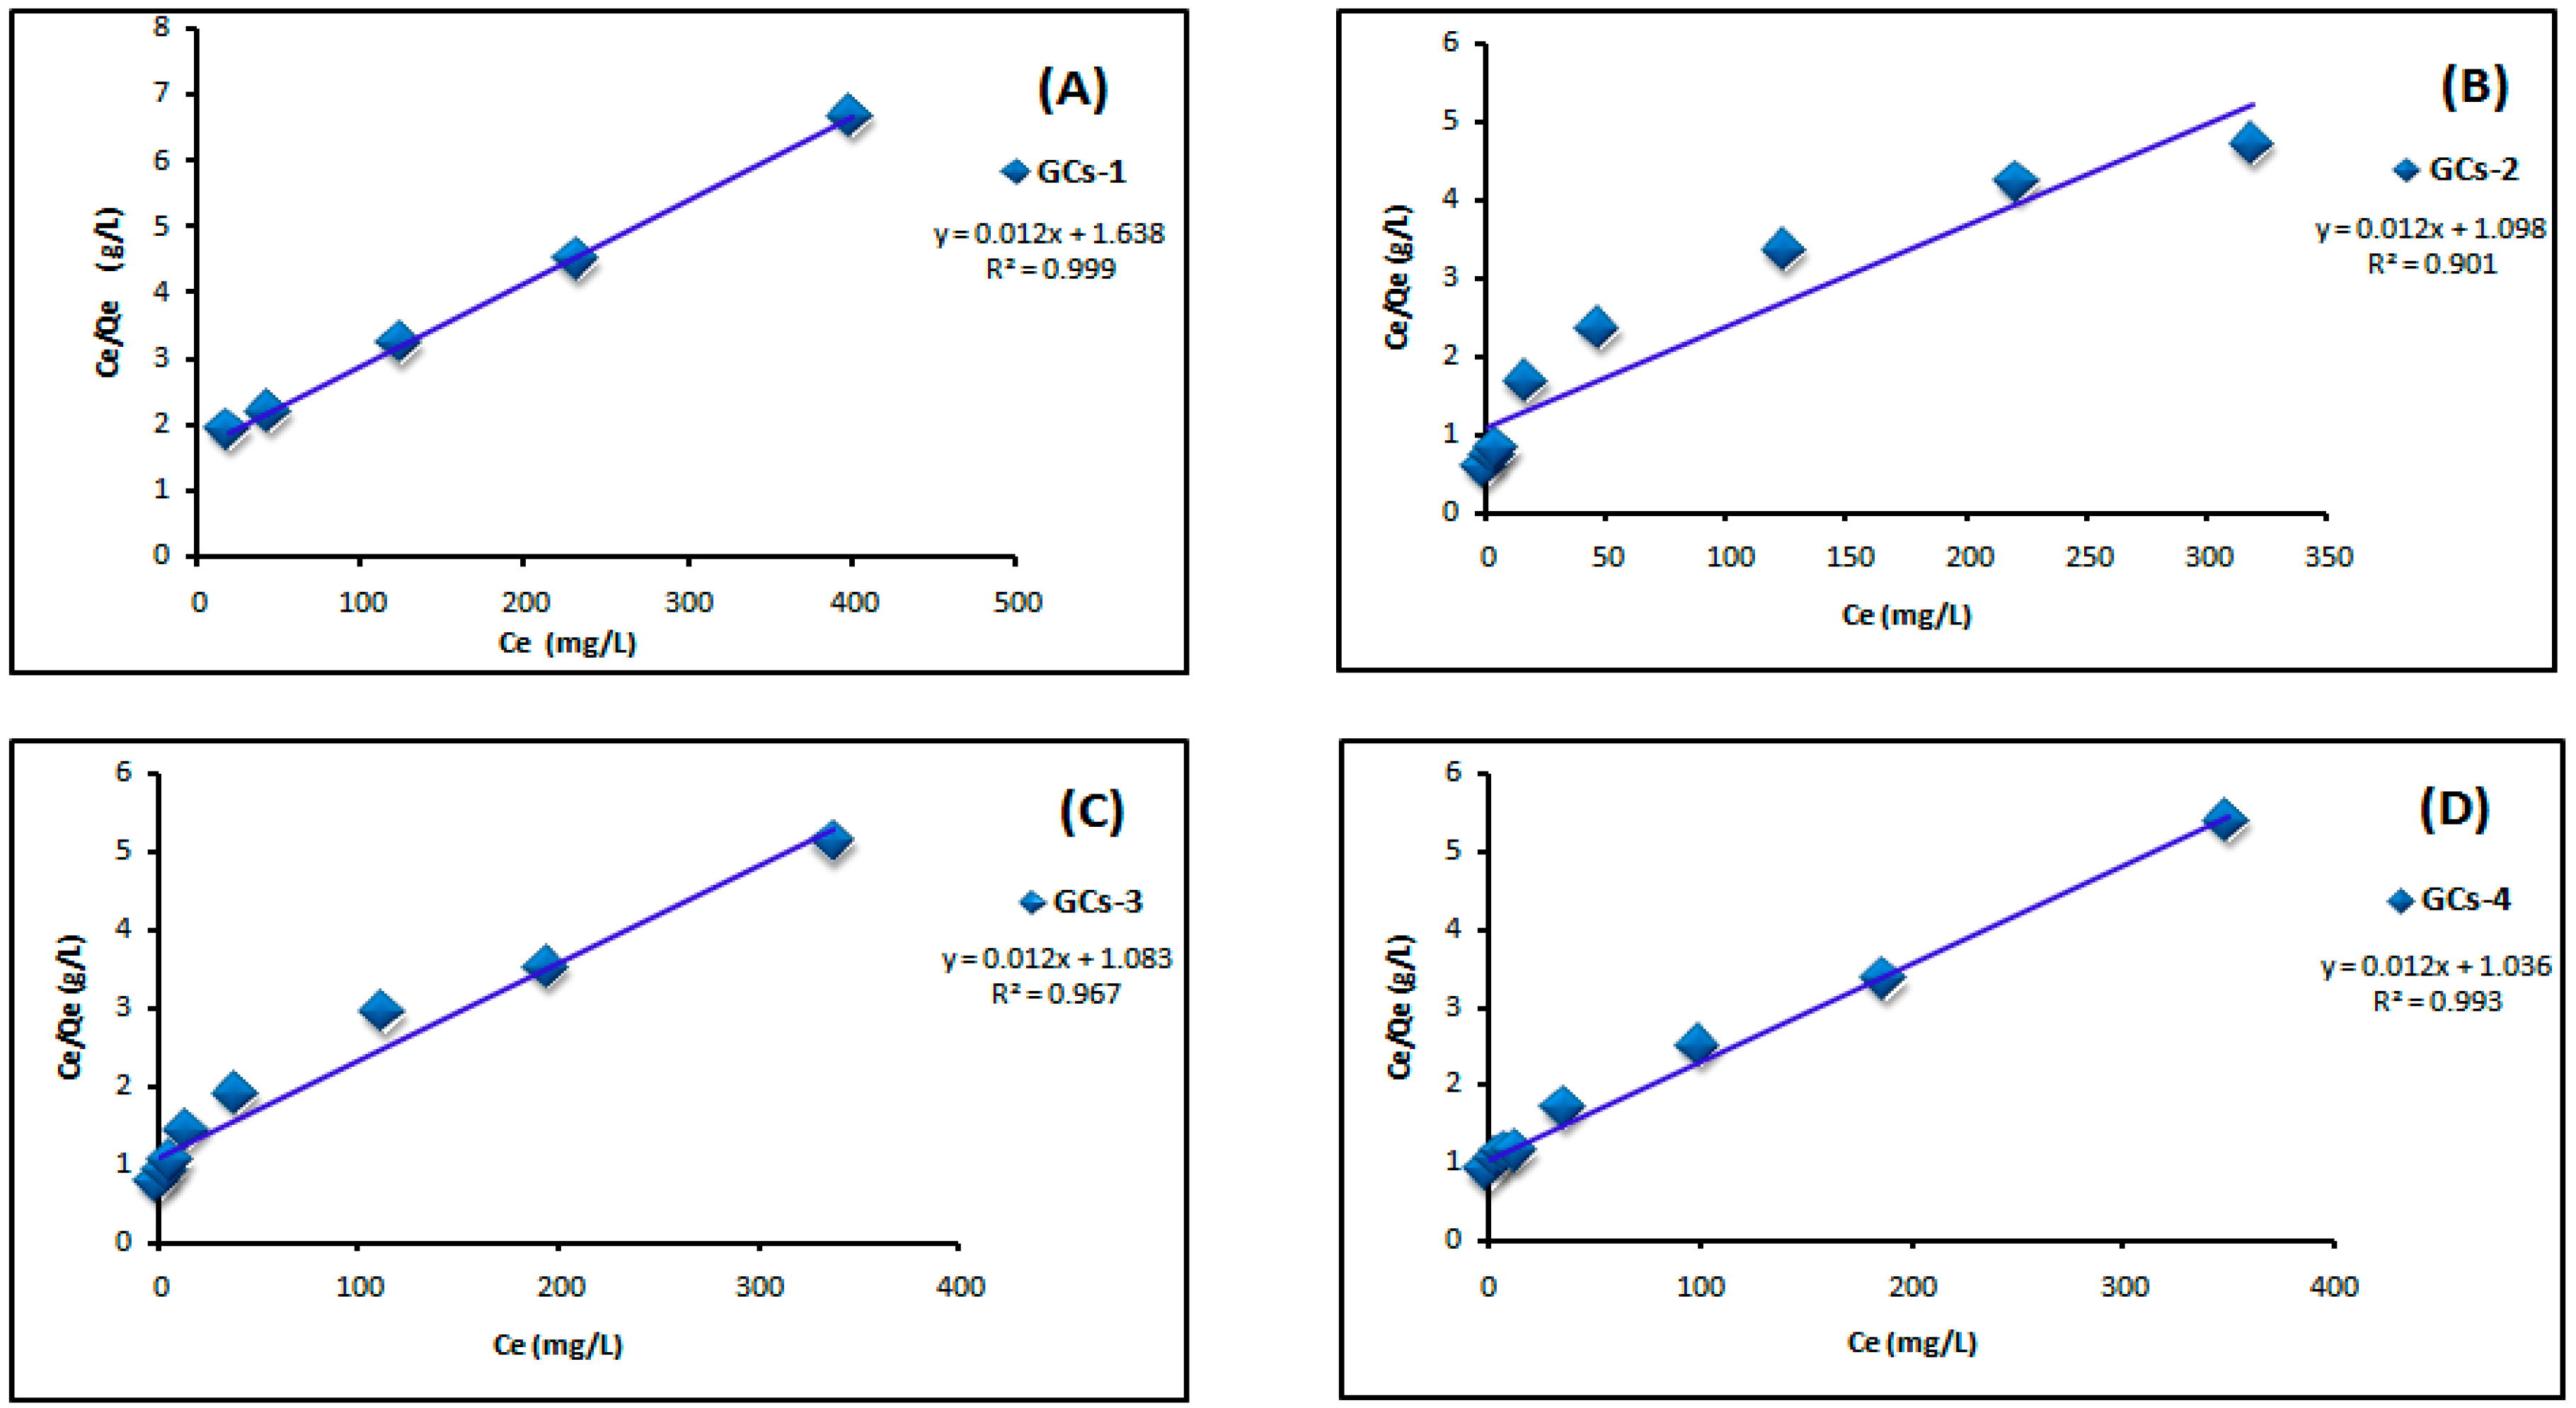
Figure 8.
Langmuir isotherm for Cu(II) adsorption using (A) GCs-1; (B) GCs-2; (C) GCs-3 and (D) GCs-4.
By plotting Ce/Qe versus Ce as shown in Figure 7 and Figure 8 for nickel and copper, respectively; it was found that the experimental adsorption data are fitted according to the Langmuir isotherm models with correlation coefficient values R2 = (0.998, 0.951, 0.974, 0.947) and (0.999, 0.901, 0.967, 0.993) for Ni(II) and Cu(II), respectively. Both Qm and KL can be calculated from the slope and the intercept of the linear plot in which; slope = 1/Qm and intercept = 1/Qm × KL. The fitting result showed that the maximum sorption capacity Qm of polymer adsorbent reached 103.4 mg/g in case of Ni(II) and 83.33 mg/g in case of Cu(II), these results confirm the applicability of Langmuir model which suggests that the adsorption was taken place as mono layer adsorption.
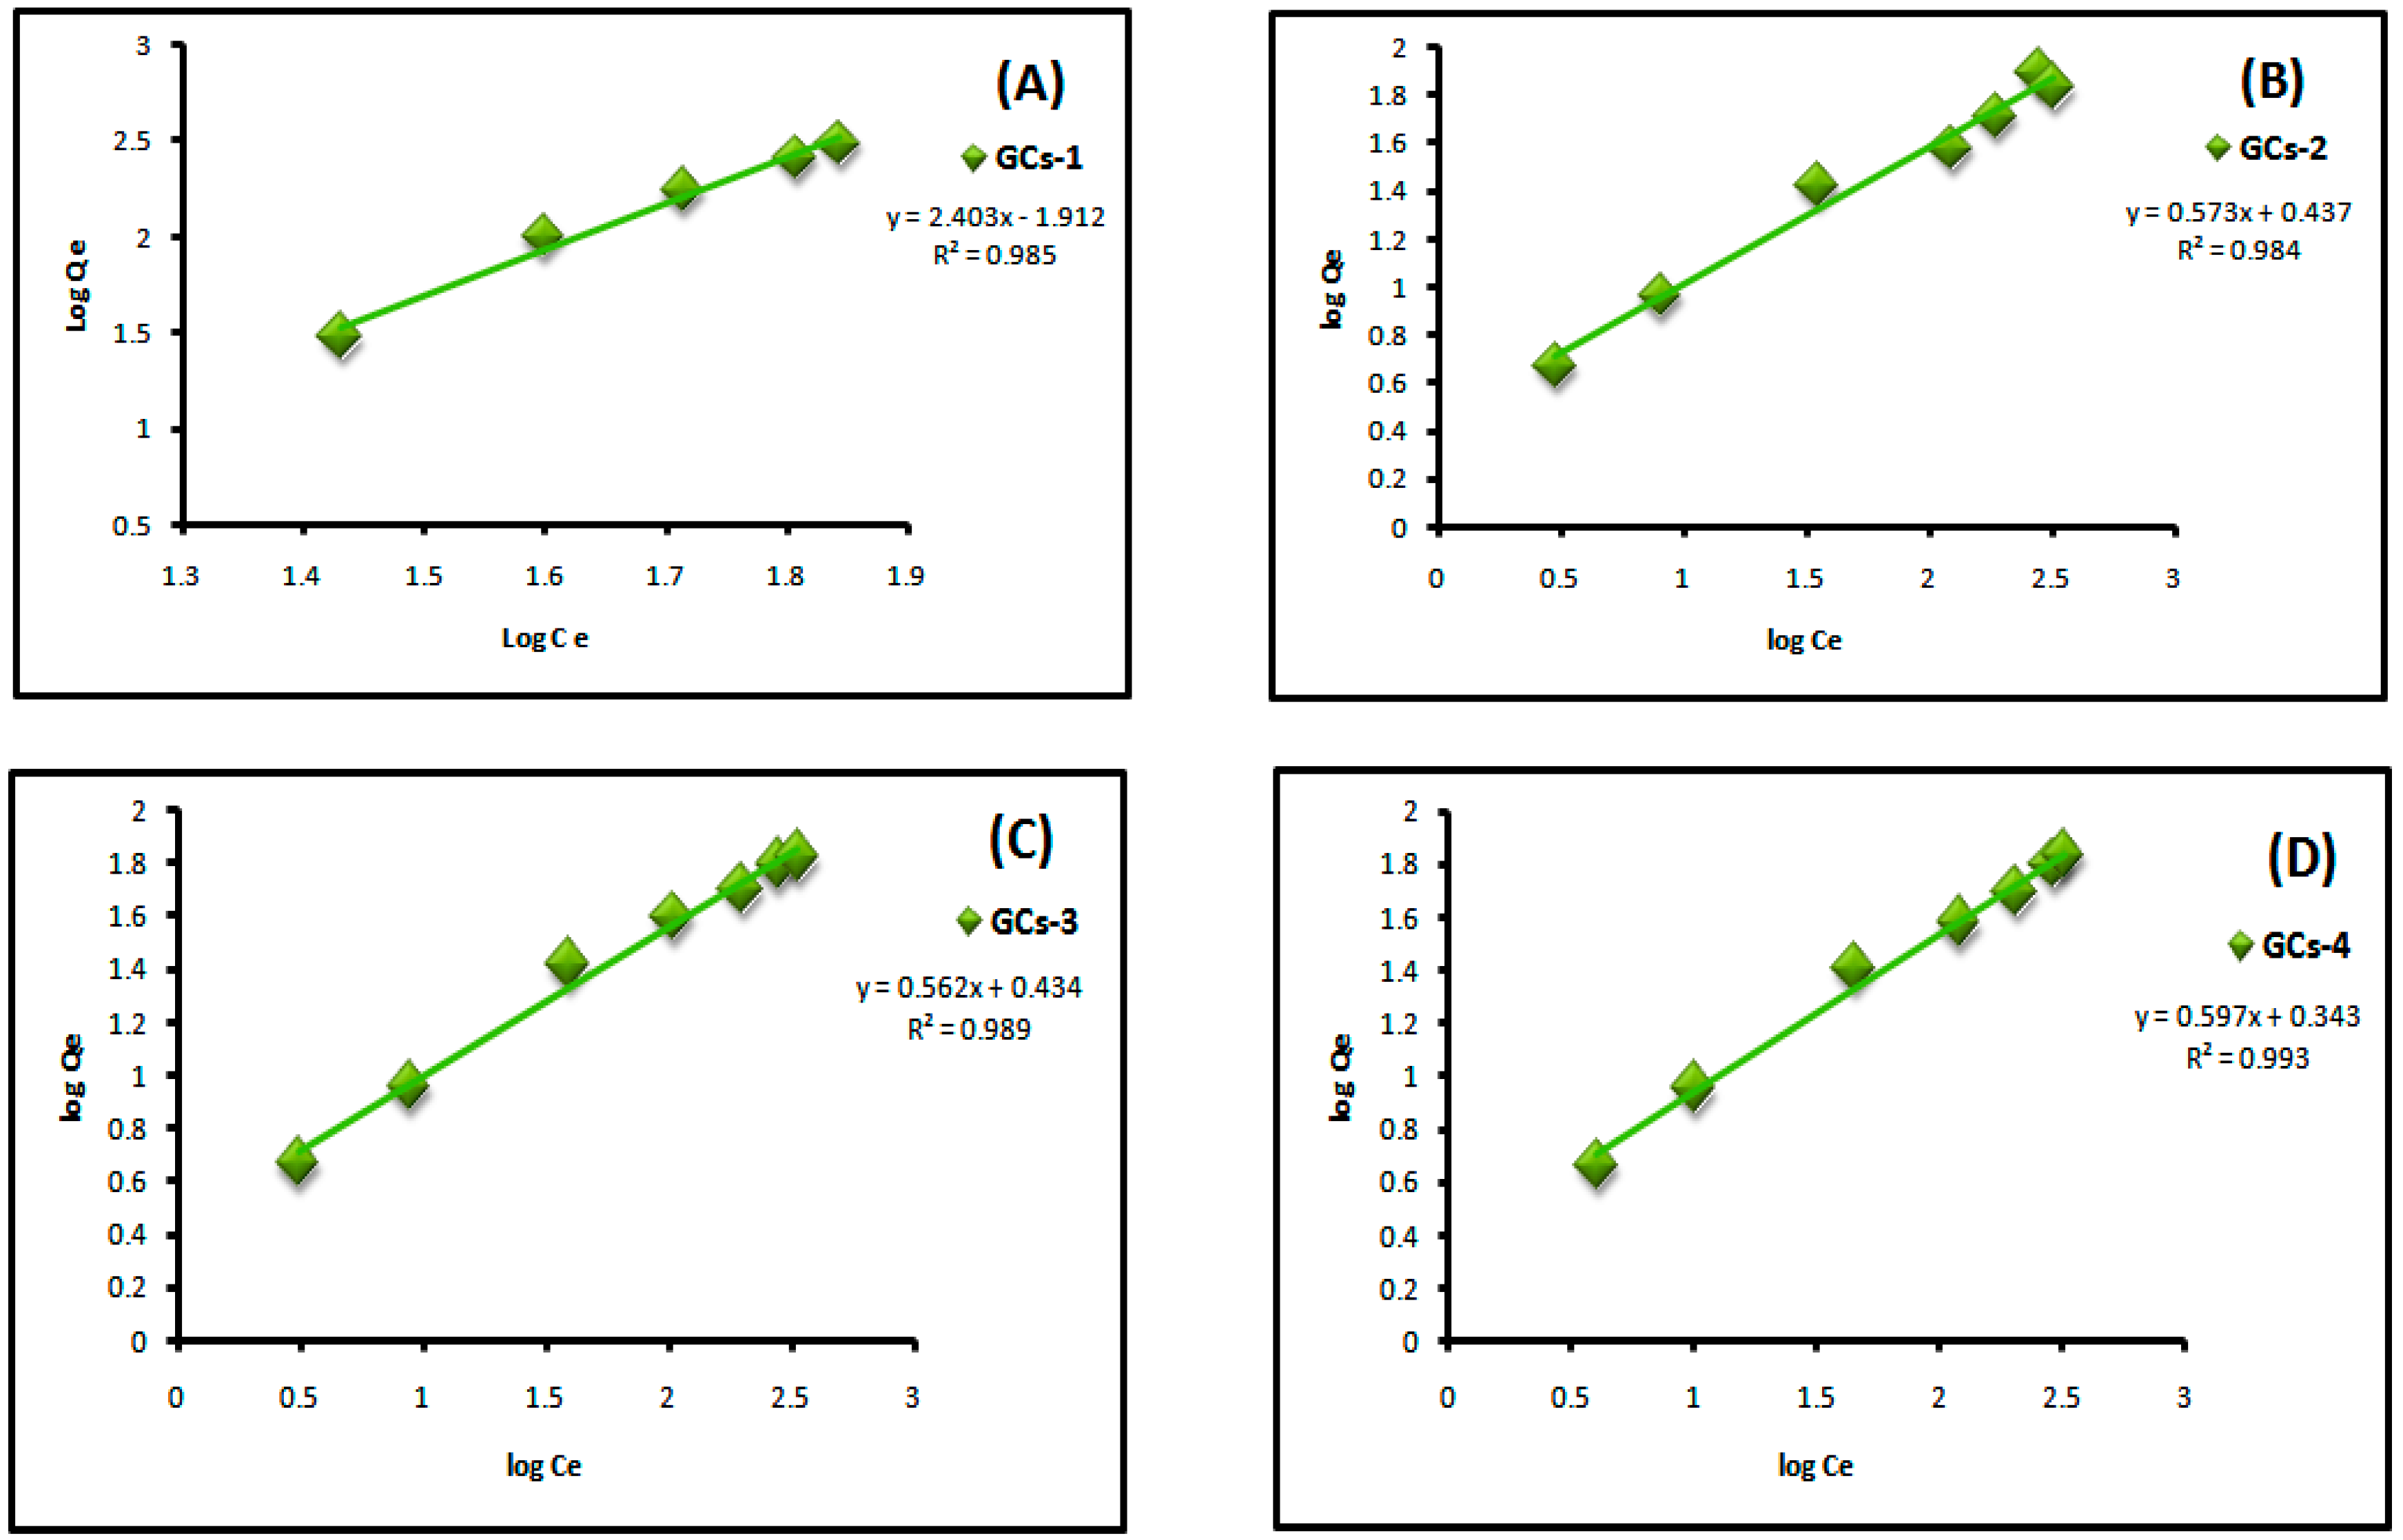
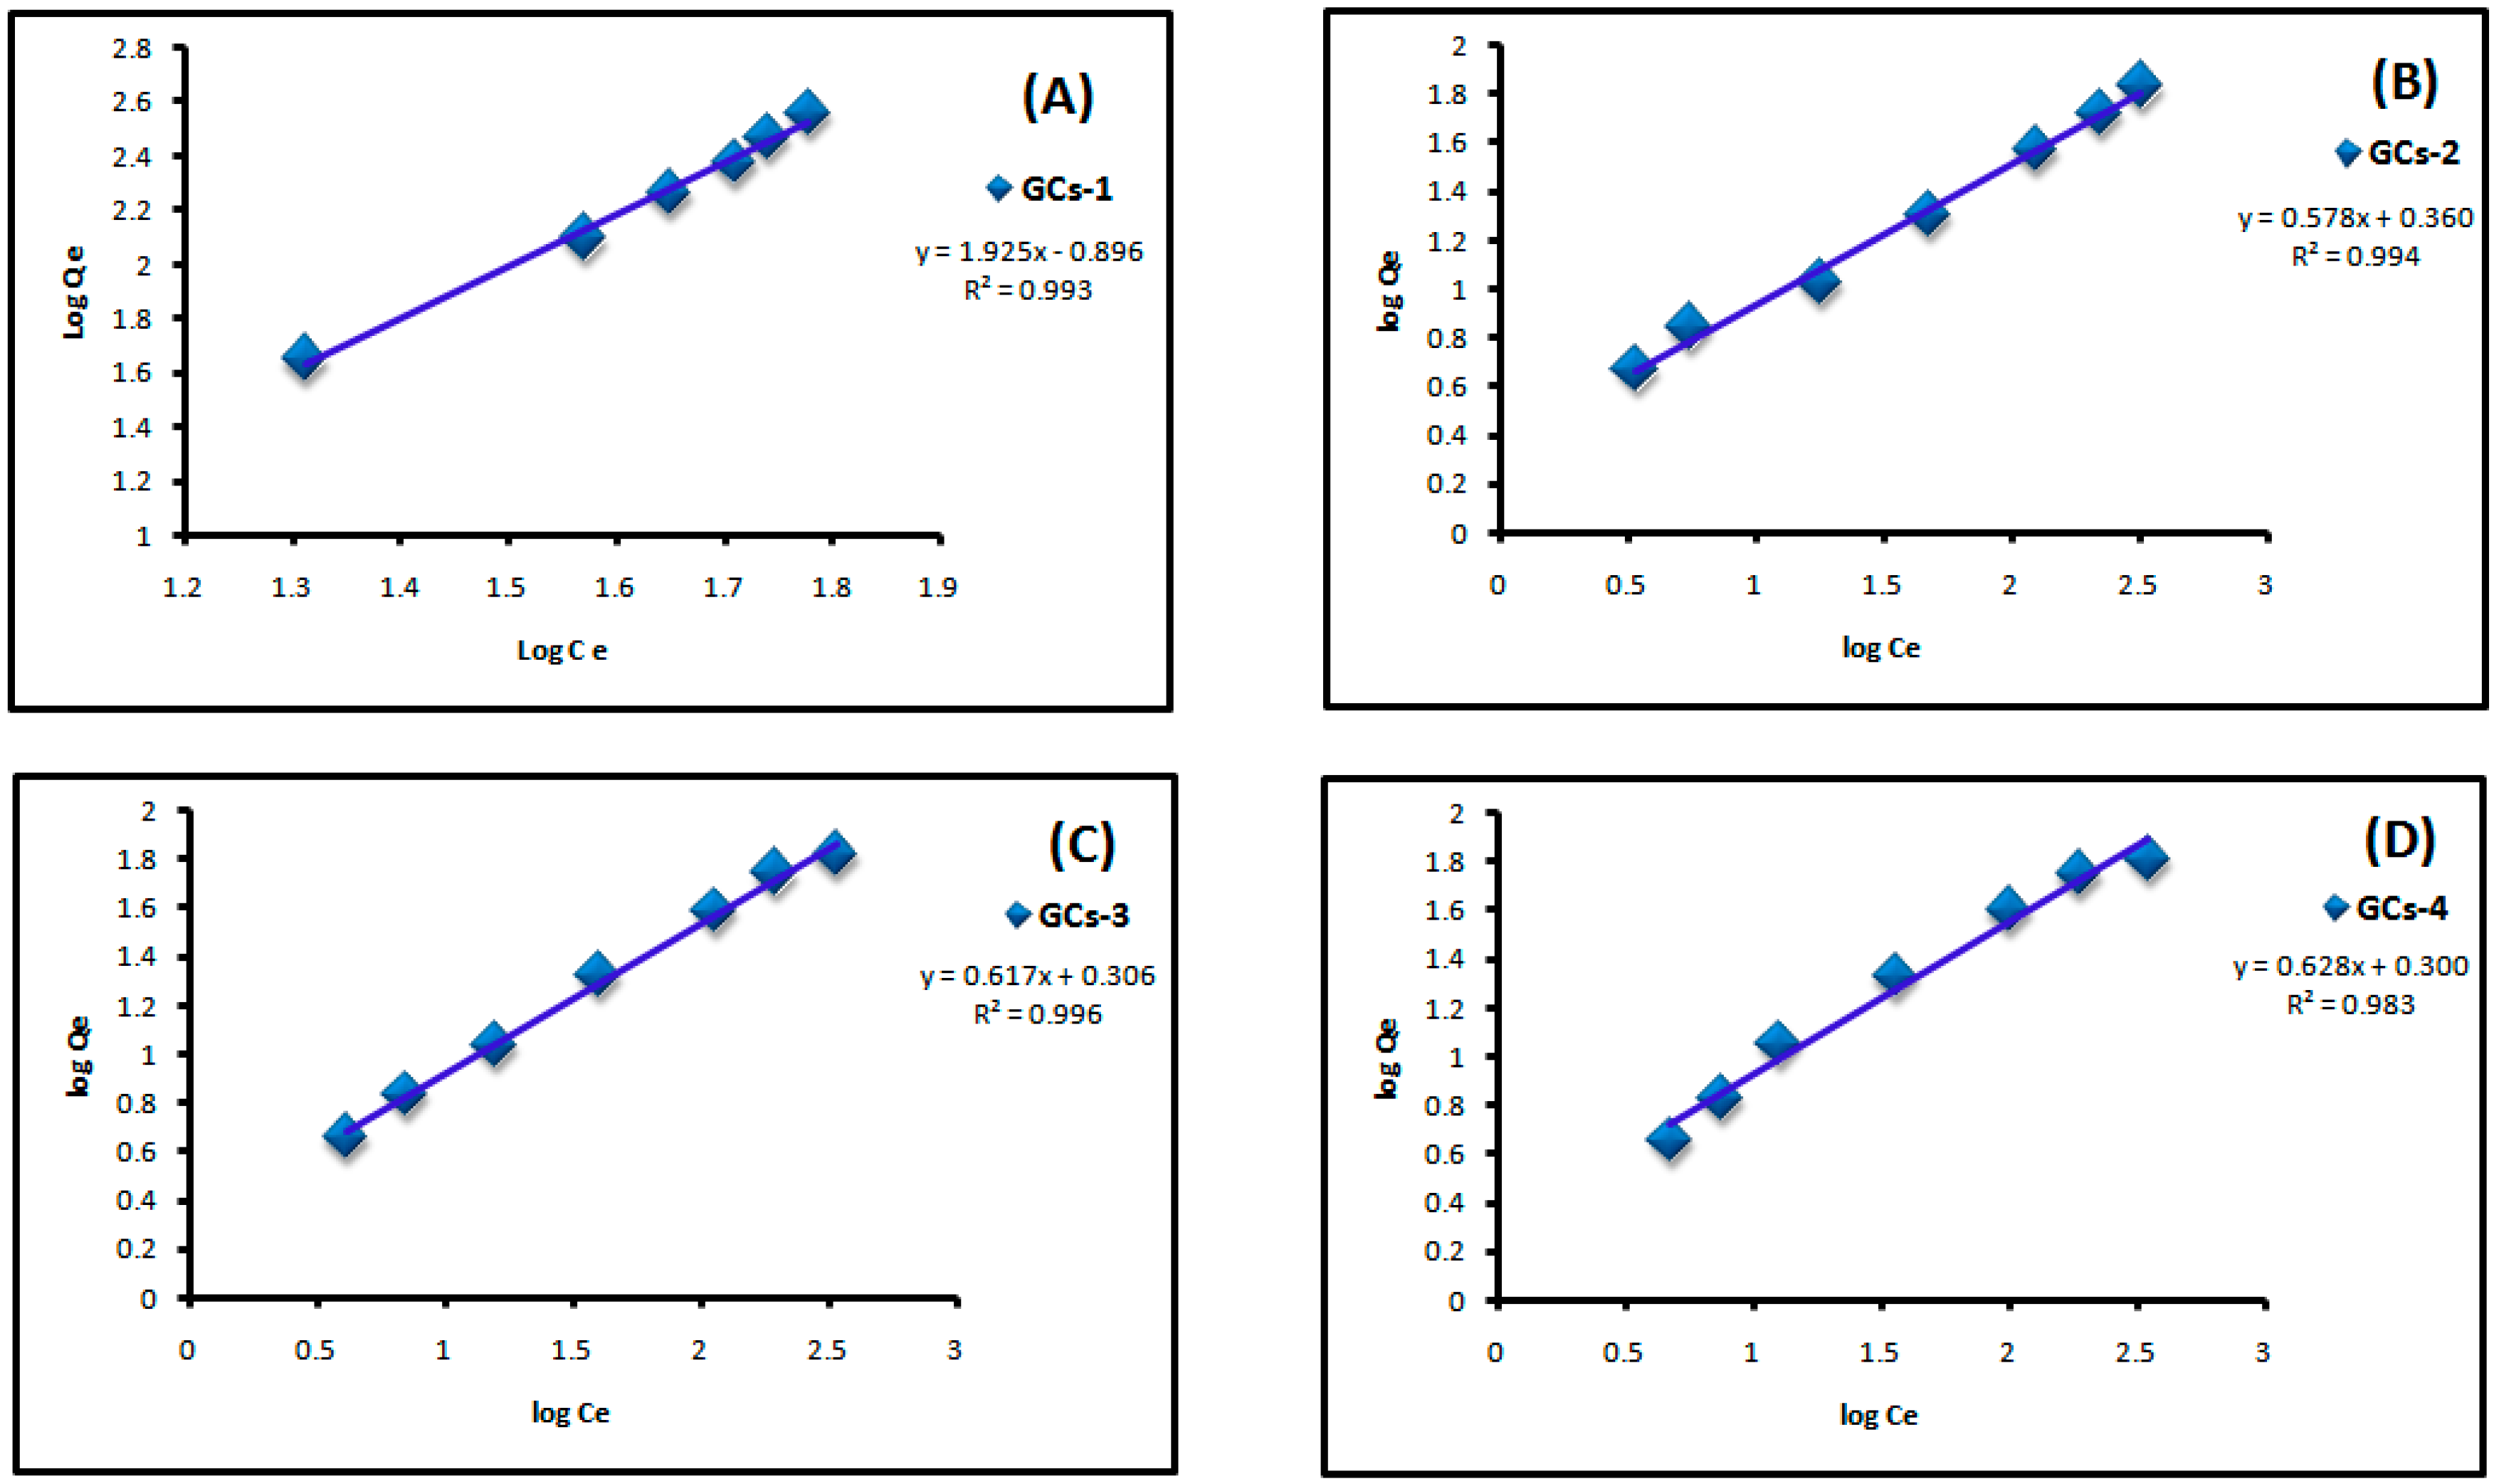
2.8.2. Freundlich Sorption Isotherm
Surface heterogenty of the sorbent is indicated from Freundlich model which represented by the following equation:
where Qe is the adsorbed amount at equilibrium (mg/g), Ce is the equilibrium concentration of Cu(II) or Ni(II) (mg/L), Kf is Freundlich constant, 1/n is Freundlich exponent. Both constants were calculated from the slope and intercept of the plotting between log Qe and log Ce. Linear plot of log Ce vs. log Qe confirm the applicability of Freundlich model as shown in Figure 9 and Figure 10. It means that the adsorption was taken place at a heterogeneous surface; however nickel and copper adsorption on glutamic-chitosan are fitted to both models since the correlation coefficients values are very close.
log Qe = log Kf + 1/n × log Ce
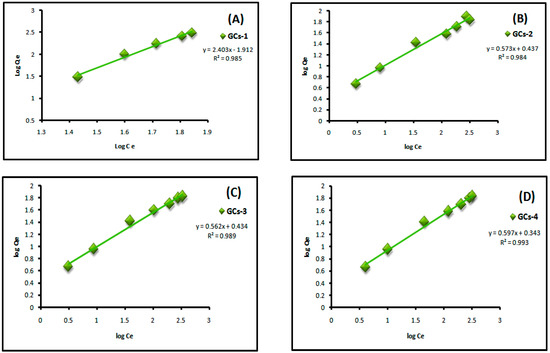
Figure 9.
Freundlich plot for Ni(II) adsorption on to (A) GCs-1; (B) GCs-2; (C) GCs-3 and (D) GCs-4.
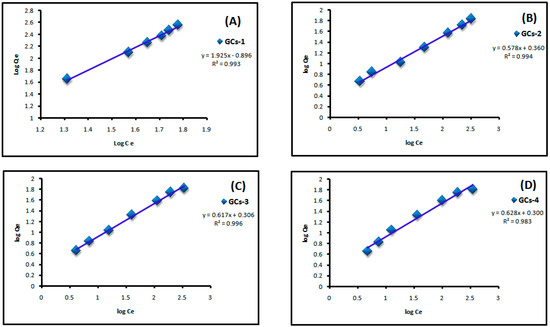
Figure 10.
Freundlich plot for Cu(II) adsorption on to (A) GCs-1; (B) GCs-2; (C) GCs-3 and (D) GCs-4.
2.9. Kinetics Studies
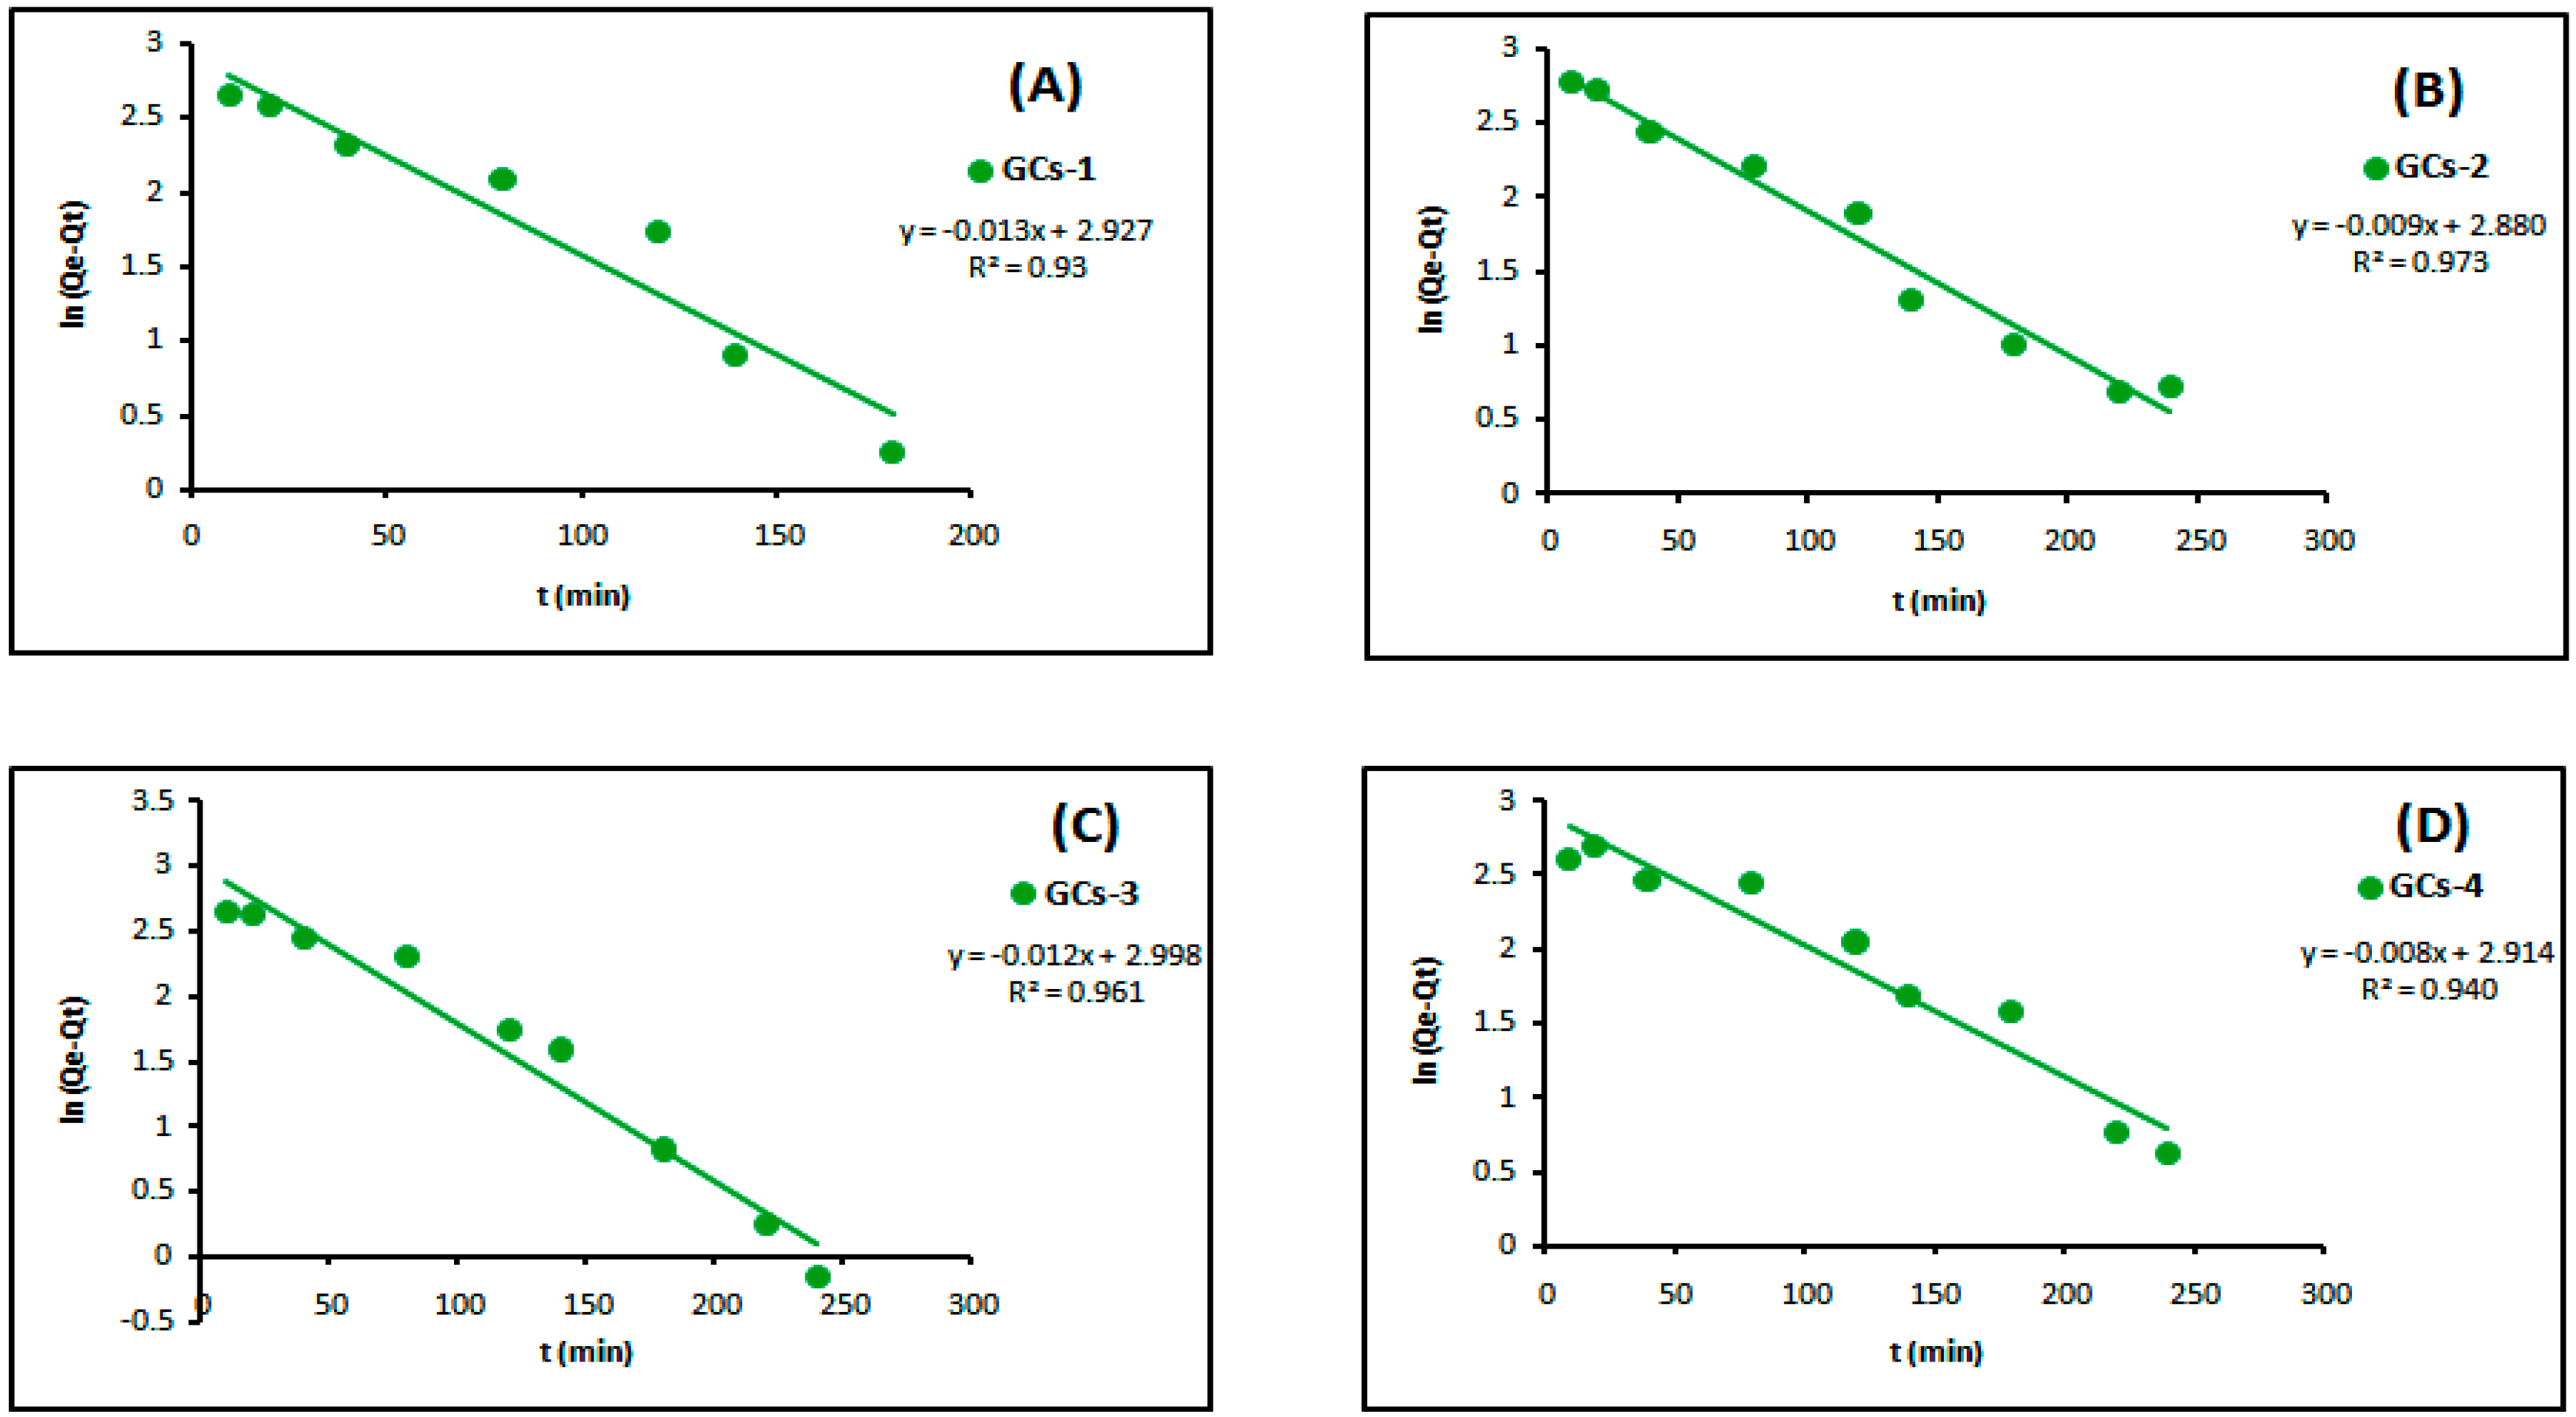
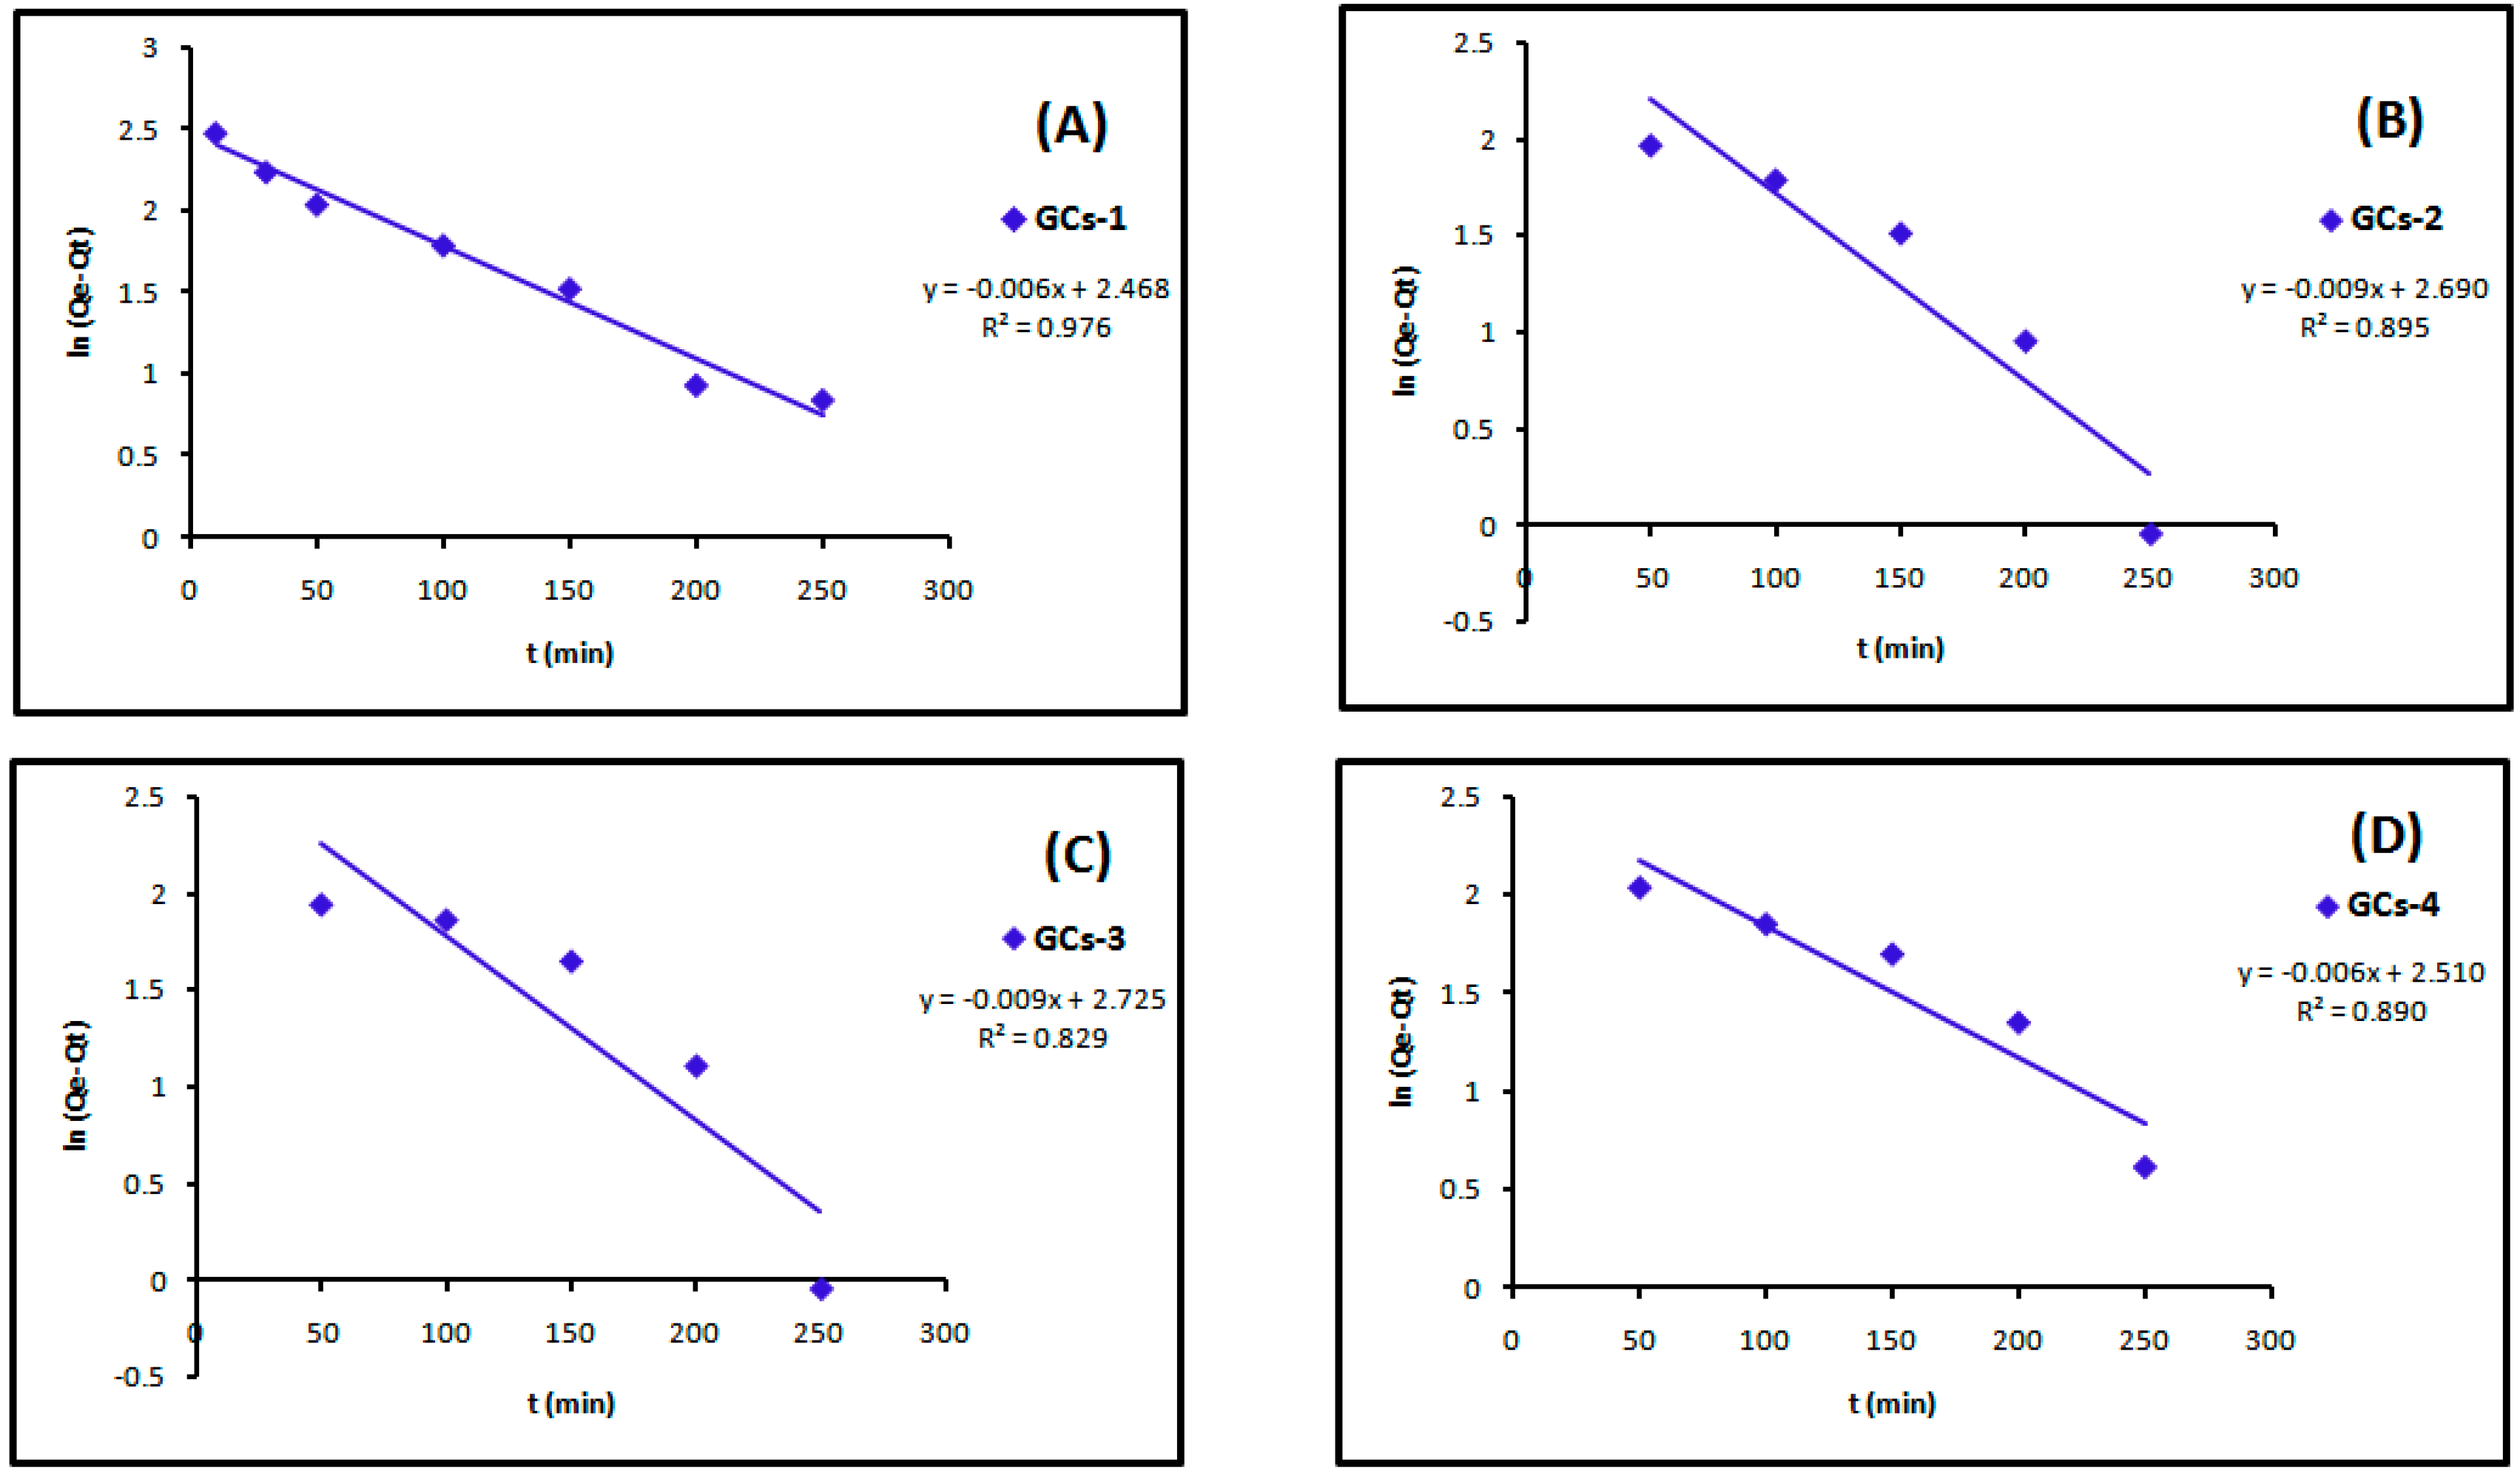
The kinetic parameters for the adsorption process were studied for contact time from 10 min to 360 min by monitoring separately the percentages of removal of the Cu(II) and Ni(II). Pseudo-first order kinetics are represented by Equation (4), while the pseudo-second order ones are represented by Equation (5) [20]:
where Qe and Qt: are the amount of metal adsorbed (mg/g) at equilibrium and at time t (min), k1 (min−1) and k2 (g·mg−1·min−1) are the adsorption rate constant of pseudo-first order, pseudo-second order adsorption kinetics, respectively. The values of k1 can be determined from the slope of the linear plot of ln (Qe − Qt) vs. t, and k2 can be calculated from the slope of the linear plot of t/Qt vs. t.
ln (Qe − Qt) = −k1t + ln Qe
t/Qt = 1/k2 × Qe2 × t + t/Qe
The linear plots of the two kinetic models of Ni(II) are presented in Figure 11 and Figure 12, respectively. Table 3 showed the values of k1, k2, Qe and the correlation coefficient (R2) from the linear plots. The pseudo-second order linear plots of Ni(II) resulted in higher R2 values than the pseudo-first order. These indicated better applicability of the pseudo-second order model, which relies on the assumption that chemisorptions are the rate limiting step.
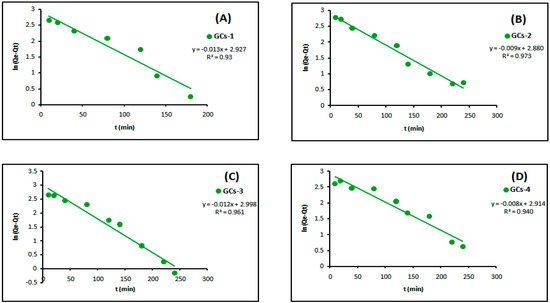
Figure 11.
Pseudo-first order kinetics models of nickel adsorption using (A) GCs-1; (B) GCs-2; (C) GCs-3 and (D) GCs-4.

Figure 12.
Pseudo-second order kinetics models of nickel adsorption using (A) GCs-1; (B) GCs-2; (C) GCs-3 and (D) GCs-4.
Table 3.
Constants and correlation coefficient of pseudo-first order and pseudo-second order kinetics of nickel adsorption.
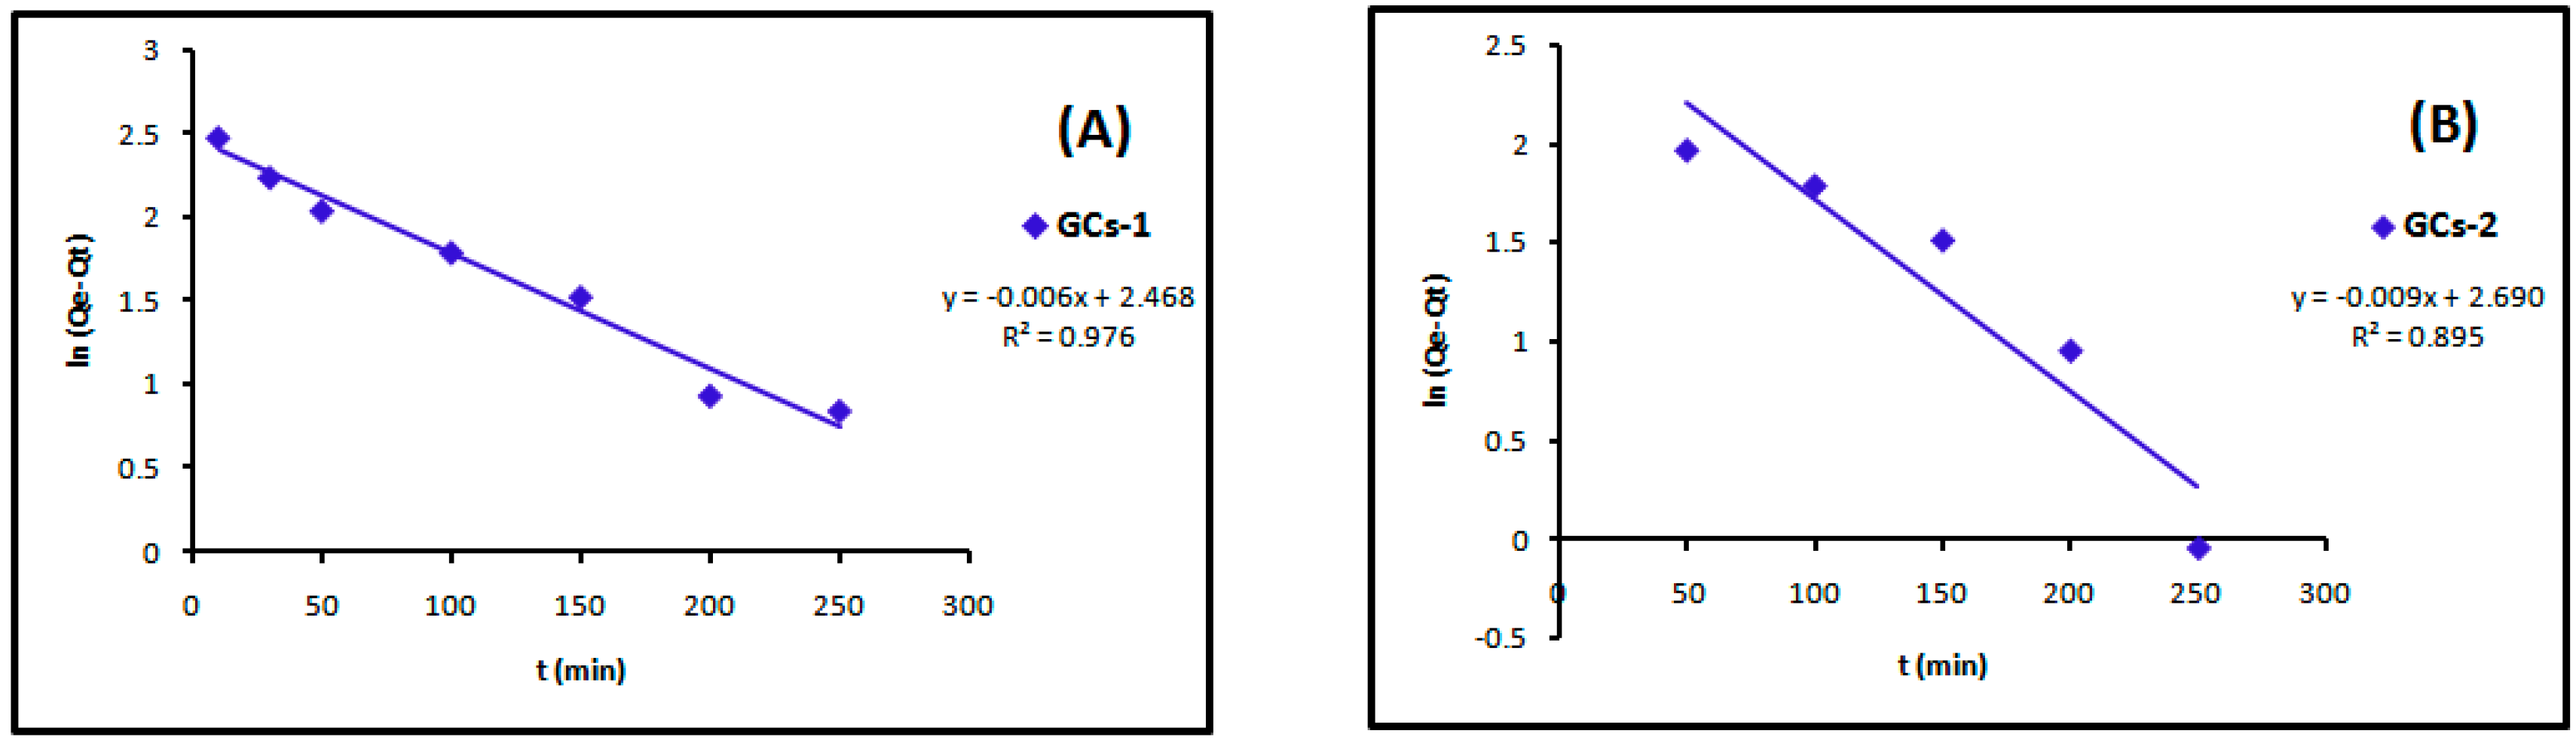
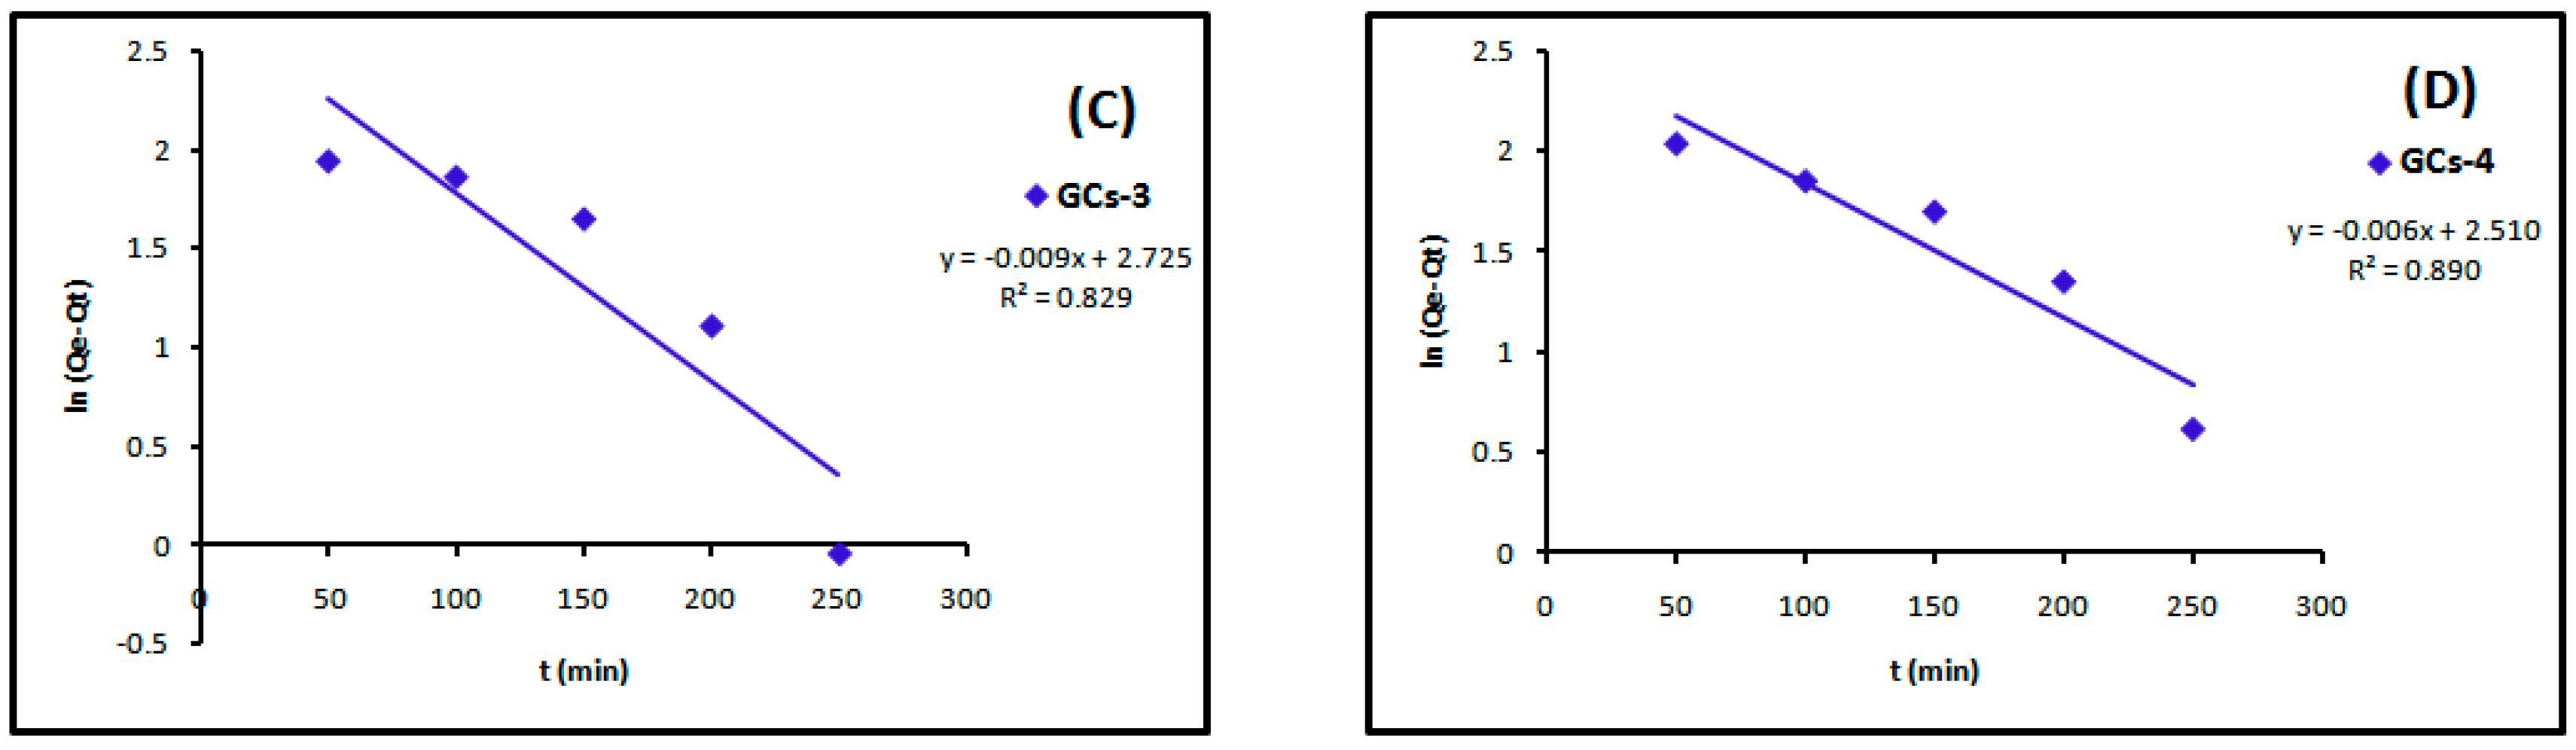
The linear plots of the two kinetic models of Cu(II) are presented in Figure 13 and Figure 14. Table 4 showed the values of k1, k2, Qe and the correlation coefficient (R2) from the linear plots. The pseudo-second order linear plots of Cu(II) resulted in higher R2 values than the pseudo-first order.
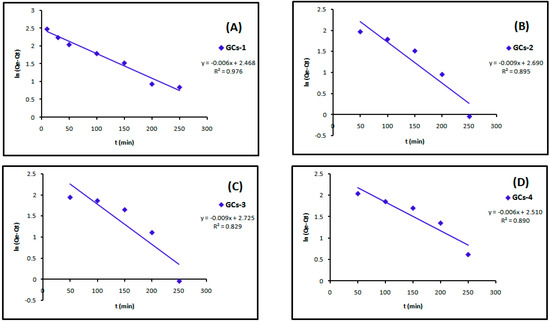
Figure 13.
Pseudo-first order kinetics models of copper adsorption using (A) GCs-1; (B) GCs-2; (C) GCs-3 and (D) GCs-4.
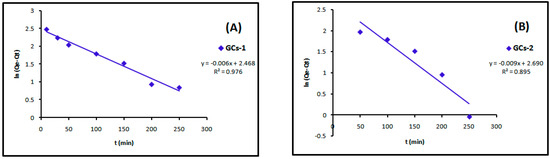
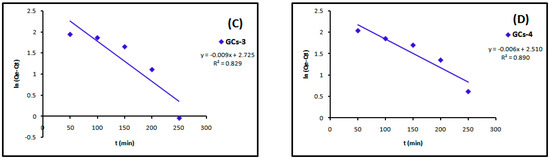
Figure 14.
Pseudo-second order kinetics models of copper adsorption using (A) GCs-1; (B) GCs-2; (C) GCs-3 and (D) GCs-4.
Table 4.
Constants and correlation coefficient of pseudo-first order and pseudo-second order kinetics of copper adsorption.
2.10. Desorption Studies of Ni(II) and Cu(II)
The sorbed Ni and Cu were dried and preserved. For desorption Cu and Ni-sorbed chitosan were shaken with dilute hydrochloric acid (0.5 M) for 1 h at room temperature and filtered. The filtrate was analyzed for the oxidation states of Cu and Ni using UV-Visible spectrophotometry in the wavelength ranges 190 nm–1100 nm.
3. Materials and Methods
3.1. Materials
Chitosan was purchased from Acros Organics (Morris Plains, NJ, USA). Its deacetylation degree is 88% and its average molecular weight is 100,000–300,000 Da. Glutamic acid, acetic acid, and methanol, were of analytical grade from Aldrich (Saint Louis, MO, USA) and used as received.
3.2. Measurements
Fourier transform infrared (FTIR) spectra were recorded using KBr discs on a Perkin Elmer spectrometer (Perkin-Elmer, Waltham, MA, USA) at room temperature in the range of 4000–400 cm−1. Elemental analyses of the prepared derivatives were done in a Model 2410-Series II C, H, N, S Analyzer (Perkin-Elmer, Shelton, CT, USA). 1H-NMR spectra were recorded using a Gemini-300 MHz instrument (Gemini, Palo Alto, CA, USA), in DMSO-d6 as a solvent at 25 °C. Chemical shifts (δ) are expressed in parts per million (ppm) from tetramethylsilane as an internal standard. The morphology of the cross-linking gel was analyzed with a JEOL-JSM 5300 Scanning electron microscope (JEOL, Tokyo, Japan); metal solutions were analyzed using a Model U-2800 UV-Visible spectrophotometer (Hitachi, Schaumburg, IL, USA). Ni(II) and Cu(II) concentrations were measured using a Thermo-Scientific ICE-3300 Atomic adsorption spectrometer AAs (Thermo-Scientific, Waltham, MA, USA).
3.3. General Procedures for Chitosan-Glutamic Synthesis
A solution of glutamic acid in distilled water (20 mL) was added to chitosan (20 mmol) in distilled water (30 mL). The mixture was stirred for 4 h at 60 °C. After cooling, the homogenous cross-linked hydrogels which formed was submerged in methanol for 12 h for dewatering to give white product; the dewatering hydrogel was filtered and dried at 60 °C to constant weight.
G-chitosan-1: Obtained from glutamic acid (2.5 mmol) in 96.4% yield; IR (KBr): 1568 (CONH), 1631 (CONH), 2867, 2925 (NH2), 3437 cm−1 (NH), (OH); 1H-NMR (δ, ppm) (DMSO-d6) δ: 1.88 (q, 2H, CH2-glutamic), 2.11 (m, 1H, H-5′), 2.29 (m, 2H, H-1′, H-2′), 2.35 (t, 2H, CH2CO), 2.60 (m, 2H, H-3′, H-4′), 2.61 (m, 2H, H-6a′, H-6b′), 3.27 (t, 1H, CH-CO), 3.29 (bs, NH2, OH’s; exchangeable with D2O), 4.00 (m, 1H, OH; exchangeable with D2O), 7.77 (s, 2H, 2NH; exchangeable with D2O). Anal. Found: C, 47.80; H, 7.15; N, 7.69.
G-chitosan-2: Obtained from glutamic acid (5 mmol) in 92.5% yield; IR (KBr): 1638 (CONH), (NH2), 3445 cm−1 (NH), (OH); Anal. Found: C, 47.84; H, 7.24; N, 7.72.
G-chitosan-3: Obtained from glutamic acid (10 mmol) in 90.2% yield; IR (KBr): 1636 (CONH), 2925 (saturated C-H), (NH2), 3728, 3434 cm−1 (NH), (OH); Anal. Found: C, 47.86; H, 7.27; N, 7.74
G-chitosan-4: Obtained from glutamic acid (20 mmol) in 89% yield; IR (KBr): 1637 (CONH), 2925 (saturated C-H), NH2, 3438 cm−1 (NH), (OH); Anal. Found: C, 47.88; H, 7.35; N, 7.77.
3.4. Stock Solution Preparation
Stock solution of 10 mg/L Cu(II) ion was prepared by dissolving copper sulphate pentahydrate (CuSO4·5H2O, 39.28 mg)in distilled water (1000 mL)contained in a volumetric flask. Ni(II) stock solution of 10 mg/L concentration was also prepared by dissolving nickel sulphate hexahydrate (NiSO4·6H2O, 43.96 mg) in 1000 mL distilled water. Hydrochloric acid and sodium hydroxide were used to adjust the solution pH. Distilled water was used throughout the experimental work.
3.5. Adsorption Experiments
Sorption experiments were conducted in 250 mL conical flasks containing 100 mL of various concentrations of Ni(II) or Cu(II) solution using accurately weighed chitosan. The flasks were agitated in an orbit shaker at 100 rpm and at room temperature (25 °C). The initial and final concentrations of the solutions were measured by atomic adsorption (AAS) at the maximum adsorption wavelength and the adsorption capacities of the adsorbent were calculated.
The percent removal of metals from the solution was calculated by the following equation [20]:
where C0 (mg/L) is the initial metal ion concentration and C (mg/L) is the final metal ion concentration in the solution.
The effect of sorbent dosage was studied from 1 g to 5 g for 1 h contact time. Effect of initial pH on the sorption capacity of sorbent for Ni(II) and Cu(II) was studied by varying solution pH from 3 to 9 at the sorbent dosage of 1 g/100 mL for 1 h contact time using 200 mg/L initial Ni and Cu concentration; the solution pH was adjusted with dilute HCl or NaOH solution. The effect of contact time on the sorption capacity of sorbent was studied in the range 25–350 min at an initial Ni and Cu concentration of 200 mg/L. The effect of initial concentration on the sorption capacity of sorbent was studied using the volume of solutions as 100 mL, and initial concentration of nickel as 5, 50, 100, 300, 500, 700, 900 and 1000 mg/L; and copper as 5, 50, 75, 125, 250, 500, 750 and 1000 mg/L. Adsorption isotherms were studied at different initial Ni, Cu concentrations at room temperature.
4. Conclusions
Chitosan-glutamic hydrogels were synthesized by modification of chitosan with glutamic acid which was characterized with FTIR, 1H-NMR, elemental analysis and SEM. The influence of adsorbent dosage, solution pH value, reaction time and initial concentration of Ni(II) and Cu(II) on the adsorption capacity were investigated. The results indicate that chitosan-glutamic derivatives are good adsorbents of Ni(II) and Cu(II).
Acknowledgments
This research was partially supported by the Chemistry Department, Faculty of Science, Alexandria University. Authors also wish to thank Sh. El Shazly for his valuable discussions. Thanks are also for the reviewers and editor for their helpful suggestions and enlightening comments.
Author Contributions
Mohamed M. El Sadek suggested and supervised the work and performed the article editing. Mohamed A. Mostafa and Seham Y. Hassan conceived and designed the experiments and analyzed the data. Huda E. Abdelwahab performed the experiments.
Conflicts of Interest
The authors declare no conflict of interest.
References
- Neylan, D. Accumulation of Heavy Metals in Freshwater Organisms: Assessment of Toxic Interactions. Turk. J. Chem. 2001, 25, 173–179. [Google Scholar]
- Wan, N.W.S.; Teong, L.C.; Hanafiah, K.M. Adsorption of dyes and heavy metal ions by chitosan composites: A review. Carbohydr. Polym. 2011, 83, 1446–1456. [Google Scholar]
- Santino, O.L.C. Assessment of quality of air in Palermo by chemical (ICP-OES) and cytological analyses on leaves of Eucalyptus camaldulensis. Environ. Sci. Pollut. Res. Int. 2015, 22, 1891–1905. [Google Scholar]
- Boddu, V.M.; Abburi, K.; Randolph, A.J.; Smith, E.D. Removal of Copper(II) and Nickel(II) Ions from Aqueous Solutions by a Composite Chitosan Biosorbent. Sep. Sci. Technol. 2008, 43, 1365–1381. [Google Scholar] [CrossRef]
- Chervona, Y.; Arita, A.; Costa, M. Carcinogenic metals and the epigenome: Understanding the effect of nickel, arsenic, and chromium. Metallomics Integr. Biometal Sci. 2012, 4, 619–627. [Google Scholar] [CrossRef] [PubMed]
- Das, K.K.; Das, S.N.; Dhundasi, S.A. Nickel, its adverse health effects & oxidative stress. Indian J. Med. Res. 2008, 128, 412–425. [Google Scholar] [PubMed]
- Awual, M.R. A novel facial composite adsorbent for enhanced copper(II) detection and removal from wastewater. Chem. Eng. J. 2015, 266, 368–375. [Google Scholar] [CrossRef]
- Tabrizi, A.B. Development of a cloud point extraction-spectrofluorimetric method for trace copper(II) determination in water samples and parenteral solutions. J. Hazard. Mater. 2007, 139, 260–264. [Google Scholar] [CrossRef] [PubMed]
- Awual, M.R.; Ismael, M.; Yaita, T.; El-Safty, S.A.; Shiwaku, H.; Okamoto, Y.; Suzuki, S. Trace copper(II) ions detection and removal from water using novel ligand modified composite adsorbent. Chem. Eng. J. 2013, 222, 67–76. [Google Scholar] [CrossRef]
- Bo, C.; Ping, Z. A new determining method of copper(II) ions at ng·mL−1 levels based on quenching of the water-soluble nanocrystals fluorescence. Anal. Bioanal. Chem. 2005, 381, 986–992. [Google Scholar] [CrossRef] [PubMed]
- Chen, H.; Dai, G.; Zhao, J.; Zhong, A.; Wu, J.; Yan, H. Removal of copper(II) ions by a biosorbent—Cinnamomum camphora leaves powder. J. Hazard. Mater. 2010, 177, 228–236. [Google Scholar] [CrossRef] [PubMed]
- Boddu, V.M.; Abburi, K.; Talbott, J.L.; Smith, E.D. Removal of hexavalent chromium from wastewater using a new composite chitosan biosorbent. Environ. Sci. Technol. 2003, 37, 4449–4456. [Google Scholar] [CrossRef] [PubMed]
- Cataldo, S.; Muratore, N.; Orecchio, S.; Pettignano, A. Enhancement of adsorption ability of calcium alginate gel beads towards Pd(II) ion. A kinetic and equilibrium study on hybrid Laponite and Montmorillonite–alginate gel beads. Appl. Clay Sci. 2015, 118, 162–170. [Google Scholar] [CrossRef]
- Rinaudo, M. Chitin and chitosan: Properties and applications. Prog. Polym. Sci. 2006, 31, 603–632. [Google Scholar] [CrossRef]
- Roberts, G.A.F. Chitin Chemistry; Macmillan Education: London, UK, 1992. [Google Scholar]
- Kyzas, G.Z.; Bikiaris, D.N. Recent modifications of chitosan for adsorption applications: A critical and systematic review. Mar. Drugs 2015, 13, 312–337. [Google Scholar] [CrossRef] [PubMed]
- Junli, Z. Synthesis, characterization and adsorption properties of a novel chitosan derivative. Indian J. Chem. Technol. 2012, 19, 161–166. [Google Scholar]
- Pavia, D.L.; Lampman, G.L.; Kriz, G.S.; Vyvyan, J.R. Introduction to Spectroscopy, 5th ed.; Cengage Learning: Belmont, CA, USA, 2015. [Google Scholar]
- Dehonor, G.M.; Hernández, E.M.; Ruiz, T.F.A.; Contreras-Reyes, R. Properties and adsorptive capacity of amino acids modified chitosans for copper ion removal. Macromol. Symp. 2003, 197, 277–288. [Google Scholar] [CrossRef]
- Sivakami, M.S.; Gomathi, T.; Venkatesan, J.; Jeong, H.S.; Kim, S.K.; Sudha, P.N. Preparation and characterization of nano chitosan for treatment wastewaters. Int. J. Biol. Macromol. 2013, 57, 204–212. [Google Scholar] [CrossRef] [PubMed]
- Sample Availability: Samples are not available.


© 2016 by the authors. Licensee MDPI, Basel, Switzerland. This article is an open access article distributed under the terms and conditions of the Creative Commons Attribution (CC-BY) license ( http://creativecommons.org/licenses/by/4.0/).