Review

Recent Developments in Solid-Phase Extraction for Near and Attenuated Total Reflection Infrared Spectroscopic Analysis

Institute of Analytical Chemistry and Radiochemistry, CCB-Center for Chemistry and Biomedicine, Leopold-Franzens University, Innrain 80/82, 6020 Innsbruck, Austria
Molecules 2016, 21(5), 633; https://doi.org/10.3390/molecules21050633
Submission received: 11 February 2016 / Revised: 4 May 2016 / Accepted: 9 May 2016 / Published: 14 May 2016
(This article belongs to the Special Issue Advances of Vibrational Spectroscopic Technologies in Life Sciences)

Abstract

:
A review with more than 100 references on the principles and recent developments in the solid-phase extraction (SPE) prior and for in situ near and attenuated total reflection (ATR) infrared spectroscopic analysis is presented. New materials, chromatographic modalities, experimental setups and configurations are described. Their advantages for fast sample preparation for distinct classes of compounds containing different functional groups in order to enhance selectivity and sensitivity are discussed and compared. This is the first review highlighting both the fundamentals of SPE, near and ATR spectroscopy with a view to real sample applicability and routine analysis. Most of real sample analyses examples are found in environmental research, followed by food- and bioanalysis. In this contribution a comprehensive overview of the most potent SPE-NIR and SPE-ATR approaches is summarized and provided.

1. Introduction

The development of a complete analytical strategic method requires the inclusion of a number of steps, starting from sample collection and ending with the final result report. Intermediate steps include sample storage, preparation, isolation, identification and quantification of analytes. Thereby, sample preparation represents a tedious and time-consuming step, which is also very often a source of imprecision and inaccuracy of the overall analysis. The basic principal objective of sample preparation for chromatographic as well as infrared spectroscopic analysis are dissolution of analytes in a suitable solvent and removal from the solution of as many interfering compounds as possible. For this purpose, solid-phase extraction (SPE) is applied in many protocols for the pre-concentration, clean-up and purification of different types of analytical samples as well as for the removal of toxic substances. Characteristic applications comprise enrichment of pesticides [1], determination of organic contaminants in water [2,3], and environmental samples in general [4]. Biological samples, e.g., human serum, can be purified to selectively enrich active compounds of pharmaceutical interest [5]. The SPE technology itself was introduced in the early 1970s in order to avoid or minimize the disadvantages of liquid-liquid extraction (LLE) [6]. Compared to LLE, SPE reduces the time required, especially in case of automation, while also allowing handling of small samples (50–100 µL). The term SPE was not mentioned until 1985 and since then the number of applications has continuosly increased.

2. Basis of Solid-Phase Extraction

For analytical purposes, SPE is usually performed using a small column or cartridge containing an appropriate packing. As an alternative, membranes loaded with distinct resins can be applied for SPE micro-extraction [7]. In a common practice the adsorbed materials are eluted from the resin with a small amount of solvent. The most commonly used material for SPE is chemically bonded silica, usually with a C8 or C18 organic group. On the other hand the most common polymeric resin in SPE is porous polystyrene [8]. Both silica- and polystyrene-based phases have distinct disadvantages: (1) silica is unstable to alkali and is known to offer only poor surface contact in case of aqueous samples due to the hydrophilic/hydrophobic balance between the carrier and the carbon chain; (2) polystyrene carriers also possess hydrophilic surfaces; (3) in most cases an activating solvent must be used, which can cause reduced capacity and/or reproducibility, respectively; (4) many types of organic compounds are incompletely extracted from aqueous solutions. Therefore, there is ongoing work with the aim of creating new types of chemically bonded resins to overcome these drawbacks.
As one of the first improvements, in 1992 Sun and Fritz modified PS-DVB with alcohol and acetyl functional groups [9]. According to the chemical character of the functional group chemically bonded to the copolymer, the resulting phases are classified as non-polar, polar, or ion exchangers. Since then a number of different stationary phases based on different types of materials—poly(carboxylic acid) coated silica [10,11], divinylbenzene-n-vinylpyrrolidone copolymer [12], poly(glycidyl methacrylate-divinylbenzene) (GMA-DVB) [13,14], fullerene-silica [15], titanium oxide coated steel targets [16], aluminium silicate embedded in poly(styrene-co-divinylbenzene) (PS-DVB) [17,18], zirconium silicate [19], poly(N-vinylimidazole/ethylene glycol dimethacrylate) [20]—have been designed for the selective extraction of, e.g., pharmaceutically active compounds from medicinal plants. An evaluation of commercial available SPE materials for the selective analysis of monoterpenoids was reported by Uhlschmied et al. [21]. For SPE of biomolecules the number of tailored stationary phases is even higher, e.g., for phosphopeptide and biomarker analysis, cellulose [22], poly(glycidyl-methacrylate/divinylbenzene) [23,24,25,26], carbon nanotubes [27], diamond layer [28,29], fullerenes [30,31,32,33], diamond-like-carbon [34,35], titanium and zirconium oxide [36], graphitic nanofibers [37], chitosan [38] and silica lanthanum oxide [39]. Nowadays the analysis after the enrichment step is mainly carried out by mass spectrometric (MS) techniques, including matrix assisted laser desorption ionization time of flight (MALDI-TOF) [40,41,42,43], electrospray ionization (ESI) and still high-performance liquid chromatography (HPLC) employing UV-absorbance, diode array detection and others [8]. The past, present and future of solid-phase extraction was reviewed by Buszewski et al. in 2012 [44] and Boonjob in 2014 [45].
Altogether, in 2015 using the SciFinder engine of the American Chemical Society (ACS) 67.010 hits can be found entering the term “solid phase extraction”. From those only 890 hits are correlated to infrared (IR) spectroscopic analysis, most of them describing a physicochemical characterization of the material itself [46,47,48] but only very few the analysis of the interesting analytes bound and/or enriched onto the material, respectively [49].
Compared to mass spectrometry (MS)-based techniques infrared spectroscopy in the wavenumber range between 400 and 13,000 cm−1 offers especially the advantages of fast, cheap, non-invasive analyses. Furthermore, several parameters can be analysed simultaneously, even in high-throughput mode [50]. The main disadvantage is the low sensitivity compared to MS in the percentage or upper ppm range. and in specific investigations the spectral selectivity for certain ingredients can be too low [51]. Therefore, the combination of SPE with IR spectroscopy could offer several synergistic benefits: the high selectivity and sensitivity of SPE could be hyphenated with the fast and simple analytical investigation using IR spectroscopy.
Therefore, the aim of the present contribution is to summarise, highlight and discuss attempts to apply this type of SPE-IR approach. In the following section the SPE setups and then NIR- and ATR-based analytical measurement technologies are summarized and discussed before in the following section different approaches divided into distinct application fields are pointed out and evaluated.
The principle of SPE is analogous to that of LLE, involving a partitioning of compounds between two phases. The analytes to be extracted are partitioned in this case between a solid and a liquid and must have a greater affinity for the solid extraction phase than for the sample matrix (retention or adsorption step). In one of the following steps compounds retained on the solid phase can be removed by eluting with a solvent with an increased affinity for the analytes. The experimental procedure normally consists of the following steps: (1) activation of the sorbent; (2) removal of the activation solvent; (3) application of the sample; (4) removal of interfering compounds; (5) selective elution of analytes. Possible uses of SPE are removal of interfering compounds; pre-concentration of samples; fractionation samples into different compound classes and storage of compounds. Thereby, the SPE procedure itself can be carried out either on-line or off-line. An important parameter for the efficiency of a SPE procedure is the breakthrough volume where the analyte of interest starts to be eluted [8].
In the classical setup, SPE can be carried out either in a column, membrane and/or micro-extraction technology, respectively. Membranes or disks consist of an e.g., 0.5 mm thick membrane, whereas the adsorbent is immobilized in a web of micro-fibrils allowing higher flow-rates compared to columns/cartridges. The most frequently used membrane worldwide is Empore from 3M (St. Paul, MN, USA) in case of large sample volumes and low analyte concentration. Solid-phase micro-extraction (SPME) has been most frequently used for the analysis of volatile and semi-volatile compounds in water [52] and is of less interest in combination with IR-related technologies so far.

3. Principles of Infrared Spectroscopic Analysis Techniques

IR radiation is the region of the electromagnetic spectrum between the visible (VIS) and the microwave wavelengths [53]. In near-infrared (NIR) spectroscopy (750–2500 nm, 4000–13,000 cm−1) solid, liquid or even gaseous samples can absorb parts of the incoming IR radiation resulting in a specific fingerprint or spectrum [54]. C–H, C–O, C=O, N–H and O–H functional groups are excited to perform stretching-, deformation- and scissor-vibrations. In contrast to mid-infrared (MIR, 4000–400 cm−1), where only fundamental vibrations (“signatures”) can be observed, overtones and combination vibrations are obtained in the NIR region resulting in additional information compared to MIR [55]. This mostly results in a crowded spectrum with overlapping peaks being 10–1000 times lower and less sensitive than for the MIR, which makes the construction of highly sensitive detectors necessary. The main advantage of NIR is the simultaneous determination of qualitative and quantitative parameters in a fast and non-invasive manner. Additionally, physico-chemical parameters including particle size, porosity and specific surface area can be investigated, respectively. Multivariate statistical analysis (MVA) is a powerful method enabling the selective extraction of the required information. Most appropriate chemometrical procedures include principal component analysis (PCA) and partial least square regression (PLSR). For the establishment of suitable quantitative models, reference analyses based on liquid chromatography (LC), wet chemistry, mass spectrometry (MS) and others are required. In attenuated total reflection (ATR) spectroscopy solid and liquid samples can be analyzed without any further sample pre-treatment, mainly in the MIR-region. Fourier-transform infrared (FTIR) spectroscopic microscopy can be used for the investigation of the samples’ composition with a resolution down to approximately 4 µm [56]. Finally, nowadays there is a strong trend towards the miniaturization of spectrometers [57].

3.1. Near-Infrared (NIR) SPECTROSCOpy vs. Mid Infrared Spectroscopy

“Near” is related on the position of the electromagnetic energy lying next to or near the visible (Vis) energy range. Molecular vibrations in the MIR cover absorptions in a range between 400–4000 cm−1 and are known to be the most intense and fundamental bands [51]. Light can interact with the sample in different ways. It can be reflected, scattered and absorbed or it can partly penetrate through the sample. The ratio of the portion reflected and scattered back upon interactions, i.e., the remitted radiation power IR, to the light intensity incident on the sample is defined as the reflectance R:
R = I R I 0
Reflectance R is in most applications then converted into the absorbance AR:
A R = l o g 10 ( I R I 0 ) = l o g 10 R
Transmittance T, for measurements of light intensities transmitted through the sample is defined as:
Τ = I T I 0 = 10 ε A c d
This enables one to establish the following equation:
A = ε A c d = l o g 10 ( I T I 0 ) = l o g 10 T
So finally the respective absorbance can be expressed as:
A T = l o g 10 ( 1 T )   a n d   A R = l o g 10 ( 1 R )
Beer’s law can be applied to determine the thickness of a membrane layer and the pathlength-concentration in terms of mass per unit area.
Transflectance T represents a special case of transmission and reflection measurement. This measurement mode is often used for in- and on-line measurements of liquids or solutions. The incoming light beam passes the sample, then gets reflected on a non-absorbing mirror substance (in many cases Teflon) and is directed to the detector after penetrating the sample a second time. Due to this doubling of the path length, the sensitivity of the measurement setup can be enhanced (Figure 1).
The absorbance log(1/T) according to Beer law is rigorously only valid for non-scattering materials. In case of solid samples (powders, bulk samples) showing scattering effects, the absorbance is a so called pseudo-absorbance not exactly following the Beer law.

3.1.1. Miniaturization in NIR and MIR

The development of miniaturized, handheld instruments would not only lead to a further extension of the range of applications but also suggests that these instruments could eventually appear in non-traditional user environments. When handheld mid-IR spectrometers first appeared, the military adopted them much more quickly than industry for on-site chemical quality and process control in homeland security and antiterrorism applications.
In the majority of the applications, the primary objective is rapid and safe on-site identification of unknown—often hazardous or toxic—materials or for authenticating the origin of goods by trained users—but not necessarily scientists [58].
When miniaturizing an analytical instrument one of the key objectives is to ensure that the reduction in size does not compromise measurement performance and precision. It therefore follows that handheld vibrational spectrometers will only have a real impact on quality and process control if the spectra obtained from them are comparable to those produced by larger bench-top instruments [57,59].
New developments are driven chiefly by the potential and advantages of micro-electro-mechanical systems (MEMS) production for building extremely miniaturized devices that can perform optical-mechanical functions. Handheld mid-IR instruments are limited to attenuated total reflection (ATR) measurements and are offered as FT-IR systems or with a linear variable filter (LVF) monochromator. NIR spectrometers can operate in diffuse reflection, transmission or transflection mode and their enabling technology varies between dispersive and LVF or digital light processing (DLP) using digital mirror devices (DMD).
Nevertheless, it is necessary to critically scrutinize the technical background of new, elaborately advertised products, particularly those offering investment opportunities and life-science applications, because several of them might lack feasibility by lacking selectivity and/or sensitivity, respectively.
Lutz et al. described one approach how to further improve the efficiency of a miniaturized light-weight (<60 g) handheld spectrometer by the modification of an InGaAs diode array detector by utilizing a thermoelectric cooling (TEC) to ensure constant measurement conditions and a gold-coated spherical mirror as a reflector superior to conventional e.g., Spectralon. With this new measurement setup ethanol in gasoline could be analyzed down to a lower limit of detection (LOD) being 0.68% whereas with the conventional detector the LOD before was 8.68% (Figure 2) [57].

3.1.2. Multivariate Data Analysis in NIR and MIR

Multivariate data analysis (MVA)-based calibration procedures are carried out in order to link some spectral data with target parameters deriving from the individual reference technique [60,61,62]. In many applications, principal component analysis (PCA) models based on principal component regression (PCR) and partial least square regression (PLSR) are taken into consideration [17]. Also multiple linear regression algorithms (MLR) are applied quite frequently. In order to establish reliable calibration curves, spectra interpretation techniques including band assignment have to be combined into one single approach [63]. For the choice of the most appropriate signal, wavelength selection and spectra pretreatment algorithms are also essential [64]. Very well-known so far are the early contributions by Savitzky and Golay for data pretreatment [65]. The details about how the individual algorithms are working on a mathematical basis can be found in the most appropriate literature [60].

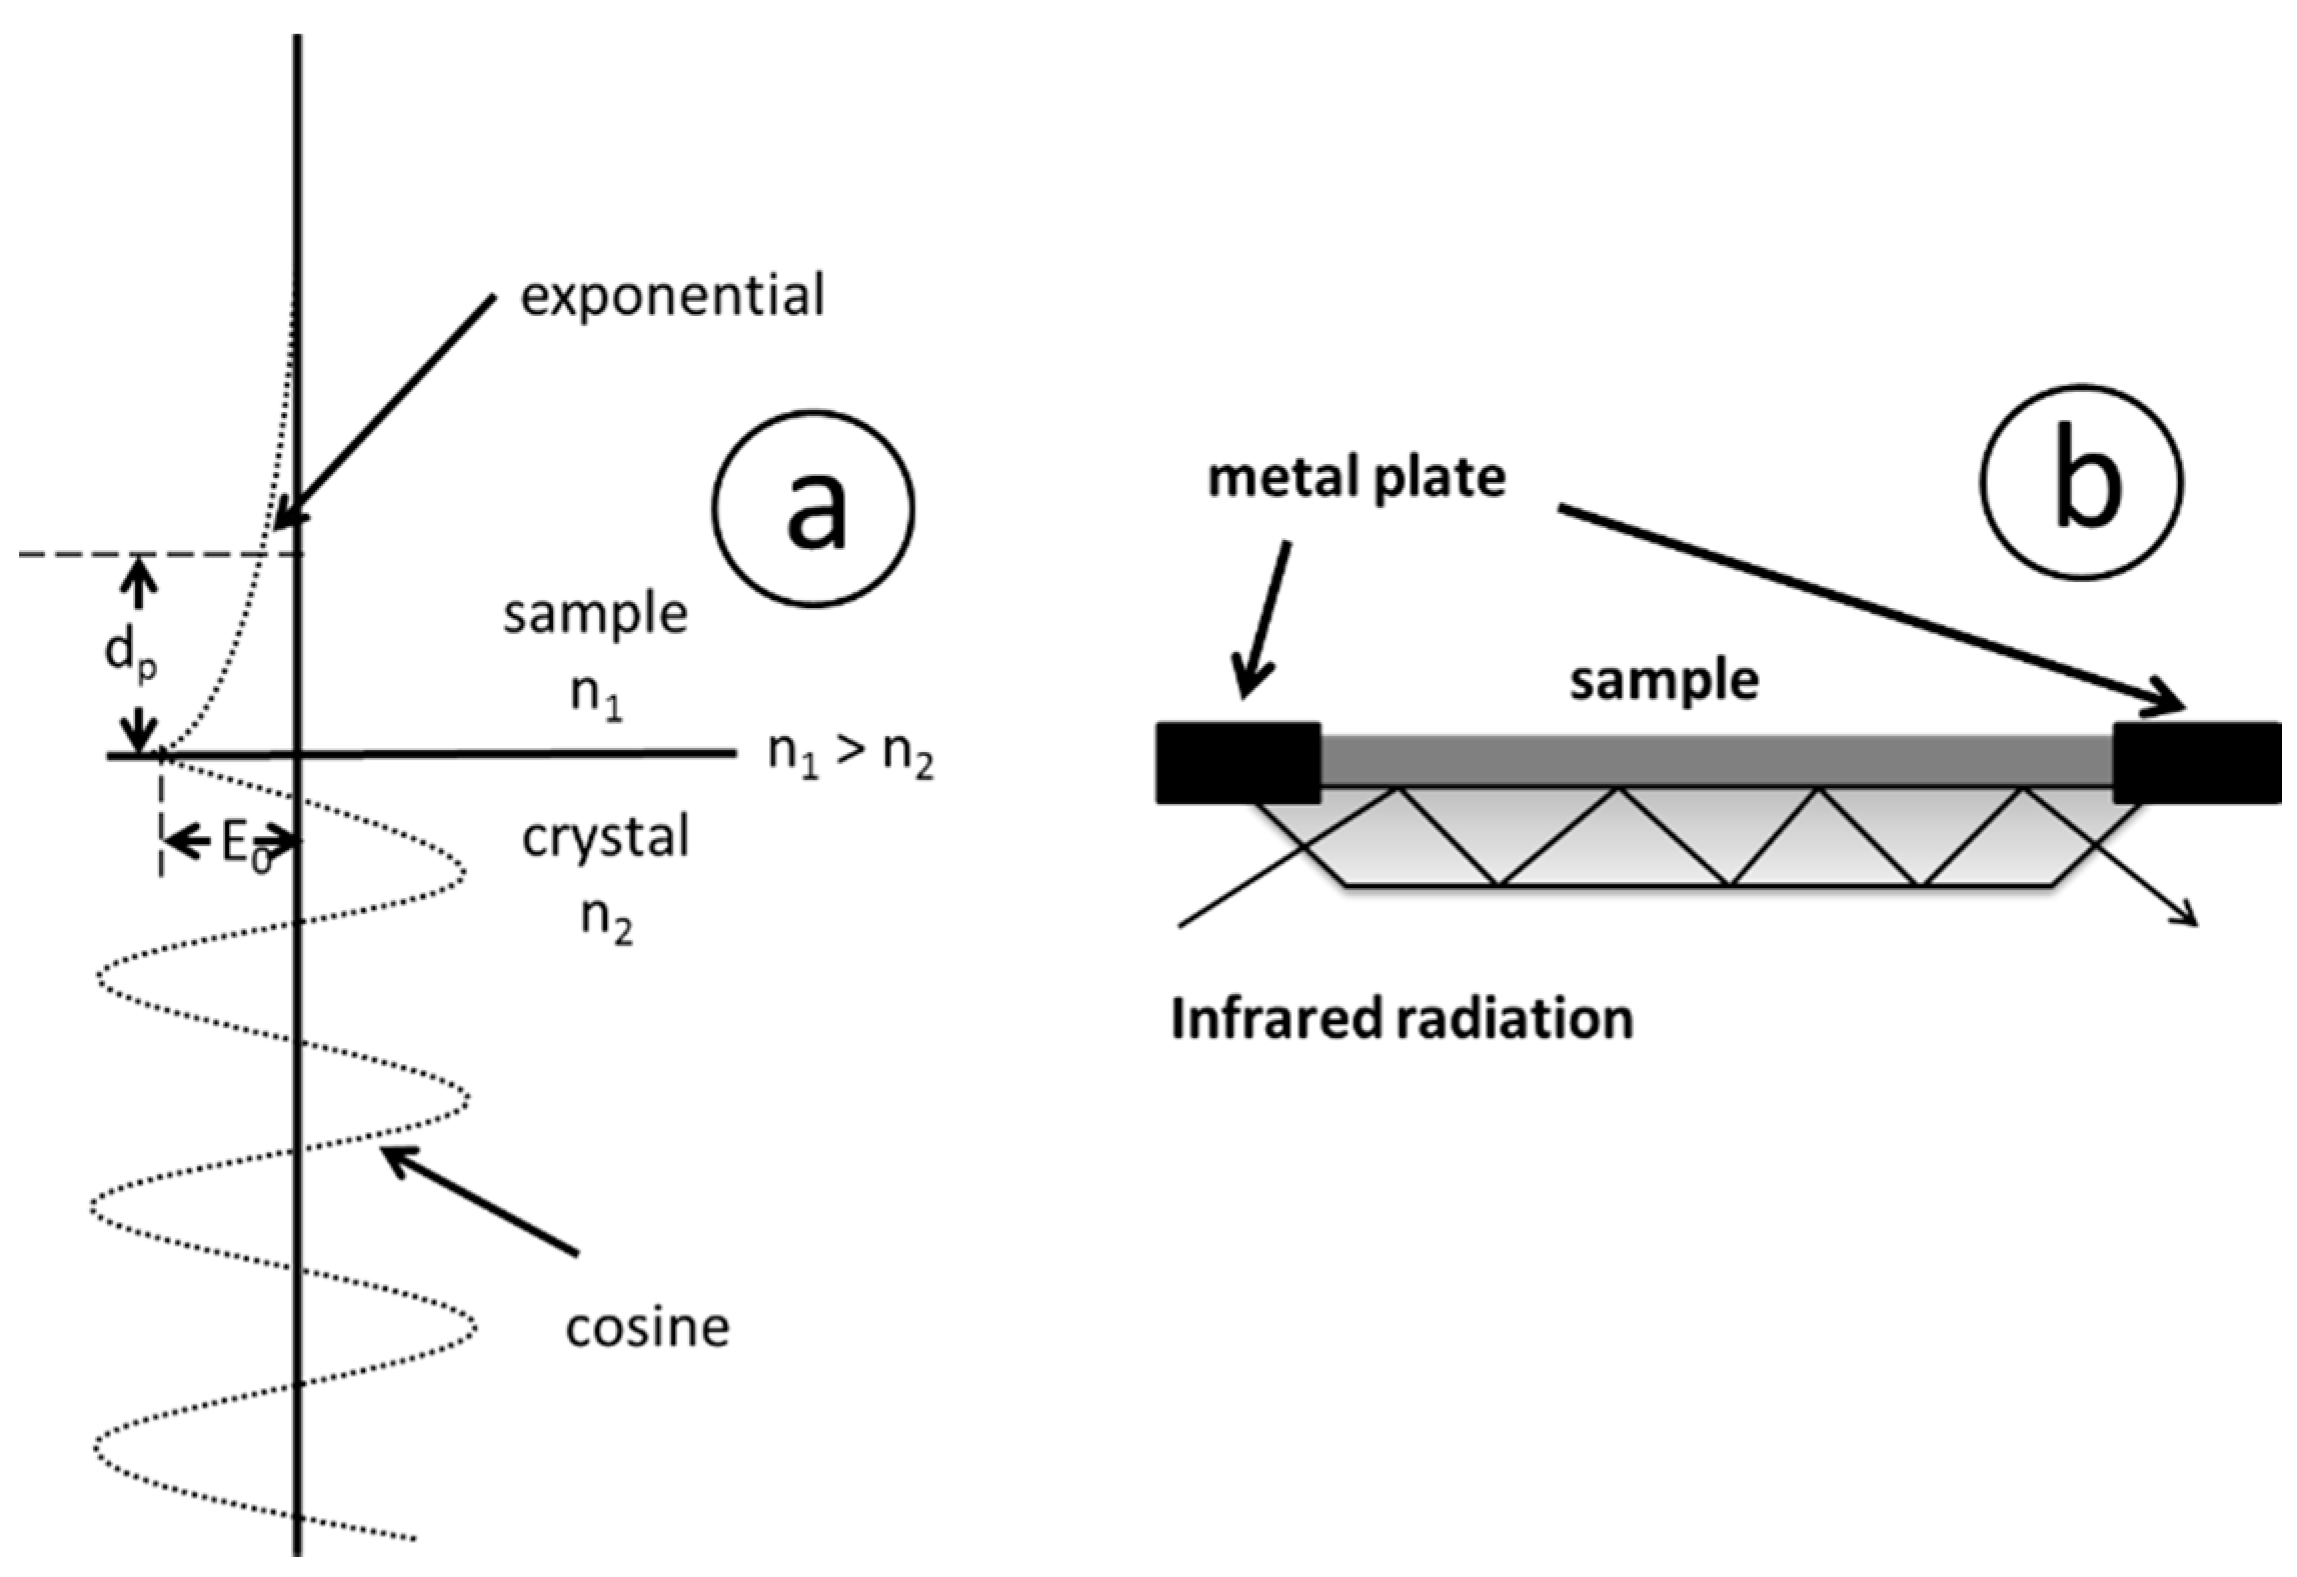
3.2. Attenuated Total Reflection (ATR) Spectroscopy

Attenuated total reflection (ATR) is mainly but not only a measurement technique applied in conjunction with mid infrared spectroscopy. ATR offers very often the advantage that solid and even liquid state samples can be directly measured without any sample pretreatment procedures necessary [66]. Applying this technique, light undergoes multiple internal reflections in a crystal of high refractive index, in many cases diamond, germanium or zinc selenite is the material of choice. The result of total internal reflection is the so called evanescent wave (Figure 3a). With this technique, infrared light is passed through the ATR crystal in such a way that it reflects at least once in most attempts even more often the internal surface in contact with the sample (Figure 3b). The depth of the evanescent wave is depending onto the exact wavelength, angle of incidence (α) and the refraction indices for the ATR crystal and the sample of interest according to the following equation [67]:
d p = λ n 1 2 π s i n 2 α ( n 2 / n 1 ) 2
The signal-to-noise ratio (SNR) obtained depends on the number of reflections but also on the total length of the optical light path which dampens the intensity.
The advantages of ATR spectroscopy can be summarized as follows:
  • Non-soluble materials can be analyzed (e.g., duroplasts)
  • No KBr pellet is required
  • Relatively high penetration depth for optical transparent materials
  • Improved signal to noise ratio compared to measurement using KBr pellet

3.3. Imaging and Mapping Spectroscopy

Imaging and mapping spectroscopy has become very popular since its introduction in 1989 [68]. With the introduction of focal plane array (FPA) systems, in the beginning indium gallium arsenide (InGaAs) in 1994 [69], the subsequent development for both mid- and near-IR, using a mercury cadmium telluride (MCT), allowed the fast recording of corresponding images.

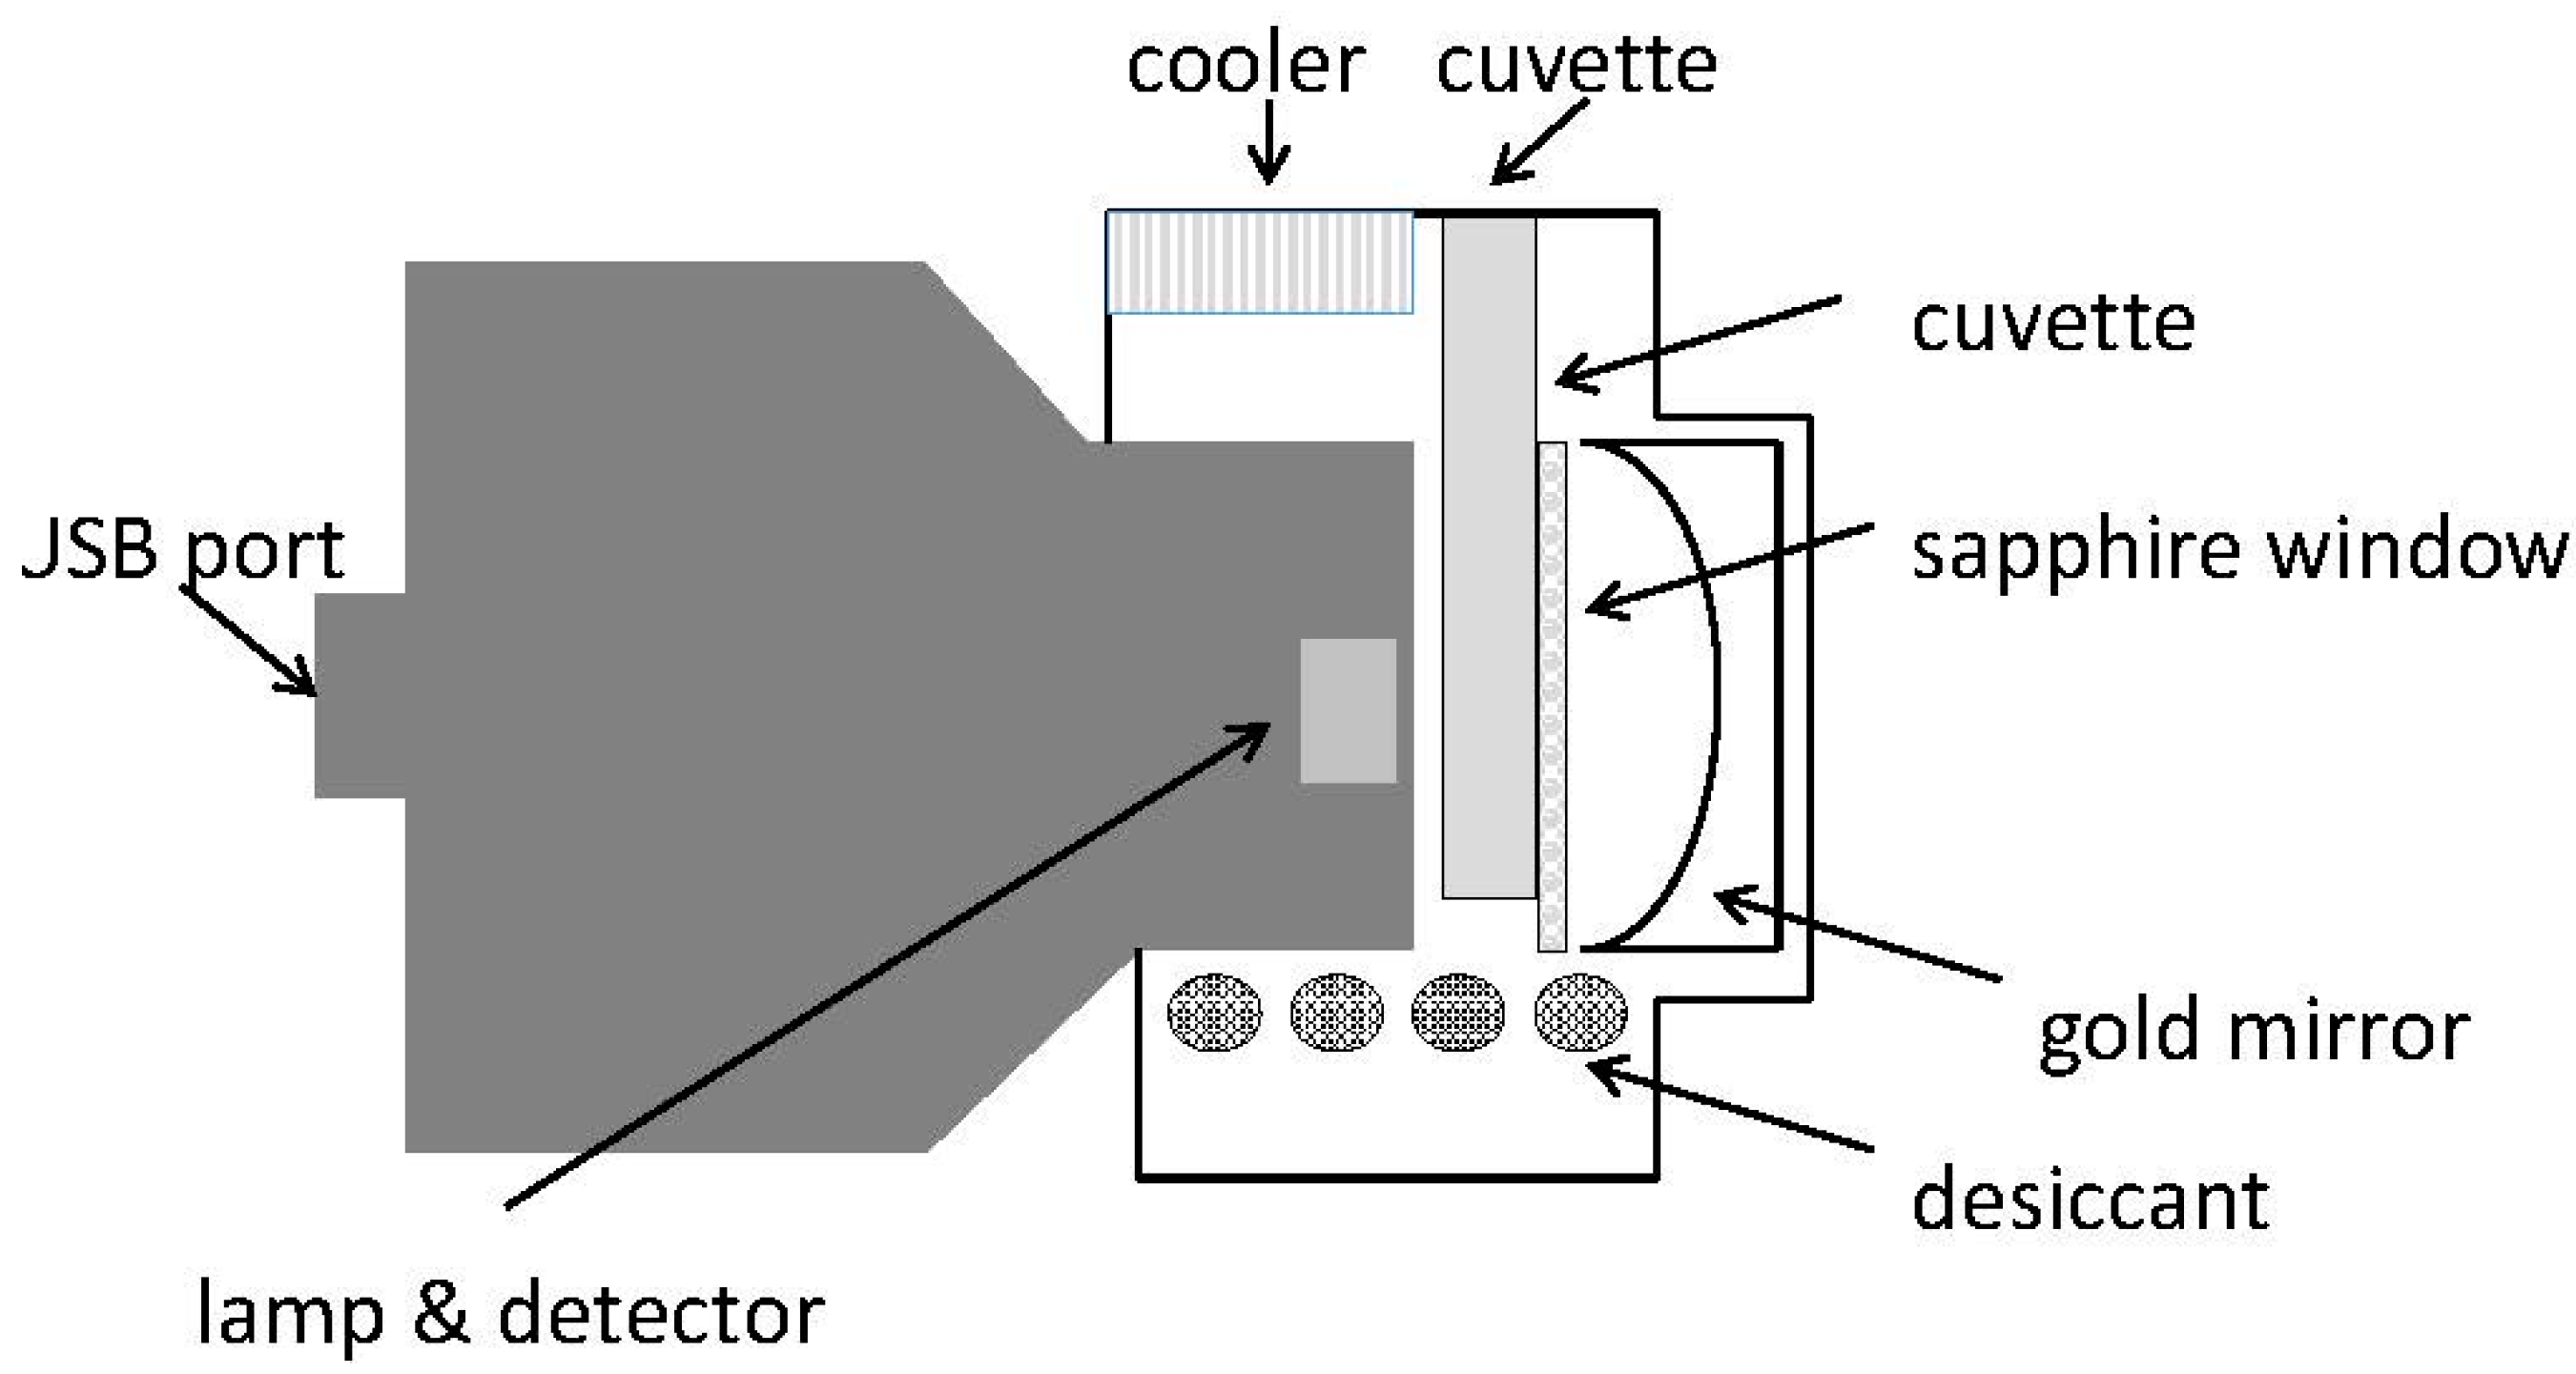
3.3.1. Instrumental Setup

In principle this technique can be understood as the coupling of a microscope to an IR spectrometer. During measurement, diffraction, refraction, reflection and absorption effects play a much more predominant role than in its macroscopic counterpart. From the spectral point of view, a light source (single polychromatic thermal source), a splitter (Fourier transform (FT), tunable filter or diffraction grating), a detector (uncooled InGaAs or cooled mercury cadmium telluride (MCT)) are required [70]. The advantages of this technique at the current state of the art can be summarized as micro spatial imaging of highly complex samples, high sensitivity, high selectivity, fast data acquisition, simple sample preparation and analysis. Finally, fully automated examination and computer enhanced visualization can be accomplished [71].

3.3.2. Measurement Modes

The measurement can be carried out either in the imaging or mapping mode according to the following strategies:
(1)
Point mapping: different areas of the sample are analyzed consecutively
(2)
Line mapping: defines a series of spectra along one dimension
(3)
Area mapping: defines a series of spectra to be collected in two dimensions. Sampling of large areas requires multiple positioning of a sample
Spectra can either be recorded in transmission according to Lambert-Beer or in reflection according to Kubelka-Munk.

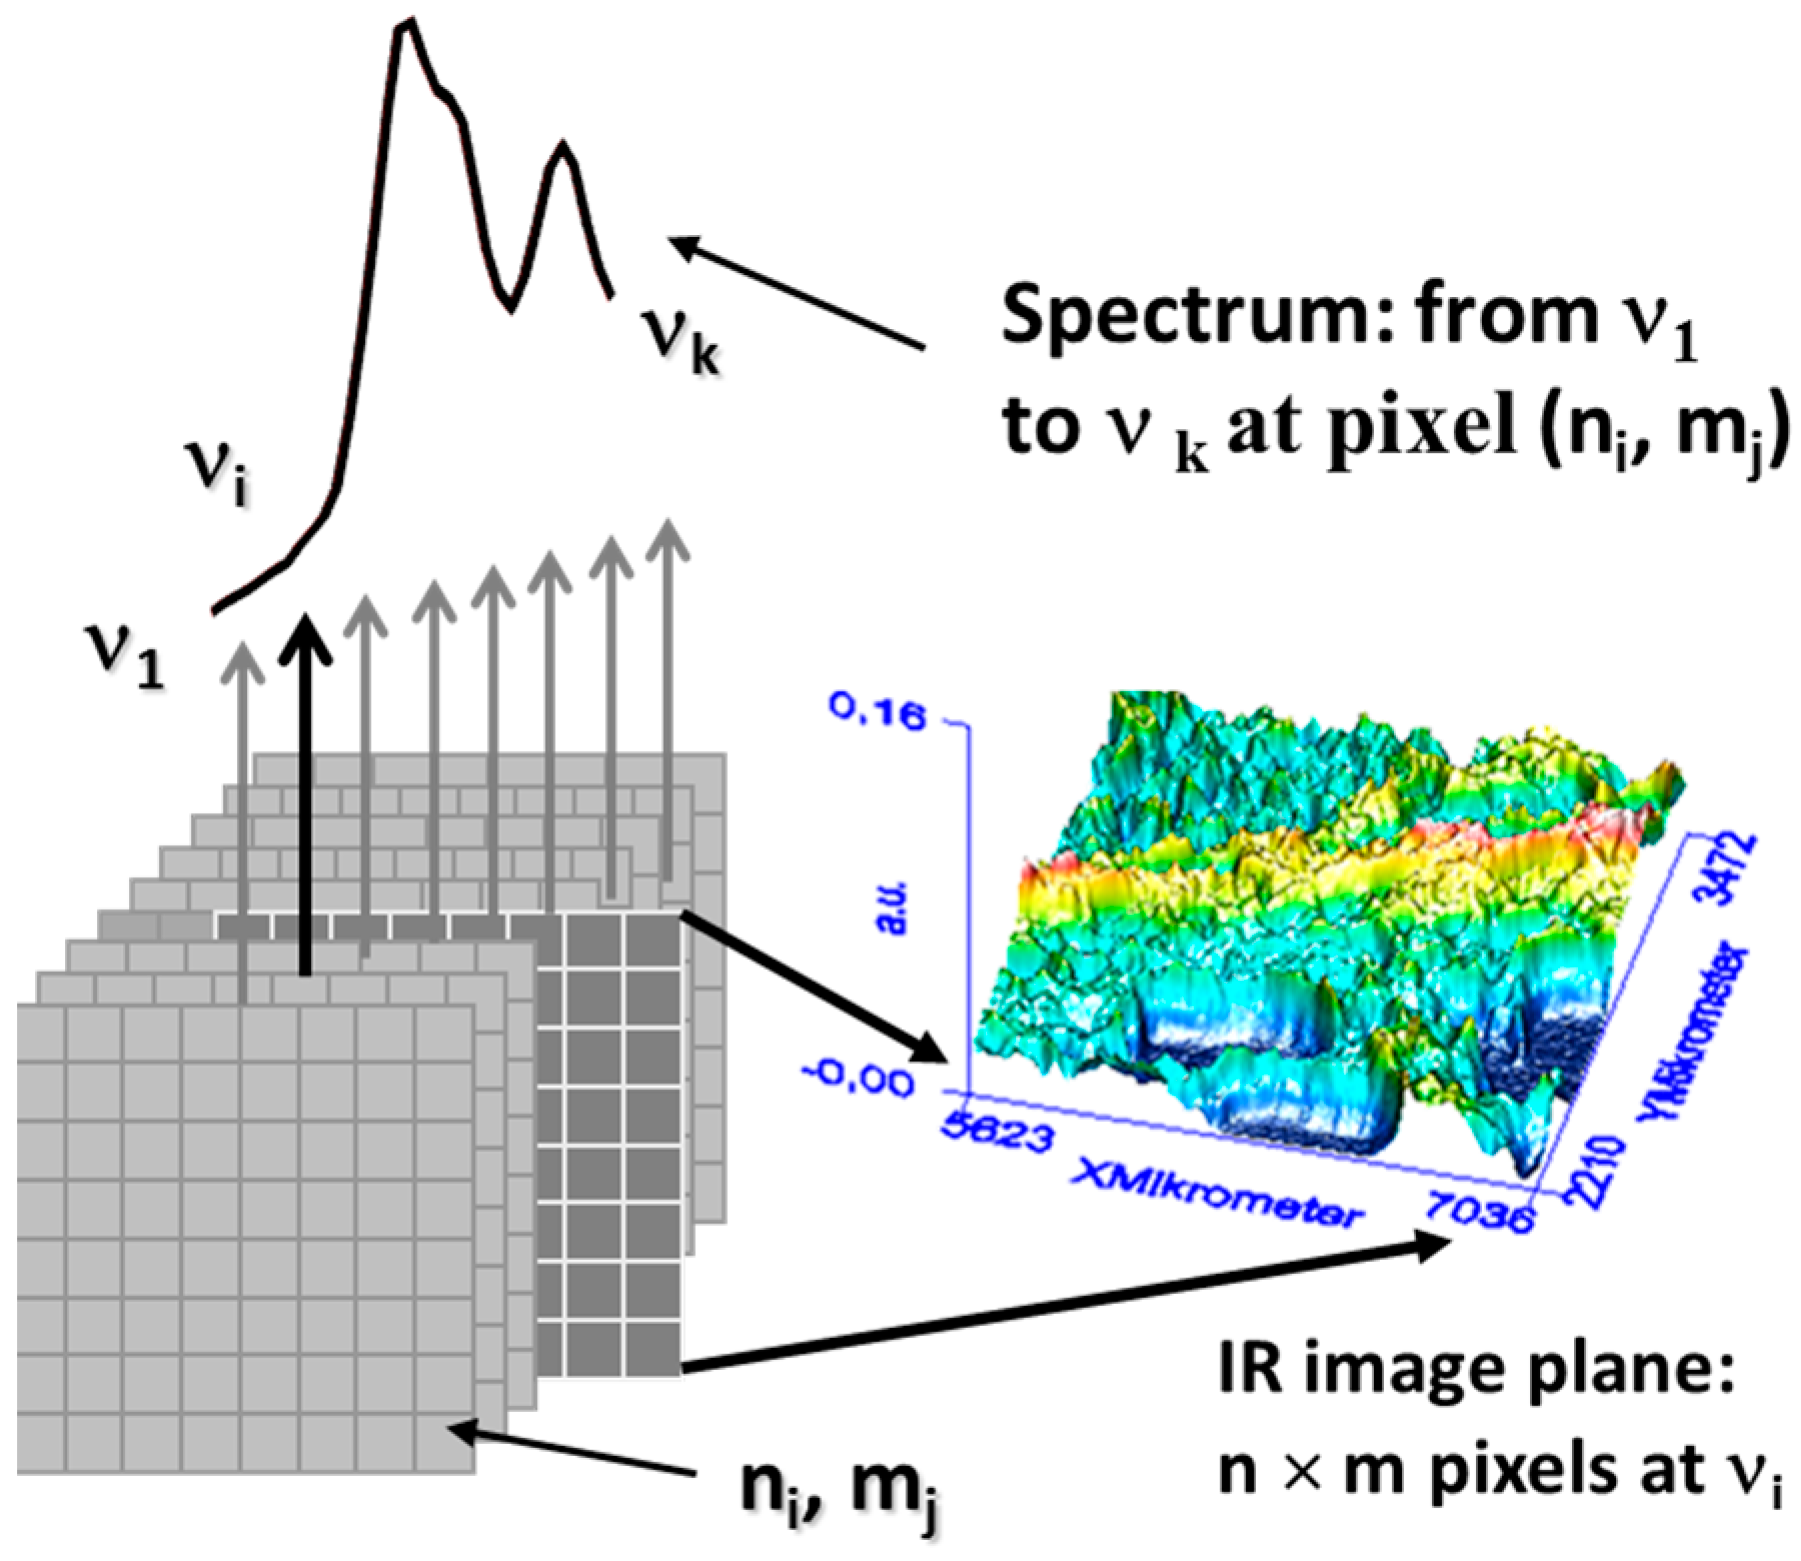
3.3.3. Hyper Spectral Cube

The huge amount of data assembled in especially imaging spectroscopy is collected in a hyper spectral cube. In this cube the sample is compartmented into small surface or volume areas (referred to as pixels), each of them representing a full spectrum. These cubes are mostly displayed as a three-dimensional (3D) matrix or data cube spanning two spatial dimensions x and y. The third dimension z corresponds to the individual wavelength/wavenumber (Figure 4).

3.3.4. Spectral Treatments in Imaging/Mapping Spectroscopy

At first irregularly shaped baseline contributions must be reduced, anomalous pixel spectra (outliers) and instrumental variations must be reduced. For visualization of the spatial distribution of individual ingredients, either univariate and/or multivariate analysis can be applied, respectively. For univariate analysis, a slice of the image on a particular wavenumber is displayed. In multivariate image analysis (MIA) the whole spectral information being available in the hyper spectral cube is used. Calculation of clusters are based on applying different algorithms including hierarchical clustering analysis (HC), k-means (KM) and fuzzy-C-means cluster analysis [72].

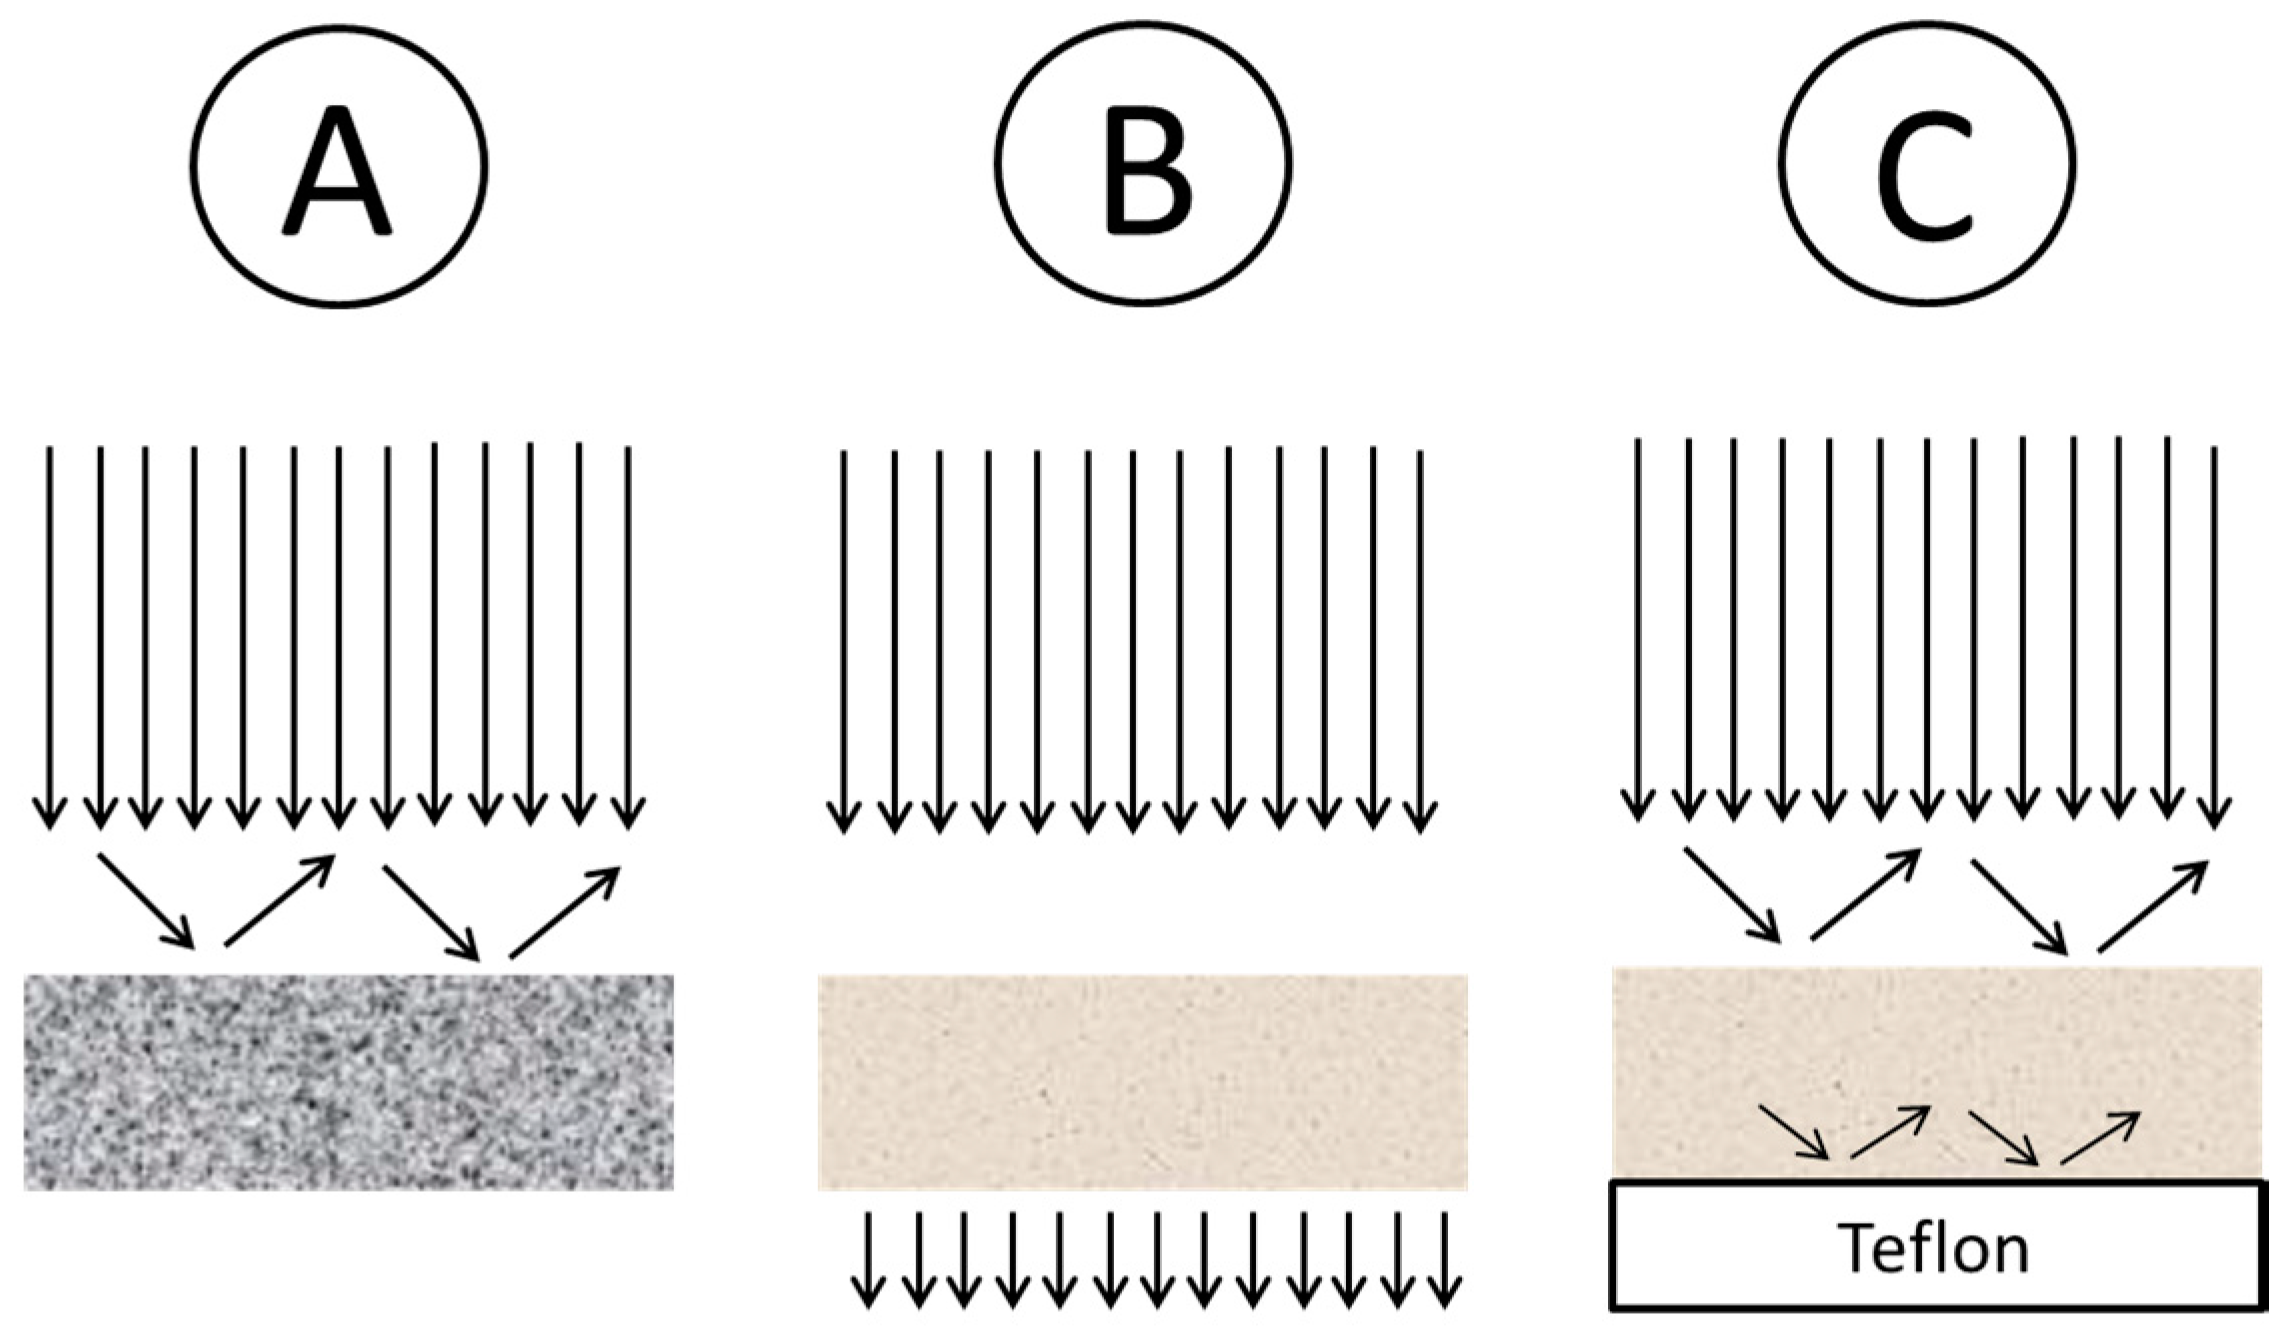
4. Surface-Enhanced Infrared Absorption (SEIRA) Spectroscopy

It was the field of surface-enhanced Raman scattering (SERS) that led to the establishment of a novel analytical platform termed as surface-enhanced infrared absorption (SEIRA) spectroscopy [73,74]. SEIRA is explained as being the result of the enhanced optical fields at the surface of the particles when illuminated at the surface photon resonance frequencies. In analogy with, the interpretation accepted for SERS, it has been suggested that, electromagnetic and chemical contributions are responsible for the observed infrared enhancement. It can be assumed that there is an increase in the rate of absorption per unit volume that is proportional to the energy density of the field at the appropriate density. The enhanced local field augments this energy density at the surface of particles where the adsorbed molecule resides. This local field varies according to several factors, including size, shape, and the dielectric functions, among several others. Further consequences for the observed infrared spectrum from molecules adsorbed at these local fields might be the result of enhanced field polarization. SEIRA can offer the following advantages:
  • The sought sample enrichment along the solid surface reduces the content of water in the observed volume as the strong absorption of liquid water often hampers the IR spectroscopic analysis [75]
  • Only those molecules that reside within the optical near-field are probed [73]
  • Chip-based technology can be implemented [76]

4.1. Preparation of SEIRA Substrates

Enhancement of SEIRA depends on the size, shape and particle density of the selected material. In most cases a metal-underlay configuration is used. The supporting substrates can be divided into IR transparent materials (Si, Ge, CaF2, BaF2, KBr, ZnSe, ZnS, sapphire, MgO) and non-transparent materials including glass, glassy carbon, polymers, and metals. The materials of the first group enable measurement in transmission and/or reflection mode, respectively, while the others are only adequate for reflection measurements. SEIRA active metal islands are commonly prepared by high vacuum evaporation of the metal onto a supporting substrate. As an alternative, electrochemical deposition can be applied. Applying this method, the substrate on which the metal is to be deposited must have high electrical conductivity. Coinage metals Ag and Au, which show high enhancement factors in SERS, have also been the most widely used metals in SEIRA experiments. However, theoretical SEIRA models predict enhancement on transition metals being as strong as on coinage metals [77]. In fact, while Ag and Au island films lead in practice to the greatest intensity enhancement, other metals, e.g., the platinum-group metals show the modest enhancement accompanied with maximal band asymmetry.

4.2. Theoretical Models for SEIRA

The electromagnetic enhancement on rough metal surfaces has been extensively discussed for radiation in both the visible and near-infrared (NIR) region of the spectrum, but fewer investigations have been achieved for the mid- and far-infrared regions. Theoretical models for SEIRA include isolated, finite number of particle and surface and film models. Several achievements have been made by a number of authors and the interested reader is therefore referred to some corresponding literature [73].

4.3. Classical Applications of SEIRA

SEIRA is a technique similar to SERS, which is a powerful tool for structural characterization of ultrathin films and well-ordered monolayers on metal surfaces. Thin films at interfaces are prepared with different procedures and developed for various applications. The fabrication and characterization of ultrathin films is an exciting area of research in which some of the most interesting subjects are: (1) mono- and bilayers at a liquid-liquid interface; (2) adsorption monolayers at an air-water interface; (3) films and monolayers at a liquid-solid interface; (4) deposit films at an air-solid interface. In the literature one can find studies about the molecular organization of monolayers of porphyrin derivatives, of azamacrocycles, and their metallic derivatives [73].
In addition, a modest enhancement factor (10–100) makes IR spectroscopy an attractive and powerful analytical tool. The analytical application of SEIRA as a surface-sensitive spectroscopy requires a thorough examination of metal-molecule interactions and polarization effects that may give rise to a distinct vibrational spectrum, in many cases, quite different from that of the parent molecule. Peak positions and relative intensities in the enhanced spectra may be different from those of normal spectra of the same molecules, and the deviation is larger for strongly chemisorbed analytes. This means that the databases of normal IR spectra cannot be used directly for automatic identification of compounds through their SEIRA spectra and that new database must be built. The enhancement itself is short range, being most effective for molecules on or near the metal surface, and therefore, the band intensity in SEIRA is not a linear function of the amount of molecules.
In trace analysis, SEIRA has been used as a detector for flow-injection systems and applied in the analysis of environmentally hazardous chemicals in waste water [78]. Silver islands on zinc selenite as SEIRA-active surfaces have been successfully employed for coupling to liquid chromatography (LC) and gas chromatography (GC) [73]. Detection limits with then times lower in comparison with GC-FTIR have been reported for chemisorbed molecules.
Two fungicides thiram and ziram being known to be hazardous have been analyzed [79] and also several bio analytical applications including immunoassays have been described in the literature [80]. Biosensors use antibodies or enzymes, immobilized on a platform, to interact selectively with antigens or substrates, and then one of several possible transduction mechanisms to detect this interaction. Applications describing the sensitive detection of Salmonella and staphylococcal protein A have been described [73]. Several different applications applying SEIRA have been described in the review by Gonzalvez including a description upon the analysis down to the ppb level in different matrices such as water and soil [81].

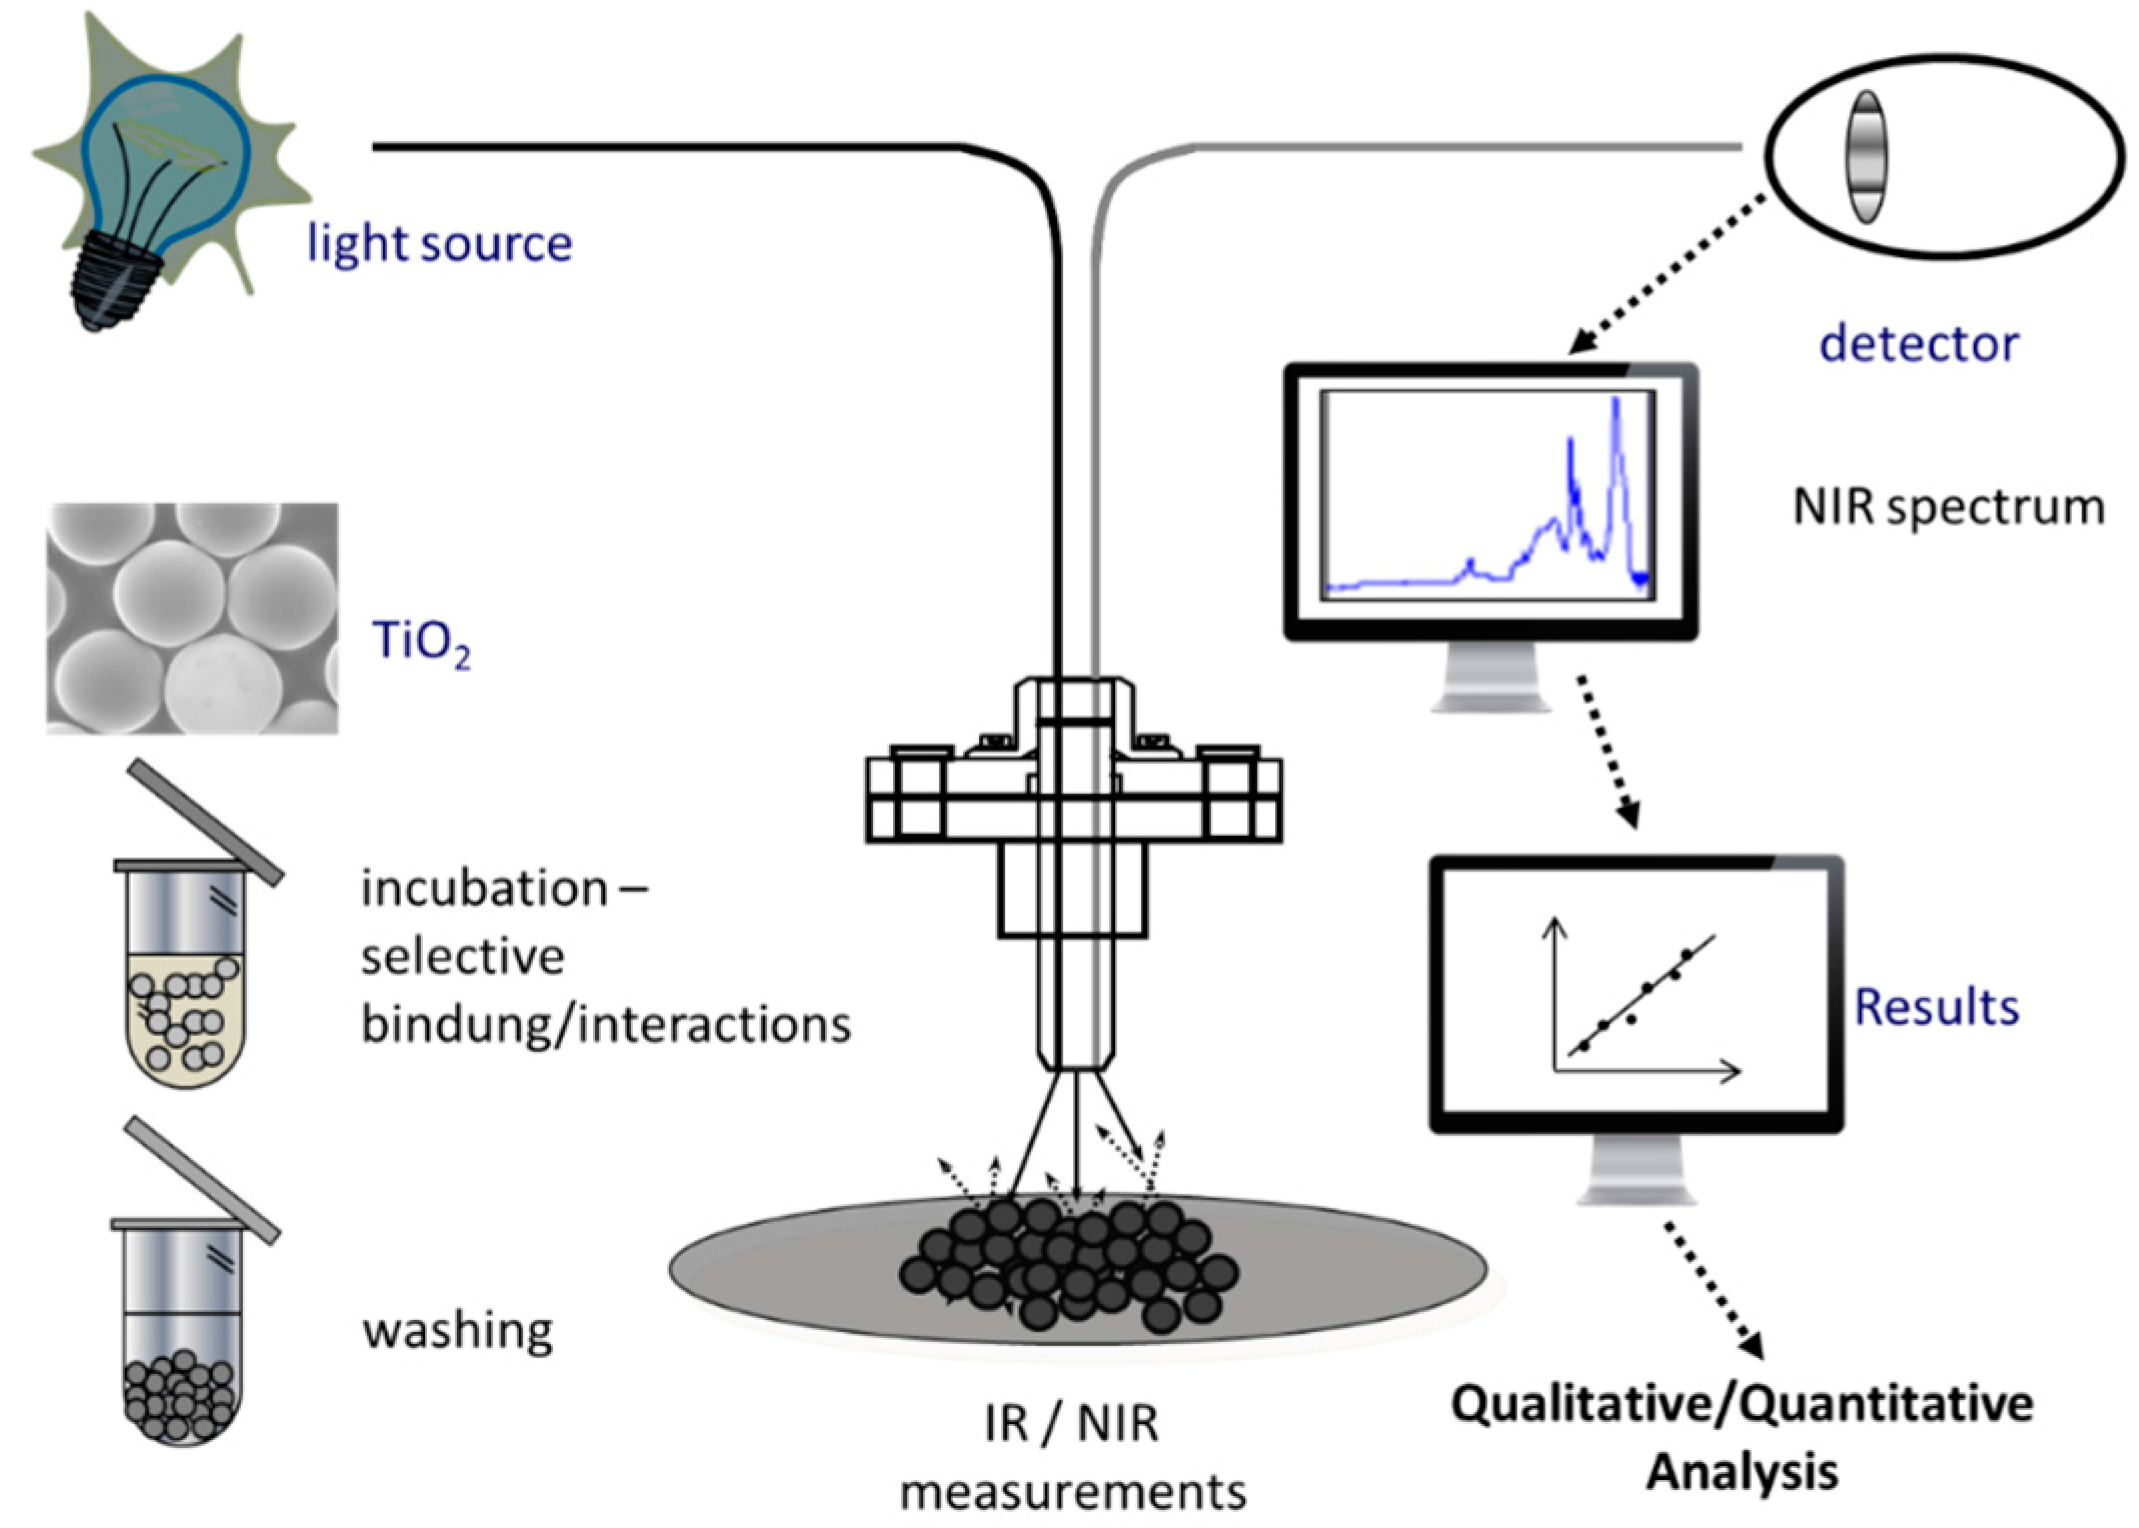
5. Recent Applications Using Selective Enrichment

In the following subsections several approaches using stationary phases designed for the selective enrichment of compounds in the fields of bio-, food and environmental analysis will be described.

5.1. Bioanalysis

In 2009 Petter et al. introduced a methodology termed material-enhanced infrared spectroscopy (MEIRS) for the fast quantification of low-density and high-density lipoproteins (LDL and HDL) in human serum [49]. A key risk factor in the development of atherosclerosis is a high concentration of serum LDL. Titanium oxide (TiO2) beads were used as an adsorbent for selectively immobilizing LDL and HDL-cholesterol and further analyzing the incubated and washed samples via NIR diffuse reflection spectroscopy (Figure 5). A principal component regression (PCR) model of 24 LDL standards in a range from 100 to 1000 ppm (clinical value is 400 ppm) was computed. The wavenumber region between 4000 cm−1 and 7240 cm−1 was found comprising the main information regarding the TiO2-LDL and TiO2-HDL composites. The regression coefficients (r) for LDL and HDL were >0.99 (calibration curve) and >0.97 (validation curve), respectively. The PCR model of TiO2-LDL showed a standard error of estimation (SEE) of 122.80 ppm and a standard error of prediction (SEP) of 121.15 ppm while the PLSR model of TiO2-HDL showed 47.70 and 47.14 ppm, respectively. In order to analyze the concentration of HDL in real serum samples, LDL was removed by adding a precipitation reagent containing 10 mg/mL magnesium dextran-sulfate, followed by incubation and centrifugation. The standard deviation (SD) for the analysis of real samples showed a value of <10%.

5.2. Food Analysis

Xie et al. reported in 2012 a method for the fast determination of trace dimethyl fumarate in milk with NIR spectroscopy following fluidized bed enrichment [82]. The motivation for the work carried out was to improve the sensitivity in NIR spectroscopy. Macroporous styrene resin HZ-816 was used as adsorbent material, and 1L solution of dimethyl fumarate was run through the material for concentration. The milk sample was pretreated to remove interfering matters such as protein, fat and then passed through the material for enrichment. After this, diffuse reflection NIR spectra were measured for the analyte concentration on the material without any elution process. The enrichment and spectral measurement procedures were easy to operate. NIR spectra in 900–1.700 nm were collected for dimethyl fumarate solutions in the concentration range of 0.506–5.060 micogram/mL and then used for multivariate calibration with partial least square (PLS) regression. Spectral pretreatment methods such as multiplicative scatter correction, first derivative, second derivative, and their combinations were carried out to select the optimal PLS model. Root mean square error of cross-validation calculated by leave-one-out cross-validation is 0.430 µg/mL. Measuring ten samples in an independent test-sample set showed a maximum deviation of 5.3%. This application clearly demonstrates how NIR coupled with on-line enrichment can be expanded for the determination of trace analytes even for applications in real liquid samples like milk.
In 2012 Chen et al. published an article about the determination of trace diisooctylphtalate in drink by NIR spectroscopy coupled with membrane enrichment technique [83]. Thereby, the plasticizer diisooctylphthalate (DEHP) containing solutions were passed through and concentrated with the polyethersulfone (PES) membrane and then the surface was detected directly. DEHP could be detected in a concentration range of 0.5–5.0 mg/L with a value for SEP being 0.232 mg/L.
Armenta and Lendl have introduced a flow through sensor benefiting on the selective enrichment employing silica C18 for the selective analysis of caffeine down to a level of 1.8 mg L−1 [84]. The principle of this work is based on a previous paper published by Orega-Barrales et al. in 1999 [85].
Alcudia-Leon et al. reported a novel ATR sensor that integrates SPE and IR detection by the design of a flow cell enabling the online coupling with a sequential injection system. As a stationary phase LiChrolut EN was located in the sensitive element of the ATR without using any external coating. This new technical attempt was evaluated for the qualitative and quantitative analysis of caffeine in soft drinks. The authors reported that the LOD was 7 µg/mL and additionally the method showed high precision, with a RSD of 4 percent. In this article not only the advantages but also the disadvantages of this novel approach have been discussed in great detail [86].

5.3. Environmental Analysis

Shen et al. reported the application of NIR spectroscopy to detect residues of the pesticide phoxim [87]. Phoxim is an organophosphate insecticide produced by the Bayer Corporation. It is allowed for use in limited applications in the European Union. It is banned for use on crops in the EU since 2007 and is applied in veterinary medicine to treat ectoparasitic acarids, which belong to the mite family. Silica gel was employed as absorbent to extract and enrich the low concentration samples, which were subsequently analyzed in diffuse reflection mode. Calibration models were established based on PLSR and leave-one-out cross validation in a range between 0.25 and 1.15 mg/mL and allowed the analysis of the organophosphate insecticide in real samples with an r for calibration being 0.924.
Regan et al. already reported in 1996 on the determination of pesticides in water using ATR-FTIR spectroscopy on PVC/chloroparaffin coatings [88]. The objective of the described study was the development of a novel in situ optical sensor consisting of PVC with a chloroparaffin plasticizer capable of enriching chlorinated pesticides and concentrating them within the penetration depth of the evanescent region of the ATR crystal of optical fiber. Measurements were performed by filling the sample cell with the aqueous pesticide solutions and recording a series of spectra over a period of time. Absorbance spectra were recorded for atrazine at 1577 cm−1 and alachlor at 1104 cm−1. Limits of detection in the region of 2 ppm have been achieved for atrazine and alachlor using a polymer-coated ATR element.
Wei et al. published in 2015 an article about the application of NIR spectroscopy coupled with fluidized bed enrichment and chemometrics to detect low concentration of β-naphthalenesulfonic acid in water [89]. D301 resin was used as an adsorption material to pre-concentrate in solutions in a concentration range of 2.0–100.0 μg/mL. NIR spectra were measured directly relative to the β-naphthalenesulfonic acid adsorbed on the material. An improved partial least squares (PLS) model was attained with the aid of multiplicative scatter correction pretreatment and stability competitive adaptive reweighted sampling wavenumber selection method. The root mean square error of cross validation was 1.87 μg/mL at PLS factor of 7. An independent test set was used to assess the model, with the relative error (RE) in an acceptable range of 0.46 to 10.03% and mean RE of 3.72%. This study confirmed the viability of the proposed method for the measurement of a low content of β-naphthalenesulfonic acid in water.
SPME coupled with MIR spectroscopy has been investigated for the determination of volatile organic compounds in water [90]. Standard solutions of benzene, chlorobenzene, toluene, chloroform, and p-chlorotoluene were prepared by spiking into methanol and diluting in water. In this study, Parafilm was used as a solid phase; it was suspended in the headspace of jars containing the aqueous solution which was then stirred. After this extraction process, FT-IR spectra of the films were obtained. Limits of detection in the range 66 ppb–1.3 ppm were reported, and reproducible extractions were achieved with a 30 min extraction time. In order to validate the procedure, the method was also applied to real water samples spiked with benzene-toluene-xylene (BETX) compounds. It was reported that solid matter within the real water samples did not significantly affect the extraction and detection of the tested compounds.
SPME has been employed in combination with FTIR for estimation of the oil and grease content in water [91]. In this study, several oils and greases were examined including n-hexadecane, n-tetradecane, n-nonadecane and n-docosane. Contaminated water samples were made by adding oil or grease samples to distilled water in a test tube, and polytetrafluoroethylene (PTFE) disks were used as a solid phase. The PTFE disks were suspended in the headspace of test tubes containing the contaminated water samples and the assembly was placed in an oven to facilitate extraction. After the extraction phase, which lasted from 1 to 14 h, transmission spectra of the PTFE disks were obtained. The authors identified CH stretching bands in the spectra of the PTFE disks after extraction, and observed that the position of the maximum corresponding to the CH stretch changed according to the contaminant studied, thus allowing identification of the different oils studied. The effect of the water matrix was studied by using three different types of water (tap, Milli-Q and seawater) and it was reported that the water matrix did not cause any significant difference in detection ability.
Silva et al. reported in 2008 the use of a PVC sensing phase in combination with FTIR spectroscopy for the detection of BTEX compounds in water [92]. The PVC sensing phase was placed in a vial which was filled with the aqueous solution. The studied films reached saturation after 180 min; however, 60 min enrichment was sufficient to generate a signal strong enough to measure the selected analytes. The addition of a plasticiser to the film was shown to improve the sensitivity of the method and limits of detection ranging from 4 ppm (for xylene) to 9 ppm (for ethylbenzene) were reported.
Heinrich et al. in 1990 were among the first to demonstrate the potential of ATR-FTIR spectroscopy combined with polymer coatings generated directly on the IRE surface for quantification of organic compounds in aqueous solution [93]. Aqueous solutions of halogenated hydrocarbons (e.g., C2Cl4, CHCl3) were obtained by injecting them into methanol to generate a solution. In the following distilled water was added. Both gaseous and liquid phase spectral measurements were obtained and a variety of polymer membranes were studied. Linear relationships were found between absorbance at characteristic wavenumbers and concentration of the analyte of interest. Limits of detection were generally lower for the liquid (ranging from 1 to 10 ppm) than for the gaseous (ranging from 4 to 740 ppm) phase.
Yang and Chen developed in 2001 a sensor for detecting phenolic compounds in water using SPMEs combined with FT-IR spectroscopy [94]. The SPMEs were coated directly on to ZnSe IREs and poly(acrylonitrile-co-butadiene) was found to be the most suitable polymer among those tested. Standard aqueous solutions of phenols were used for calibration development and detection limits of lower than 200 ppb were reported, although sensitivity was lower for high polarity compounds, such as phenol, 3-hydroxlyphenol and 2,4-dinitrophenol. This calibration technique was applied to environmental water samples and it was demonstrated that the variable water matrix in such samples did not significantly affect the detection ability. Soaking the SPME phase in water containing 5% methanol for 20 min was found to be sufficient for its regeneration.
Polyisobutylene has shown promise as a membrane for enrichment of volatile organic compounds from aqueous solutions. Yang and Tsai in 2002 used this polymer, coated on a ZnSe ATR crystal for determination of chloroform, trichloroethylene (TCE), toluene, chlorobenzene (CB) and 1-chloronaphthalene (1-CN) in aqueous solutions [95]. The solution was heated to liberate the volatile organic compounds from the sample and a cooling unit was integrated in the system to prevent warming up of the ATR crystal. Limits of detection in the ppm range were reported in this study.
In 2004 Karlowatz et al. employed ethylene/propylene copolymer films coated onto Zn-Se crystals as an enriching phase for ATR-IR quantification of BTEX compounds in water. Aqueous solutions containing mixtures of BTEX compounds were passed through a flow cell in direct contact with the coated crystal. Coating the surface of the internal reflection waveguide (ZnSe crystal) with the ethylene/propylene copolymer facilitated direct detection of the compounds, which exhibited well separated absorption features in the MIR wavelength range. Limits of detection varying between 20 (xylene)–80 (toluene) ppb were reported [96].
The development of molecularly imprinted polymers (MIPs) that selectively extract specific molecules in the presence of others facilitates improved sensitivity of enrichment-based MIR methods for water quality monitoring. One of the first reported papers in this area came from Jakusch et al. in 1997, who developed MIPs selective for the herbicide 2,4-dichlorophenoxyacetic acid (2,4-D) [97]. The MIP film was generated on a ZnSe ATR crystal, mounted into a flow cell through which analyte solutions were pumped. Saturation of the film was achieved after 15 min and the sorption process could be completely reversed using a buffer solution. Limits of detection ranging from 3 to 210 μmoles were reported, depending on the wavenumber range employed in the analysis.
More recently, Flavin et al. developed an MIR sensing methodology in which the properties of the sensing phase can be modified [98]. This is achieved using the sol-gel process in which variations of sol-gel precursors and processing conditions facilitate tailoring of the polymer properties, such as porosity, functionality and polarity. A novel phenyl-trimethoxysilane diphenyldimethoxysilane medium for detection of p-nitrochlorobenzene was designed. The medium was coated on a ZnSe ATR crystal which was placed in a temperature controlled flow cell. Analyte solutions were pumped over the polymer surface. The residence time required for this method was reduced by increasing the temperature of the system, and limits of detection of 0.7 ppm were reported.
Subsequent developments in the use of silver halide fibres for water quality monitoring have been reported. Gobel et al. employed tapered silver halide FOs to improve the sensitivity of FEWS measurement of chlorinated hydrocarbons in water. Decreasing the fibre diameter increases evanescent water absorbtion and thus the sensitivity of the system. The tapered fibres were coated in polyisobutylene (PIB) and TeCE was used as a test analyte in this study. A minimum limit of detection of 50 ppb was achieved using the tapered fibres, while that for non-tapered fibres was in the range 100–300 ppb. The time taken for regeneration of the sensor in this case was around 10 min [99].
Current methods for pesticide detection require sample enrichment followed by GC/GC-MS/LC/enzyme immunoassay and are unsuitable for field testing, continuous monitoring or screening. As a consequence, there has been much interest in the development of MIR sensors for pesticide detection in water. Regan et al. developed a sensor that could detect pesticides in water employing a polymer film coated on either an ATR crystal or silver halide FO coated in a polymer film. Atrazine and alachlor were used as test analytes in this study; the polymer film (PVC with a chloroparaffin pasticiser) enriched their concentration by up to a factor of 30. With the proposed system, detection limits of 2 ppm were achievable [88].
Mizaikoff in 1999 reported the development of an MIR-FEWS sensing system for pollution monitoring in the subsea environment [100]. This consisted of an FTIR spectrometer coupled to a silver halide optical fiber sensor coated with E/PCo. A conventional lab-based ATR spectrometer with an E/PCo layer was used to demonstrate the feasibility of the proposed system and it was shown that it could detect chlorinated hydrocarbons in artificial seawater at low ppb (100–115 ppb) concentrations. The development of a sensor head for this system, consisting of U-shaped silver halide fibres coated with polymer membranes, has also been reported [101]. Simultaneous detection of tetrachloroethylene (TeCE), 1,2-dichlorobenzene and the three xylene isomers at concentrations ranging from 100 to 5 ppm were reported.
Solid-phase extraction (SPE) using synthetic materials in combination with NIRS has been demonstrated for detection of a variety of organic compounds in water. Albuquerque et al. in 2004 measured BTEX compounds in water using a silicone rod attached to an NIR transflectance probe [102]. The probe assembly was placed in an aqueous solution containing BTEX compounds, which was mechanically stirred during measurements. Limits of detection of 8, 7, 2.6 and 3 ppm were reported for benzene, toluene, ethylbenzene and m-xylene, respectively. The sensor was used on gasoline and diesel fuel contaminated water samples and it was possible to discriminate between the contaminant sources using first derivative spectra.
In another study Lima et al. pre-extracted by means of a solid PDMS disk placed in an aqueous solution containing BTEX compounds. After agitation of the solution, the disk was removed and its NIR spectra obtained. Limits of detection of 0.080, 0.12, 0.14 and 0.27 ppm were reported for benzene, toluene, ethylbenzene and xylenes, respectively [103].
Lendl et al. reported in 2009 about the implementation of a new flow-through FT-IR sensor for oil in water analysis based on SPE employing silica C28 particles as a stationary phase. For this on-line approach no chlorinated solvents are required, reducing the environmental impact. Additionally, this method benefited from the minimal sample preparation steps. Spectra were recorded by co-adding 32 scans ata a resolution of 4 cm−1. The vibrational band located at 1462 cm−1 due to the CH(2) bending was integrated from 1475 to 1450 cm−1 and following baseline correction was established between 1485 and 1440 cm−1 using the areas as analytical signal. It was reported that the technique provides a limit of detection (LOD) of 22 mg L−1 and a precision expressed as relative standard deviation (RSD) lower than 5%. The major advantages of this novel approach are the speed and its high level of automation [104].
Roy et al. introduced in 2008 a completely different strategy for determining subnanomolar iron concentrations in ocean seawater. The introduced device uses an iron-specific chelating biomolecule, desferrioxamine B (DFB), covalently immobilized on a mesoporous silica film. Changes in infrared spectral signatures of the immobilized DFB upon Fe(III) complexation provided an reproducible and exact measure of iron on the surface of a chip that has been exposed to seawater. The LOD found was 50 pM for a 1 L sample at pH 1.7 and was used to measure dissolved iron in subarctic Pacific waters without any interference from other elements. This analytical technique provides an autonomous research platform being helpful to better understand the iron distribution and chemistry in seawater [105].
ClearSamplerTM (Richland, WA, USA) offers a wide range of kits consisting of a swab or scoop to pick up the sample and a collection vial with buffer to solubilize or suspend the sample [106]. Several different kits are available for analysing proteins, DNA, but also hazardous materials including anthrax, bacteria (e.g., Salmonella, etc.). In ASTM D7575-11 a standard test method for solvent-free membrane recoverable oil and grease by IR determination is described following this measurement principle [107].

6. Conclusions

Detection limits reported in the majority of vibrational spectroscopy applications have been in the ppm range, while the maximum allowable concentration of some contaminants, especially in environmental waters, is in the ppb range. This wide gap between the ppm and ppb concentration presents a major limitation to the practical widespread adoption of vibrational spectroscopic methods. At the ppm detection level, the main use of these systems would be as screening tools for wide scale monitoring. It should also be considered that these detection limits are usually quoted for experiments carried out in idealised laboratory conditions. The transfer of such sensors from the lab to real quality monitoring of real bodies is still a substantial challenge and extensive validation with real samples is required.

Acknowledgments

Special thanks to the Federal Ministry of Science, Research and Economy (Vienna, Austria), project “Novel analytical tools for the quality assessment of Chinese herbs with metabolic, immune related neuromodulatory effects” (BMWFW-402.000/0017-WF/V/6/2016).

Conflicts of Interest

The author declares no conflict of interest.

Abbreviations

ATRAttenuated total reflection
BTEXBenzene, toluene and xylene
CBChlorobenzene
DEHPDiisooctylphthalate
DLCDiamond like carbon
DLPDigital light processing
DMDDigital mirror devices
ESIElectrospray ionisation
FPAFocal plane array
FT-IRFourier-transfrom infrared
GCGas chromatography
GMA-DVBPoly(glycidyl methacrylate-co-divinylbenzene)
HCHierarchical cluster
HDLHigh density lipoprotein
HPLCHigh-performance liquid chromatography
KMK-means
LDLLow density lipoprotein
LLELiquid-liquid extraction
LODLimit of detection
LVFLinear variable filter
MALDIMatrix assisted laser desorption ionisation
MCTMercury cadmium telluride
MEMSMicro-electro-mechanical system
MIAMultivariate imaging analysis
MIPMolecularly imprinted polymers
MLRMultiple linear regression
MSMass spectrometry
MVAMultivariate analysis
PCAPrincipal component analysis
PDMSPoly(dimethylsiloxane)
PESPolyethersulfone
PIBPolyisobutylene
PLSRPartial least square regression
PS-DVBPoly(styrene-co-divinylbenzene)
PTFEPolytetrafluoroethylene
PVCPoly(vinylchloride)
RERelative error
SDStandard deviation
SEEStandard error of estimation
SEIRASurface enhanced infrared analysis
SEPStandard error of prediction
SERSSurface enhanced Raman spectroscopy
SNRSignal to noise ratio
SPESolid-phase extraction
SPMESolid-phase micro extraction
TECThermoelectric cooling
VisVisible

References

  1. Marvin, C.H.; Brindle, I.D.; Hall, C.D.; Chiba, M. Automated high-performance liquid chromatography for the determination of pesticides in water using solid phase extraction. Anal. Chem. 1990, 62, 1495–1498. [Google Scholar] [CrossRef]
  2. Junk, G.A.; Richard, J.J.; Grieser, M.D.; Witiak, D.; Witiak, J.L.; Arguello, M.D.; Vick, R.; Svec, H.J.; Fritz, J.S.; Calder, G.V. Use of macroreticular resins in the analysis of water for trace organic contaminants. J. Chromatogr. A 1974, 99, 745–762. [Google Scholar] [CrossRef]
  3. Przyjazny, A. Evaluation of the suitability of selected porous polymers for preconcentration of organosulphur compounds from water. J. Chromatogr. A 1985, 346, 61–67. [Google Scholar] [CrossRef]
  4. Wolkoff, A.W.; Creed, C. Use of Sep-Pak R C 18 Cartridges for the collection & concentration of environmental samples. J. Liq. Chromatogr. 2006, 4, 1459–1472. [Google Scholar]
  5. Huck, C.W.; Bonn, G.K. Evaluation of detection methods for the reversed-phase HPLC determination of 3’,4’,5’-trimethoxyflavone in different phytopharmaceutical products and in human serum. Phytochem. Anal. 2001, 12, 104–109. [Google Scholar] [CrossRef] [PubMed]
  6. Pirker, R.; Huck, C.; Bonn, G. Simultaneous determination of hypericin and hyperforin in human plasma and serum using liquid-liquid extraction, high-performance liquid chromatography and liquid chromatography-tandem mass spectrometry. J. Chromatogr. B 2002, 777, 147–153. [Google Scholar] [CrossRef]
  7. Valtiner, S.M.; Bonn, G.K.; Huck, C.W. Characterisation of different types of hay by solid-phase micro-extraction-gas chromatography mass spectrometry and multivariate data analysis. Phytochem. Anal. 2008, 19, 359–367. [Google Scholar] [CrossRef] [PubMed]
  8. Huck, C.W.; Bonn, G.K. Recent developments in polymer-based sorbents for solid-phase extraction. J. Chromatogr. A 2000, 885, 51–72. [Google Scholar] [CrossRef]
  9. Sun, J.J.; Fritz, J.S. Chemically modified resins for solid-phase extraction. J. Chromatogr. A 1992, 590, 197–202. [Google Scholar] [CrossRef]
  10. Huck, C.; Buchmeiser, M.; Bonn, G. Fast analysis of flavonoids in plant extracts by liquid chromatography-ultraviolet absorbance detection on poly(carboxylic acid)-coated silica and electrospray ionization tandem mass spectrometric detection. J. Chromatogr. A 2002, 943, 33–38. [Google Scholar] [CrossRef]
  11. Stecher, G.; Huck, C.W.; Stöggl, W.M.; Bonn, G.K. Phytoanalysis: A challenge in phytomics. TrAC Trends Anal. Chem. 2003, 22, 1–14. [Google Scholar] [CrossRef]
  12. Pirker, R.; Huck, C.W.; Popp, M.; Bonn, G.K. Simultaneous determination of gentisic, salicyluric and salicylic acid in human plasma using solid-phase extraction, liquid chromatography and electrospray ionization mass spectrometry. J. Chromatogr. B. Anal. Technol. Biomed. Life Sci. 2004, 809, 257–264. [Google Scholar] [CrossRef]
  13. Sultan, M.; Stecher, G.; Stöggl, W.M.; Bakry, R.; Zaborski, P.; Huck, C.W.; el Kousy, N.M.; Bonn, G.K. Sample pretreatment and determination of non steroidal anti-inflammatory drugs (NSAIDs) in pharmaceutical formulations and biological samples (blood, plasma, erythrocytes) by HPLC-UV-MS and mgr-HPLC. Curr. Med. Chem. 2005, 12, 573–588. [Google Scholar] [PubMed]
  14. Stecher, G.; Jarukamjorn, K.; Zaborski, P.; Bakry, R.; Huck, C.W.; Bonn, G.K. Evaluation of extraction methods for the simultaneous analysis of simple and macrocyclic trichothecenes. Talanta 2007, 73, 251–257. [Google Scholar] [CrossRef] [PubMed]
  15. Szabo, Z.; Vallant, R.M.; Takátsy, A.; Bakry, R.; Najam-ul-Haq, M.; Rainer, M.; Huck, C.W.; Bonn, G.K. Laser desorption/ionization mass spectrometric analysis of small molecules using fullerene-derivatized silica as energy-absorbing material. J. Mass Spectrom. 2010, 45, 545–552. [Google Scholar] [CrossRef] [PubMed]
  16. Sonderegger, H.; Rameshan, C.; Lorenz, H.; Klauser, F.; Klerks, M.; Rainer, M.; Bakry, R.; Huck, C.W.; Bonn, G.K. Surface-assisted laser desorption/ionization-mass spectrometry using TiO2-coated steel targets for the analysis of small molecules. Anal. Bioanal. Chem. 2011, 401, 1963–1974. [Google Scholar] [CrossRef] [PubMed]
  17. Schönbichler, S.A.; Falser, G.F.; Hussain, S.; Bittner, L.; Abel, G.; Popp, M.; Bonn, G.K.; Huck, C. Comparison of NIR and ATR-IR spectroscopy for the determination of the antioxidant capacity of Primulae flos cum calycibus. Anal. Methods 2014, 6, 6343–6351. [Google Scholar] [CrossRef]
  18. Hussain, S.; Güzel, Y.; Schönbichler, S.A.; Rainer, M.; Huck, C.W.; Bonn, G.K. Solid-phase extraction method for the isolation of plant thionins from European mistletoe, wheat and barley using zirconium silicate embedded in poly(styrene-co-divinylbenzene) hollow-monoliths. Anal. Bioanal. Chem. 2013, 405, 7509–7521. [Google Scholar] [CrossRef] [PubMed]
  19. Hussain, S.; Pezzei, C.; Güzel, Y.; Rainer, M.; Huck, C.W.; Bonn, G.K. Zirconium silicate assisted removal of residual proteins after organic solvent deproteinization of human plasma, enhancing the stability of the LC-ESI-MS response for the bioanalysis of small molecules. Anal. Chim. Acta 2014, 852, 284–292. [Google Scholar] [CrossRef] [PubMed]
  20. Schemeth, D.; Noël, J.-C.; Jakschitz, T.; Rainer, M.; Tessadri, R.; Huck, C.W.; Bonn, G.K. Poly(N-vinylimidazole/ethylene glycol dimethacrylate) for the purification and isolation of phenolic acids. Anal. Chim. Acta 2015, 885, 199–206. [Google Scholar] [CrossRef] [PubMed]
  21. Uhlschmied, C.; Krieg, C.; Abel, G.; Popp, M.; Huck, C.W.; Bonn, G.K. Evaluation of commercial solid-phase extraction (SPE) carrier materialsfor the selective automated enrichment of monoterpenoides and their analysis in cough drops, mouthwashes and bath additives by gas-chromatography mass spectrometry (GC-MS). Open Anal. Chem. J. 2013, 7, 12–21. [Google Scholar] [CrossRef]
  22. Feuerstein, I.; Rainer, M.; Bernardo, K.; Stecher, G.; Huck, C.W.; Kofler, K.; Pelzer, A.; Horninger, W.; Klocker, H.; Bartsch, G.; et al. Derivatized cellulose combined with MALDI-TOF MS: A new tool for serum protein profiling. J. Proteome Res. 2005, 4, 2320–2326. [Google Scholar] [CrossRef] [PubMed]
  23. Aprilita, N.H.; Huck, C.W.; Bakry, R.; Feuerstein, I.; Stecher, G.; Morandell, S.; Huang, H.-L.; Stasyk, T.; Huber, L.A.; Bonn, G.K. Poly(glycidyl methacrylate/divinylbenzene)-IDA-FeIII in phosphoproteomics. J. Proteome Res. 2005, 4, 2312–2319. [Google Scholar] [CrossRef] [PubMed]
  24. Huck, C.; Bakry, R.; Bonn, G. Sample preparation techniques for mass spectrometry in proteomics using recently developed highly selective materials. Curr. Proteomics 2005, 2, 269–285. [Google Scholar] [CrossRef]
  25. Rainer, M.; Muhammad, N.-H.; Huck, C.W.; Feuerstein, I.; Bakry, R.; Huber, L.A.; Gjerde, D.T.; Zou, X.; Qian, H.; Du, X.; et al. Ultra-fast mass fingerprinting by high-affinity capture of peptides and proteins on derivatized poly(glycidyl methacrylate/divinylbenzene) for the analysis of serum and cell lysates. Rapid Commun. Mass Spectrom. 2006, 20, 2954–2960. [Google Scholar] [CrossRef] [PubMed]
  26. Rainer, M.; Najam-ul-Haq, M.; Bakry, R.; Huck, C.W.; Bonn, G.K. Mass spectrometric identification of serum peptides employing derivatized poly(glycidyl methacrylate/divinyl benzene) particles and μ-HPLC. J. Proteome Res. 2007, 6, 382–386. [Google Scholar] [CrossRef] [PubMed]
  27. Najam-ul-Haq, M.; Rainer, M.; Schwarzenauer, T.; Huck, C.W.; Bonn, G.K. Chemically modified carbon nanotubes as material enhanced laser desorption ionisation (MELDI) material in protein profiling. Anal. Chim. Acta 2006, 561, 32–39. [Google Scholar] [CrossRef]
  28. Najam-ul-Haq, M. Chemically modified nano crystalline diamond layer as material enhanced laser desorption ionisation (meldi) surface in protein profiling. Curr. Nanosci. 2015, 2, 1–7. [Google Scholar] [CrossRef]
  29. Kloss, F.R.; Najam-Ul-Haq, M.; Rainer, M.; Gassner, R.; Lepperdinger, G.; Huck, C.W.; Bonn, G.; Klauser, F.; Liu, X.; Memmel, N.; et al. Nanocrystalline diamond—An excellent platform for life science applications. J. Nanosci. Nanotechnol. 2007, 7, 4581–4587. [Google Scholar] [PubMed]
  30. Vallant, R.M.; Szabo, Z.; Trojer, L.; Najam-ul-Haq, M.; Rainer, M.; Huck, C.W.; Bakry, R.; Bonn, G.K. A new analytical material-enhanced laser desorption ionization (MELDI) based approach for the determination of low-mass serum constituents using fullerene derivatives for selective enrichment. J. Proteome Res. 2007, 6, 44–53. [Google Scholar] [CrossRef] [PubMed]
  31. Najam-ul-Haq, M.; Rainer, M.; Szabó, Z.; Vallant, R.; Huck, C.W.; Bonn, G.K. Role of carbon nano-materials in the analysis of biological materials by laser desorption/ionization-mass spectrometry. J. Biochem. Biophys. Methods 2007, 70, 319–328. [Google Scholar] [CrossRef] [PubMed]
  32. Rainer, M.; Najam-ul-Haq, M.; Huck, C.W.; Vallant, R.M.; Heigl, N.; Hahn, H.; Bakry, R.; Bonn, G.K. Carbon based sample supports and matrices for laser desorption/ionization mass spectrometry. Recent Pat. Nanotechnol. 2007, 1, 113–119. [Google Scholar] [CrossRef]
  33. Vallant, R.M.; Szabo, Z.; Bachmann, S.; Bakry, R.; Najam-ul-Haq, M.; Rainer, M.; Heigl, N.; Petter, C.; Huck, C.W.; Bonn, G.K. Development and application of C60-fullerene bound silica for solid-phase extraction of biomolecules. Anal. Chem. 2007, 79, 8144–8153. [Google Scholar] [CrossRef] [PubMed]
  34. Najam-ul-Haq, M.; Rainer, M.; Huck, C.W.; Hausberger, P.; Kraushaar, H.; Bonn, G.K. Nanostructured diamond-like carbon on digital versatile disc as a matrix-free target for laser desorption/ionization mass spectrometry. Anal. Chem. 2008, 80, 7467–7472. [Google Scholar] [CrossRef] [PubMed]
  35. Najam-ul-Haq, M.; Rainer, M.; Huck, C.W.; Ashiq, M.N.; Bonn, G.K. Chemically modified diamond-like carbon (DLC) for protein enrichment and profiling by MALDI-MS. Amino Acids 2012, 43, 823–831. [Google Scholar] [CrossRef] [PubMed]
  36. Rainer, M.; Sonderegger, H.; Bakry, R.; Huck, C.W.; Morandell, S.; Huber, L.A.; Gjerde, D.T.; Bonn, G.K. Analysis of protein phosphorylation by monolithic extraction columns based on poly(divinylbenzene) containing embedded titanium dioxide and zirconium dioxide nano-powders. Proteomics 2008, 8, 4593–4602. [Google Scholar] [CrossRef] [PubMed]
  37. Greiderer, A.; Rainer, M.; Najam-ul-Haq, M.; Vallant, R.M.; Huck, C.W.; Bonn, G.K. Derivatized graphitic nanofibres (GNF) as a new support material for mass spectrometric analysis of peptides and proteins. Amino Acids 2009, 37, 341–348. [Google Scholar] [CrossRef] [PubMed]
  38. Zou, X.; Zhong, L.; Liu, D.; Yang, B.; Lou, Y.; Peng, J.; Rainer, M.; Feuerstein, I.; Muhammad, N.-H.; Huck, C.W.; et al. Novel multifunctional chitosan-GMA-IDA-Cu(II) nanospheres for high dynamic range characterization of the human plasma proteome. Anal. Bioanal. Chem. 2011, 400, 747–756. [Google Scholar] [CrossRef] [PubMed]
  39. Jabeen, F.; Hussain, D.; Fatima, B.; Musharraf, S.G.; Huck, C.W.; Bonn, G.K.; Najam-ul-Haq, M. Silica-lanthanum oxide: Pioneer composite of rare-earth metal oxide in selective phosphopeptides enrichment. Anal. Chem. 2012, 84, 10180–10185. [Google Scholar] [CrossRef] [PubMed]
  40. Najam-Ul-Haq, M.; Rainer, M.; Heigl, N.; Szabo, Z.; Vallant, R.; Huck, C.W.; Engelhardt, H.; Bischoff, K.-D.; Bonn, G.K. Nano-structured support materials, their characterisation and serum protein profiling through MALDI/TOF-MS. Amino Acids 2008, 34, 279–286. [Google Scholar] [CrossRef] [PubMed]
  41. Bakry, R.; Rainer, M.; Huck, C.W.; Bonn, G.K. Protein profiling for cancer biomarker discovery using matrix-assisted laser desorption/ionization time-of-flight mass spectrometry and infrared imaging: A review. Anal. Chim. Acta 2011, 690, 26–34. [Google Scholar] [CrossRef] [PubMed]
  42. Najam-ul-Haq, M.; Jabeen, F.; Hussain, D.; Saeed, A.; Musharraf, S.G.; Huck, C.W.; Bonn, G.K. Versatile nanocomposites in phosphoproteomics: A review. Anal. Chim. Acta 2012, 747, 7–18. [Google Scholar] [CrossRef] [PubMed]
  43. Hussain, D.; Najam-ul-Haq, M.; Jabeen, F.; Ashiq, M.N.; Athar, M.; Rainer, M.; Huck, C.W.; Bonn, G.K. Functionalized diamond nanopowder for phosphopeptides enrichment from complex biological fluids. Anal. Chim. Acta 2013, 775, 75–84. [Google Scholar] [CrossRef] [PubMed]
  44. Buszewski, B.; Szultka, M. Past, present, and future of solid phase extraction: A review. Crit. Rev. Anal. Chem. 2012, 42, 198–213. [Google Scholar] [CrossRef]
  45. Boonjob, W. An Overview about Recent Advances of Micro-Solid Phase Extraction in Flow Based Techniques. Available online: http://www.austinpublishinggroup.com/analytical-pharmaceutical-chemistry/fulltext/ ajapc-v1-id1006.php (accessed on 10 February 2016).
  46. Huck, C.W.; Ohmacht, R.; Szabo, Z.; Bonn, G.K. Near infrared spectroscopy, cluster and multivariate analysis : Characterisation of silica materials for liquid chromatography. J. Near Infrared Spectrosc. 2006, 14, 51–57. [Google Scholar] [CrossRef]
  47. Heigl, N.; Petter, C.H.; Lieb, M.; Bonn, G.K.; Huck, C.W. Near-infrared reflection spectroscopy and partial least squares regression for determining the total carbon coverage of silica packings for liquid chromatography. Vib. Spectrosc. 2009, 49, 155–161. [Google Scholar] [CrossRef]
  48. Heigl, N.; Greiderer, A.; Petter, C.H.; Kolomiets, O.; Siesler, H.W.; Ulbricht, M.; Bonn, G.K.; Huck, C.W. Simultaneous determination of the micro-, meso-, and macropore size fractions of porous polymers by a combined use of Fourier transform near-infrared diffuse reflection spectroscopy and multivariate techniques. Anal. Chem. 2008, 80, 8493–500. [Google Scholar] [CrossRef] [PubMed]
  49. Petter, C.H.; Heigl, N.; Bakry, R.; Bonn, G.K.; Ritsch, A.; Huck, C.W. Quantification of low-density and high-density lipoproteins in human serum by material enhanced infrared spectroscopy (MEIRS). Curr. Med. Chem. 2009, 16, 4601–4608. [Google Scholar] [CrossRef] [PubMed]
  50. Huck, C.W. Advances of infrared spectroscopy in natural product research. Phytochem. Lett. 2015, 11, 384–393. [Google Scholar] [CrossRef]
  51. Siesler, H.W.; Ozaki, Y.; Kawata, S.; Heise, H.M. (Eds.) Near-Infrared Spectroscopy: Principles, Instruments, Applications (Google Ebook); Wiley: Weinheim, Germany, 2008.
  52. Arthur, C.L.; Pratt, K.; Motlagh, S.; Pawliszyn, J.; Belardi, R.P. Environmental analysis of organic compounds in water using solid phase micro extraction. J. High Resolut. Chromatogr. 1992, 15, 741–744. [Google Scholar] [CrossRef]
  53. Mcclure, W.F. 204 years of near infrared technology: 1800–2003. J. Near Infrared Spectrosc. 2003, 11, 487–518. [Google Scholar] [CrossRef]
  54. Blanco, M.; Villarroya, I. NIR spectroscopy: A rapid-response analytical tool. TrAC Trends Anal. Chem. 2002, 21, 240–250. [Google Scholar] [CrossRef]
  55. Barton, F. Theory and principles of near infrared spectroscopy. Spectrosc. Eur. 2002, 14, 12–18. [Google Scholar]
  56. Pallua, J.D.; Pezzei, C.; Huck-Pezzei, V.; A. Schonbichler, S.; K. Bittner, L.; K. Bonn, G.; Saeed, A.; Majeed, S.; Farooq, A.; Najam-ul-Haq, M.; et al. Advances of infrared spectroscopic imaging and mapping technologies of plant material. Curr. Bioact. Compd. 2011, 7, 106–117. [Google Scholar] [CrossRef]
  57. Lutz, O.M.D.; Bonn, G.K.; Rode, B.M.; Huck, C.W. Reproducible quantification of ethanol in gasoline via a customized mobile near-infrared spectrometer. Anal. Chim. Acta 2014, 826, 61–68. [Google Scholar] [CrossRef] [PubMed]
  58. Huck-Pezzei, V.A.; Seitz, I.; Karer, R.; Schmutzler, M.; De Benedictis, L.; Wild, B.; Huck, C.W. Alps food authentication, typicality and intrinsic quality by near infrared spectroscopy. Food Res. Int. 2014, 62, 984–990. [Google Scholar] [CrossRef]
  59. De Benedictis, L.; Schmutzler, M.; Karer, R.; Eisenstecken, D.; Huck-Pezzei, V.; Robatscher, P.; Oberhuber, M.; Mimmo, T.; Capici, C.; Scampicchio, M.; et al. Near infrared spectroscopy as a tool for quality control of food of the Alpine region—A short report about a cross-border project. NIR News 2012, 23, 12–15. [Google Scholar] [CrossRef]
  60. Kessler, W.; Kessler, R.W. Multivariate curve resolution: A method of evaluating the kinetics of biotechnological reactions. Anal. Bioanal. Chem. 2006, 384, 1087–1095. [Google Scholar] [CrossRef] [PubMed]
  61. Huck, C.W.; Bittner, L. Infrared spectroscopy: A novel tool for the physicochemical characterization of particulate, monolithic and coated stationary phases. Chromatographia 2011, 73, 29–34. [Google Scholar] [CrossRef]
  62. Pemberger, N.; Bittner, L.; Huck, C.W. Using near-infrared spectroscopy to monitor the curing reaction of silicone adhesives. Spectroscopy 2015, 30, 8–19. [Google Scholar]
  63. Workman, J.; Weyer, L. Practical Guide and Spectral Atlas for Interpretive Near-Infrared Spectroscopy, 2nd ed.; CRC Press Book: Boca Raton, FL, USA, 2012. [Google Scholar]
  64. Faber, N.K. Multivariate sensitivity for the interpretation of the effect of spectral pretreatment methods on near-infrared calibration model predictions. Anal. Chem. 1999, 71, 557–565. [Google Scholar] [CrossRef] [PubMed]
  65. Savitzky, A.; Golay, M.J.E. Smoothing and differentiation of data by simplified least squares procedures. Anal. Chem. 1964, 36, 1627–1639. [Google Scholar] [CrossRef]
  66. Spectroscopic Properties of Inorganic and Organometallic Compounds: Techniques, Materials and Applications; Royal Society of Chemistry: Cambridge, UK, 2014.
  67. Fahrenfort, J. Attenuated total reflection. Spectrochim. Acta 1961, 17, 698–709. [Google Scholar] [CrossRef]
  68. Messerschmidt, R.G.; Sting, D.W. Microscope Having Dual Remote Image Masking. U.S. Patent 4877960, 31 October 1989. [Google Scholar]
  69. Lewis, E.N.; Treado, P.J.; Reeder, R.C.; Story, G.M.; Dowrey, A.E.; Marcott, C.; Levin, I.W. Fourier Transform Spectroscopic Imaging Using an Infrared Focal-Plane Array Detector. Anal. Chem. 1995, 67, 3377–3381. [Google Scholar] [CrossRef] [PubMed]
  70. Salzer, R.; Siesler, H.W. Infrared and Raman Spectroscopic Imaging; Wiley-VCH: Weinheim, Germany, 2009. [Google Scholar]
  71. Gendrin, C.; Roggo, Y.; Collet, C. Pharmaceutical applications of vibrational chemical imaging and chemometrics: A review. J. Pharm. Biomed. Anal. 2008, 48, 533–553. [Google Scholar] [CrossRef] [PubMed]
  72. Pezzei, C.; Pallua, J.D.; Schaefer, G.; Seifarth, C.; Huck-Pezzei, V.; Bittner, L.K.; Klocker, H.; Bartsch, G.; Bonn, G.K.; Huck, C.W. Characterization of normal and malignant prostate tissue by Fourier transform infrared microspectroscopy. Mol. Biosyst. 2010, 6, 2287–2295. [Google Scholar] [CrossRef] [PubMed]
  73. Aroca, R.F.; Ross, D.J.; Domingo, C. Surface-enhanced infrared spectroscopy. Appl. Spectrosc. 2004, 58, 324A–338A. [Google Scholar] [CrossRef] [PubMed]
  74. De La Chapelle, M.L.; Pucci, A. Nanoantenna: Plasmon-Enhanced Spectroscopies for Biotechnological Applications; CRC Press: Boca Raton, FL, USA, 2013. [Google Scholar]
  75. Ataka, K.; Stripp, S.T.; Heberle, J. Surface-enhanced infrared absorption spectroscopy (SEIRAS) to probe monolayers of membrane proteins. Biochim. Biophys. Acta 2013, 1828, 2283–2293. [Google Scholar] [CrossRef] [PubMed]
  76. Adato, R.; Altug, H. In-situ ultra-sensitive infrared absorption spectroscopy of biomolecule interactions in real time with plasmonic nanoantennas. Nat. Commun. 2013, 4, 2154. [Google Scholar] [CrossRef] [PubMed]
  77. Osawa, M. Dynamic processes in electrochemical reactions studied by surface-enhanced infrared absorption spectroscopy (SEIRAS). Bull. Chem. Soc. Jpn. 1997, 70, 2861–2880. [Google Scholar] [CrossRef]
  78. Wanzenböck, H.D.; Mizaikoff, B.; Weissenbacher, N.; Kellner, R. Surface enhanced infrared absorption spectroscopy (SEIRA) using external reflection on low-cost substrates. Fresenius. J. Anal. Chem. 1998, 362, 15–20. [Google Scholar] [CrossRef]
  79. Sánchez-Cortés, S.; Domingo, C.; García-Ramos, J.V.; Aznárez, J.A. Surface-enhanced vibrational study (seir and sers) of dithiocarbamate pesticides on gold films. Langmuir 2001, 17, 1157–1162. [Google Scholar] [CrossRef]
  80. Waswa, J.; Irudayaraj, J.; DebRoy, C. Direct detection of E. coli O157:H7 in selected food systems by a surface plasmon resonance biosensor. LWT Food Sci. Technol. 2007, 40, 187–192. [Google Scholar] [CrossRef]
  81. Gonzalvez, A.; Garrigues, S.; de la Guardia, M.; Armenta, S. The ways to the trace level analysis in infrared spectroscopy. Anal. Methods 2011, 3, 43–52. [Google Scholar] [CrossRef]
  82. Xie, Y.-J.; Wang, Z.; Hu, W.-P.; Xu, S. Fast determination of trace dimethyl fumarate in milk with near infrared spectroscopy following fluidized bed enrichment. Anal. Bioanal. Chem. 2012, 404, 3189–3194. [Google Scholar] [CrossRef] [PubMed]
  83. Chen, G.P.; Tong, P.J.; Li, X.Y.; Li, X.L.; Du, Y. Determination of diisooctylphthalate in drink by NIR spectroscopy coupled with membrane enrichment technique. J. Instrum. Anal. 2012, 31, 605–608. [Google Scholar]
  84. Armenta, S.; Lendl, B. Flow through FTIR sensor based on solid phase spectroscopy (SPS) on conventional octadecyl (C18) silica. Vib. Spectrosc. 2009, 51, 60–64. [Google Scholar] [CrossRef]
  85. Ortega-Barrales, P.; Ayora-Cañada, M.J.; Garrrigues, A.S.; de la Guardia, M. Solid phase Fourier transform near infrared spectroscopy. Analyst 1999, 4, 579–582. [Google Scholar] [CrossRef]
  86. Alcudia-León, M.C.; Lucena, R.; Cárdenas, S.; Valcárcel, M. Characterization of an attenuated total reflection-based sensor for integrated solid-phase extraction and infrared detection. Anal. Chem. 2008, 80, 1146–1151. [Google Scholar] [CrossRef] [PubMed]
  87. Shen, F.; Yan, Z.; Ye, Z.; Ying, Y. Application of Near-infrared spectroscopy to detection of pesticide phoxim residues. Guang Pu Xue Yu Guang Pu Fen Xi 2009, 29, 2421–2424. [Google Scholar]
  88. Regan, F.; Meaney, M.; Vos, J.G.; MacCraith, B.D.; Walsh, J.E. Determination of pesticides in water using ATR-FTIR spectroscopy on PVU chloroparaffin coatings. Anal. Chim. Acta 1996, 334, 85–92. [Google Scholar] [CrossRef]
  89. Li, W.; Zhang, X.; Zheng, K.; Du, Y.; Cap, P.; Sui, T.; Geng, J. Application of near infrared spectroscopy coupled with fluidized bed enrichment and chemometrics to detect low concentration of β-naphthalenesulfonic acid. J. AOAC Int. 2015, 98, 183–187. [Google Scholar] [CrossRef] [PubMed]
  90. Heglund, D.L.; Tilotta, D.C. Determination of volatile organic compounds in water by solid phase microextraction and infrared spectroscopy. Environ. Sci. Technol. 1996, 30, 1212–1219. [Google Scholar] [CrossRef]
  91. Ferrer, N.; Romero, M.T. Fourier transform infrared spectroscopy and solid phase extraction applied to the determination of oil and grease in water matrices. Microchim. Acta 2002, 140, 35–39. [Google Scholar] [CrossRef]
  92. Silva, A.M.S.; Pimentel, M.F.; Raimundo, I.M.; Almeida, Y.M.B. A PVC sensing phase for determination of BTEX in water employing mid-infrared spectroscopy. Vib. Spectrosc. 2008, 46, 39–44. [Google Scholar] [CrossRef]
  93. Heinrich, P.; Wyzgol, R.; Schrader, B.; Hatzilazaru, A.; Lübbers, D.W. Determination of organic compounds by ir/atr spectroscopy with polymer-coated internal reflection elements. Appl. Spectrosc. 1990, 44, 1641–1646. [Google Scholar] [CrossRef]
  94. Yang, N.; Ren, G. Application of near-infrared reflectance spectroscopy to the evaluation of rutin and d-chiro-inositol contents in tartary buckwheat. J. Agric. Food Chem. 2008, 56, 761–764. [Google Scholar] [CrossRef] [PubMed]
  95. Yang, J.; Tsai, S.-S. Cooled internal reflection element for infrared chemical sensing of volatile to semi-volatile organic compounds in the headspace of aqueous solutions. Anal. Chim. Acta 2002, 462, 235–244. [Google Scholar] [CrossRef]
  96. Karlowatz, M.; Kraft, M.; Mizaikoff, B. Simultaneous quantitative determination of benzene, toluene, and xylenes in water using mid-infrared evanescent field spectroscopy. Anal. Chem. 2004, 76, 2643–2648. [Google Scholar] [CrossRef] [PubMed]
  97. Jakusch, M.; Mizaikoff, B.; Kellner, R.; Katzir, A. Towards a remote IR fiber-optic sensor system for the determination of chlorinated hydrocarbons in water. Sens. Actuat. B Chem. 1997, 38, 83–87. [Google Scholar] [CrossRef]
  98. Flavin, K.; Mullowney, J.; Murphy, B.; Owens, E.; Kirwan, P.; Murphy, K.; Hughes, H.; McLoughlin, P. The development of novel organically modified sol-gel media for use with ATR/FTIR sensing. Analyst 2007, 132, 224–229. [Google Scholar] [CrossRef] [PubMed]
  99. Göbel, R.; Krska, R.; Kellner, R.; Kastner, J.; Lambrecht, A.; Tacke, M.; Katzir, A. Enhancing the sensitivity of chemical sensors for chlorinated hydrocarbons in water by the use of tapered silver halide fibers and tunable diode lasers. Appl. Spectrosc. 1995, 49, 1174–1177. [Google Scholar] [CrossRef]
  100. Mizaikoff, B. Mid-infrared evanescent wave sensors—A novel approach for subsea monitoring. Meas. Sci. Technol. 1999, 10, 1185–1194. [Google Scholar] [CrossRef]
  101. Kraft, M.; Karlowatz, M.; Mizaikoff, B.; Stück, R.; Steden, M.; Ulex, M.; Amann, H. Sensor head development for mid-infrared fibre-optic underwater sensors. Meas. Sci. Technol. 2002, 13, 1294–1303. [Google Scholar] [CrossRef]
  102. Albuquerque, J.S.; Pimentel, M.F.; Silva, V.L.; Raimundo, I.M.; Rohwedder, J.J.R.; Pasquini, C. Silicone sensing phase for detection of aromatic hydrocarbons in water employing near-infrared spectroscopy. Anal. Chem. 2005, 77, 72–77. [Google Scholar] [CrossRef] [PubMed]
  103. Lima, K.M.G.; Raimundo, I.M.; Pimentel, M.F. Improving the detection limits of near infrared spectroscopy in the determination of aromatic hydrocarbons in water employing a silicone sensing phase. Sens. Actuat. B Chem. 2007, 125, 229–233. [Google Scholar] [CrossRef]
  104. Pérez-Palacios, D.; Armenta, S.; Lendl, B. Flow-through Fourier transform infrared sensor for total hydrocarbons determination in water. Appl. Spectrosc. 2009, 63, 1015–1021. [Google Scholar] [CrossRef] [PubMed]
  105. Roy, E.G.; Jiang, C.; Wells, M.L.; Tripp, C. Determining subnanomolar iron concentrations in oceanic seawater using a siderophore-modified film analyzed by infrared spectroscopy. Anal. Chem. 2008, 80, 4689–4695. [Google Scholar] [CrossRef] [PubMed]
  106. Rose, L.J.; Hodges, L.; O’Connell, H.; Noble-Wang, J. National validation study of a cellulose sponge wipe-processing method for use after sampling Bacillus anthracis spores from surfaces. Appl. Environ. Microbiol. 2011, 77, 8355–8359. [Google Scholar] [CrossRef] [PubMed]
  107. ASTM D7575—11 Standard Test Method for Solvent-Free Membrane Recoverable Oil and Grease by Infrared Determination. Available online: http://www.astm.org/Standards/D7575.htm (accessed on 25 March 2016).
Figure 1. Measurement principles of (A) diffuse reflection, (B) transmission and (C) transflection mode.
Molecules 21 00633 g001
Figure 2. Enhanced detection system for a low-weight (<60 g) NIR probe [57].
Molecules 21 00633 g002
Figure 3. (a) Illustration of the evanescent wave; (b) principle of attenuated total reflection (ATR).
Molecules 21 00633 g003
Figure 4. Schematic illustration of the hyperspectral cube principle.
Molecules 21 00633 g004
Figure 5. Principle of material-enhanced infrared spectroscopy (MEIRS).
Molecules 21 00633 g005

