Article

From Nanorods to Nanowires of CdS Synthesized by a Solvothermal Method: Influence of the Morphology on the Photoactivity for Hydrogen Evolution from Water

by
Fernando Vaquero
,
José Luis G. Fierro
and
Rufino M. Navarro Yerga
*
Instituto de Catálisis y Petroleoquímica, CSIC, Marie Curie 2, Madrid 28049, Spain
*
Author to whom correspondence should be addressed.
Molecules 2016, 21(4), 401; https://doi.org/10.3390/molecules21040401
Submission received: 15 February 2016 / Revised: 11 March 2016 / Accepted: 18 March 2016 / Published: 24 March 2016
(This article belongs to the Special Issue Photocatalytic Water Splitting—the Untamed Dream)

Abstract

:
The effect of temperature and water/thiourea ratio on the growth, crystallinity and morphological characteristics of CdS nanostructures synthetized by a solvothermal method using ethylenediamine as solvent were studied. The temperature and water/thiourea ratio used in the synthesis determine the surface area, shape, length and degree of crystallinity of the CdS nanostructures obtained. Nanowires of high crystallinity and length were obtained when the solvothermal synthesis was performed at 190 °C, while nanorods with lower length and crystallinity were obtained as the solvothermal temperature decreased to 120 °C. The change in the water/thiourea ratio affects the crystallinity and length of the CdS nanostructures to a lesser extent than temperature. Nevertheless an increase in the water/thiourea ratio used during the solvothermal synthesis resulted in CdS nanorods with higher crystallinity, lower aspect ratio and lower specific surface area. Textural, structural and surface properties of the prepared CdS nanostructures were determined and related to the activity results in the production of hydrogen from aqueous solutions containing SO32− + S2− under visible light.

Graphical Abstract

1. Introduction

The conversion of solar energy into hydrogen via the water splitting process assisted by photosemiconductors is one of the most interesting ways to achieve a clean and renewable energy system [1,2]. Cadmium sulfide (CdS) nanostructures have been widely applied for solar driven H2 production due to its suitable band gap (2.4 eV) and band gap energy [3,4,5,6,7,8,9,10,11]. The photoactivity of CdS nanostructures depends on their crystalline phase, structure, morphology, defects and size. In the nano regime, the photoactivity of CdS was improved in samples with wurtzite structure, good crystallinity and short bulk-to-surface diffusion distance for photogenerated electrons and holes [4]. Taking into account the effects of these factors on the photoactivity of CdS nanostructures, much effort has been made to control the synthesis of CdS at the nanometric scale [4,9,12]. In particular, zero-dimensional (0D) quantum dots and one-dimensional (1D) CdS nanostructures such as nanorods, nanowires and nanoribbons have received considerable attention in the last years due to their potential to enhance photoactivity with respect to bulk CdS [13,14,15,16]. Quantum dots and 1D CdS nanostructures show a strong quantum confinement effect (SQE) when the nanostructures have a diameter lower than the exciton Bohr radius of CdS (2.5 nm) [17]. These nanostructures have several interesting advantages such as high surface-to-volume ratios, quantum confinement effect, as well as slow electron-hole recombination. Among the preparation methods explored to prepare crystalline CdS nanostructures with controlled morphology, the solvothermal method is a relatively simple methodology which allows to obtain crystalline nanostructures of CdS at moderate temperature and pressure [18,19,20,21]. Highly pure 1D CdS nanostructures with a high degree of crystallinity can be produced by the solvothermal route using ethylenediamine or other amines as solvents [22]. To date, although CdS nanostructures with different structure, size and morphology have been synthesized by the solvothermal route, the influence of CdS morphology and size on photoactivity for hydrogen production have received only limited attention. For example, in the study of Yu et al. [23] the better photoactivity of CdS nanowire structures than that obtained on nanorods or CdS nanoparticles was shown. On the other hand, Lang et al. [24] reported high photocatalytic hydrogen production on multi-armed CdS nanorods attributed to the positive synergistic effects of the hexagonal phase and the morphology of CdS, while Jang et al. [25] reported that CdS nanowires with higher crystallinity showed a higher rate of photocatalytic hydrogen production. In spite of these studies, there is no clear correlation between the characteristics of solvothermal CdS nanostructures and their photoactivity. Taking into account that the size and shape of CdS nanostructures synthesized by solvothermal methods depend on the solvent, the metal and sulfur source, the temperature and the time [18,19,26,27], in the present work we studied the effect of temperature and water/thiourea ratio on the growth, crystallinity and morphological characteristics of the resulting CdS nanostructures. The changes in the solvothermal variables lead to CdS nanorods and nanowires with different size that allowed elucidating the consequences of the structural, morphological and surface characteristics of these nanostructures on photophysical properties as well as in the photoactivity for hydrogen production under visible light form aqueous solutions containing Na2SO3 and Na2S as sacrificial electron donor agents.

2. Results

2.1. Physicochemical Characterization

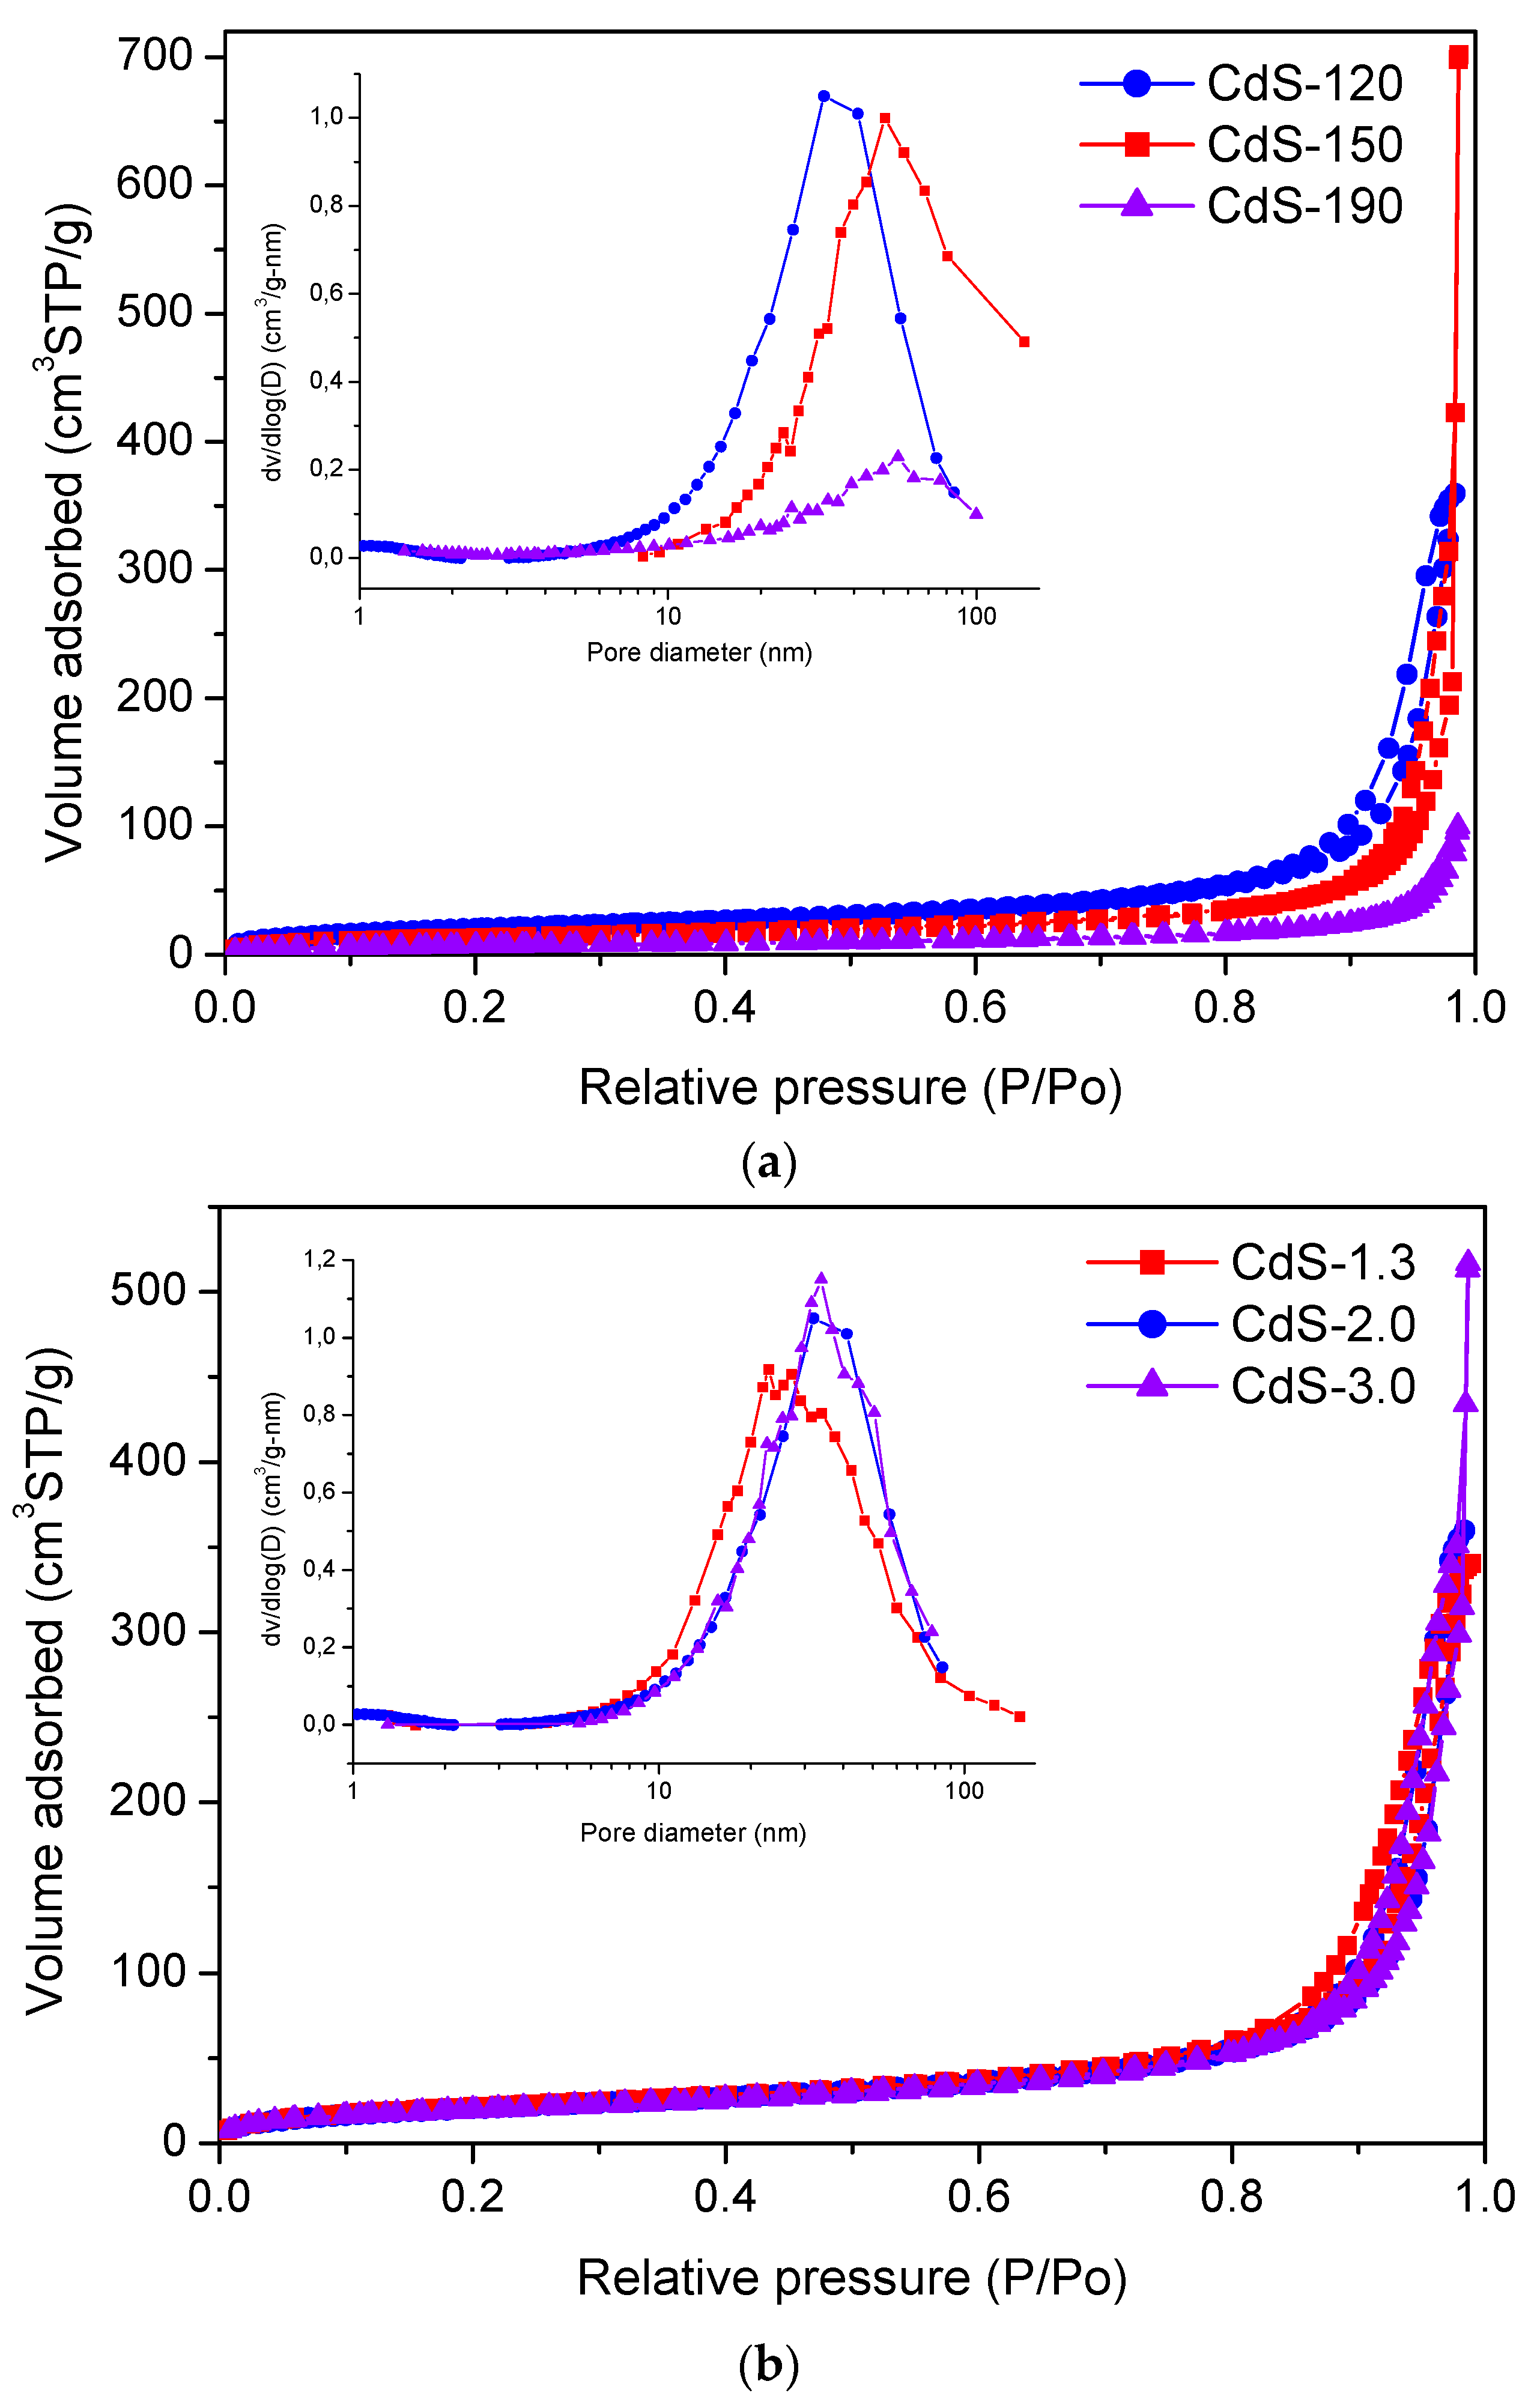
2.1.1. TXRF and Textural Analyses

According to the temperature and water/thiourea ratio used in the solvothermal synthesis samples were labeled as CdS-x (x = 120, 150 and 190 °C and 1.3, 2.0 and 3.0 water/thiourea molar ratio). Surface chemical analysis by TXRF indicates the existence of only Cd and S in all prepared CdS samples (Table 1). All samples, except CdS-150 and CdS-3.0, have similar surface composition and coordination of Cd with S. The Cd/S atomic surface ratio was close to 0.85 in all samples, except in the samples CdS-150 and CdS-3.0 for which the ratio increases to a value close to 0.90.
The nitrogen adsorption-desorption isotherms and the corresponding pore-size distributions of as-prepared CdS samples are presented in Figure 1. All the samples displayed type IV N2-isotherms (IUPAC classification) characteristic of mesoporous materials with low contribution of micropores [28,29]. All isotherms displayed hysteresis loops of type H3, associated with the presence of narrow slit-shaped pores due to the aggregation of CdS nanostructures. The pore-size distribution curves (inset in Figure 1) of CdS samples are very broad, further confirming the presence of mesopores [30].
Textural data of CdS samples (Table 1) show that their specific surface area varies with the solvothermal temperature and water/thiourea ratio used in the synthesis. It is observed that the specific surface area of the CdS samples drops as the solvothermal temperature and water/thiourea ratio increase. This decrease is assigned to the collapse of the mesopore structure of the samples associated with changes in the size and morphology of the CdS particles induced by the temperature and water/thiourea ratio used in the solvothermal synthesis.

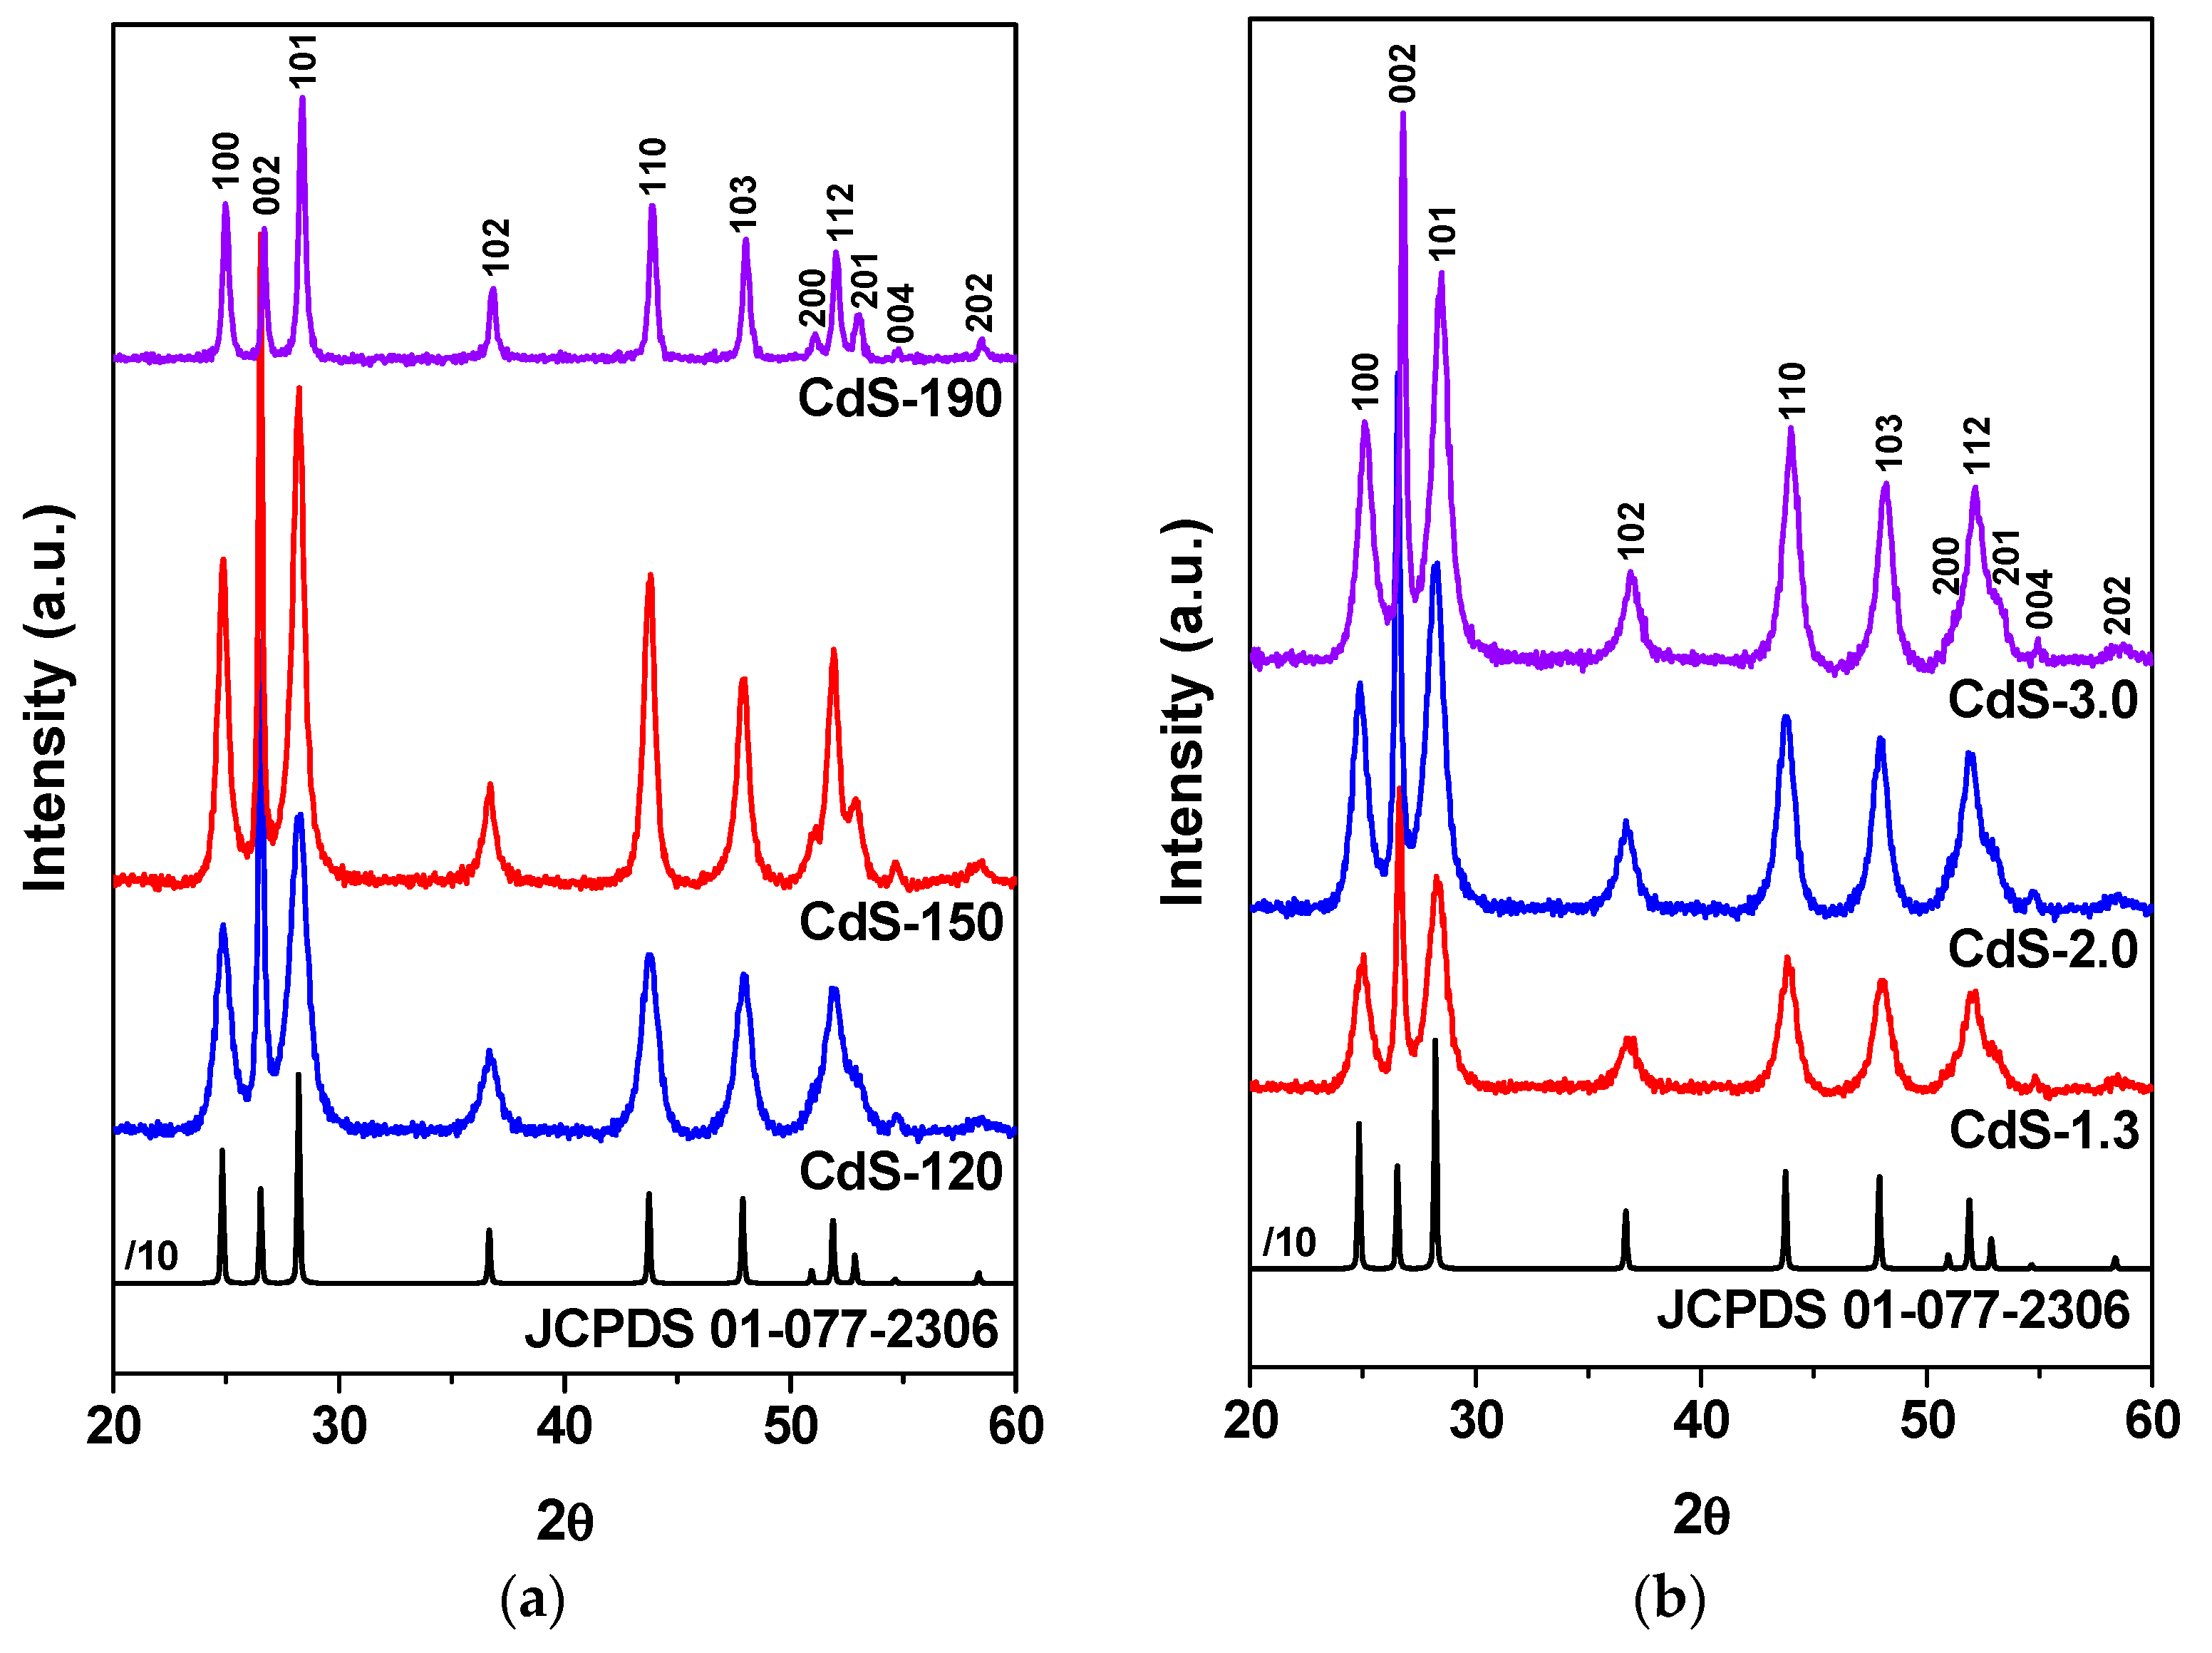
2.1.2. Powder X-ray Diffraction (XRD) Analysis

Figure 2 displays the XRD diffraction patterns of CdS samples. All patterns displayed only reflections corresponding to the formation of CdS with hexagonal crystal structure (JCPDS 01-077-2306) with P63mc space group and lattice constants of a(Å) = 4.136 and c(Å) = 6.713. No peaks corresponding to impurities were detected. The relative intensity of diffraction peaks changes with the solvothermal temperature evidencing differences in the morphology of CdS nanocrystals. In the case of CdS samples prepared at lower temperature (120 and 150 °C), the relative intensity of the peak corresponding to (002) planes was more intense than expected for the standard hexagonal pattern. This suggests that there is a relatively high crystalline order along the [001] direction (along the c-axis) indicative of the formation of 1D nanostructures. However, in the sample prepared at 190 °C, the intensities of (100) and (101) peaks increased, while that of (002) peak decreased. This represents the lower preferential orientation growth in the [001] direction of nanostructures as the solvothermal temperature increases above 150 °C. Upon increasing the solvothermal temperature, the crystallinity of the samples continuously improved as it can be seen by looking at the stronger and narrower diffraction peaks. Quantitative estimation of CdS phase crystallite sizes by applying the Scherrer equation (Table 2) has been calculated from the broadening of the (002) reflection of CdS phase (at 2θ angle of 26.5°). These values indicate that the crystallite size of CdS continuously increases when the solvothermal temperature rises up to 190 °C.
Figure 2 also includes the XRD patterns of CdS samples prepared with different water/thiourea ratio. It was observed that the increase of water concentration during the solvothermal synthesis results in a higher degree of crystallinity of the CdS nanostructures. This result indicates that the excess of water facilitates the crystallization growth of CdS. In these samples, the relative intensity of the peak corresponding to (002) planes was also more intense than expected for the standard hexagonal pattern and indicative of a preferential growth along the c-axis with formation of 1D nanostructures. The intensity ratio of (100)/(002) and (101)/(002) peaks does not change (Table 2) with the water/thiourea ratio which means no changes in the orientation of crystalline growth of CdS. The crystallite size of these CdS nanostructures (Table 2), slightly increases with the increase in the water/thiourea ratio used in the synthesis.

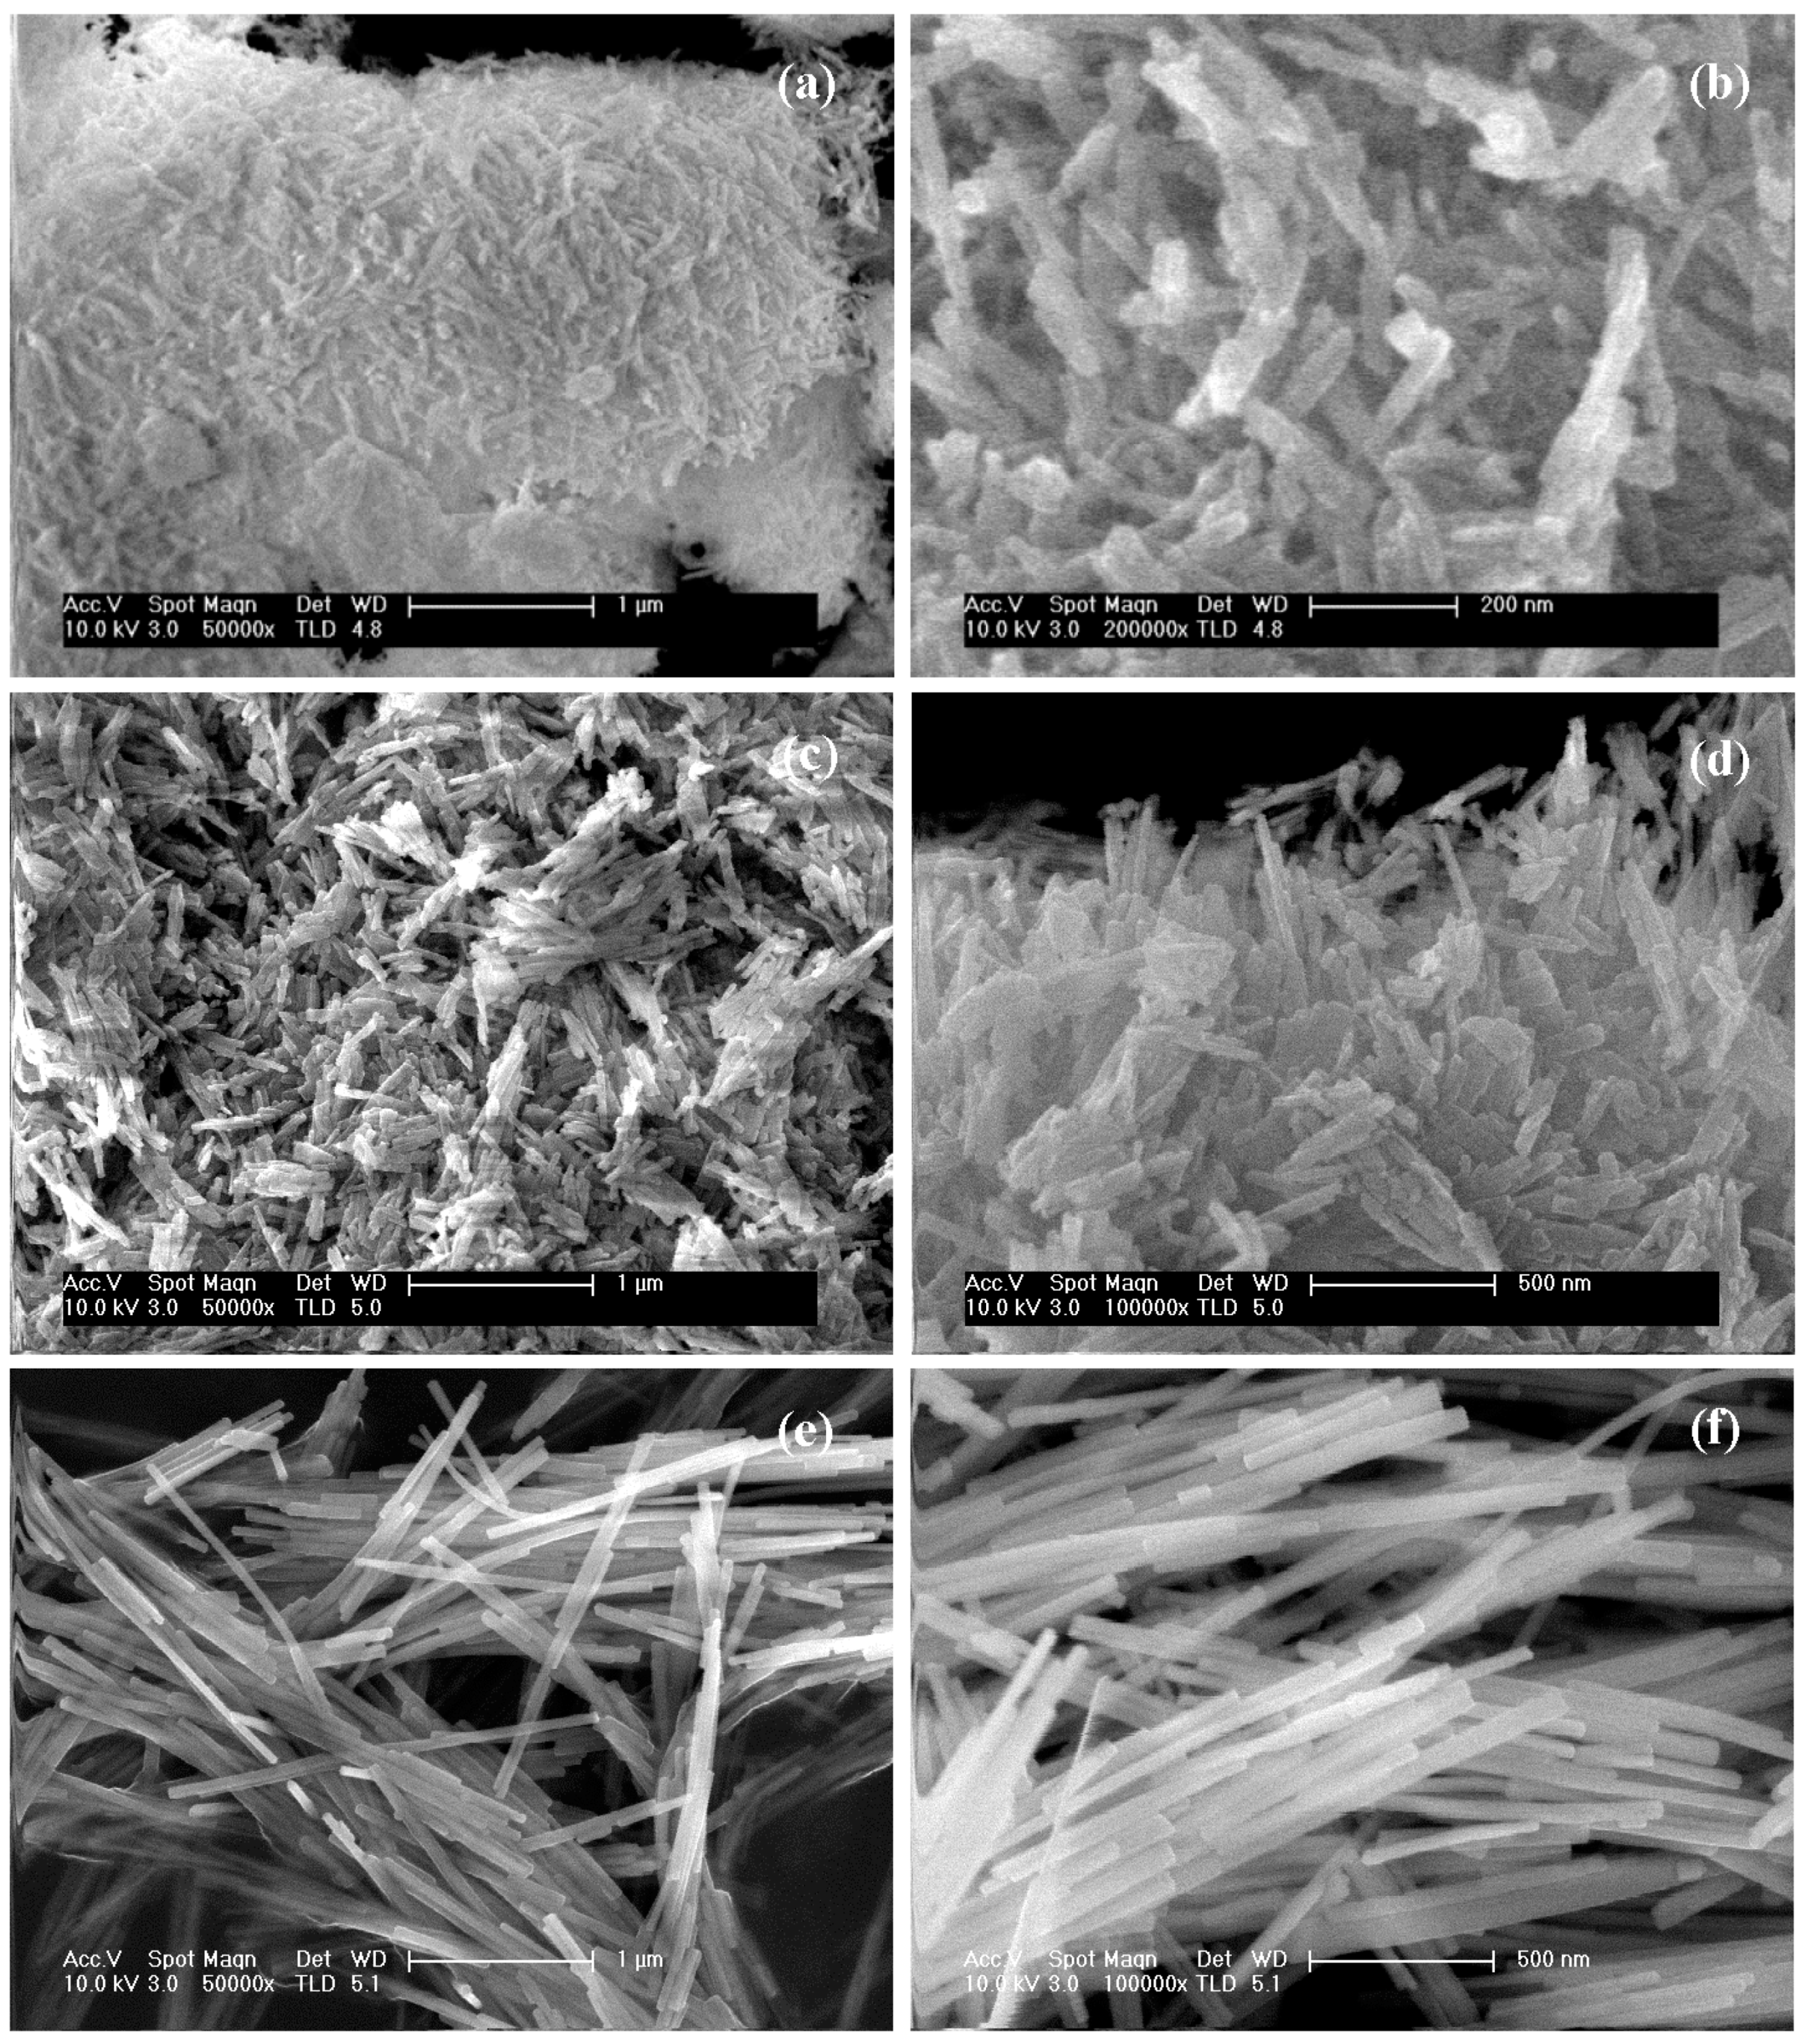
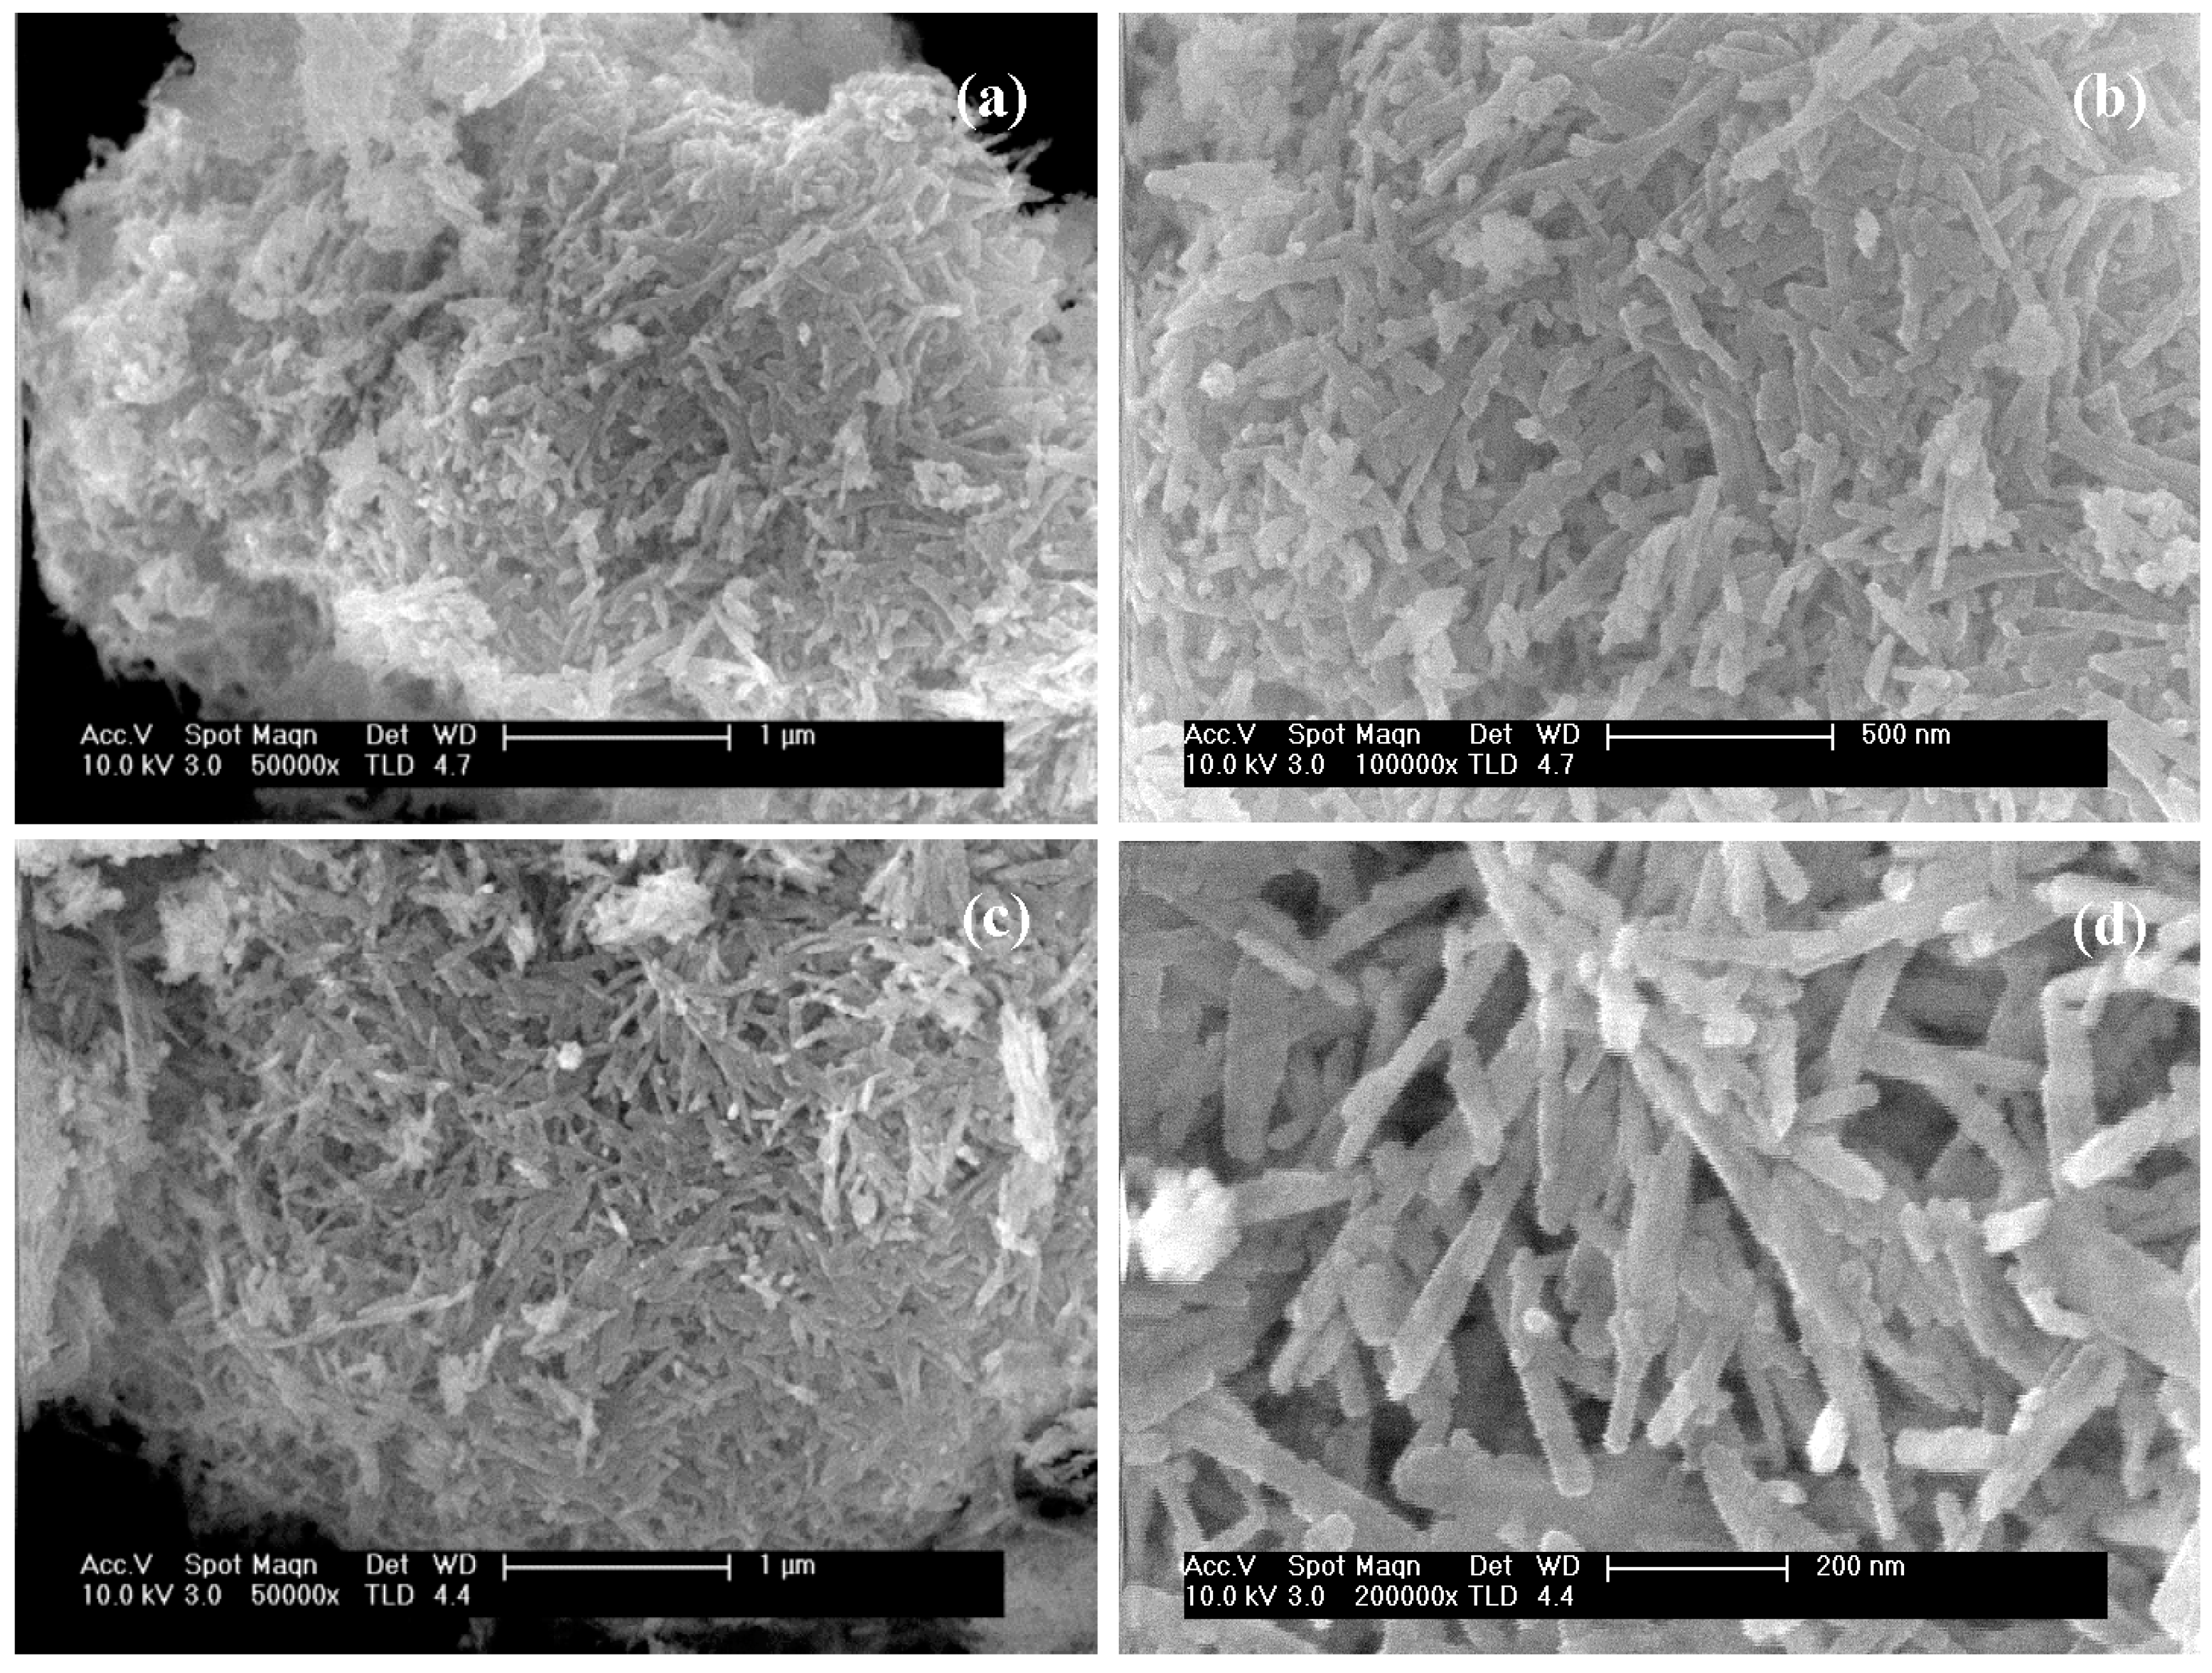
2.1.3. FE-SEM Analysis

The FE-SEM images of the CdS samples synthesized at different solvothermal temperature, presented in Figure 3, showed changes in the morphology and size of the agglomerates of CdS particles (Table 3).
The sample prepared at 120 °C (Figure 3a,b) presents a mixture of CdS sheets with emerging irregular heterogeneously sized filaments on their surface. The sample prepared at 150 °C (Figure 3c,d) is made up of irregular clusters of heterogeneously sized filaments, from 0.7 to 12 µm, while the sample prepared at 190 °C (Figure 3e,f) shows better defined fibres of a few microns in length.
Figure 4 presents FE-SEM images of the CdS samples prepared with different water/thiourea ratio. The samples show incipient formation of nanorods on the surface of irregular nanosheet structures with a diameter of ca. 1.5–3 micrometers. As the concentration of water in the solvothermal synthesis increases, the samples present filamentous structures with more defined shape and crystallinity.

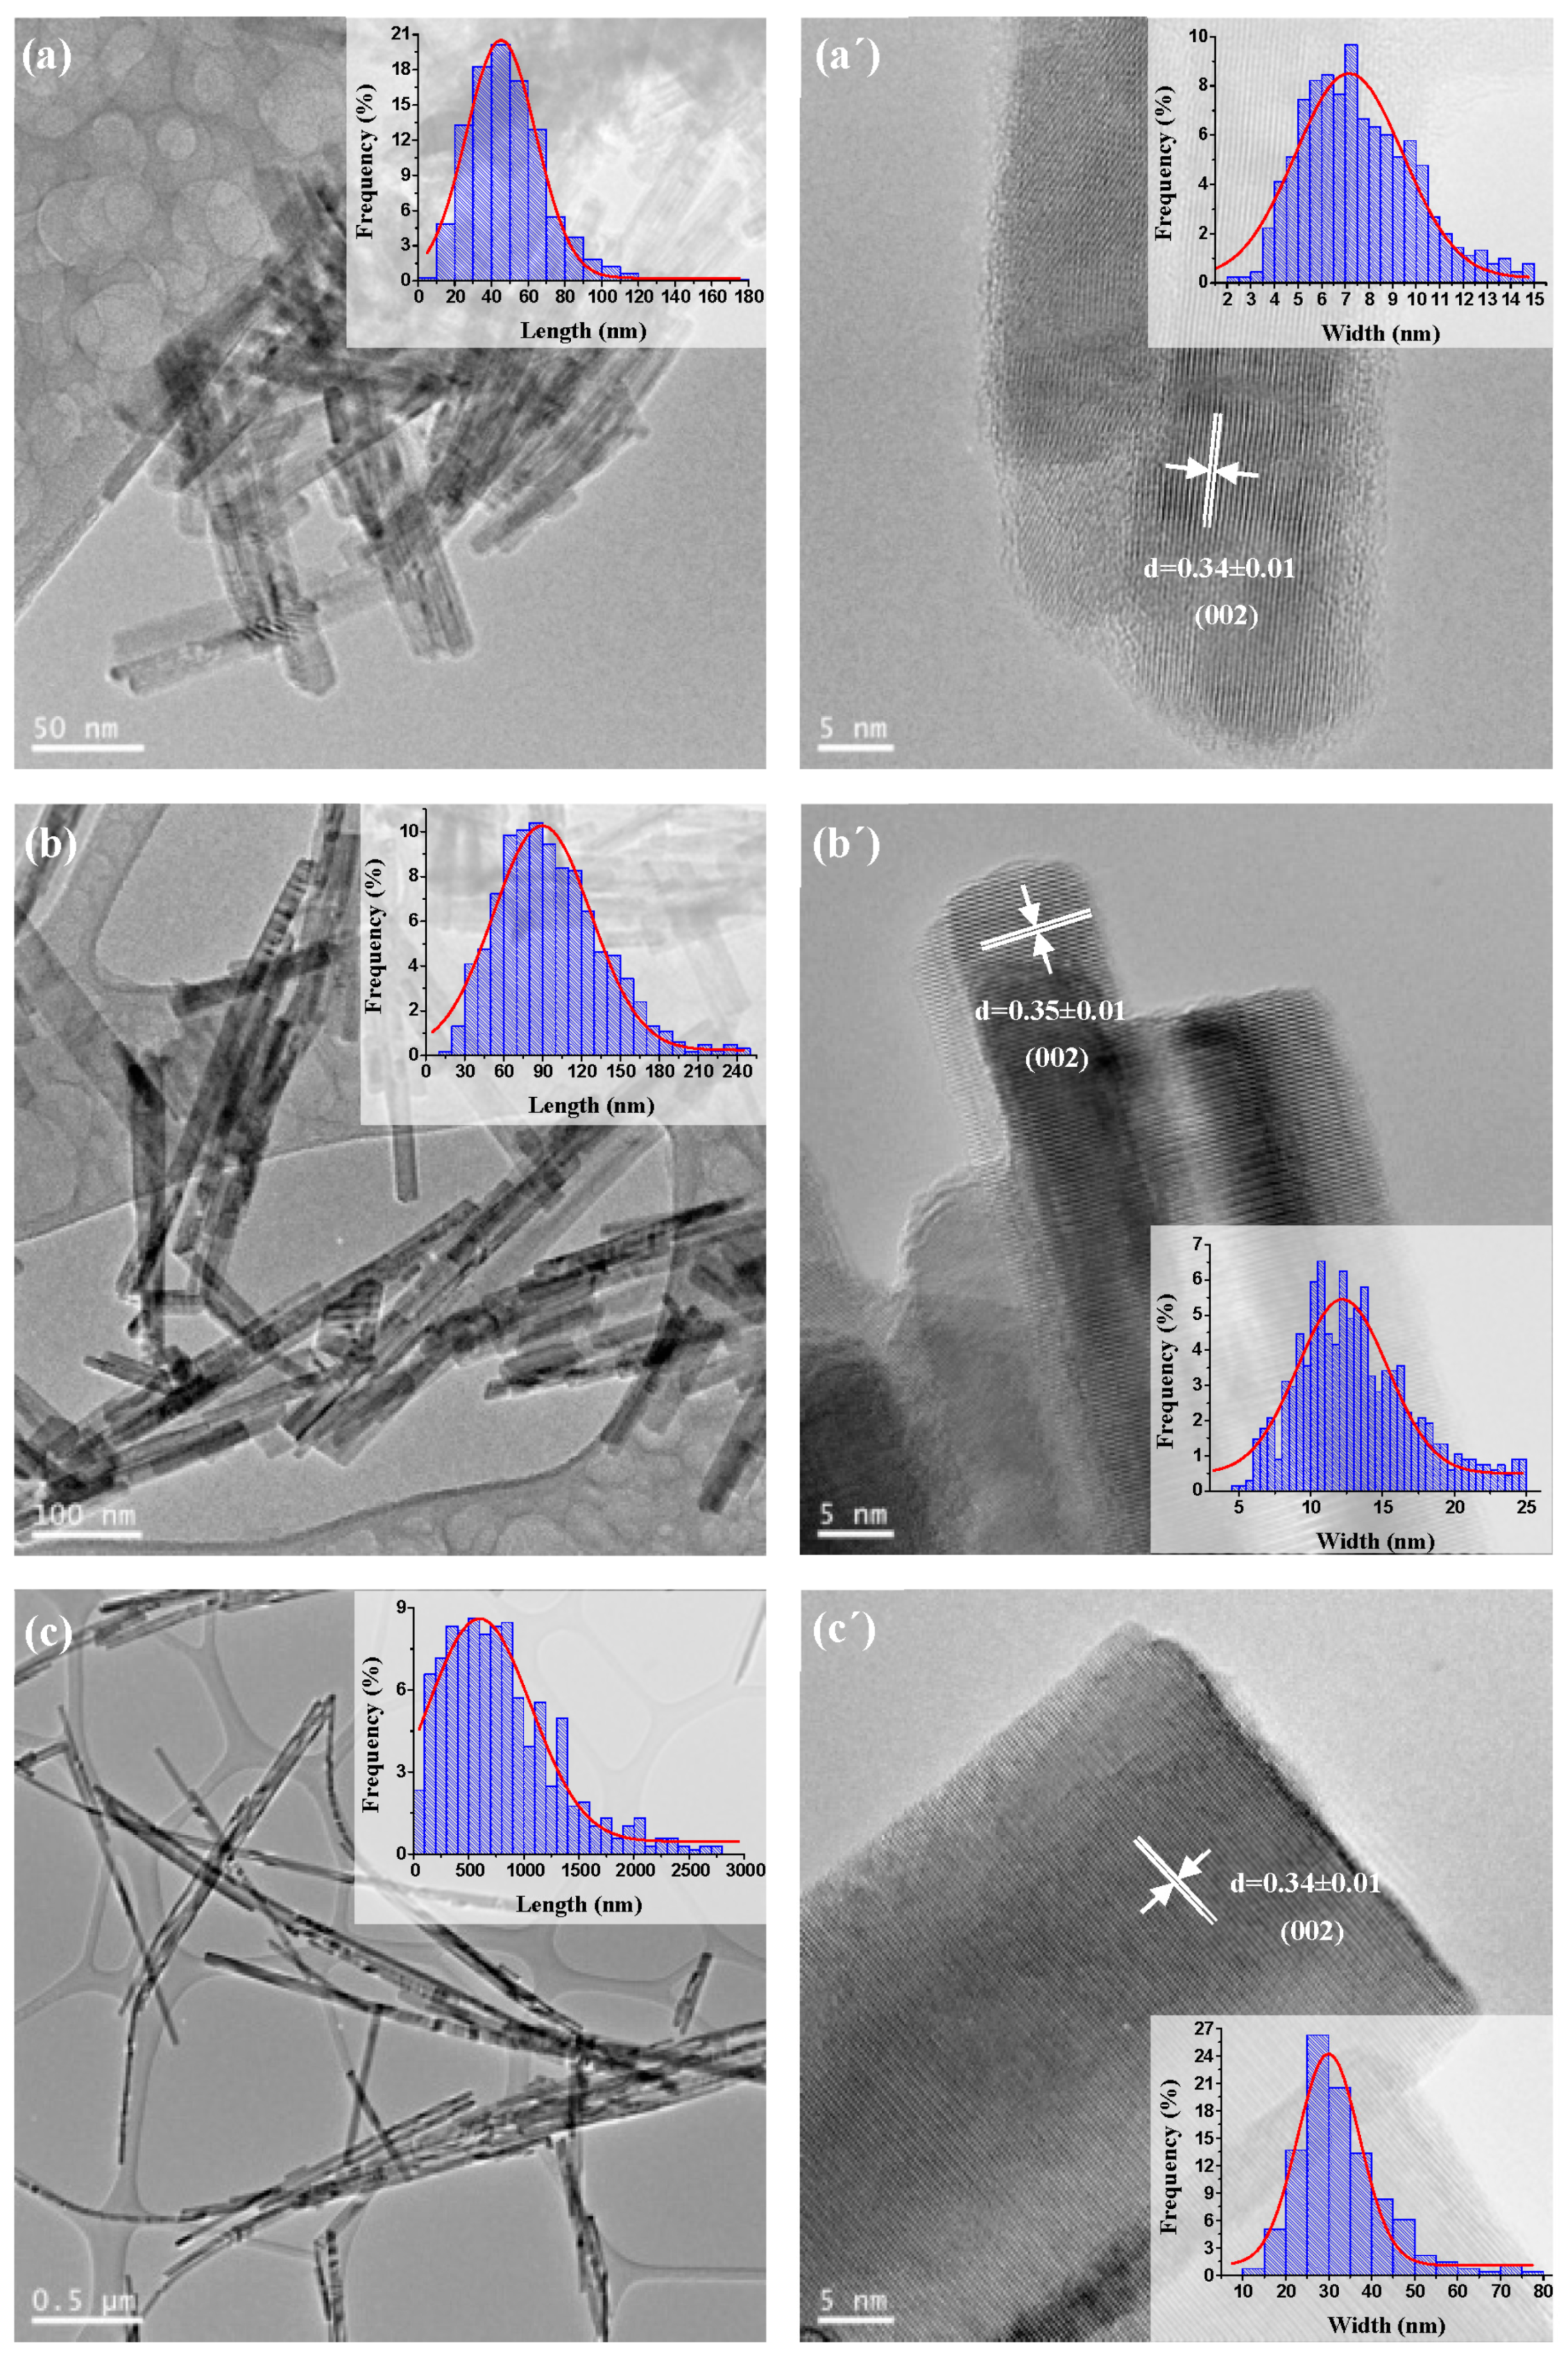
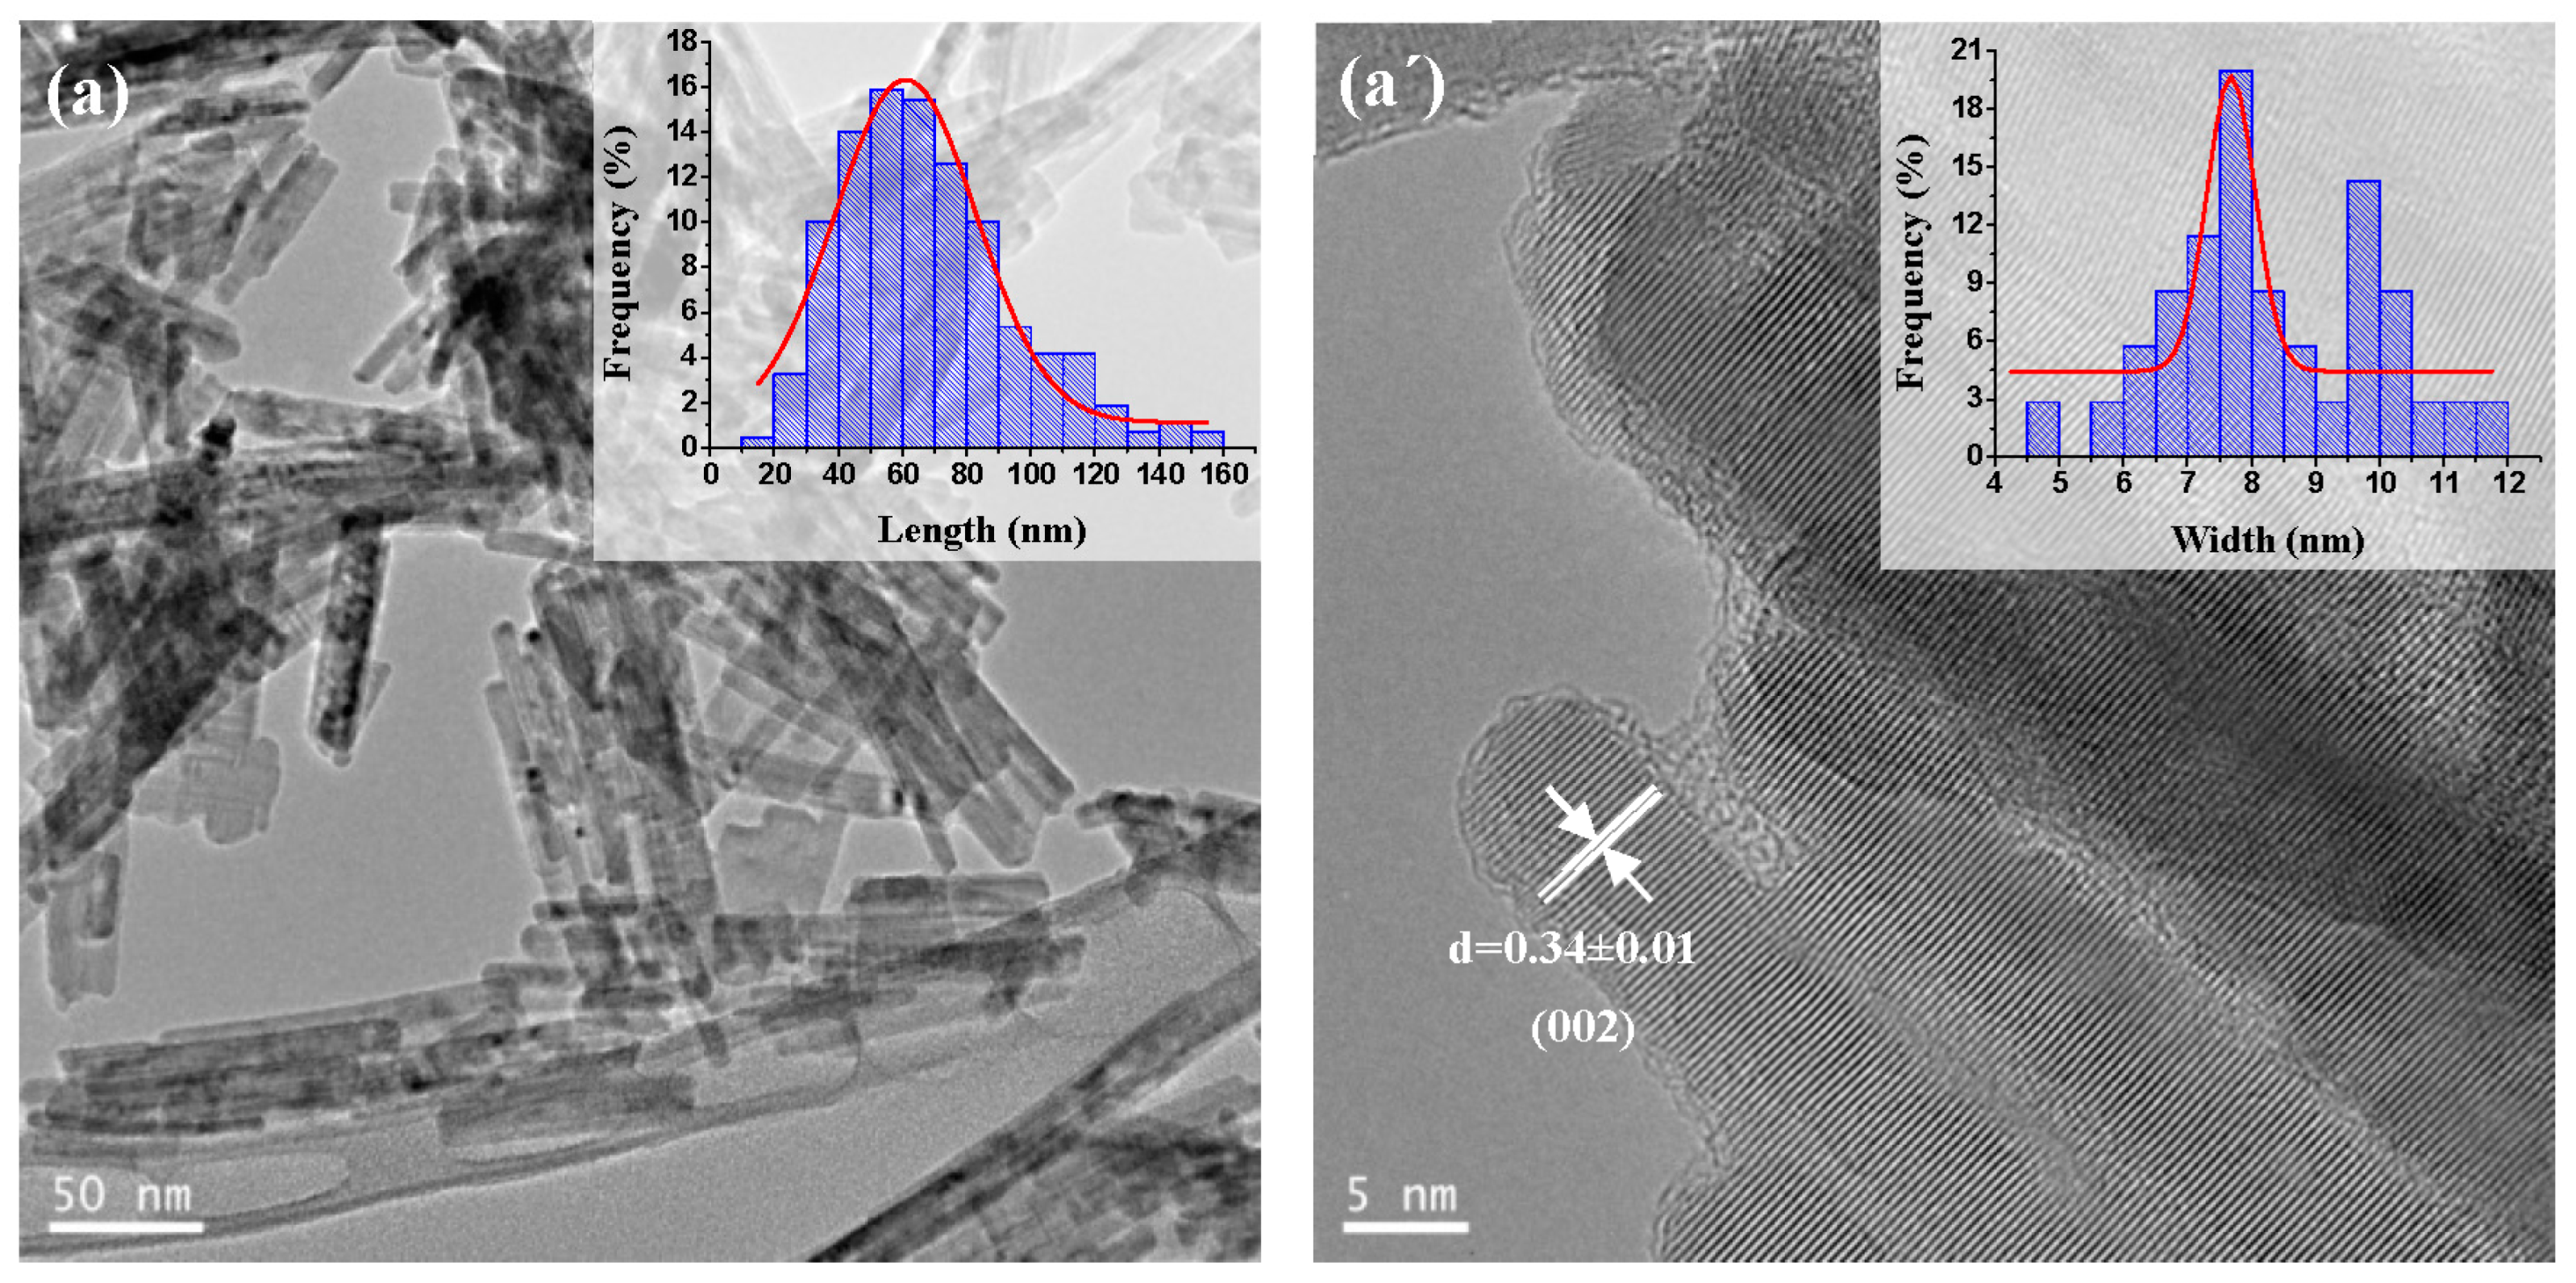
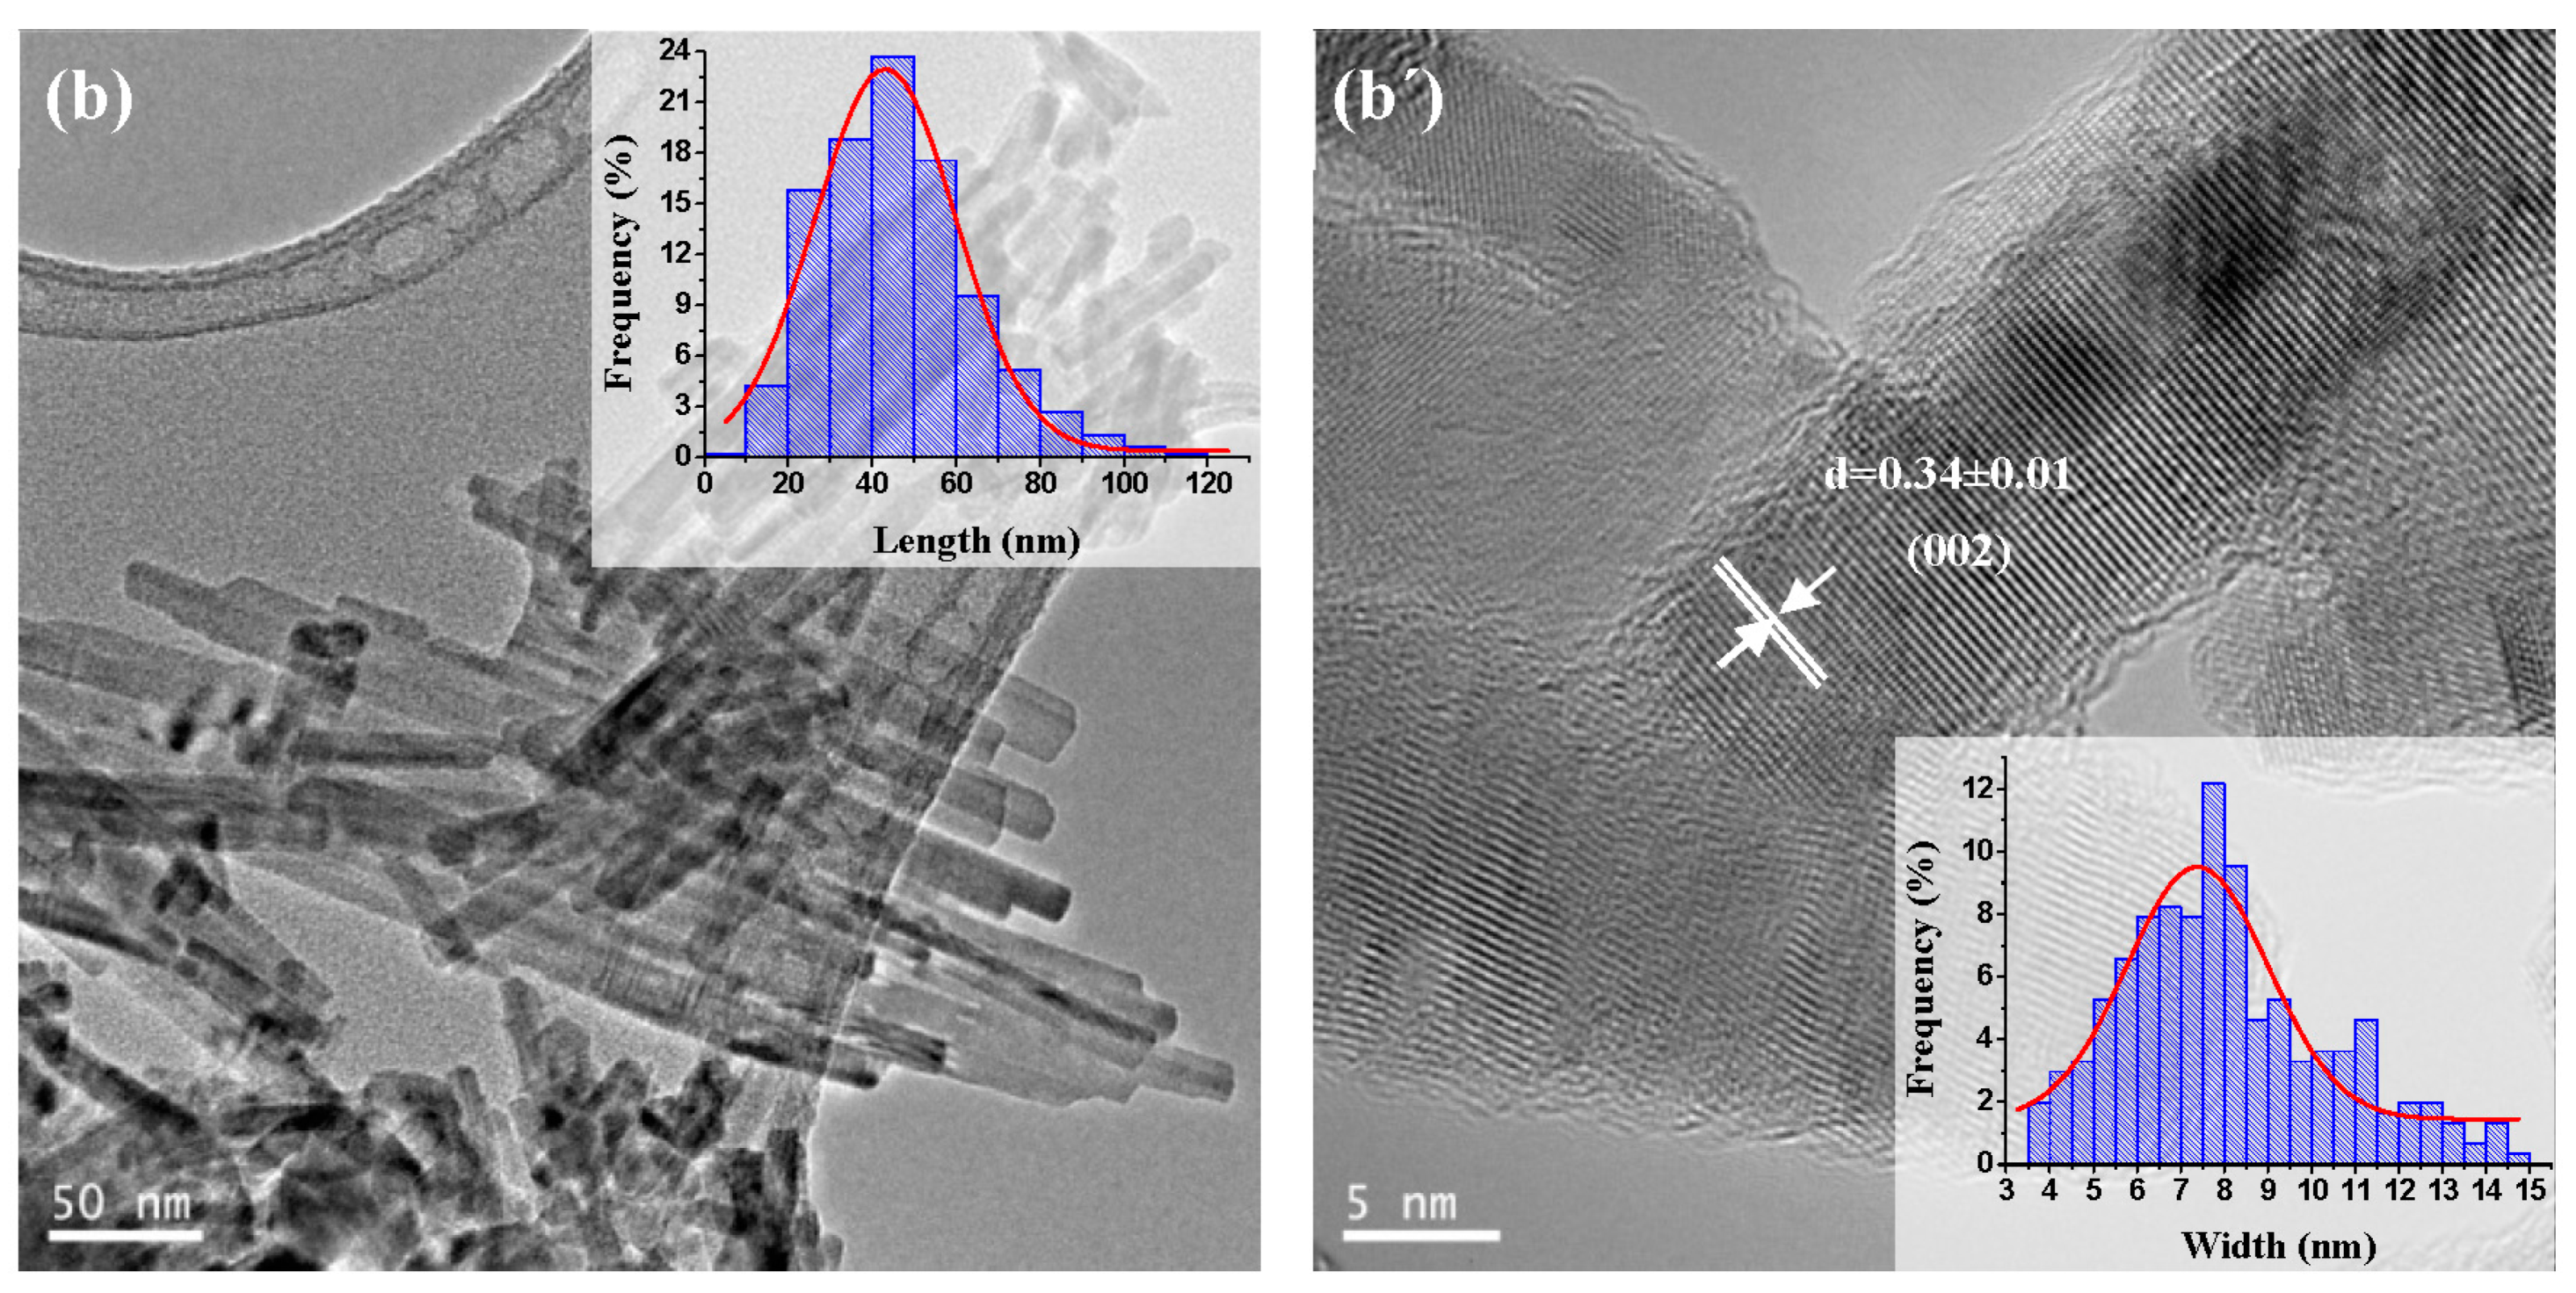
2.1.4. TEM and HRTEM Analysis

The TEM images of CdS samples synthesized with different solvothermal temperature are shown in Figure 5 and the morphological characteristics of CdS nanostructures obtained from TEM are listed in Table 4. The TEM images confirm that the temperature used in solvothermal synthesis has a significant effect on the crystallinity, morphology, length and width of the nanostructures of CdS obtained. It can be observed that use of a higher temperature in the solvothermal synthesis affords 1D nanostructures with more homogeneous interplanar distance, longer length and more defined shape.
Sample CdS-120 (Figure 5a,a’) exhibits 1D nanostructures with an average size around 7 nm in width and 50 nm in length that leads to an average aspect ratio (length/width) close to 7, characteristic of nanorod structures. For the CdS-150 sample (Figure 5b,b’), the average length of the 1D nanostructures increased up to 90 nm and the width also increased up to 12 nm with an average aspect ratio of 7.5, close to that obtained for the sample CdS-120 and therefore characteristic of nanorod structures. Sample CdS-190 (Figure 5c,c’) showed more elongated 1D nanostructures with an average size around 700 nm in length and 30 nm in width, having an average aspect ratio of 23, higher than the value obtained in the samples CdS-120 and CdS-150 and corresponding to the formation of nanowire structures.
Figure 6 shows the TEM images of CdS samples prepared with different water/thiourea ratios. As shown in the TEM images, the water/thiourea ratio used in solvothermal synthesis has a moderate effect on the morphology and size of the resulting CdS nanostructures. It is observed that a higher water/thiourea ratio implies the formation of 1D nanostructures with more homogeneous interplanar distance and diameter and smaller length (Table 4). The sample prepared with lower water/thiourea ratio, CdS-1.3 (Figure 6a,a’), exhibits nanostructures with 60 nm average length and 7.5 nm in width that leads to an average aspect ratio equal to 8.0, characteristic of nanorod structures. The sample obtained with a higher water/thiourea ratio, sample CdS-3.0 (Figure 6b,b’) shows shorter nanostructures with 45 nm average length and 7.2 nm in width, having an average aspect ratio of 6.2 indicative of the presence of nanorods.

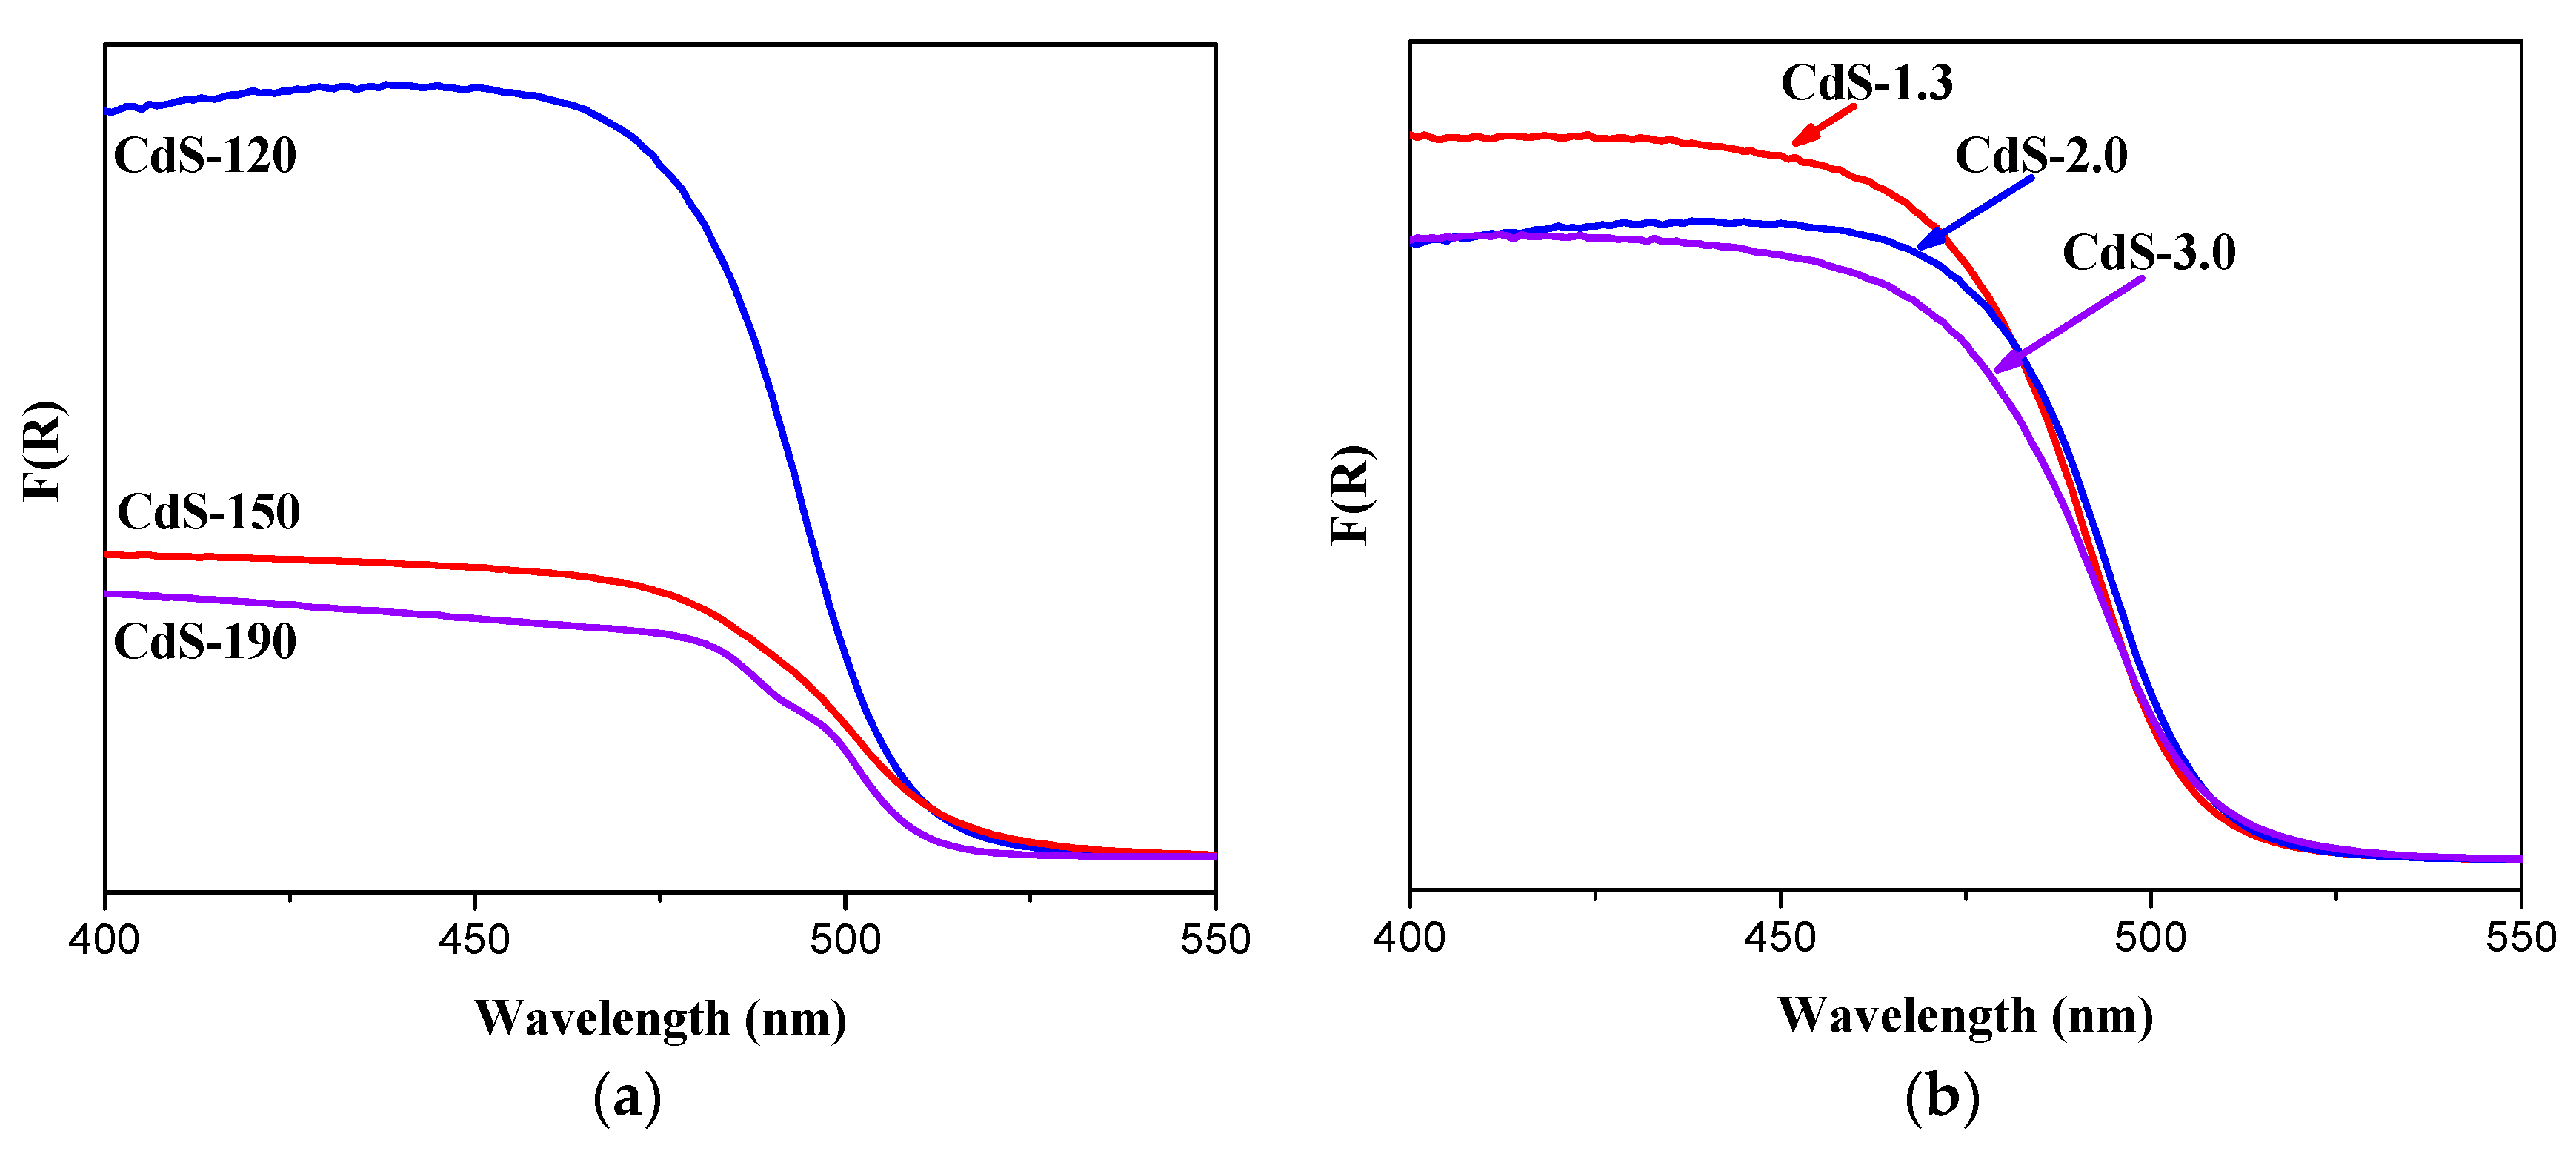
2.1.5. UV-Vis Diffuse Reflectance Spectra Analysis

Diffuse reflectance spectra of all CdS samples are displayed in Figure 7. All samples show similar shapes in the absorption edges with a steep absorption edge that implies the only single CdS phase in all photocatalysts. The band gap energies (eV) of all CdS photocatalysts estimated from Tauc plots are in a close range of 2.45–2.50 eV as listed in Table 1.
All samples show a band gap slightly higher than that reported for bulk CdS (2.40 eV) indicative of a weak confinement effect associated to nanostructures of particle size slightly higher than the Bohr radius. The absorption spectra of the CdS samples prepared with different water/thiourea ratio (Figure 7) show similar absorption edge around 510 nm. Conversely, the absorbance intensity at a wavelength of less than 500 nm showed differences between the CdS samples synthesized at different solvothermal temperatures. The differences in the particle size of the CdS samples may contribute to the observed changes in the absorbance intensity because small particles favor deep penetration of the radiation into the particles. The absorption edges of CdS photocatalysts shift slightly from 511 nm to 505 nm as the temperature used in the solvothermal synthesis increases, indicating the existence of a small quantized transition [18] because it is known that bulk CdS displays an absorption edge at about 515 nm [31,32]. This slight blue shift can be attributed to the elimination of trap energy levels such as structural defects and shallow impurity energy levels associated to the increase in crystallinity observed for the samples prepared at higher solvothermal temperature [33].

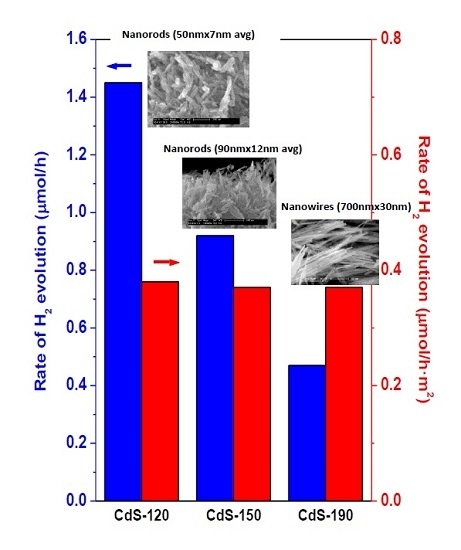
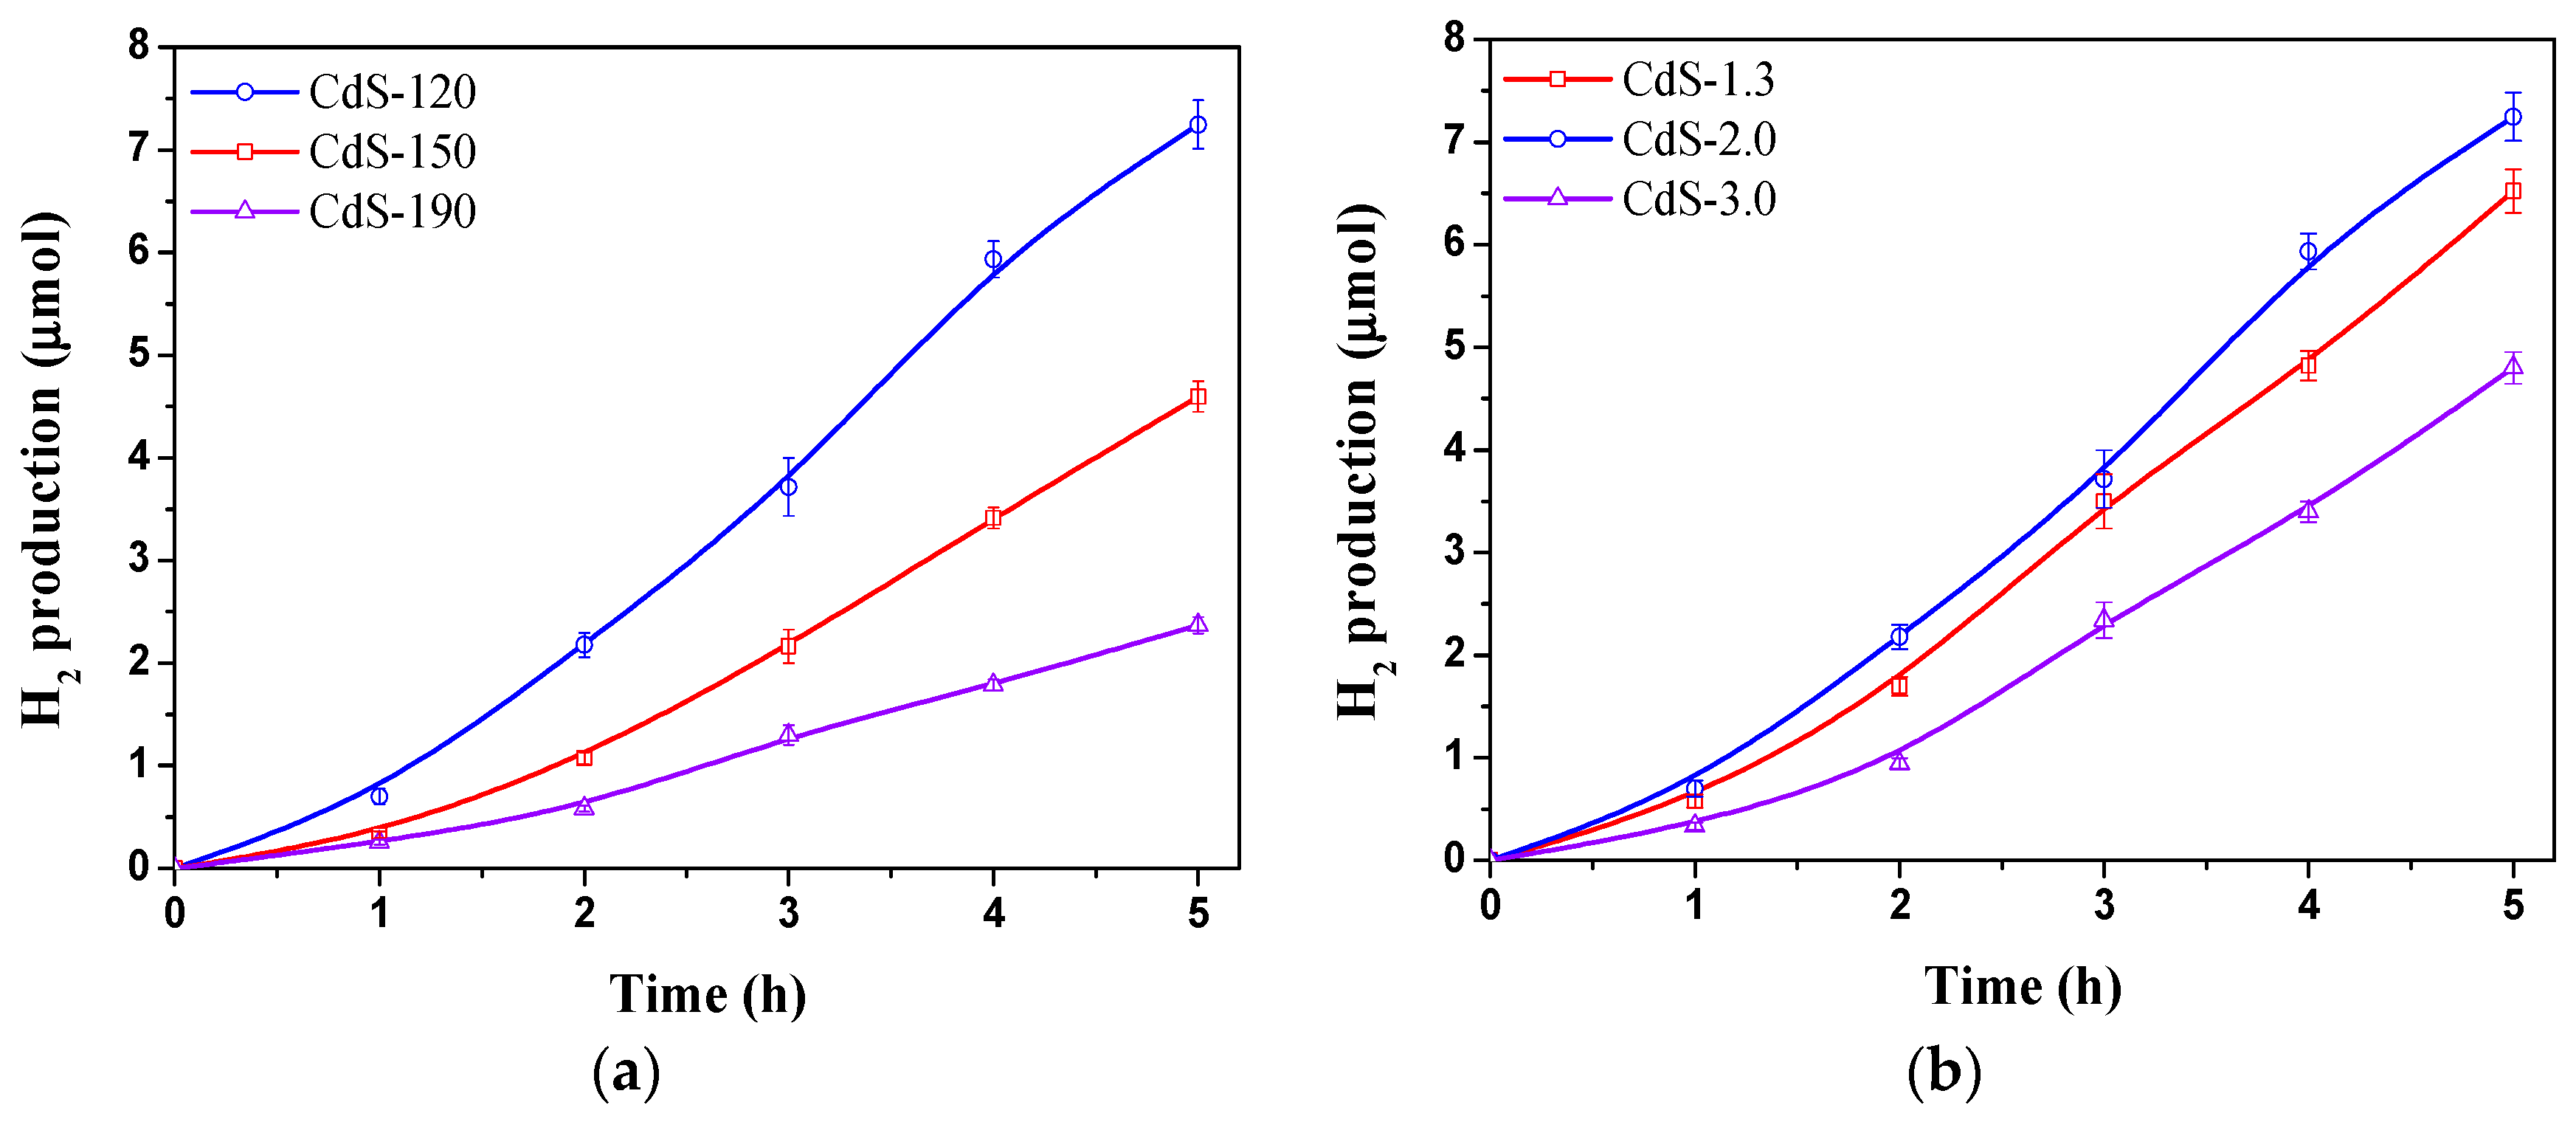
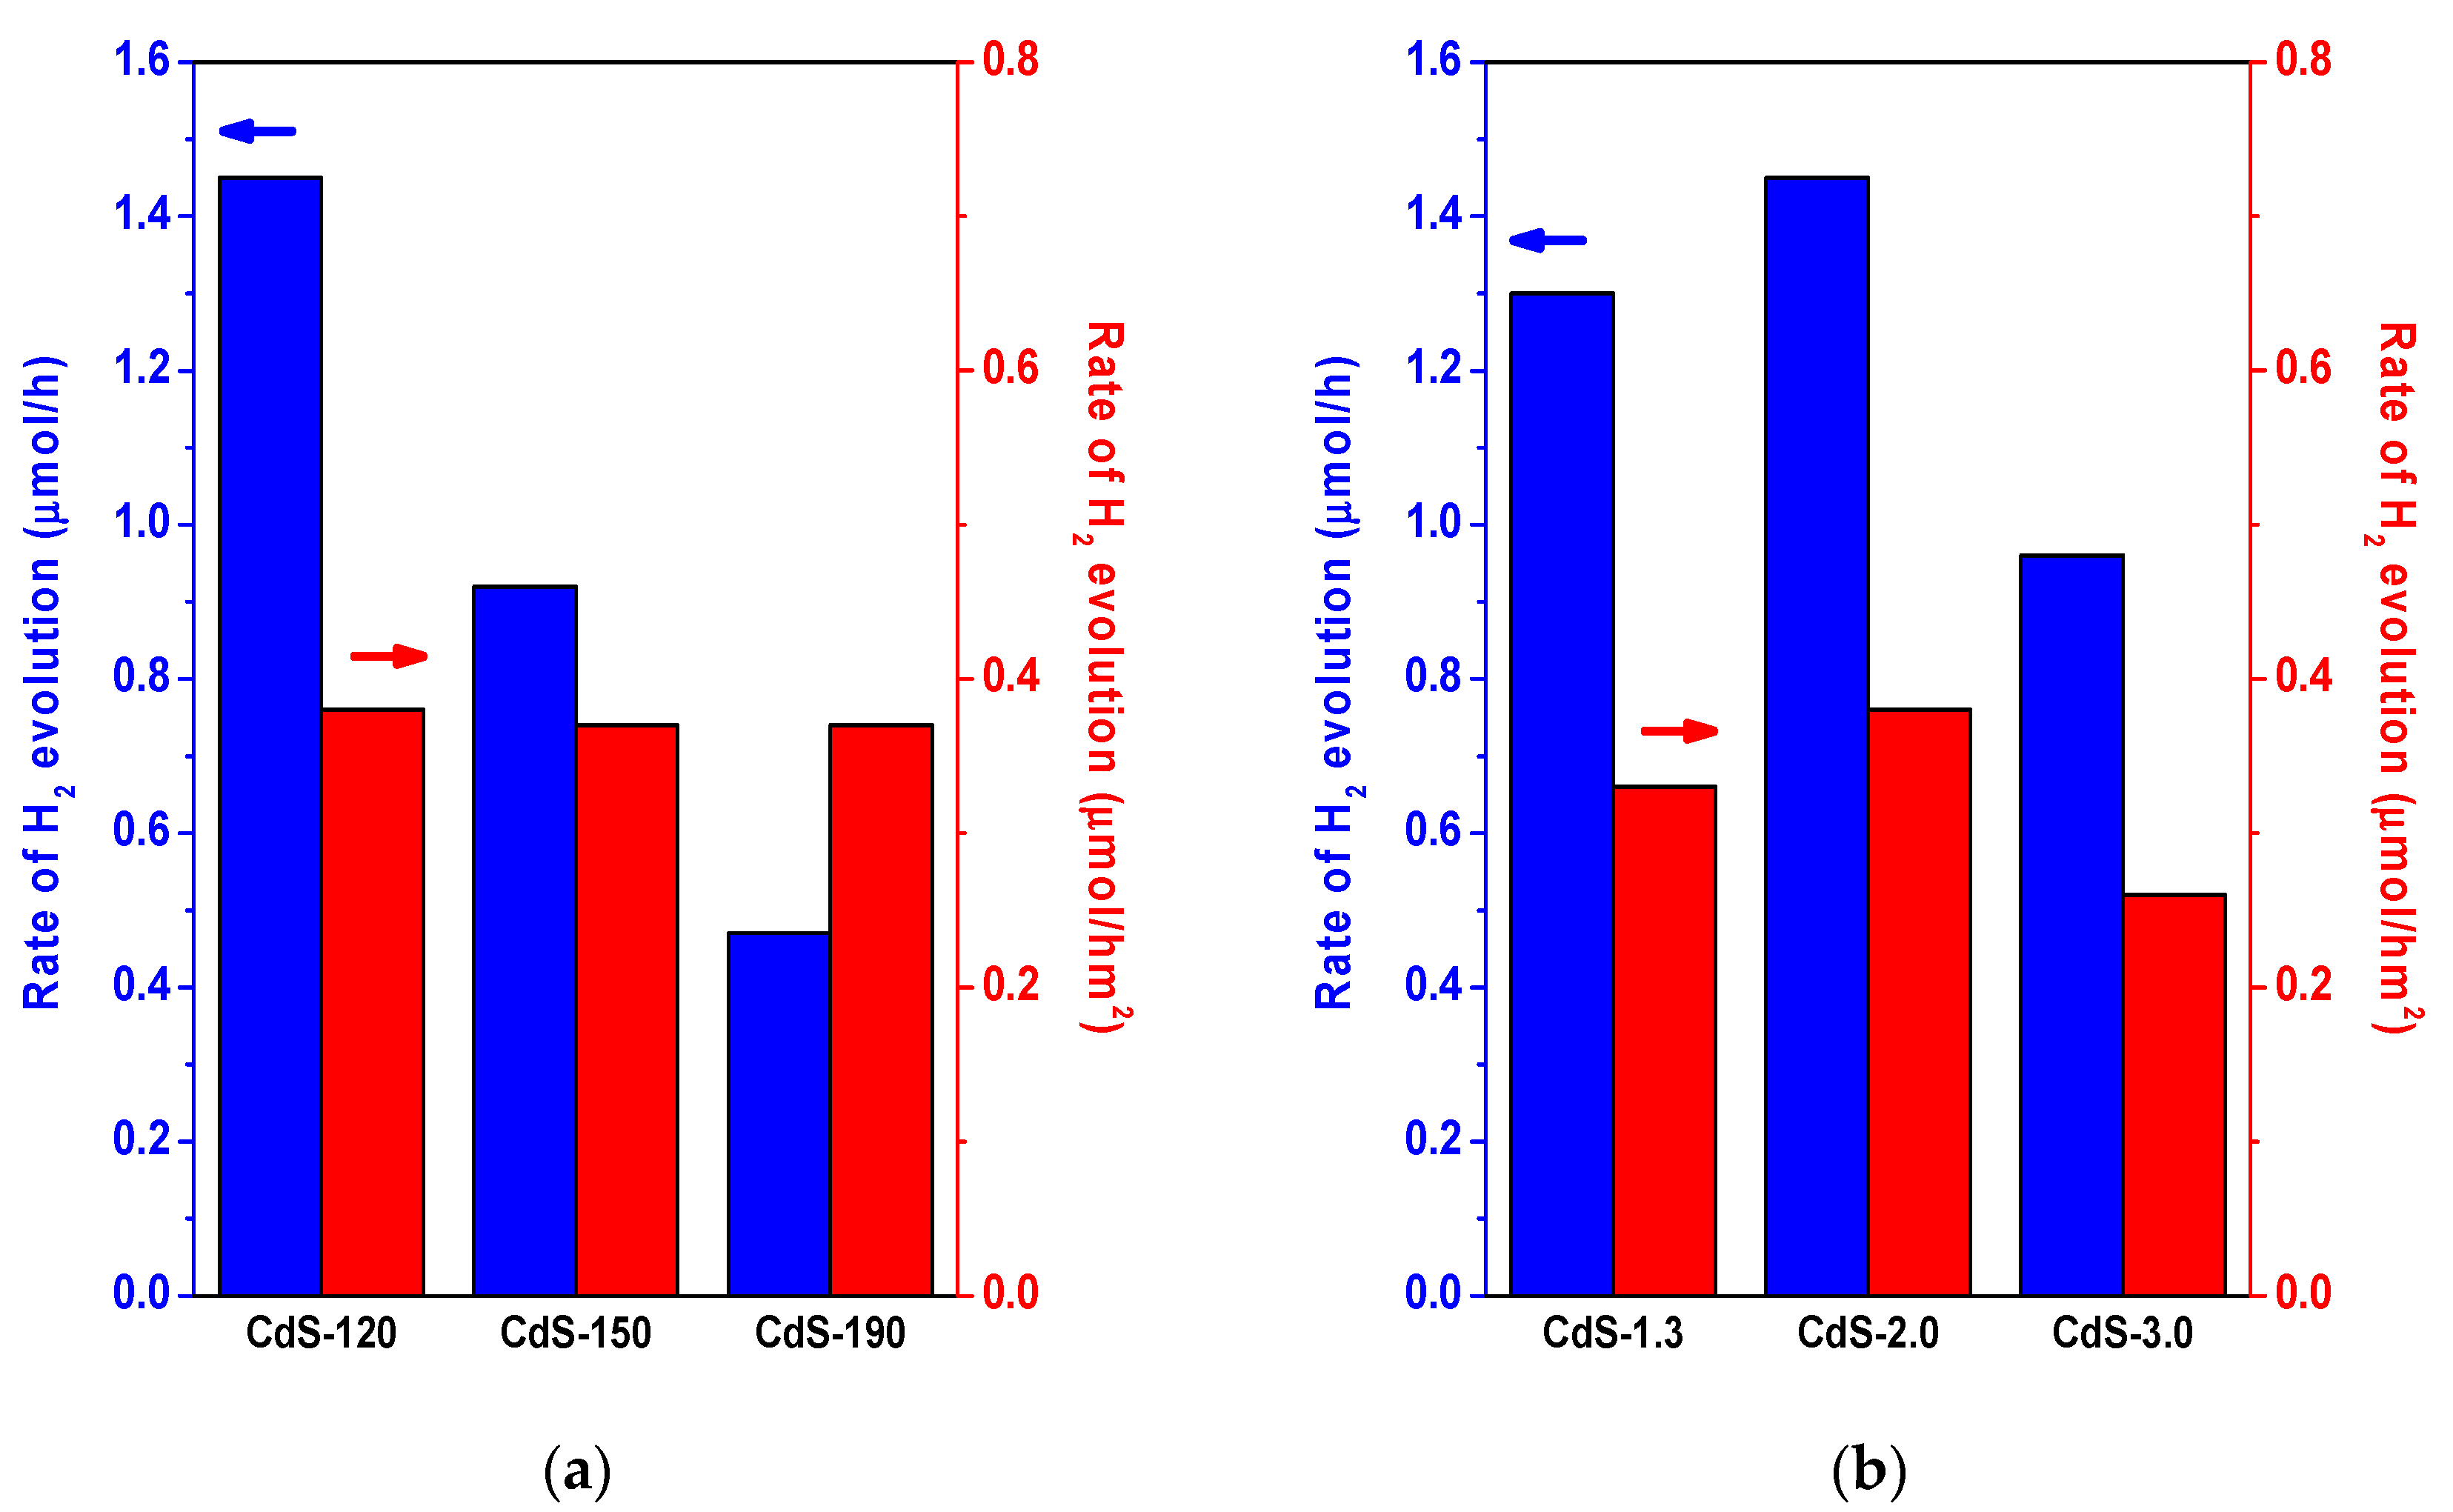
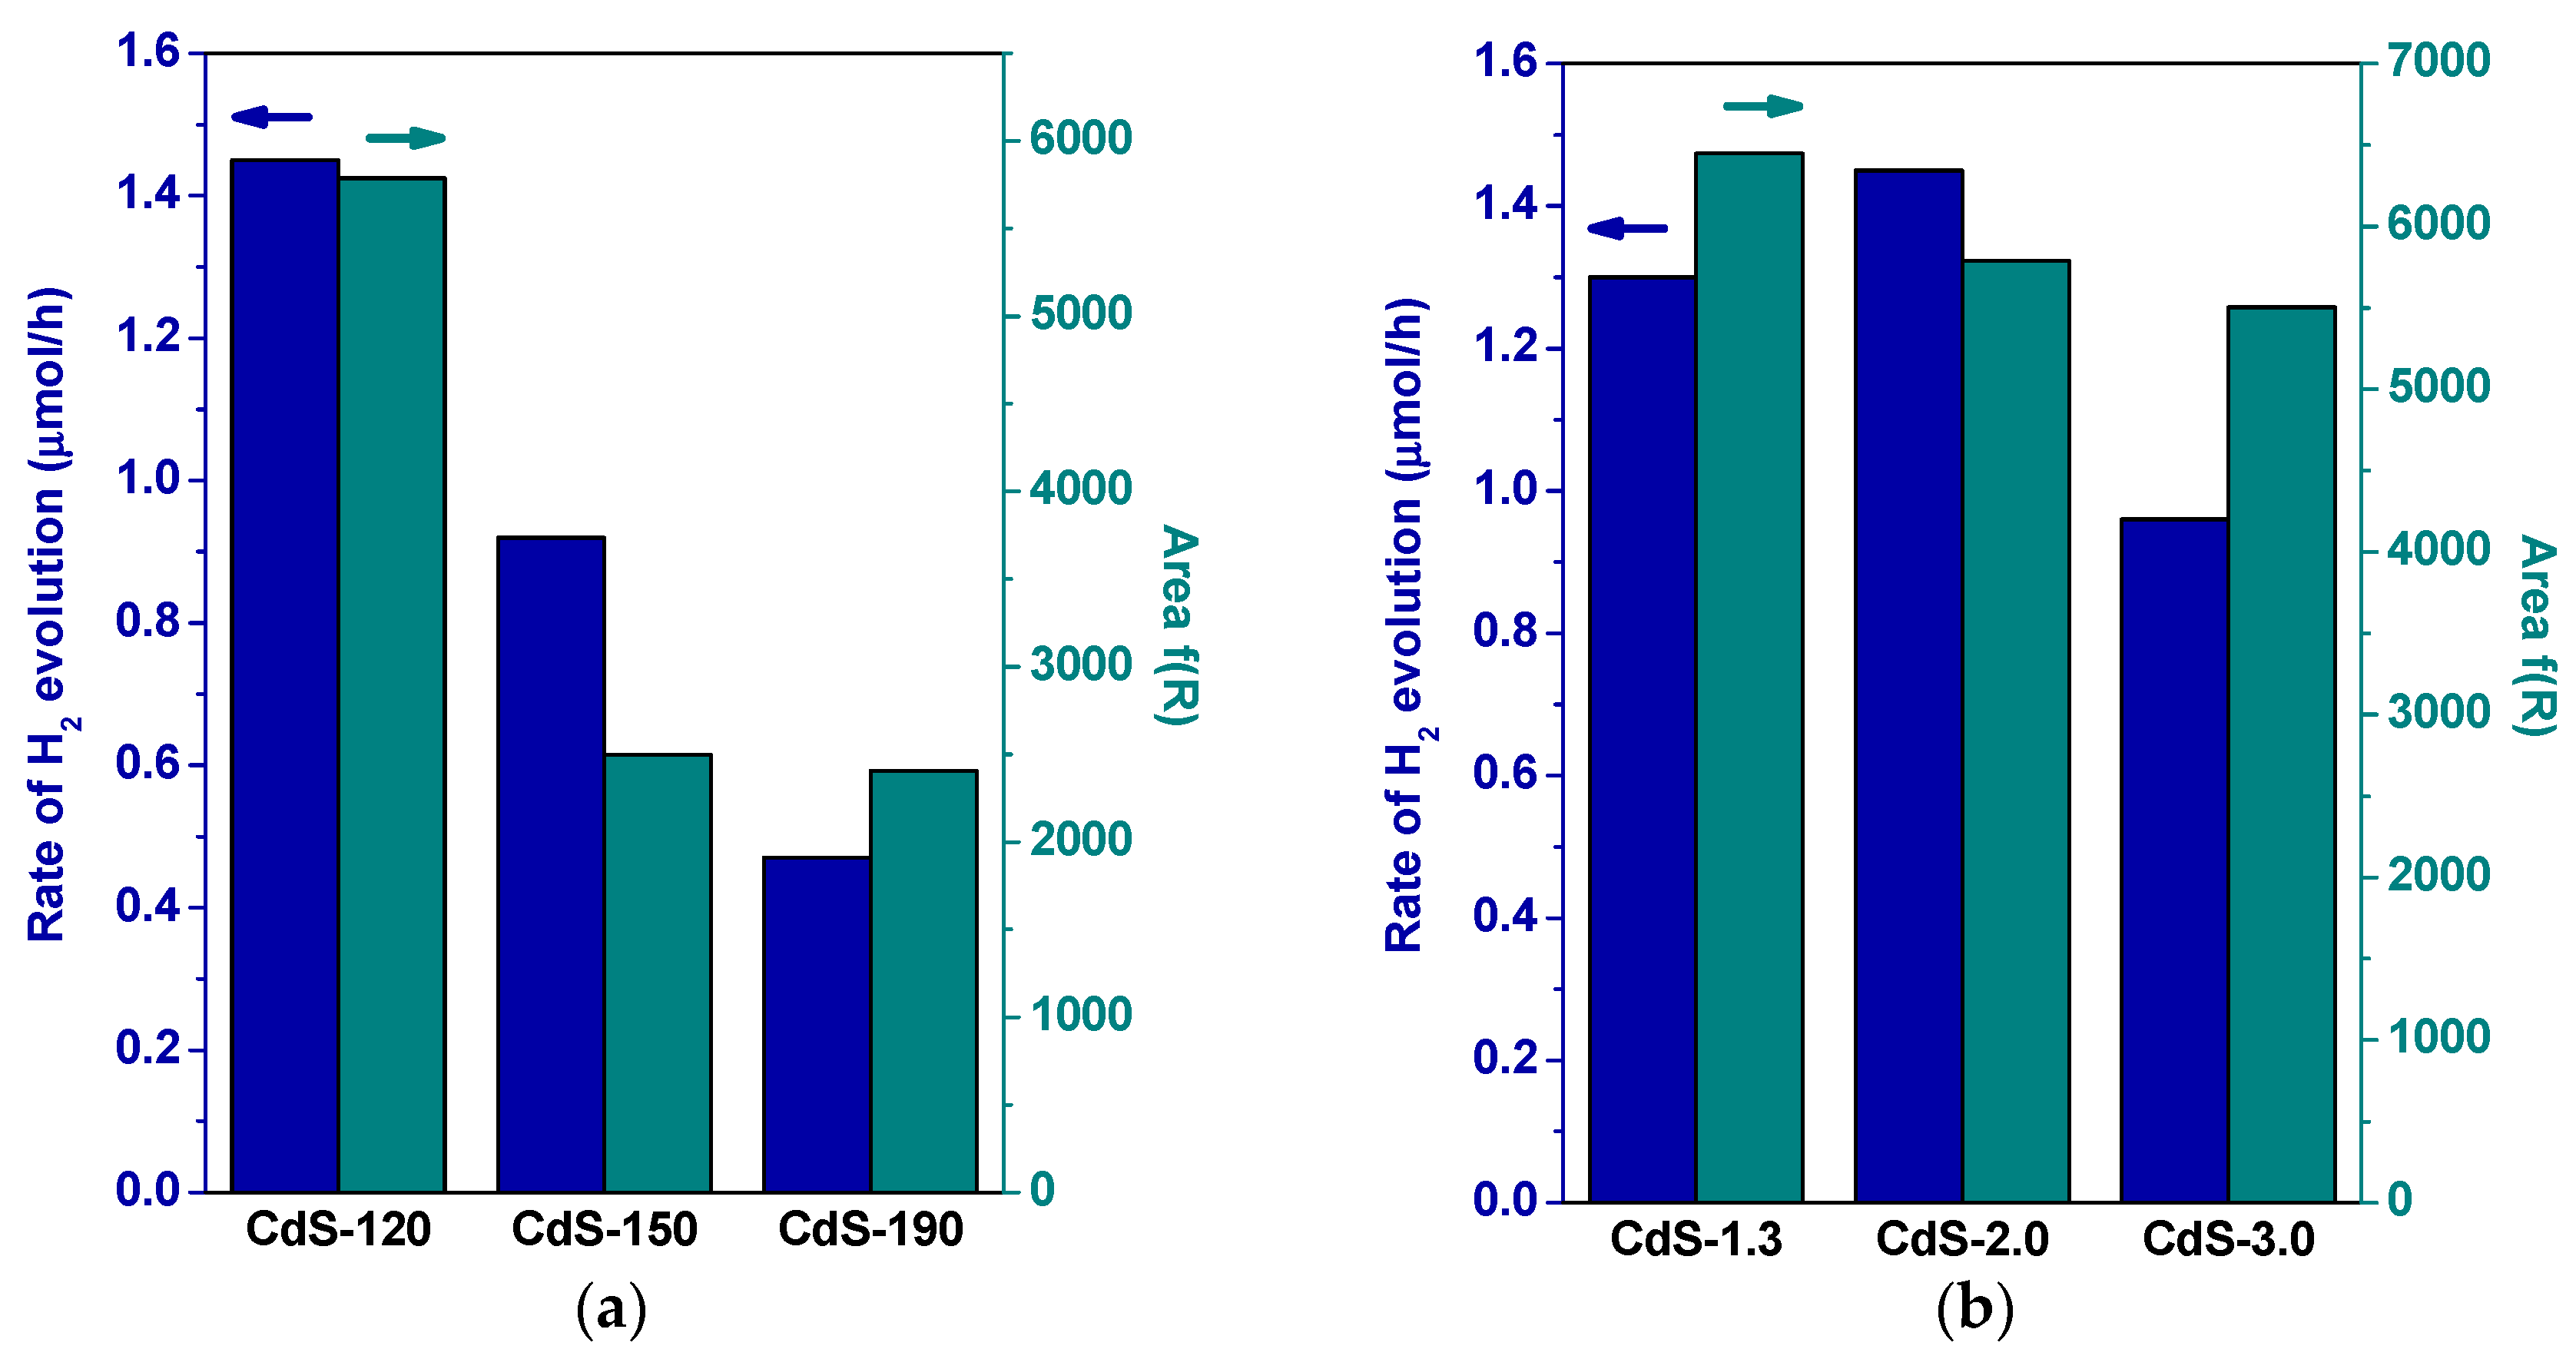
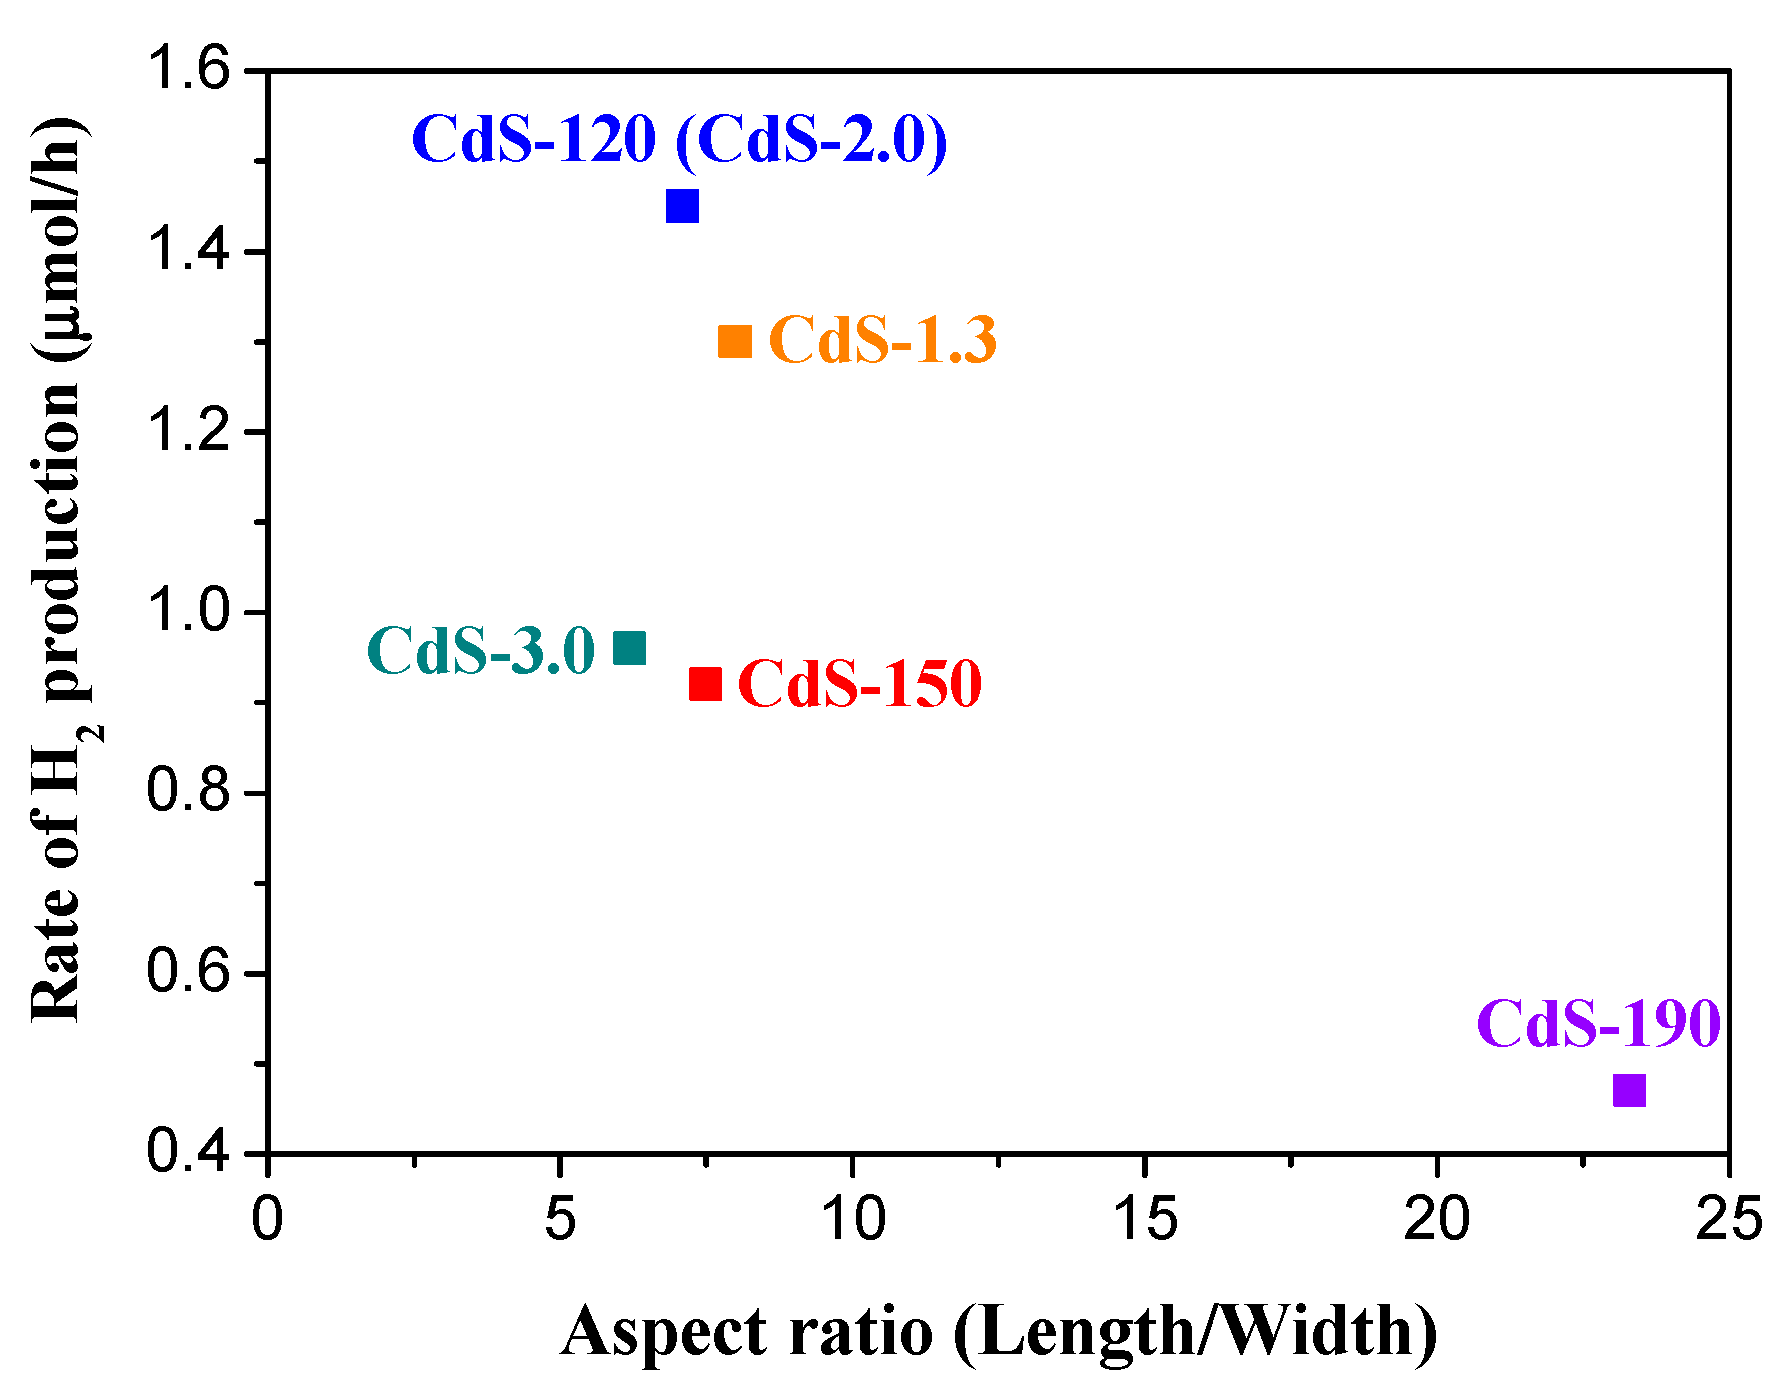
2.2. Photocatalytic Activity

Figure 8 displays hydrogen production over CdS samples prepared with different solvothermal temperatures and water/thiourea ratios. Significant differences in activity are observed for the CdS samples depending on the solvothermal temperature used. As Figure 8 shows, hydrogen production was found to decrease following the sequence: CdS-120 > CdS-150 > CdS-190. Hydrogen production over CdS samples is also influenced by the water/thiourea ratio used in the solvothermal synthesis. As Figure 8 indicates, hydrogen production was found to decrease following the sequence: CdS-2.0 > CdS-1.3 > CdS-3.0. The decrease in activity observed for CdS samples synthesized with water/thiourea ratio higher than 2.0 contrasts with the increase in activity observed over CdS when the water/thiourea ratio rises from 1.3 to 2.0.

3. Discussion

It is well known that the nanostructure morphology and surface characteristics of CdS are determined by the solvothermal conditions used in its preparation [34]. The mechanism of formation of CdS nanostructures in the presence of ethylenediamine (EDA) is determined by: (1) the coordination of ethylenediamine with Cd2+ ions forming a stable [Cd(EDA)2]2+ complex (Equation (1)); (2) the thiourea hydrolysis to generate the S2− ions (Equation (2)); (3) the reaction of [Cd(EDA)2]2+ complex with S2− ions to form two dimensional CdS(EDA)m structures (Equation (3)) and finally (4) the EDA molecules are eliminated from the unstable CdS(EDA)m structure resulting in the crystallization of CdS (Equation (4)) [26,35]:
Cd 2 + + 2 ( EDA ) [ Cd ( EDA ) 2 ] 2 +
( NH 2 ) 2 CS + 2 H 2 O 2 NH 3 + H 2 S + CO 2
Cd ( EDA ) m 2 + + S 2 CdS ( EDA ) m
CdS ( EDA ) m Δ T ( CdS ) m n + n ( EDA )
The nanomorphology of CdS during the solvothermal synthesis is controlled by the thermodynamics and kinetics during the nucleation and growth of nanocrystals which in turn are determined by the temperature and the water/thiourea ratio used in the synthesis. Shape tuning of CdS by the controlled addition of sulfide was reported by Shanmugapriya et al. [36] who showed the transition from nanospheres to nanorods on increasing the rate of addition of sulfide anions. In line with this, the increase in the temperature during the solvothermal synthesis leads to an increase in the decomposition kinetics of thiourea that increases the release rate of S2− producing both higher rate of crystalline nucleation of CdS and a higher rate of crystal growth. The higher rate of crystalline nucleation induces a higher diameter of the CdS nanostructures since the radial growth mainly occurs in the initial stage of nucleation and it determines the diameter of the formed nanostructures. On the other hand, the rapid crystal growth associated with the increase in temperature implies higher growth along the [001] plane. The increase in crystallinity, diameter and aspect ratio of the CdS samples with the increase on the solvothermal temperature from 120 to 190 °C is consistent with this mechanism. On the contrary, the increase in the release rate of S2− associated to the increase in the decomposition kinetics of thiourea derived from the use of higher water/thiourea ratio implies small increase in the crystallinity and size of the nanorods of CdS formed.
The changes in the photocatalytic activity of CdS samples (Figure 8) should be a consequence of their changes in the crystallinity, morphology and size because these parameters affect the generation, separation and migration of the photogenerated charge carriers (e/h+) responsible for photoactivity [4,37,38]. With respect to photophysical characteristics of CdS samples, their UV-Vis absorption spectra (Figure 7) showed that the position of absorption edges and the band gap values of all samples (Table 1) were quite similar as a consequence of their similar composition and structure, which are the main factors that determine the band gap of the CdS photocatalyst. Conversely, the absorbance intensity at a wavelength of less than 500 nm showed differences between the CdS samples, in particular in samples synthesized at different solvothermal temperature. Comparison of hydrogen evolution from CdS samples with the integration of absorbance below 500 nm from UV-Vis data (Figure 9) indicated that absorbance capacity of samples is a key parameter in photoactivity because higher absorbance on CdS-120 sample implies higher photoactivity. Nevertheless there is not a parallel behavior between the photoactivity and the absorbance capacity on the rest of the samples, indicating the influence of characteristics other than photophysical properties in these samples.
Apart from the absorption of photons and the photogeneration of charge carriers (e/h+), the separation and migration of these carriers must also be examined in order to justify the differences in the photoactivity of the CdS samples. 1-D nanostructures with dimensions close to the exciton Bohr radius of CdS (2.5 nm) have positive advantages in photochemical reactions because photoexcited electrons and holes are delocalized along the length of the nanostructure but restrained in the radial direction. Thus, recombination of photoexcited electron-holes is slowed down, thereby improving the photophysical processes. Figure 10 shows the comparison between the 1-D aspect ratio of CdS samples obtained by TEM with the photocatalytic hydrogen production. A clear decrease in activity for the CdS sample with higher average aspect ratio (CdS-190 with particle size far to the exciton Bohr radius of CdS) was observed, but the rest of the samples did not show a direct correlation between the aspect ratio and photoactivity indicating the influence of characteristics other than the 1-D aspect ratio on the photoactivity of the CdS nanostructures.
The surface area of CdS photocatalysts is also a parameter to be taken into account when analyzing the photoactivity behavior of CdS samples. Figure 11 represents the rate of hydrogen production normalized per surface area in order to extract possible influence of surface/bulk structural changes upon the photoactivity of CdS samples prepared at different temperature and H2O/thiourea ratio.
As shown in Figure 11a, the CdS samples synthesized at different temperatures presented similar surface-normalized hydrogen production rates. This fact indicated that the increase in crystallinity and size observed on samples synthesized at higher temperature implying lower density of defects does not result in higher photoactivity because these features are compensated by the proportional decrease in surface area. Therefore, the synthesis of nanorods of small size and high surface area exemplified by samples prepared at lower temperature leads to higher photoactivity per mass of photocatalyst because the improvement associated to surface area prevails over the lower recombination of e/h+ associated to the higher crystalline degree of the CdS nanostructures obtained at higher temperatures during the solvothermal synthesis. The rate of hydrogen production normalized per surface area on CdS photocatalysts synthesized at H2O/thiourea ratios of 1.3 and 2.0 (Figure 11b) showed a similar surface-normalized hydrogen production rate value while this production rate decreased for the sample prepared with H2O/thiourea ratio of 3.0. From characterization results of the samples prepared with different H2O/thiourea ratios it was observed that the increase in the H2O/thiourea implies a monotonically increase in crystallinity and size and a decrease in the nanorod length. By comparing these characteristics with the hydrogen production rate normalized per surface area (Figure 11b) no direct correlation was found, indicating that the decrease in surface-normalized production rate on CdS sample prepared with higher water concentration is not associated to the change of these parameters. Changes at the surface level of CdS in the sample prepared with higher water concentration may play a role in the lower normalized photoactivity observed in this sample. In this sense the lower surface coordination of sulfur in CdS sample prepared with the higher concentration of water, in agreement with TXRF analysis in Table 1, could be the origin of the low photoactivity of this sample. The higher concentration of water during solvothermal synthesis could lead to the partial oxidation of CdS surface, forming sulfates or sulfites, that may decrease the adsorption of H2O and S2−/SO32− on photocatalyst surface preventing its interaction with the generate e/h+ carriers [39]. This possibility will be the objective of a further research.

4. Materials and Methods

4.1. CdS Synthesis

In a typical synthesis, CdS samples were prepared by solvothermal synthesis using a Teflon-lined stainless steel autoclave (125 mL of volume) charged with 0.0104 mol of cadmium nitrate tetrahydrate, (Cd(NO3)2·4H2O), as metal precursor and thiourea (NH2CSNH2) as sulphur source, using a Cd:thiourea = 1:3 (molar ratio). Subsequently, ethylenediamine (EDA) was added to 80% volume capacity of the autoclave to dissolve the precursors inside. Finally, 0.0208 mol of water was added to perform total hydrolysis of the thiourea. The autoclave was tightly closed, heated in an oven at the selected temperature for 12 h and left to cool down to room temperature. The yellow precipitates were collected by centrifugation, washed with distilled water several times, washed with absolute ethanol to remove the excess of thiourea and solvent, and then dried under vacuum at 70 °C for 2 h. To investigate the effect of the solvothermal temperature on the crystal structure, morphology and photocatalytic performance of CdS photocatalysts, similar experiments were carried out using different solvothermal temperature: 120, 150 and 190 °C. According to the temperature used in the solvothermal synthesis, samples were labeled as CdS-x (x = 120, 150 and 190). The effect of the generation of sulfide ions by hydrolysis of thiourea on the structure, morphology and photoactivity of CdS photocatalysts was analogously investigated. To achieve this objective three CdS samples were prepared with different water/thiourea ratio: 1.3, 2 and 3. According to the water/thiourea ratio used in the solvothermal synthesis, samples were labeled as CdS-x (x = 1.3, 2.0 and 3.0). CdS-120 and CdS-2.0 are the same sample.

4.2. CdS Characterization

The chemical composition of CdS samples was determined by total reflection X-ray fluorescence (TXRF) analysis performed with a benchtop S2 PicoFox TXRF spectrometer from Bruker Nano GmbH (Berlin, Germany), equipped with a molybdenum X-ray source working at 50 kV and 600 μA, a multilayer monochromator with 80% reflectivity at 17.5 keV (Mo Kα), an XFlash SDD detector with an effective area of 30 mm2, and an energy resolution better than 150 eV for Mn Kα. The fine beam impinges on a polished sample carrier at a very small angle (<0.1°) and is totally reflected. Because the intensity of incident X-ray beams is reflected almost entirely, the remaining intensity penetrates only a few nanometers (approximately 10–15 nm) in the sample.
The specific surface areas of the samples were calculated by applying the BET method to the N2 adsorption/desorption isotherms recorded at the liquid nitrogen temperature (−196 °C) on a TRISTAR 3000 instrument (Micromeritics, Norcross, GA, USA) using samples previously degassed under vacuum (ca. 10−4 mbar) at 120 °C for 2 h to remove all moisture and adsorbed gases on the surface of the sample. The specific surface area values of the samples were calculated by applying the BET equation to the nitrogen adsorption isotherm within the relative pressures 0.05 < P/P0 < 0.30. Desorption data were used to determinate the pore size distribution by the Barret-Joyner-Halenda (BJH) method, assuming a cylindrical pore model.
The surface morphology and size of the CdS aggregates were observed by Field Emission Scanning Electron Microscopy (FE-SEM) using a XL30 S-FEG Microscope (Philips, Eindhoven, The Netherlands). The morphological characteristics of CdS nanostructures were obtained by transmission electron microscopy (TEM) and high-resolution transmission electron microscopy (HRTEM) with a 2100F TEM/STEM system (JEOL, Tokyo, Japan) operating at 200 kV accelerating voltage with a Field Emission Gun (FEG), obtaining a point resolution of 0.19 nm.
X-ray diffraction patterns of CdS samples were recorded using an X’Pert Pro polycrystal diffractometer (PANalytical, Egham, England) with an X’Celerator RTMS detector and nickel-filtered Cu Kα1 radiation (λ = 0.15406 nm, 45 kV, 40 mA) under constant instrument parameters. For each sample, Bragg angles between 4° and 90° (2θ) were scanned with a step size of 0.0335° that was used during a continuous scan in the abovementioned range. Volume-averaged crystallite sizes were determined by applying the Debye-Scherrer equation.
The UV-vis spectra of CdS samples were measured on a Cary 5000 UV-Vis-NIR spectrometer (Varian, Palo Alto, CA, USA) with double beam and double shutter synchronized electronically. The sources are deuterium (UV) and halogen quartz. The detectors were a multiplier and PbS detector refrigerated for the NIR area. Band gap size was obtained from Tauc plots by plotting a tangent line over the slope of the UV-vis spectra and prolonging it to ƒ(R) = 0. The wavelength value obtained was converted to [40] given Eph = hc/λ, where Eph is the photon energy, h is the Planck constant, c the speed of light and λ the photon wavelength.

4.3. Photocatalytic Activity

The hydrogen evolution from CdS samples was evaluated in a closed Pyrex glass reactor (250 mL total volume, 8 cm diameter) working at room temperature and under Ar atmosphere (0.1 bar). The photocatalyst powders (0.05 g) were dispersed by magnetic stirring in an aqueous solution (150 mL) containing 0.05 M Na2S and 0.02 M Na2SO3 as sacrificial electron-donor agents [41]. Solution pH is 12.5. Using this mixed solution, the photocatalytic reaction should proceed according with the mechanism porposed by Reber and Meier [42] for the photocatalytic hydrogen production from solutions containing mixtures of S2− and SO32−:
Photocatalysts + hν → e (CB) + h+ (VB)
2 H2O + 2 e (CB) → H2 + 2 OH
SO32− + H2O + 2 h+ (VB) → SO42− + 2 H+
2 S2− + 2 h+ (VB) → S22−
S22− + SO32− → S2O32− + S2−
SO32− + S2− + 2 h+ (VB) → S2O32−
the overall reaction being:
3 Na2(SO3) + 2 Na2S + 5 H2O +6 e + 6 h+ → 3 H2 + 4 NaOH + Na2SO4 + 2 Na2(S2O3)
The reactor was irradiated with a Xe arc lamp (150 W, ozone free, LOT Oriel GmbH & CO KG, Darmstadt, Germany) which includes both UV and visible light. Before measurement, the solution was purged several times with Ar to ensure complete air removal. Samples of the evolved gases were extracted periodically (every 1 h for a total reaction time of 5 h) and analyzed by GC with TCD (Model Star 3400 CX chromatograph, Varian) equipped with a 5Å molecular sieve packed column using Ar as carrier gas.

5. Conclusions

CdS nanorods and nanowires with different sizes obtained by solvothermal synthesis were investigated as photocatalysts for hydrogen evolution from solutions containing mixtures of S2− and SO32-. The temperature and water/thiourea ratio used in the solvothermal synthesis determine the surface area, shape, length and degree of crystallinity of the CdS nanostructures obtained. The increase in the solvothermal temperature from 120 °C to 190 °C favours the formation of nanorods with higher crystallinity, greater length and width and smaller surface area that finally transform into nanowires of high length and crystallinity at 190 °C. CdS samples synthesized at different temperatures presented similar surface-normalized hydrogen production rates. The change in the water/thiourea ratio affects the crystallinity and length of CdS nanostructures to a lesser extent than temperature. Nevertheless an increase in the water/thiourea ratio used during the solvothermal synthesis resulted in CdS nanorods with higher crystallinity, lower length/width aspect ratio and lower specific surface area. CdS samples synthesized at H2O/thiourea ratios of 1.3 and 2.0 showed similar surface-normalized hydrogen production rate values, while this production rate decreased in the sample prepared with a H2O/thiourea ratio of 3.0. It can be hypothesized that lower photocatalytic activity of the CdS prepared with higher H2O concentration was a consequence of the lower surface coordination of sulfur in this CdS sample derived from the probable partial oxidation of the CdS surface.

Acknowledgments

The present work was performed within the research programs supported by the Secretaría de Estado de Investigación, Desarrollo e Investigación and CAM (Spain) under projects CTQ2013-48669-P and S2013/MAE-2882 respectively. Fernando Vaquero would like to acknowledge the Secretaria de Estado de Investigación, Desarrollo e Innovación for the FPI research grant.

Author Contributions

José Luis G. Fierro and Rufino M. Navarro Yerga conceived and designed the experiments; Fernando Vaquero performed the experiments; Fernando Vaquero, José Luis G. Fierro and Rufino M. Navarro Yerga analyzed the data; Fernando Vaquero, Jose Luis G. Fierro and Rufino M. Navarro Yerga wrote the paper.

Conflicts of Interest

The authors declare no conflict of interest.

References

  1. Osterloh, F.E. Inorganic materials as catalysts for photochemical splitting of water. Chem. Mater. 2007, 20, 35–54. [Google Scholar] [CrossRef]
  2. Rajeshwar, K. Hydrogen generation at irradiated oxide semiconductor-solution interfaces. J. Appl. Electrochem. 2007, 37, 765–787. [Google Scholar] [CrossRef]
  3. Darwent, J.R.; Porter, G. Photochemical hydrogen production using cadmium sulphide suspensions in aerated water. J. Chem. Soc. Chem. Commun. 1981, 145–146. [Google Scholar] [CrossRef]
  4. Navarro Yerga, R.M.; Alvarez-Galván, M.C.; Vaquero, F.; Arenales, J.; Fierro, J.L.G. Hydrogen production from water splitting using photo-semiconductor catalysts. In Renewable Hydrogen Technologies, 1st ed.; Gandía, L.M., Arzamendi, G., Diéguez, P.M., Eds.; Elsevier: Amsterdam, The Netherlands, 2013; Chapter 3; pp. 43–61. [Google Scholar]
  5. Borrell, L.; Cervera-March, S.; Giménez, J.; Simarro, R.; Andújar, J.M. A comparative study of CdS-based semiconductor photocatalysts for solar hydrogen production from sulphide + sulphite substrates. Sol. Energy Mater. Sol. Cells 1992, 25, 25–39. [Google Scholar] [CrossRef]
  6. Hoffmann, M.R.; Martin, S.T.; Choi, W.; Bahnemann, D.W. Environmental applications of semiconductor photocatalysis. Chem. Rev. 1995, 95, 69–96. [Google Scholar] [CrossRef]
  7. Matsumura, M.; Saho, Y.; Tsubomura, H. Photocatalytic hydrogen production from solutions of sulfite using platinized cadmium sulfide powder. J. Phys. Chem. 1983, 87, 3807–3808. [Google Scholar] [CrossRef]
  8. Reber, J.F.; Rusek, M. Photochemical hydrogen production with platinized suspensions of cadmium sulfide and cadmium zinc sulfide modified by silver sulfide. J. Phys. Chem. 1986, 90, 824–834. [Google Scholar] [CrossRef]
  9. Sathish, M.; Viswanathan, B.; Viswanath, R.P. Alternate synthetic strategy for the preparation of CdS nanoparticles and its exploitation for water splitting. Int. J. Hydrog. Energy 2006, 31, 891–898. [Google Scholar] [CrossRef]
  10. Sinha, A.S.K.; Sahu, N.; Arora, M.K.; Upadhyay, S.N. Preparation of egg-shell type Al2O3-supported CdS photocatalysts for reduction of H2O to H2. Catal. Today 2001, 69, 297–305. [Google Scholar] [CrossRef]
  11. Ismail, A.A.; Bahnemann, D.W. Photochemical splitting of water for hydrogen production by photocatalysis: A review. Sol. Energy Mater. Sol. Cells 2014, 128, 85–101. [Google Scholar] [CrossRef]
  12. Pal, B.; Torimoto, T.; Iwasaki, K.; Shibayama, T.; Takahashi, H.; Ohtani, B. Size and structure-dependent photocatalytic activity of jingle-bell-shaped silica-coated cadmium sulfide nanoparticles for methanol dehydrogenation. J. Phys. Chem. B 2004, 108, 18670–18674. [Google Scholar] [CrossRef]
  13. Young-Jin, C.; Kyung-Soo, P.; Jae-Gwan, P. Network-bridge structure of CdSxSe1−x nanowire-based optical sensors. Nanotechnology 2010, 21, 505605. [Google Scholar]
  14. Mahdi, M.A.; Hassan, J.J.; Ng, S.S.; Hassan, Z.; Ahmed, N.M. Synthesis and characterization of single-crystal CdS nanosheet for high-speed photodetection. Phys. E Low-Dimens. Syst. Nanostruct. 2012, 44, 1716–1721. [Google Scholar] [CrossRef]
  15. Rai, P.; Song, H.-M.; Kim, Y.-S.; Song, M.-K.; Oh, P.-R.; Yoon, J.-M.; Yu, Y.-T. Microwave assisted hydrothermal synthesis of single crystalline ZnO nanorods for gas sensor application. Mater. Lett. 2012, 68, 90–93. [Google Scholar] [CrossRef]
  16. Aboulaich, A.; Billaud, D.; Abyan, M.; Balan, L.; Gaumet, J.-J.; Medjadhi, G.; Ghanbaja, J.; Schneider, R. One-pot noninjection route to CdS quantum dots via hydrothermal synthesis. ACS Appl. Mater. Interfaces 2012, 4, 2561–2569. [Google Scholar] [CrossRef] [PubMed]
  17. Einevoll, G.T. Confinement of excitons in quantum dots. Phys. Rev. B 1992, 45, 3410–3417. [Google Scholar] [CrossRef]
  18. Dalvand, P.; Mohammadi, M.R. Controlling morphology and structure of nanocrystalline cadmium sulfide (CdS) by tailoring solvothermal processing parameters. J. Nanopart. Res. 2011, 13, 3011–3018. [Google Scholar] [CrossRef]
  19. Demazeau, G. Solvothermal processes: New trends in materials chemistry. J. Phys. Conf. Ser. 2008, 121, 082003. [Google Scholar] [CrossRef]
  20. Mahdi, M.A.; Hassan, J.J.; Ng, S.S.; Hassan, Z. Growth of CdS nanosheets and nanowires through the solvothermal method. J. Cryst. Growth 2012, 359, 43–48. [Google Scholar] [CrossRef]
  21. Yan, S.; Sun, L.; Qu, P.; Huang, N.; Song, Y.; Xiao, Z. Synthesis of uniform CdS nanowires in high yield and its single nanowire electrical property. J. Solid State Chem. 2009, 182, 2941–2945. [Google Scholar] [CrossRef]
  22. Li, Y.; Huang, F.; Zhang, Q.; Gu, Z. Solvothermal synthesis of nanocrystalline cadmium sulfide. J. Mater. Sci. 2000, 35, 5933–5937. [Google Scholar] [CrossRef]
  23. Yu, J.; Yu, Y.; Zhou, P.; Xiao, W.; Cheng, B. Morphology-dependent photocatalytic H2-production activity of CdS. Appl. Catal. B Environ. 2014, 156–157, 184–191. [Google Scholar] [CrossRef]
  24. Lang, D.; Xiang, Q.; Qiu, G.; Feng, X.; Liu, F. Effects of crystalline phase and morphology on the visible light photocatalytic H2-production activity of CdS nanocrystals. Dalton Trans. 2014, 43, 7245–7253. [Google Scholar] [CrossRef] [PubMed]
  25. Jang, J.S.; Joshi, U.A.; Lee, J.S. Solvothermal synthesis of CdS nanowires for photocatalytic hydrogen and electricity production. J. Phys. Chem. C 2007, 111, 13280–13287. [Google Scholar] [CrossRef]
  26. Qingqing, W.; Gang, X.; Gaorong, H. Solvothermal synthesis and characterization of uniform CdS nanowires in high yield. J. Solid State Chem. 2005, 178, 2680–2685. [Google Scholar] [CrossRef]
  27. Zou, G.; Li, H.; Zhang, Y.; Xiong, K.; Qian, Y. Solvothermal/hydrothermal route to semiconductor nanowires. Nanotechnology 2006, 17, S313. [Google Scholar] [CrossRef]
  28. Thommes, M.; Kaneko, K.; Neimark Alexander, V.; Olivier James, P.; Rodriguez-Reinoso, F.; Rouquerol, J.; Sing Kenneth, S.W. Physisorption of gases, with special reference to the evaluation of surface area and pore size distribution (IUPAC Technical Report). Pure Appl. Chem. 2015, 87, 1051–1069. [Google Scholar] [CrossRef]
  29. Nie, L.; Meng, A.; Yu, J.; Jaroniec, M. Hierarchically macro-mesoporous Pt/γ-Al2O3 composite microspheres for efficient formaldehyde oxidation at room temperature. Sci. Rep. 2013, 3, 3215. [Google Scholar] [CrossRef] [PubMed]
  30. Wang, D.; Li, D.; Guo, L.; Fu, F.; Zhang, Z.; Wei, Q. Template-free hydrothermal synthesis of novel three-dimensional dendritic CdS nanoarchitectures. J. Phys. Chem. C 2009, 113, 5984–5990. [Google Scholar] [CrossRef]
  31. Jianxi, Y.; Gaoling, Z.; Dan, W.; Gaorong, H. Solvothermal synthesis and characterization of CdS nanowires/PVA composite films. Mater. Lett. 2005, 59, 3652–3655. [Google Scholar] [CrossRef]
  32. Mo, D.; Liu, J.; Yao, H.J.; Duan, J.L.; Hou, M.D.; Sun, Y.M.; Chen, Y.F.; Xue, Z.H.; Zhang, L. Preparation and characterization of CdS nanotubes and nanowires by electrochemical synthesis in ion-track templates. J. Cryst. Growth 2008, 310, 612–616. [Google Scholar] [CrossRef]
  33. Fan, Y.; Deng, M.; Chen, G.; Zhang, Q.; Luo, Y.; Li, D.; Meng, Q. Effect of calcination on the photocatalytic performance of CdS under visible light irradiation. J. Alloys Compd. 2011, 509, 1477–1481. [Google Scholar] [CrossRef]
  34. Djurišić, A.B.; Leung, Y.H.; Tam, K.H.; Ding, L.; Ge, W.K.; Chen, H.Y.; Gwo, S. Green, yellow, and orange defect emission from ZnO nanostructures: Influence of excitation wavelength. Appl. Phys. Lett. 2006, 88, 103107. [Google Scholar] [CrossRef]
  35. Yang, J.; Zeng, J.-H.; Yu, S.-H.; Yang, L.; Zhou, G.-E.; Qian, Y.-T. Formation process of CdS nanorods via solvothermal route. Chem. Mater. 2000, 12, 3259–3263. [Google Scholar] [CrossRef]
  36. Shanmugapriya, T.; Vinayakan, R.; Thomas, K.G.; Ramamurthy, P. Synthesis of CdS nanorods and nanospheres: Shape tuning by the controlled addition of a sulfide precursor at room temperature. CrystEngComm 2011, 13, 2340–2345. [Google Scholar] [CrossRef]
  37. Navarro, R.M.; del Valle, F.; Villoria de la Mano, J.A.; Álvarez-Galván, M.C.; Fierro, J.L.G. Photocatalytic water splitting under visible light: Concept and catalysts development. In Advances in Chemical Engineering; Hugo, I.D.L., Benito Serrano, R., Eds.; Academic Press: Burlington, MA, USA, 2009; Volume 36, pp. 111–143. [Google Scholar]
  38. Navarro Yerga, R.M.; Alvarez Galvan, M.C.; del Valle, F.; Villoria de la Mano, J.A.; Fierro, J.L. Water splitting on semiconductor catalysts under visible-light irradiation. ChemSusChem 2009, 2, 471–485. [Google Scholar] [CrossRef] [PubMed]
  39. Jang, J.S.; Ji, S.M.; Bae, S.W.; Son, H.C.; Lee, J.S. Optimization of CdS/TiO2 nano-bulk composite photocatalysts for hydrogen production from Na2S/Na2SO3 aqueous electrolyte solution under visible light (λ ≥ 420 nm). J. Photochem. Photobiol. A Chem. 2007, 188, 112–119. [Google Scholar] [CrossRef]
  40. Thiruvengadathan, R.; Regev, O. Hierarchically ordered cadmium sulfide nanowires dispersed in aqueous solution. Chem. Mater. 2005, 17, 3281–3287. [Google Scholar] [CrossRef]
  41. Tsuji, I.; Kato, H.; Kobayashi, H.; Kudo, A. Photocatalytic H2 evolution reaction from aqueous solutions over band structure-controlled (AgIn)xZn2(1−x)S2 solid solution photocatalysts with visible-light response and their surface nanostructures. J. Am. Chem. Soc. 2004, 126, 13406–13413. [Google Scholar] [CrossRef] [PubMed]
  42. Reber, J.F.; Meier, K. Photochemical production of hydrogen with zinc sulfide suspensions. J. Phys. Chem. 1984, 88, 5903–5913. [Google Scholar] [CrossRef]
  • Sample Availability: Samples of the compounds CdS-120, CdS-150 and CdS-190 are available from the authors.
Figure 1. N2 adsorption-desorption isotherms and the corresponding pore size distribution curves (inset) of the CdS samples: (a) influence of solvothermal temperature (CdS-120, 150 and 190); (b) influence of H2O/thiourea ratio (CdS-1.3, 2.0 and 3.0).
Molecules 21 00401 g001
Figure 2. Powder XRD patterns of CdS samples: (a) influence of solvothermal temperature (CdS-120, 150 and 190); (b) influence of H2O/thiourea ratio (CdS-1.3, 2.0 and 3.0).
Molecules 21 00401 g002
Figure 3. FE-SEM images of CdS samples prepared at different solvothermal temperature: (a,b) CdS-120; (c,d) CdS-150 and (e,f) CdS-190.
Molecules 21 00401 g003
Figure 4. FE-SEM images of CdS samples prepared with different H2O/thiourea ratio: (a,b) CdS-1.3 and (c,d) CdS-3.0.
Molecules 21 00401 g004
Figure 5. TEM and HRTEM images and size distribution curves (inset) of CdS samples prepared at different solvothermal temperature: (a,a’) CdS-120; (b,b’) CdS-150 and (c,c’) CdS-190.
Molecules 21 00401 g005
Figure 6. TEM and HRTEM images and size distribution curves (inset) of CdS samples prepared with different H2O/thiourea ratio: (a,a’) CdS-1.3 and (b,b’) CdS-3.0.
Molecules 21 00401 g006aMolecules 21 00401 g006b
Figure 7. UV-Vis spectra of CdS samples: (a) influence of solvothermal temperature (CdS-120, 150 and 190); (b) influence of H2O/thiourea ratio (CdS-1.3, 2.0 and 3.0).
Molecules 21 00401 g007
Figure 8. Hydrogen production on CdS photocatalysts: (a) influence of solvothermal temperature (CdS-120, 150 and 190); (b) influence of H2O/thiourea ratio (CdS-1.3, 2.0 and 3.0) (150 W Xe lamp, 0.05 g CdS photocatalyst, 150 mL aqueous solution 0.05 M Na2S/0.02 M Na2SO3).
Molecules 21 00401 g008
Figure 9. Comparison between hydrogen production rate and integration of UV-Vis absorbance below 500 nm of CdS photocatalysts: (a) influence of solvothermal temperature (CdS-120, 150 and 190); (b) influence of H2O/thiourea ratio (CdS-1.3, 2.0 and 3.0).
Molecules 21 00401 g009
Figure 10. Comparison between hydrogen production rate and the aspect ratio (length/width derived from TEM) of the CdS samples.
Molecules 21 00401 g010
Figure 11. Surface-normalized hydrogen evolution rate (µmol/h m2) over the CdS photocatalysts: (a) influence of solvothermal temperature (CdS-120, 150 and 190); (b) influence of H2O/thiourea ratio (CdS-1.3, 2.0 and 3.0).
Molecules 21 00401 g011
Table 1. Surface composition (atomic percentage) from TXRF analyses, specific surface area from N2 adsorption-desorption isotherms and band gap from UV-Vis spectra of CdS samples.
CdS SampleSurface CompositionBET (m2/g)Band Gap (eV)
Cd (%)S (%)
CdS-12046.153.975.52.49
CdS-15048.251.849.72.45
CdS-19046.753.325.72.48
CdS-1.345.854.278.92.50
CdS-2.046.153.975.52.49
CdS-3.046.853.272.42.49
Table 2. Structural properties of CdS samples determined from XRD data.
CdS SampleCrystal StructureRelative IntensityDp (nm)
I(100)/I(002)I(101)/I(002)
CdS-120Hexagonal0.440.6543.5
CdS-150Hexagonal0.530.7861.0
CdS-190Hexagonal1.041.5898.3
CdS-1.3Hexagonal0.400.6738.3
CdS-2.0Hexagonal0.440.6543.5
CdS-3.0Hexagonal0.420.7045.2
Table 3. Morphology and size of CdS samples derived from FE-SEM analysis.
CdS SampleMorphologySize (µm)
CdS-120Sheets with emerging irregular filaments0.4–6.0
CdS-150Irregular clusters of filaments0.7–12.0
CdS-190Defined filaments4.0–30.0
CdS-1.3Sheets with emerging irregular filaments0.3–4.0
CdS-2.0Sheets with emerging irregular filaments0.4–6.0
CdS-3.0Sheets with defined filaments0.7–8.0
Table 4. Morphological characteristics of CdS samples derived from TEM-HRTEM analysis.
CdS SamplesAverage Length (nm)Average Width (nm)Aspect Ratio (Length/Width)Morphology
CdS-120507.07.1nanorods
CdS-1509012.07.5nanorods
CdS-19070030.023.3nanowires
CdS-1.3607.58.0nanorods
CdS-2.0507.07.1nanorods
CdS-3.0457.26.2nanorods

