
Fast Detection of Phenolic Compounds in Extracts of Easter Pears (Pyrus communis) from the Atacama Desert by Ultrahigh-Performance Liquid Chromatography and Mass Spectrometry (UHPLC–Q/Orbitrap/MS/MS)

 ,
, 

Abstract
:
1. Introduction
2. Results and Discussion
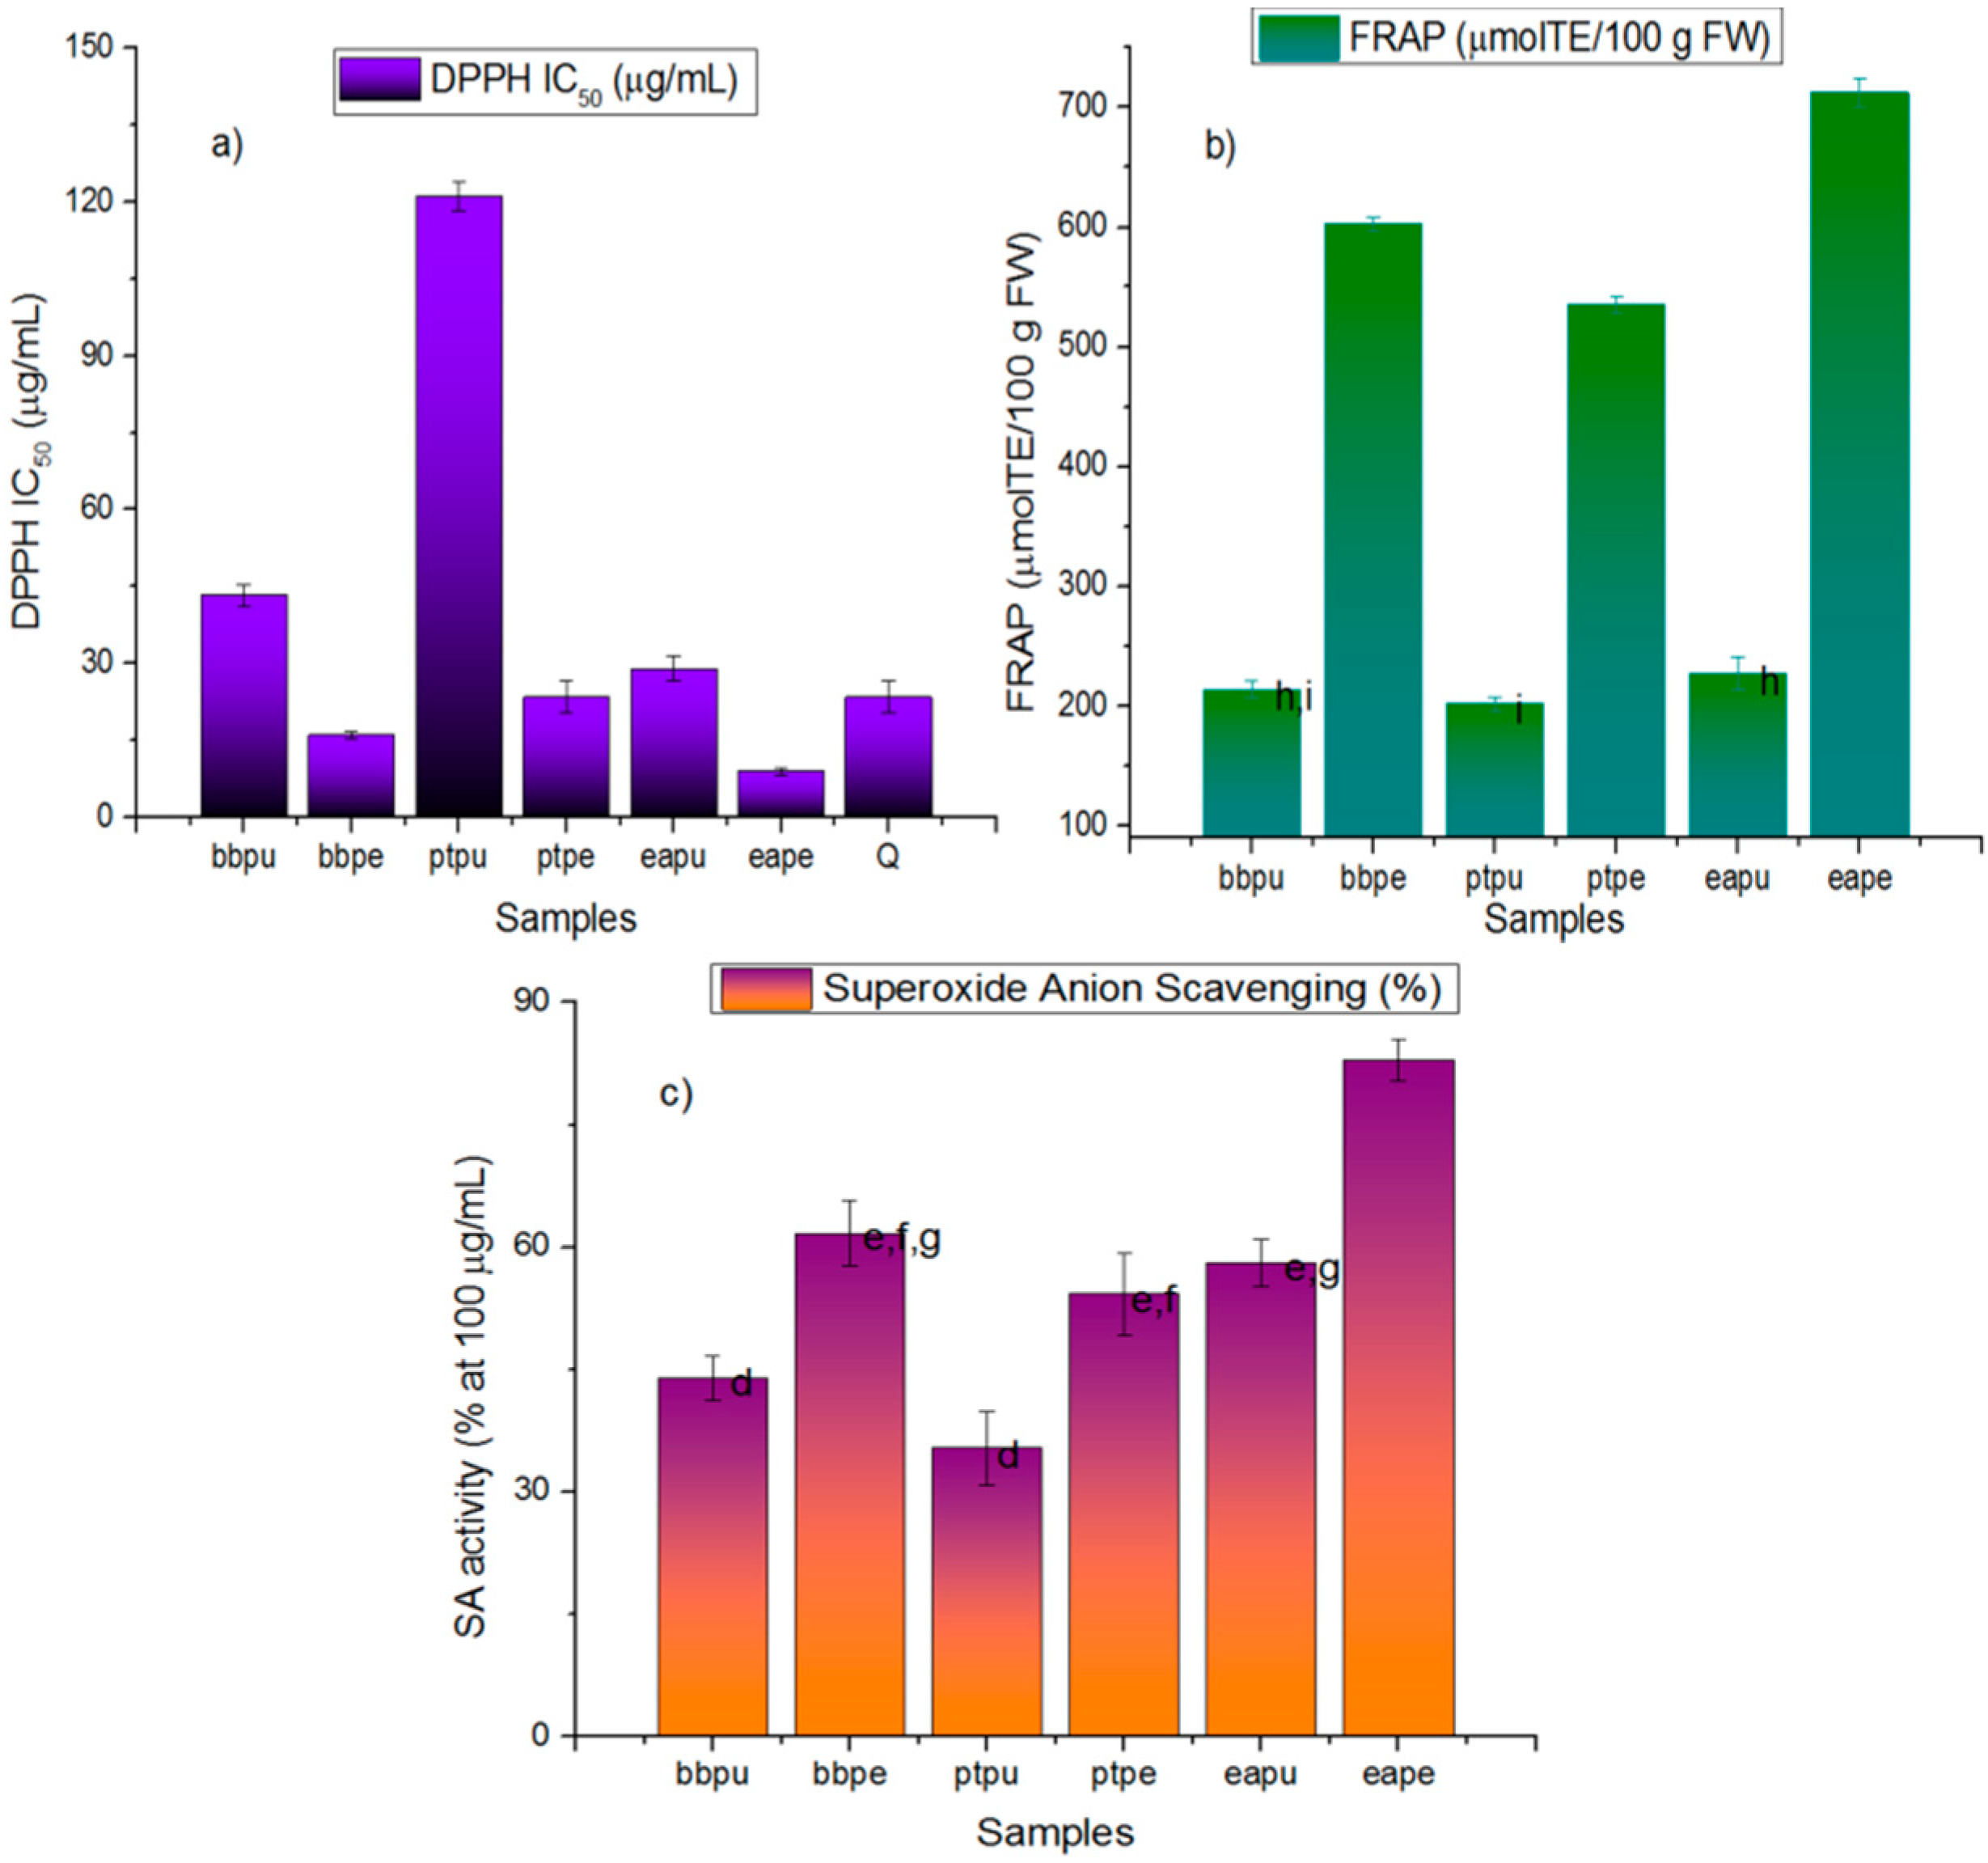
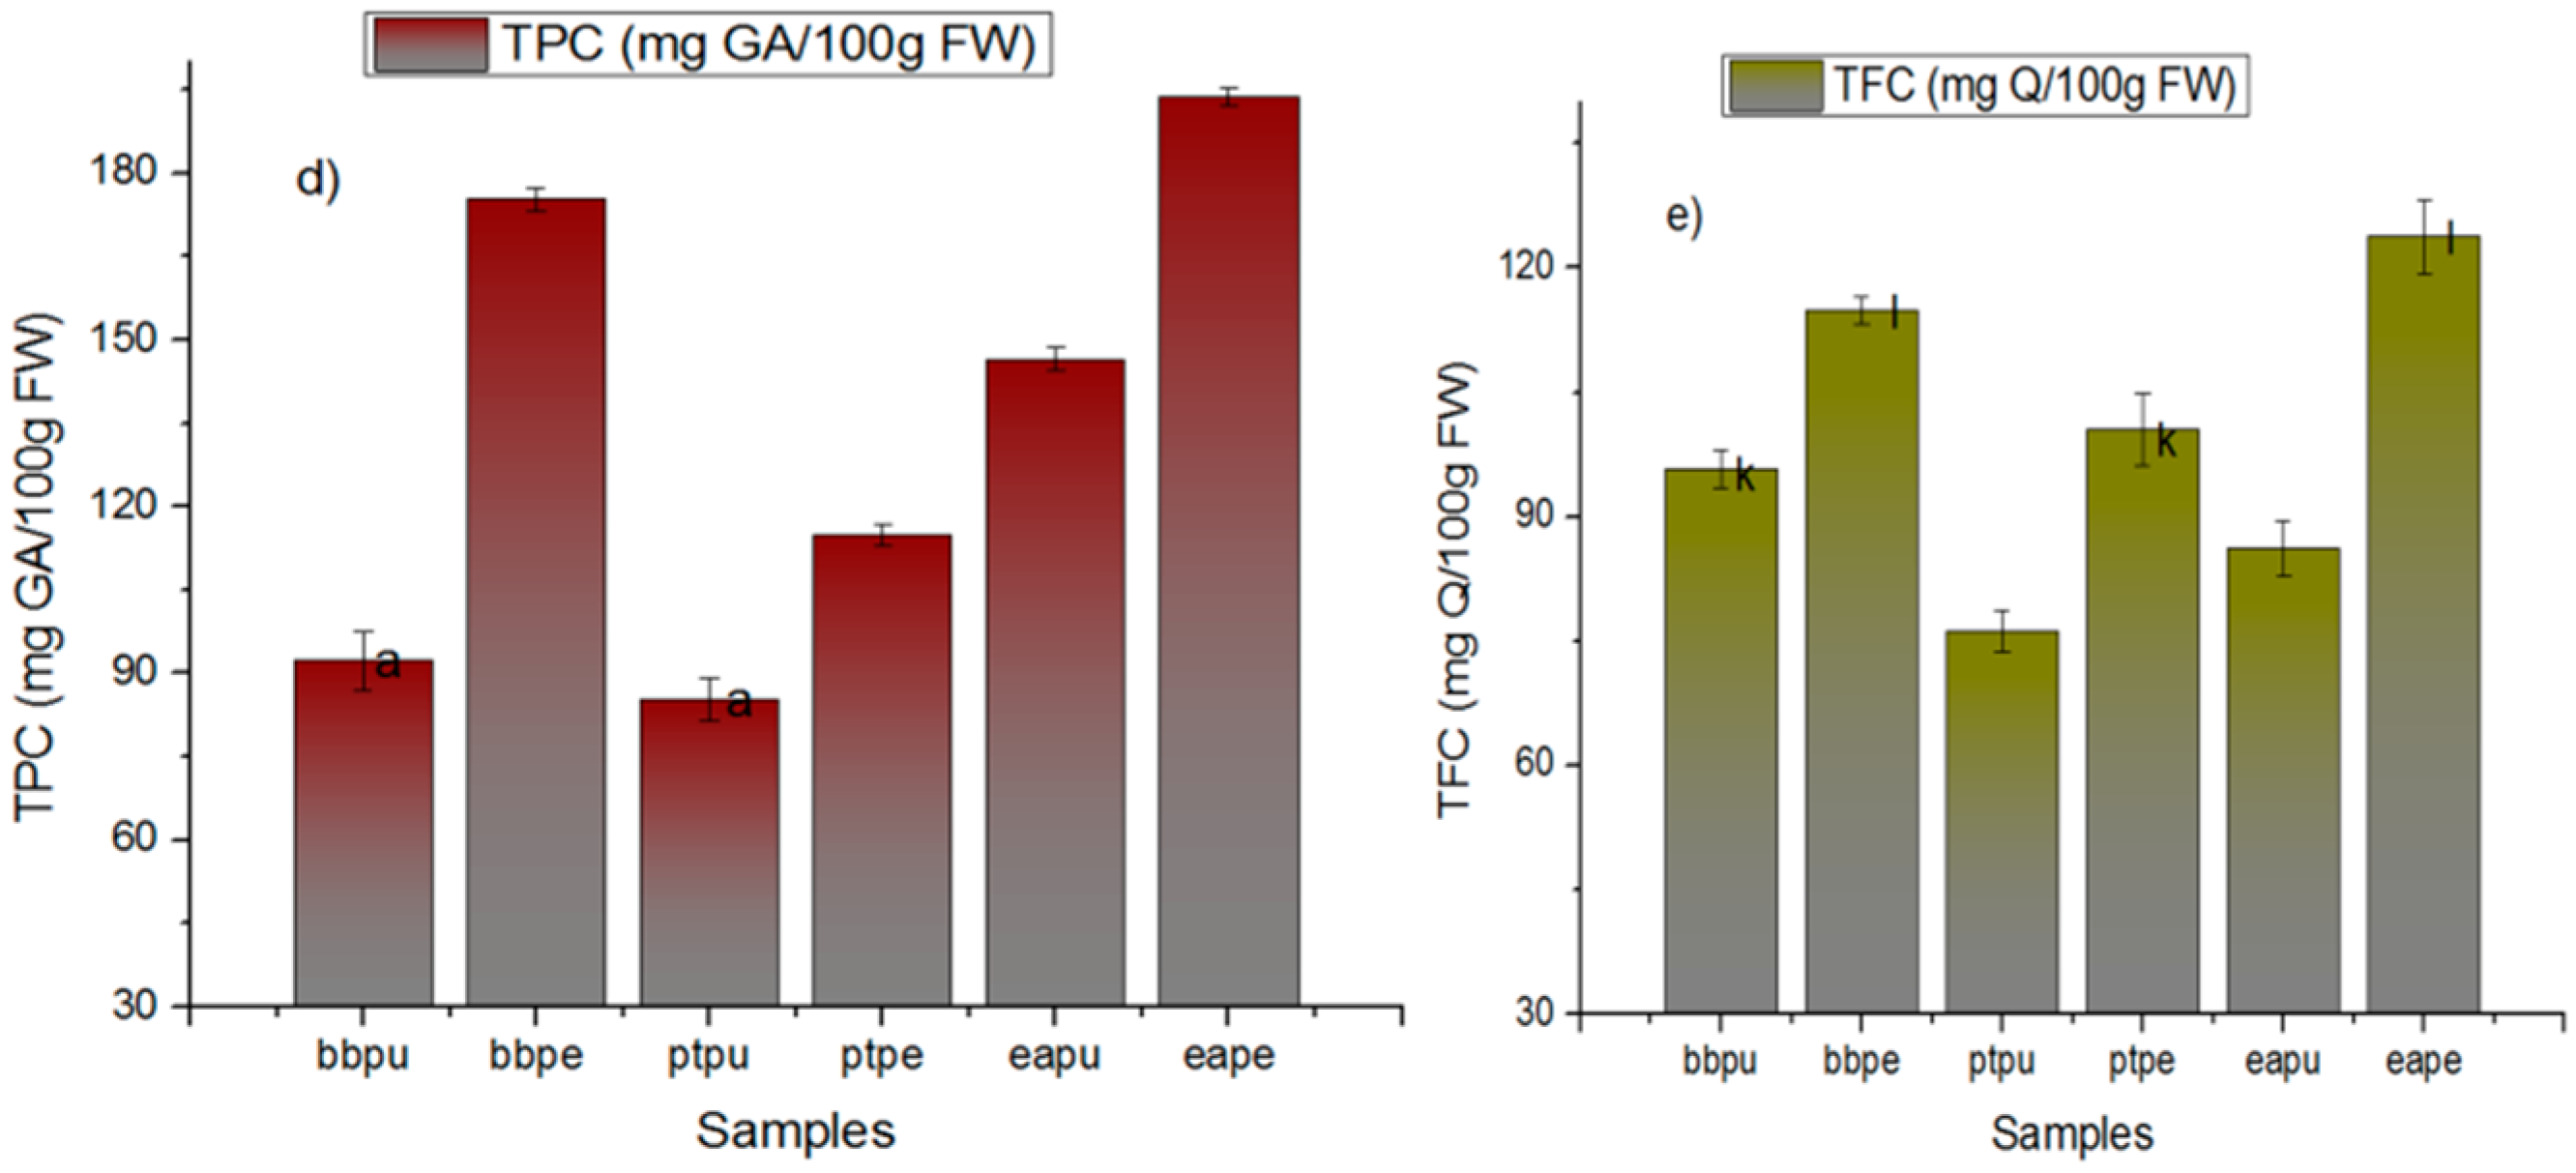
2.1. Antioxidant Capacity and Total Phenolics and Flavonoids Contents

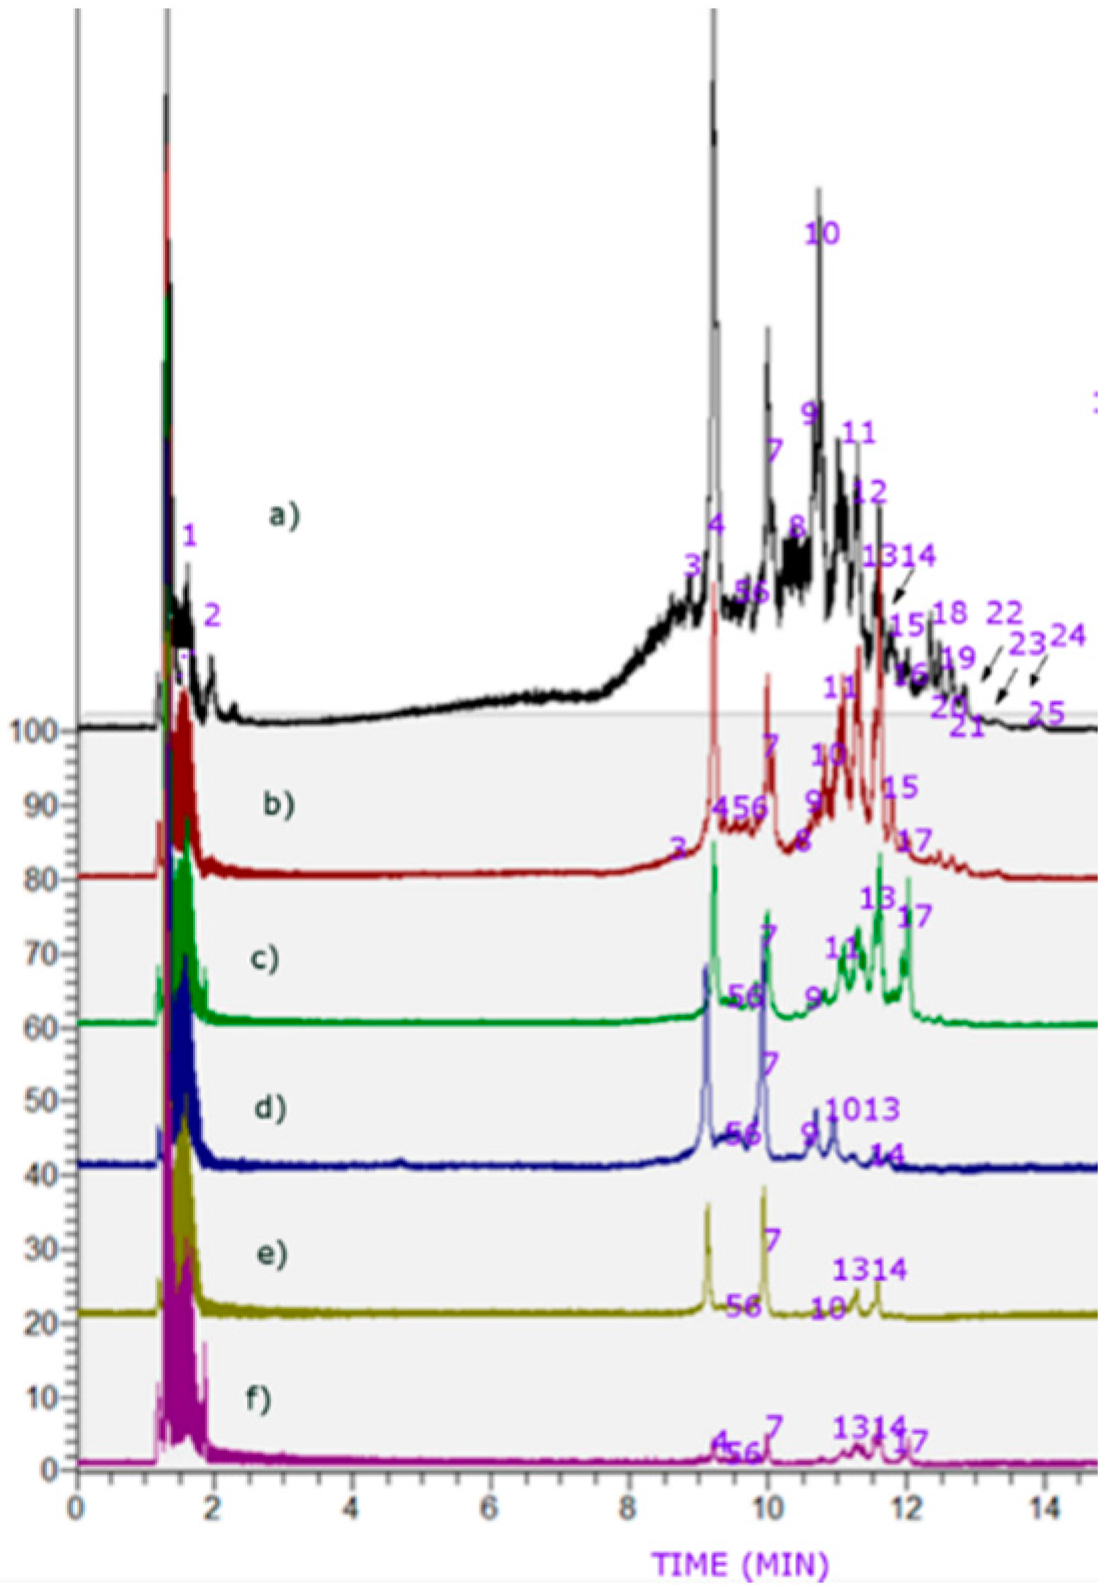
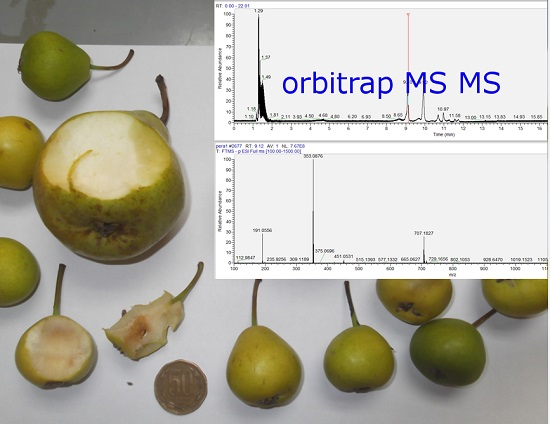
2.2. MS-PDA Identification of Phenolic Acids in Pear Fruits from Northern Chile

| Peak # | Uv Max | Tentative Identification | Molecular Formula | Retention Time | Theoretical Mass | Measured Mass | Accuracy (Dppm) | Other Ions |
|---|---|---|---|---|---|---|---|---|
| 1 | 325 | caffeoyl-glucose | C15H17O9− | 1.79 | 341.0878 | 341.0872 | 1.75 | 191.0555 (quinic acid C7H11O6−) |
| 2 | 330 | Unknown quinic acid derivative | 1.82 | 426.9632 | −0.5079 | 191.0193 (quinic acid C7H11O6−) | ||
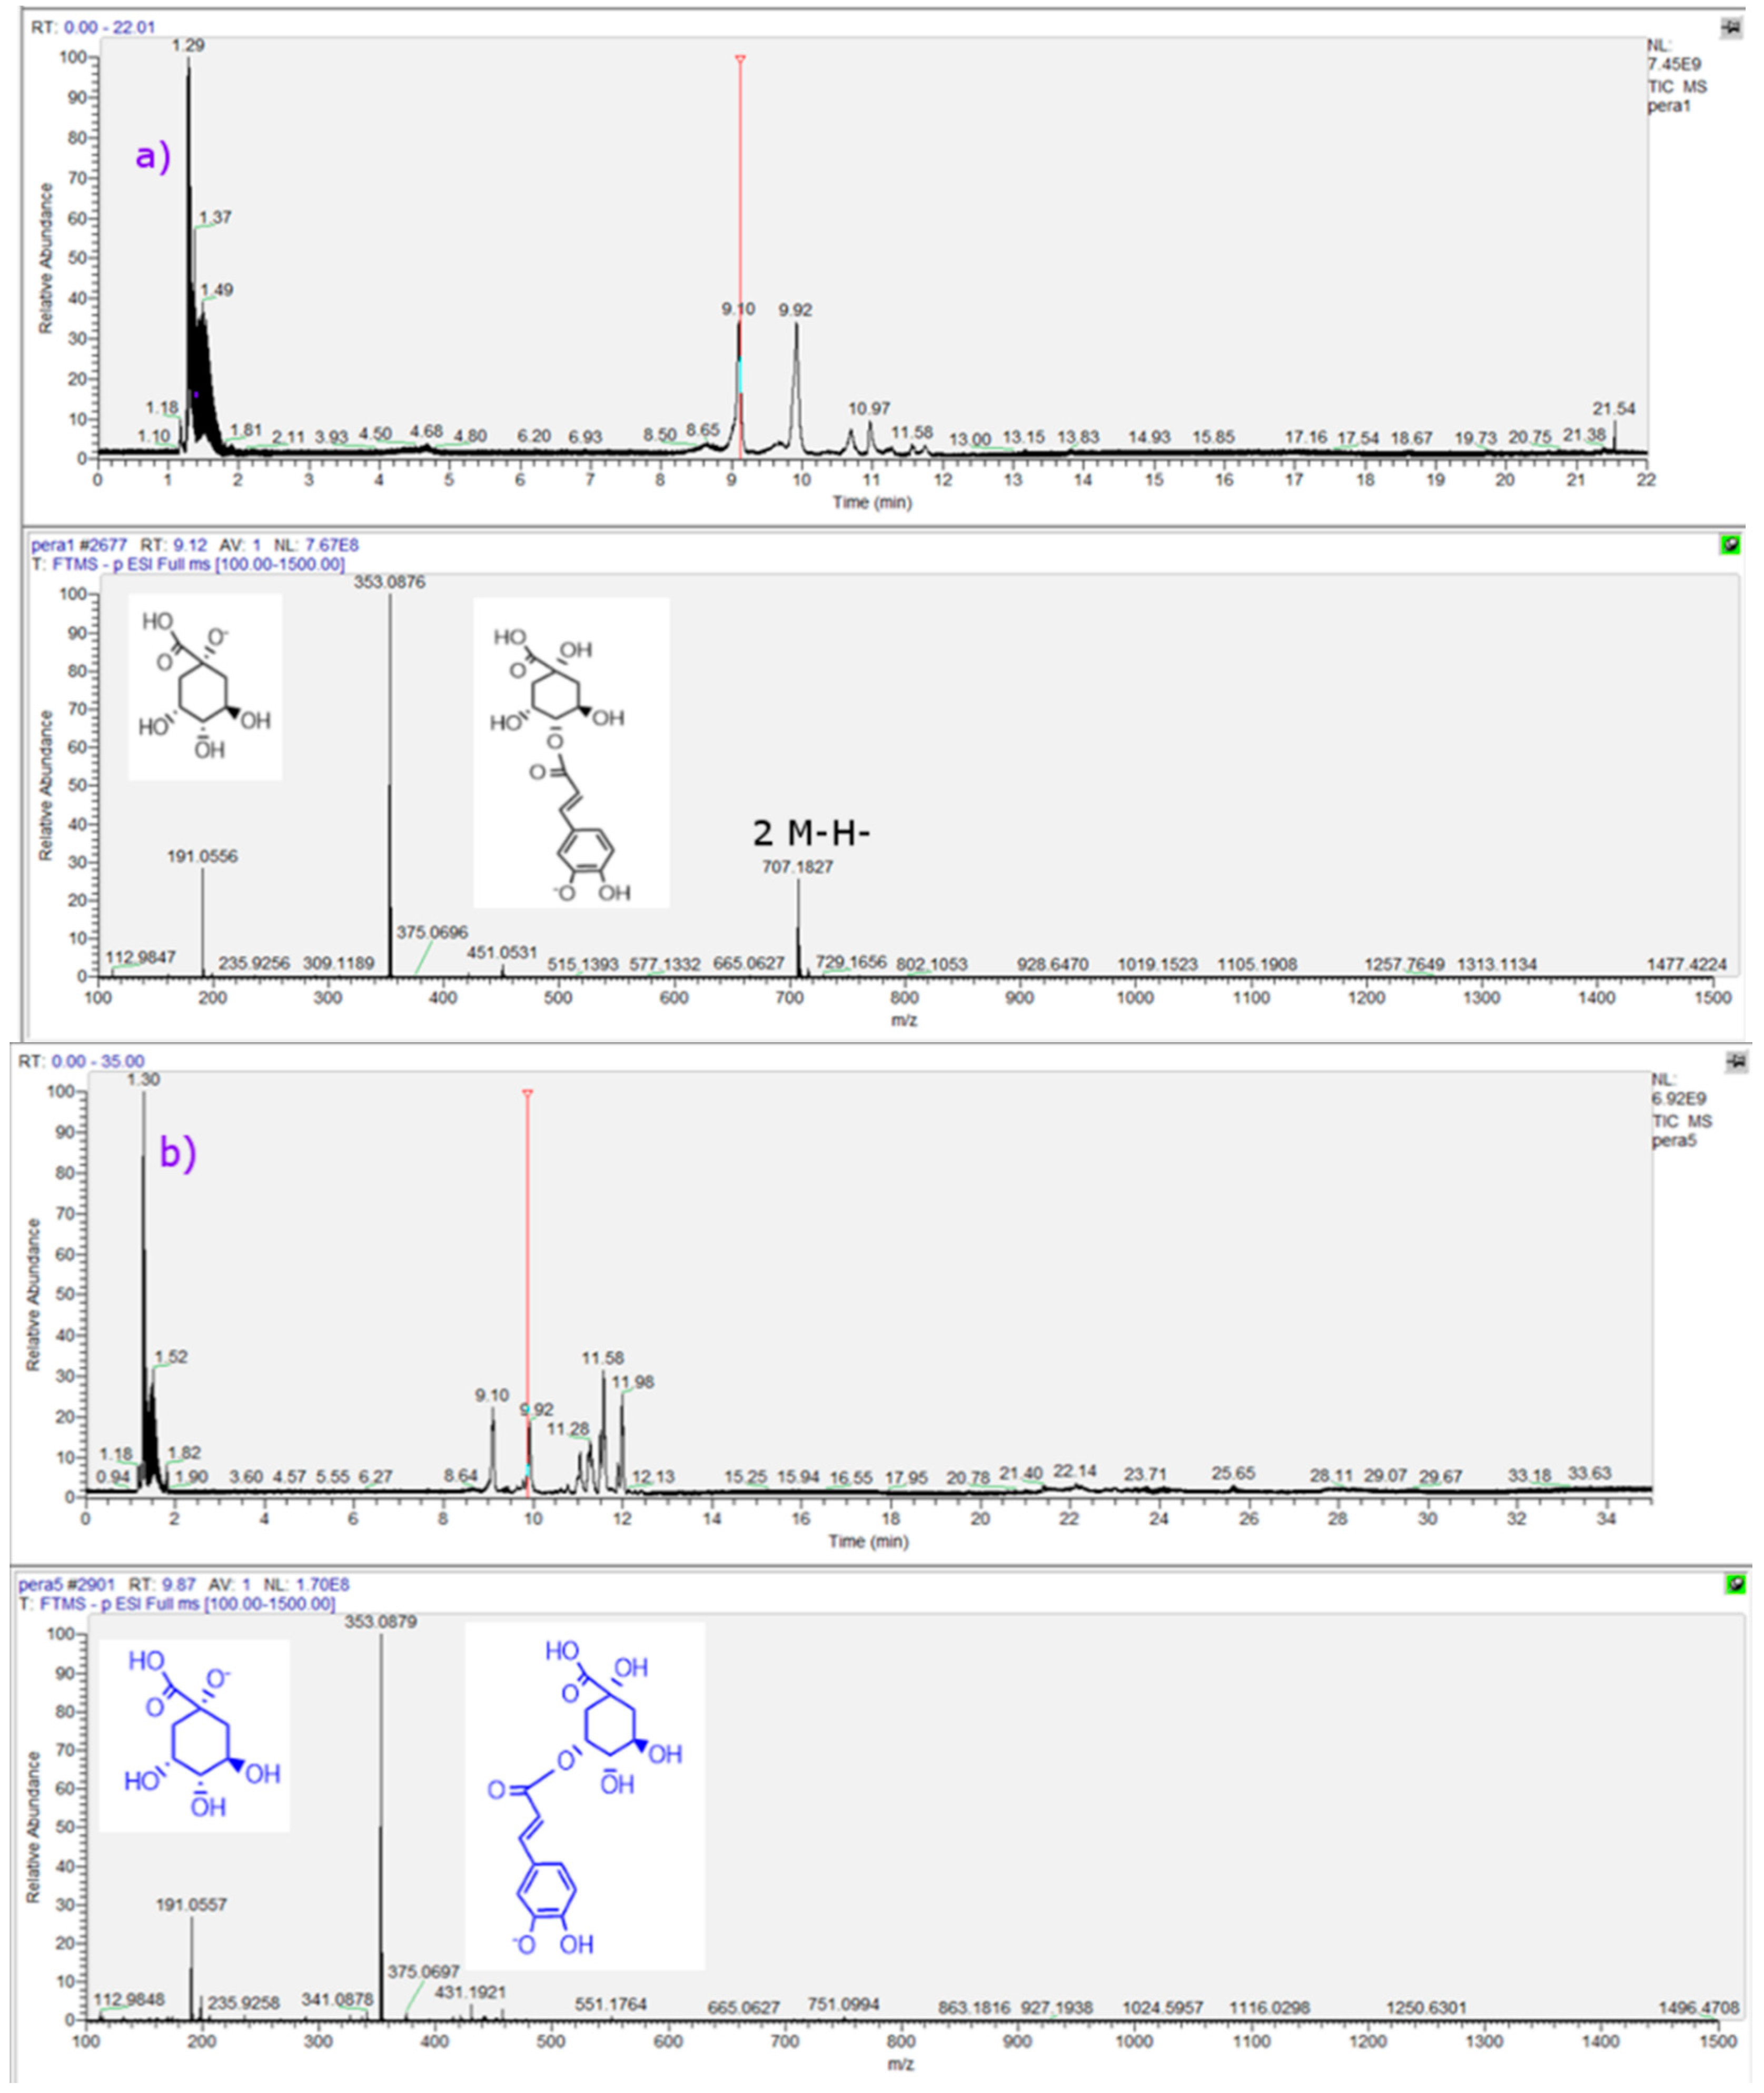
| 3 | 236, 326 | 3-O-caffeoylquinic acid (3-CQA) * | C16H17O9− | 8.63 | 353.0878 | 353.0878 | 0 | 707.1827 [2M − H]− 191.0556 (quinic acid C7H11O6−) |
| 4 | 236, 329 | 4-O-caffeoylquinic acid (4-CQA) | C16H17O9− | 9.12 | 353.0878 | 353.0876 | 0.566 | 191.0555 (quinic acid C7H11O6−) (a) |
| 5 | 280 | (+) catechin * | C15H13O6− | 9.14 | 289.07176 | 289.0715 | 2.7937 | |
| 6 | 279 | B-type procyanidin dimer | C30H25O12− | 9.16 | 577.13515 | 577.1349 | 1.4471 | 289.0713 (monomer) |
| 7 | 280 | Gallocatechin-3-O-glucose | C21H21O13− | 9.64 | 481.0987 | 481.0985 | 1.6903 | |
| 8 | 236, 329 | 5-O-caffeoylquinic acid (5-CQA) * | C16H17O9− | 9.87 | 353.0878 | 353.0876 | 0.566 | 707.1826 [2M − H]− 191.0556 (quinic acid C7H12O6) (b) |
| 9 | 280 | B-type procyanidin dimer monohexose | C36H36O27− | 10.59 | 740.6608 | 739.1668 | 0.49 | |
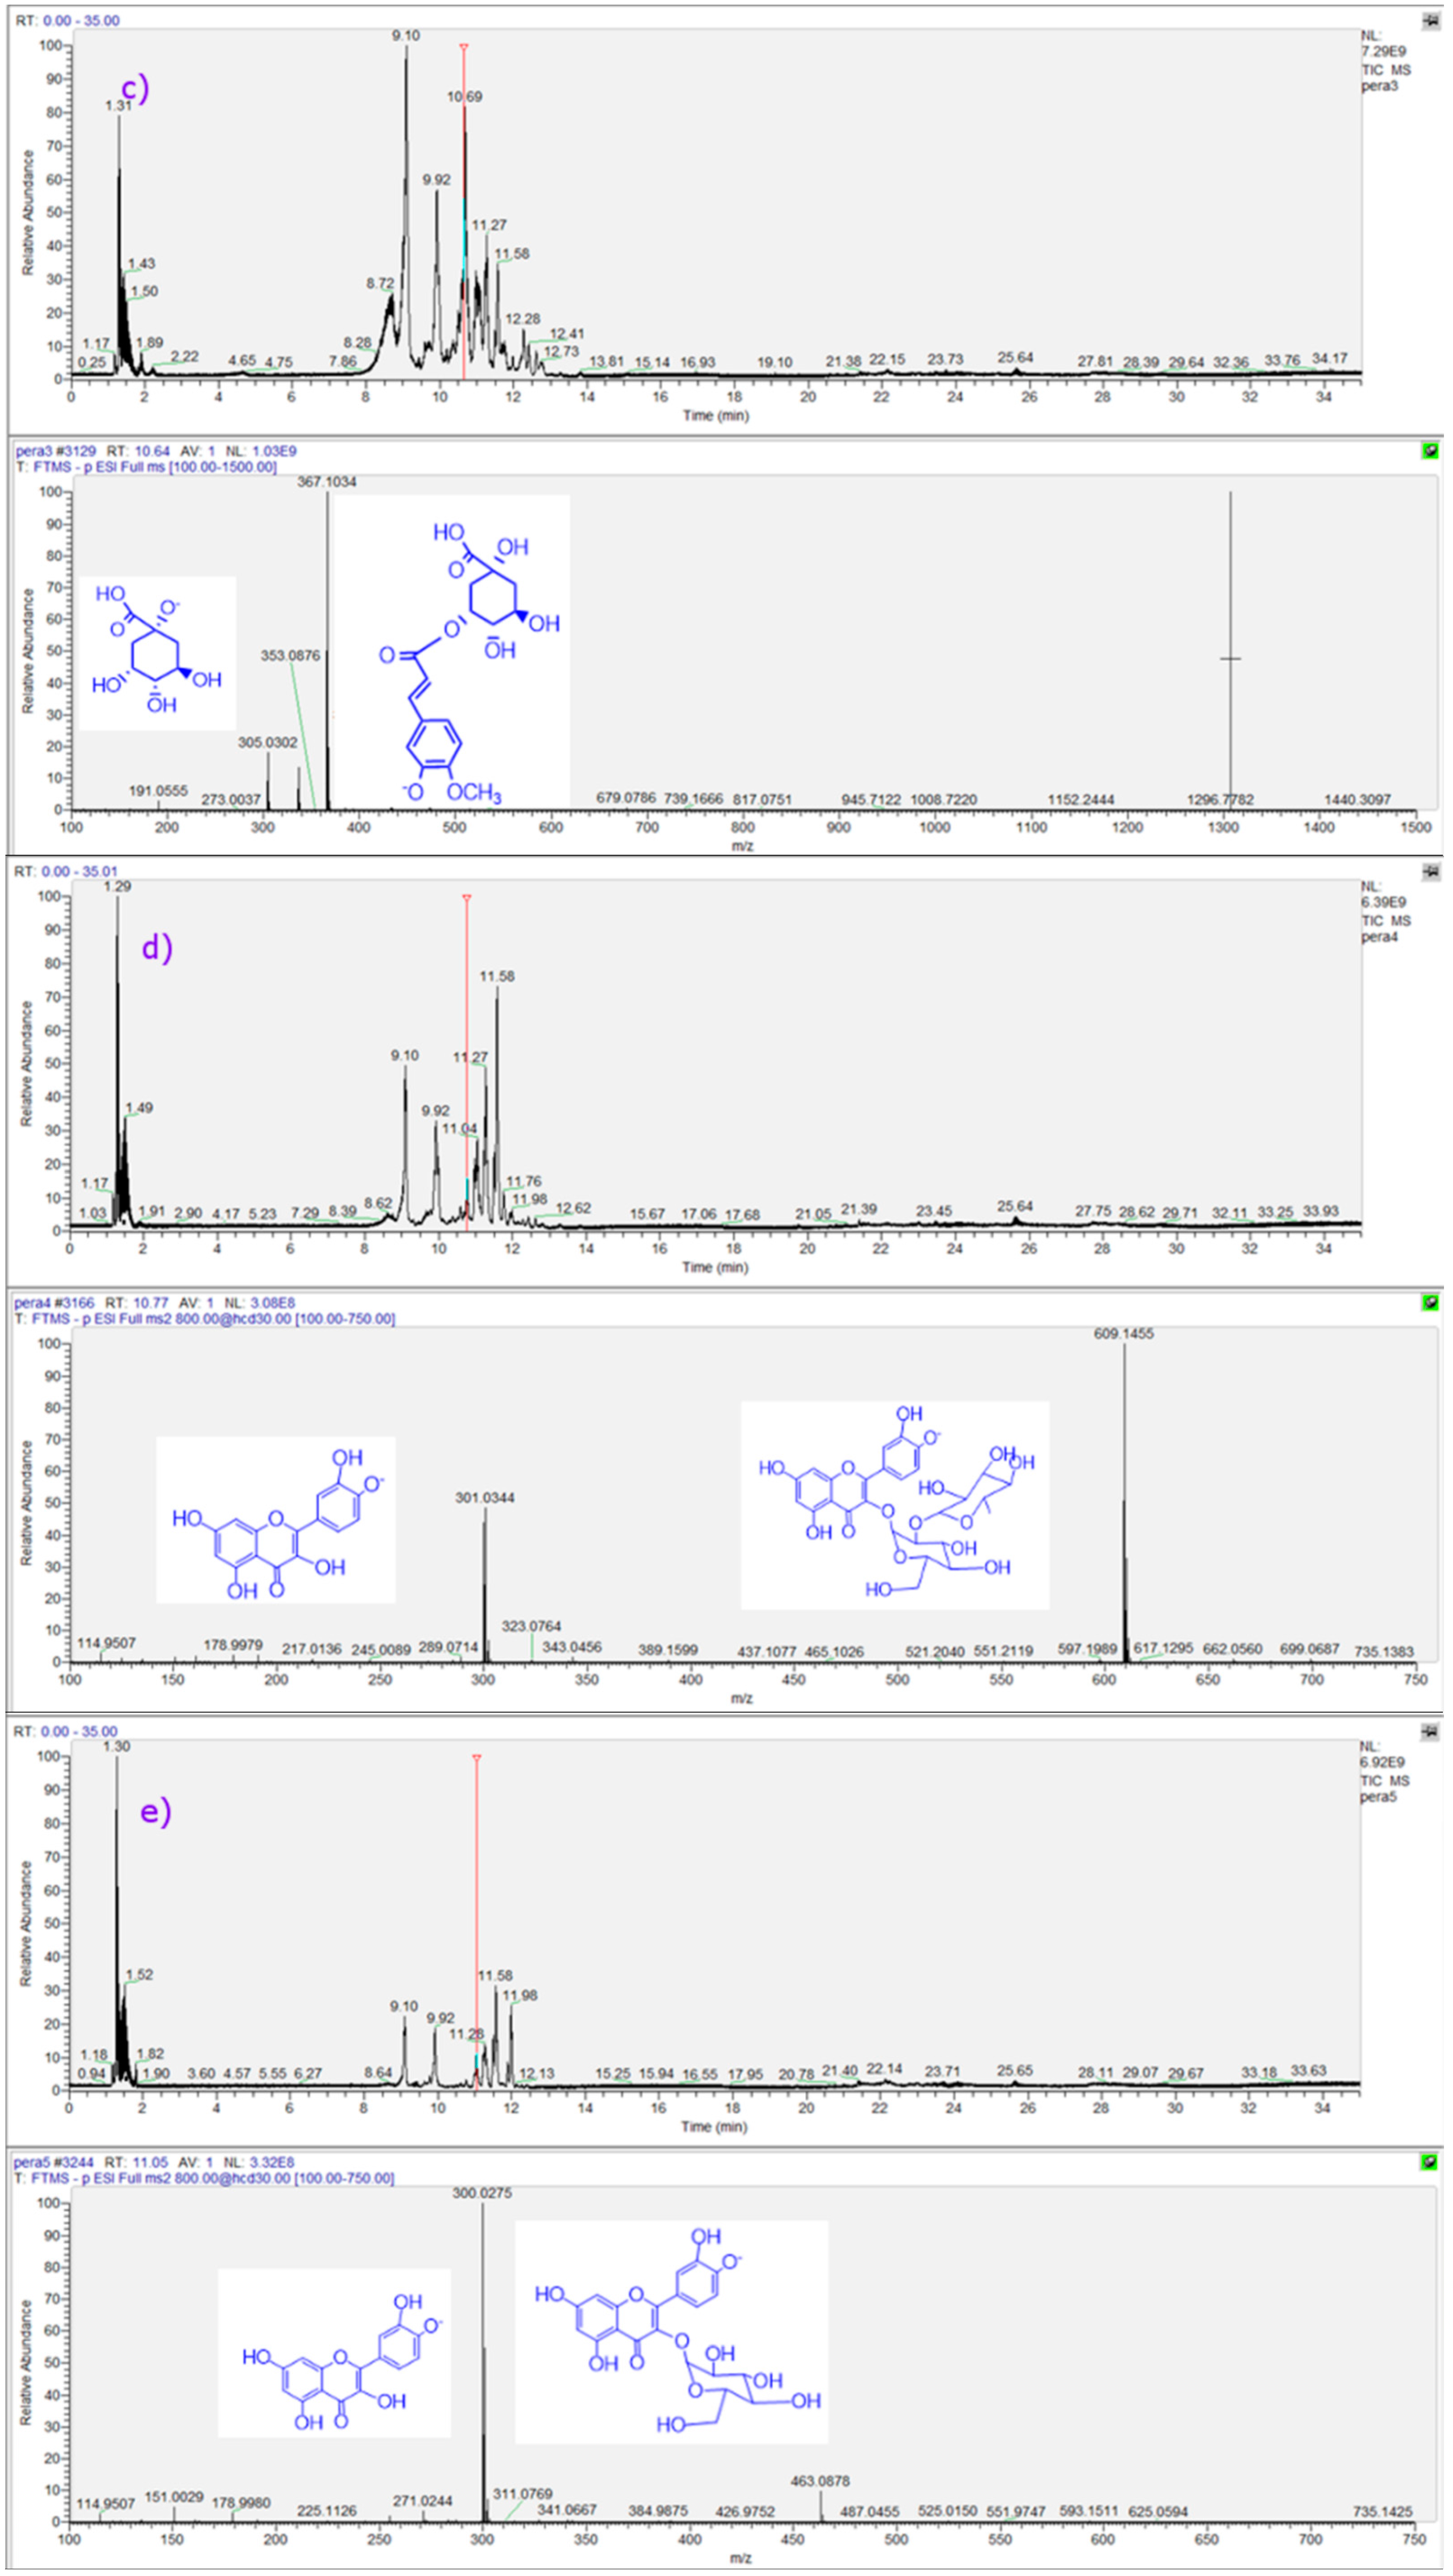
| 10 | 240, 325 | Feruloyl quinic acid (3-FQA) | C17H19O9− | 10.65 | 367.1034 | 367.1028 | 1.2398 | (c) |
| 11 | 254, 354 | Rutin * | C27H29O16− | 10.77 | 609.1461 | 609.1455 | 301.0344 (quercetin C15H9O7−) (d) | |
| 12 | 254, 354 | Quercetin-3-O-glucose * | C21H19O12− | 10.97 | 463.0882 | 463.0876 | 1.1091 | 301.0353 (Quercetin C15H9O7−) (e) |
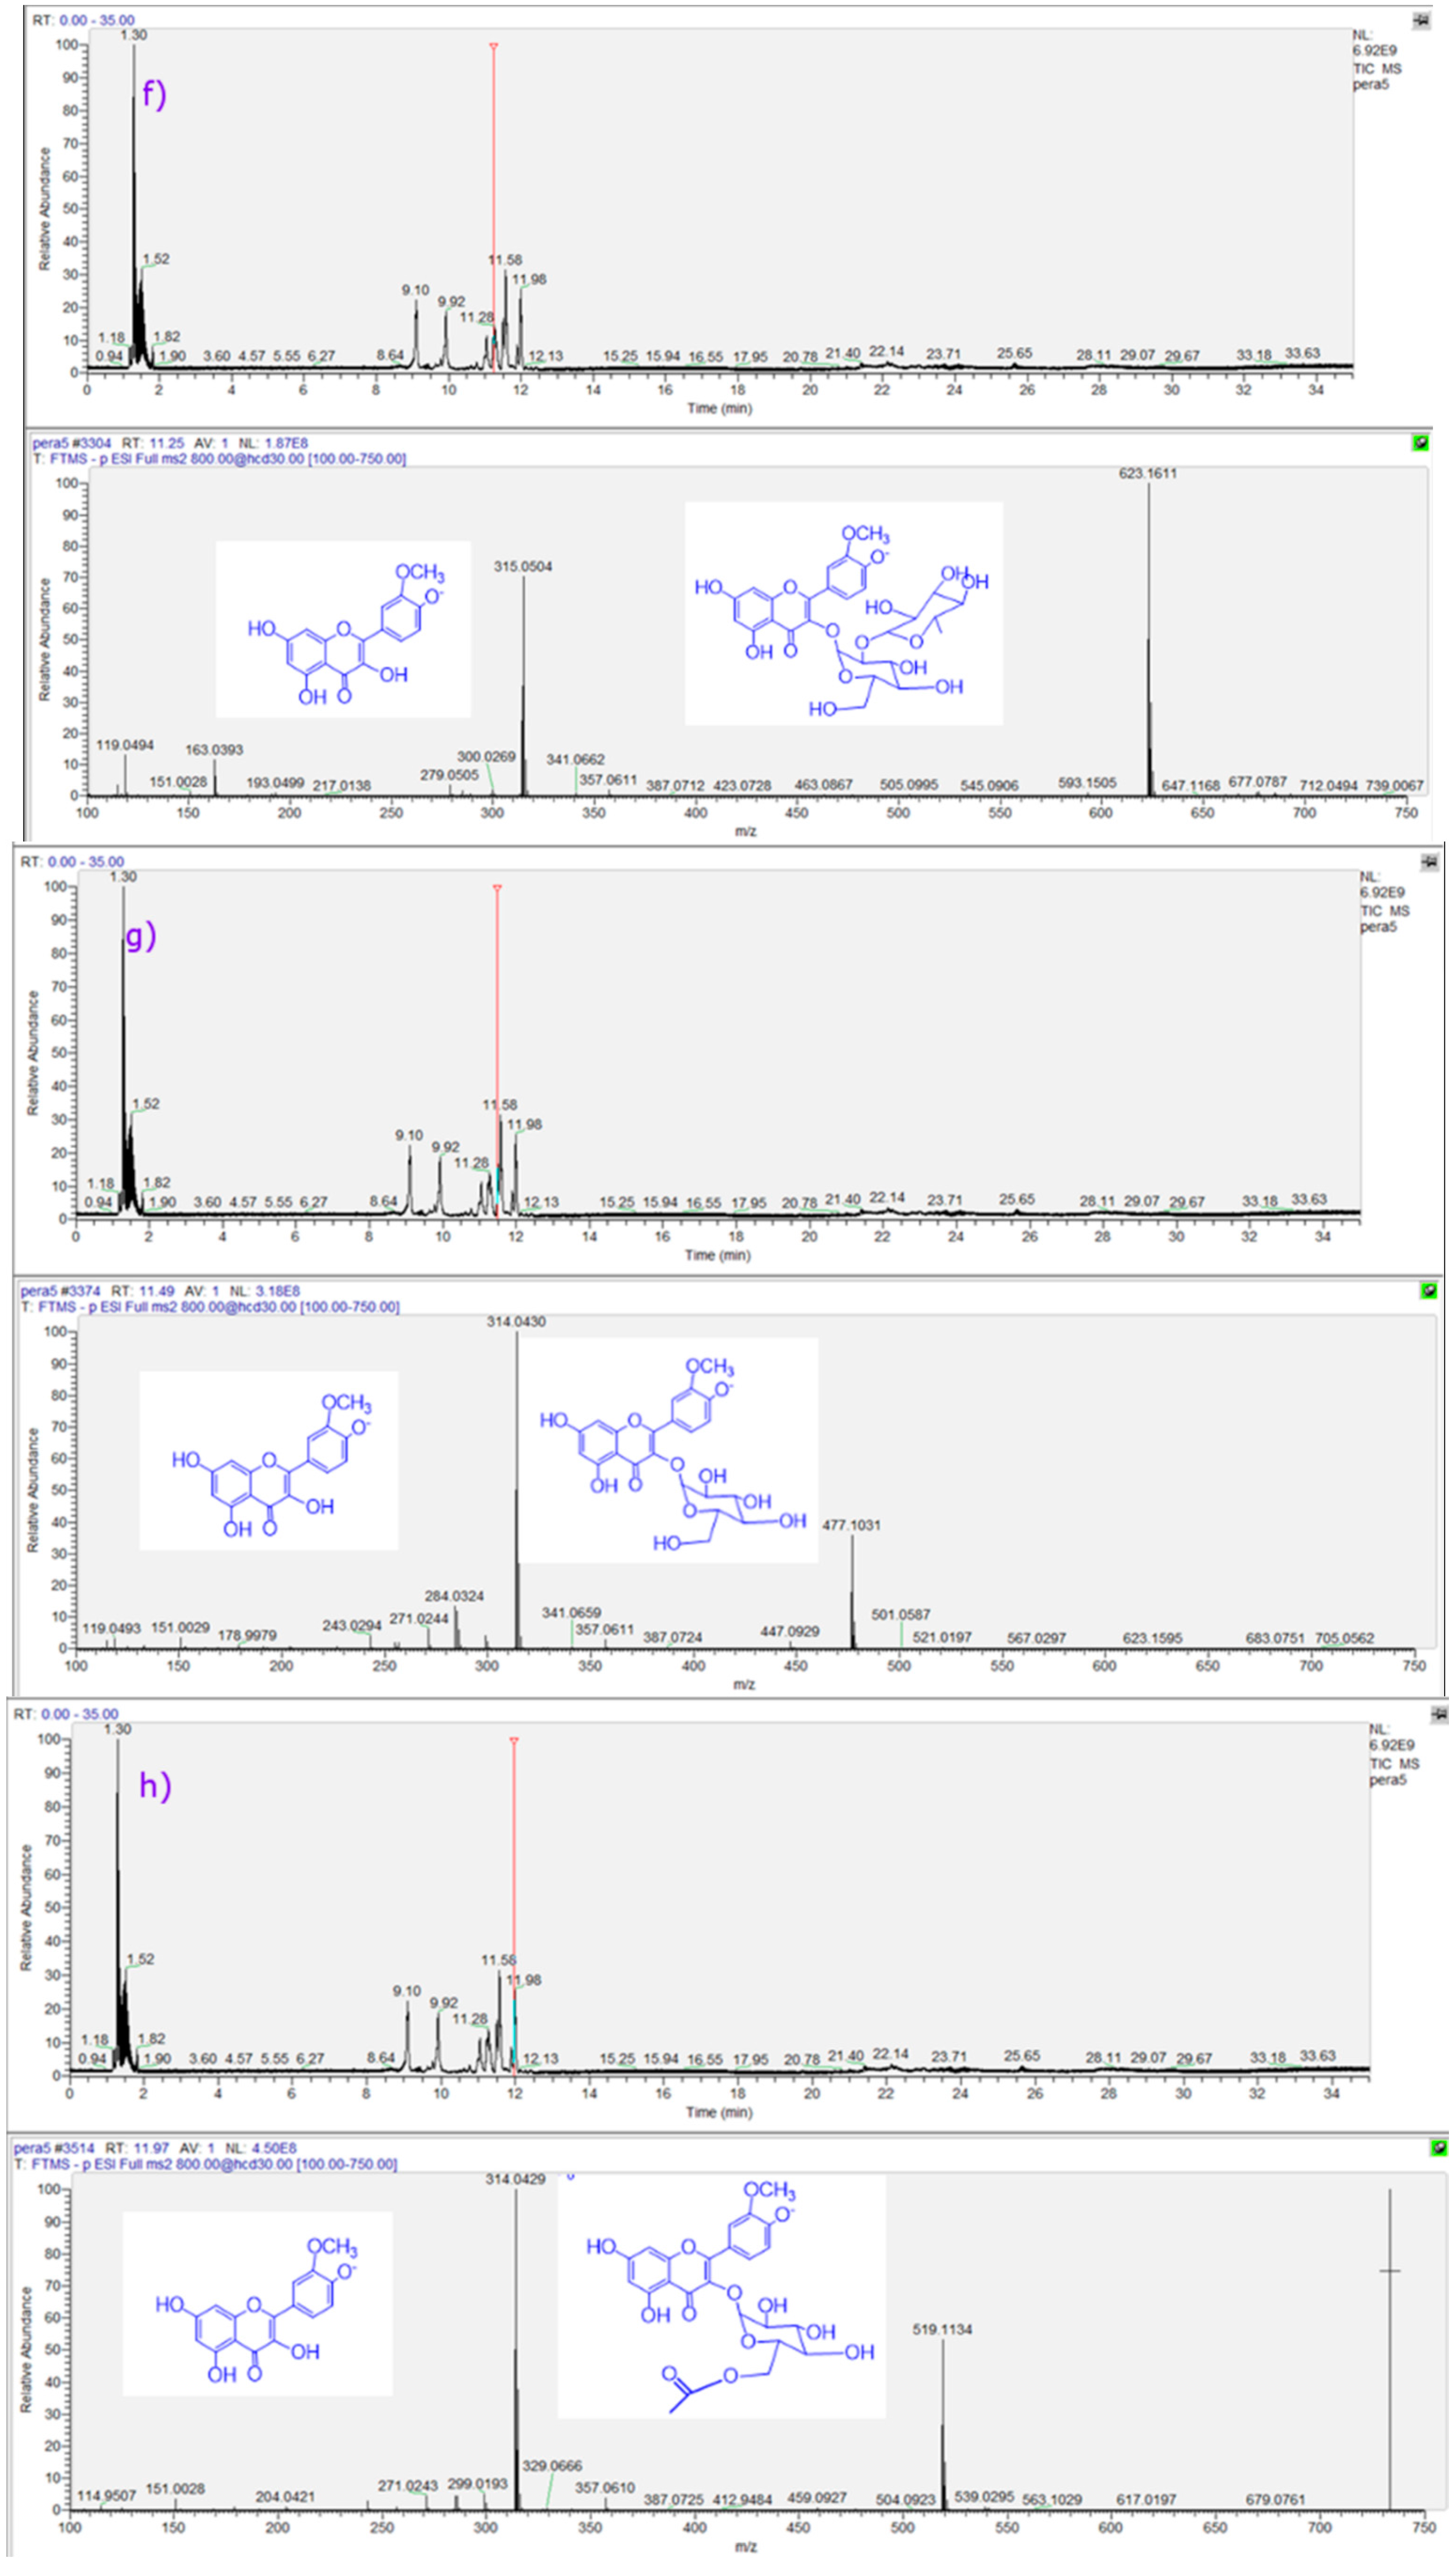
| 13 | 254, 354 | Isorhamnetin-3-O-2′ rhamnosyl)glucose | C28H31O16− | 11.22 | 623.1618 | 623.1617 | −0.5079 | 315.0510 (Isorhamnetin C16H11O7−) (f) |
| 14 | 279 | A-type procyanidin dimer | C30H23O12− | 11.24 | 575.11950 | 575.1191 | 1.1863 | |
| 15 | p-coumaroyl malate | C13H11O7− | 11.26 | 279,0510 | 279.0507 | 2.8349 | ||
| 16 | 254, 354 | Isorhamnetin-3-O-galactose | C22H21O12− | 11.49 | 477.1038 | 477.1031 | 0.7041 | (g) |
| 17 | 236, 329 | di-O-caffeoylquinic acid isomer (di-CQA) | C25H23O12− | 11.56 | 515.1195 | 515.1189 | 0.9590 | |
| 18 | 254, 354 | Isorhamnetin-3-O-glucose * | C22H21O12− | 11.57 | 477.1038 | 477.1034 | 1.2798 | |
| 19 | 236, 329 | di-O-caffeoylquinic acid isomer (di-CQA) | C25H23O12− | 11.74 | 515.1195 | 515.1191 | 1.4329 | |
| 20 | 254, 354 | isorhamnetin-3-O-(6′-acetyl)-glucoside | C24H23O13− | 11.90 | 519.1144 | 519.1138 | 0.9891 | |
| 21 | 254, 354 | isorhamnetin-3-O-(6′-acetyl)-galactoside | C24H23O13− | 11.97 | 519.1144 | 519.1141 | 1.4594 | (h) |
| 22 | 254, 350 | 3-acetyl-3,5,4′tryhydroxy-7methoxy-flavone | C18H13O7− | 12.43 | 341.0667 | 341.0670 | −0.879 | |
| 23 | A-type procyanidin dimer | C30H23O12− | 12.60 | 575.11950 | 575.1188 | 0.7528 | ||
| 24 | 240, 312 | 3-p-Coumaroylquinic acid | C18H9O7− | 13.29 | 337.09289 | 337.0356 | 3.9608 | |
| 25 | 254, 347 | Kaempferol-3-O-glucose | C21H19O11− | 13.31 | 447.0721 | 447.0724 | 0.671 |
2.2.1. Phenolic Acids

2.2.2. Flavonoids
2.2.3. Procyanidins
3. Experimental Section
3.1. Chemicals and Plant Material
3.2. Sample Preparation
3.3. Instruments
3.4. LC Parameters
3.5. MS Parameters
3.5.1. Ferric Reducing Antioxidant Power
3.5.2. Superoxide Anion Scavenging Activity
3.5.3. Polyphenol and Flavonoids Contents
3.6. Statistical Analysis
4. Conclusions
Acknowledgments
Author Contributions
Conflicts of Interest
References
- Mattoli, L.; Cangi, F.; Ghiara, C.; Burico, M.; Maidecchi, A.; Bianchi, E.; Ragazzi, E.; Bellotto, L.; Seraglia, R.; Traldi, P. A metabolite fingerprinting for the characterization of commercial botanical dietary supplements. Metabolomics 2011, 7, 437–445. [Google Scholar] [CrossRef]
- Aliferis, K.A.; Chrysayi-Tokousbalides, M. Metabolomics in pesticide research and development: Review and future perspectives. Metabolomics 2011, 7, 35–53. [Google Scholar] [CrossRef]
- Kang, H.J.; Yang, H.J.; Kim, M.J.; Han, E.S.; Kim, H.J.; Kwon, D.Y. Metabolomic analysis of meju during fermentation by ultra-performance liquid chromatography-quadrupole-time of flight mass spectrometry (UPLC-Q-TOF MS). Food Chem. 2011, 127, 1056–1064. [Google Scholar] [CrossRef] [PubMed]
- Hao, C.; Zhao, X.; Yang, P. GC-MS and HPLC-MS analysis of bioactive pharmaceuticals and personal-care products in environmental matrices. TrAC 2007, 26, 569–580. [Google Scholar] [CrossRef]
- Steinmann, D.; Ganzera, M. Recent advances on HPLC/MS in medicinal plant analysis. J. Pharm. Biomed. Anal. 2011, 55, 744–757. [Google Scholar] [CrossRef] [PubMed]
- Maoka, T. Recent progress in structural studies of carotenoids in animals and plants. Arch. Biochem. Biophys. 2009, 483, 191–195. [Google Scholar] [CrossRef] [PubMed]
- Barnes, J.S.; Nguyen, H.P.; Shen, S.; Schug, K.A. General method for extraction of blueberry anthocyanins and identification using high performance liquid chromatography-electrospray ionization-ion trap-time of flight-mass spectrometry. J. Chromatogr. A 2009, 1216, 4728–4735. [Google Scholar] [CrossRef] [PubMed]
- Fischer, U.A.; Carle, R.; Kammerer, D.R. Identification and quantification of phenolic compounds from pomegranate (Punica granatum L.) peel, mesocarp, aril and differently produced juices by HPLC-DAD-ESI/MS(n). Food Chem. 2011, 127, 807–821. [Google Scholar] [CrossRef] [PubMed]
- He, D.X.; Shan, Y.; Wu, Y.H.; Liu, G.Z.; Chen, B.; Yao, S.Z. Simultaneous determination of flavanones, hydroxycinnamic acids and alkaloids in citrus fruits by HPLC-DAD-ESI/MS. Food Chem. 2011, 127, 880–885. [Google Scholar] [CrossRef] [PubMed]
- Hiba, A.; Carine, A.; Haifa, A.R.; Ryszard, L.; Farouk, J. Monitoring of twenty-two sulfonamides in edible tissues: Investigation of new metabolites and their potential toxicity. Food Chem. 2016, 192, 212–227. [Google Scholar] [CrossRef] [PubMed]
- Verplanken, K.; Wauters, J.; Vercruysse, V.; Aluwe, M.; Vanhaecke, L. Development and validation of a UHPLC-HR-Orbitrap-MS method for the simultaneous determination of androstenone, skatole and indole in porcine meat and meat products. Food Chem. 2016, 190, 944–951. [Google Scholar] [CrossRef] [PubMed]
- Simirgiotis, M.J.; Ramirez, J.E.; Schmeda Hirschmann, G.; Kennelly, E.J. Bioactive coumarins and HPLC-PDA-ESI-ToF-MS metabolic profiling of edible queule fruits (Gomortega keule), an endangered endemic Chilean species. Food Res. Int. 2013, 54, 532–543. [Google Scholar] [CrossRef]
- Simirgiotis, M.J.; Borquez, J.; Schmeda-Hirschmann, G. Antioxidant capacity, polyphenolic content and tandem HPLC-DAD-ESI/MS profiling of phenolic compounds from the South American berries Luma apiculata and L. chequen. Food Chem. 2013, 139, 289–299. [Google Scholar] [CrossRef] [PubMed]
- Simirgiotis, M.J. Antioxidant Capacity and HPLC-DAD-MS Profiling of Chilean Peumo (Cryptocarya alba) Fruits and Comparison with German Peumo (Crataegus monogyna) from Southern Chile. Molecules 2013, 18, 2061–2080. [Google Scholar] [CrossRef] [PubMed]
- Bórquez, J.; Kennelly, E.J.; Simirgiotis, M.J. Activity guided isolation of isoflavones and hyphenated HPLC-PDA-ESI-ToF-MS metabolome profiling of Azorella madreporica Clos. from northern Chile. Food Res. Int. 2013, 52, 288–297. [Google Scholar] [CrossRef]
- Brito, A.; Ramirez, J.E.; Areche, C.; Sepúlveda, B.; Simirgiotis, M.J. HPLC-UV-MS profiles of phenolic compounds and antioxidant activity of fruits from three Citrus species consumed in northern Chile. Molecules 2014, 19, 17400–17421. [Google Scholar] [CrossRef] [PubMed]
- Plazas, M.; López-Gresa, M.P.; Vilanova, S.; Torres, C.; Hurtado, M.; Gramazio, P.; Andújar, I.; Herráiz, F.; Bellés, J.M.; Prohens, J. Diversity and relationships in key traits for functional and apparent quality in a collection of eggplant: Fruit phenolics content, antioxidant activity, polyphenol oxidase activity, and browning. J. Agric. Food Chem. 2013, 1, 8871–8879. [Google Scholar] [CrossRef] [PubMed]
- Li, X.; Wang, T.; Zhou, B.; Gao, W.; Cao, J.; Huang, L. Chemical composition and antioxidant and anti-inflammatory potential of peels and flesh from 10 different pear varieties (Pyrus spp.). Food Chem. 2014, 152, 531–538. [Google Scholar] [CrossRef] [PubMed]
- Manzoor, M.; Anwar, F.; Bhatti, I.A.; Jamil, A. Variation of phenolics and antioxidant activity between peel and pulp parts of pear (Pyrus communis L.) fruit. Pak. J. Bot. 2013, 45, 1521–1525. [Google Scholar]
- Sarkar, D.; Ankolekar, C.; Pinto, M.; Shetty, K. Dietary functional benefits of Bartlett and Starkrimson pears for potential management of hyperglycemia, hypertension and ulcer bacteria Helicobacter pylori while supporting beneficial probiotic bacterial response. Food Res. Int. 2015, 69, 80–90. [Google Scholar] [CrossRef]
- Ramirez, J.E.; Zambrano, R.; Sepúlveda, B.; Simirgiotis, M.J. Antioxidant properties and hyphenated HPLC-PDA-MS profiling of Chilean Pica mango fruits (Mangifera indica L. Cv. piqueño). Molecules 2013, 19, 438–458. [Google Scholar] [CrossRef] [PubMed]
- Li, X.; Li, X.; Wang, T.; Gao, W. Chapter 24—Nutritional Composition of Pear Cultivars (Pyrus spp.). In Nutritional Composition of Fruit Cultivars; Preedy, V.R., Simmonds, M.S.J., Eds.; Academic Press: San Diego, CA, USA, 2016; pp. 573–608. [Google Scholar]
- Kolniak-Ostek, J.; Oszmiański, J. Characterization of phenolic compounds in different anatomical pear (Pyrus communis L.) parts by ultra-performance liquid chromatography photodiode detector-quadrupole/time of flight-mass spectrometry (UPLC-PDA-Q/TOF-MS). Int. J. Mass Spec. 2015, 392, 154–163. [Google Scholar] [CrossRef]
- Simirgiotis, M.J.; Silva, M.; Becerra, J.; Schmeda-Hirschmann, G. Direct characterisation of phenolic antioxidants in infusions from four Mapuche medicinal plants by liquid chromatography with diode array detection (HPLC-DAD) and electrospray ionisation tandem mass spectrometry (HPLC-ESI-MS). Food Chem. 2012, 131, 318–327. [Google Scholar] [CrossRef]
- Abu-Reidah, I.M.; Ali-Shtayeh, M.S.; Jamous, R.M.; Arráez-Román, D.; Segura-Carretero, A. HPLC-DAD-ESI-MS/MS screening of bioactive components from Rhus coriaria L. (Sumac) fruits. Food Chem. 2015, 166, 179–191. [Google Scholar] [CrossRef] [PubMed]
- Schieber, A.; Keller, P.; Streker, P.; Klaiber, I.; Carle, R. Detection of isorhamnetin glycosides in extracts of apples (Malus domestica cv. “Brettacher”) by HPLC-PDA and HPLC-APCI-MS/MS. Phytochem. Anal. 2002, 13, 87–94. [Google Scholar] [CrossRef] [PubMed]
- Simirgiotis, M.J.; Theoduloz, C.; Caligari, P.D.S.; Schmeda-Hirschmann, G. Comparison of phenolic composition and antioxidant properties of two native Chilean and one domestic strawberry genotypes. Food Chem. 2009, 113, 377–385. [Google Scholar] [CrossRef]
- Simirgiotis, M.J.; Caligari, P.D.S.; Schmeda-Hirschmann, G. Identification of phenolic compounds from the fruits of the mountain papaya Vasconcellea pubescens A. DC. grown in Chile by liquid chromatography-UV detection-mass spectrometry. Food Chem. 2009, 115, 775–784. [Google Scholar] [CrossRef]
- Stoggl, W.M.; Huck, C.W.; Bonn, G.N.K. Structural elucidation of catechin and epicatechin in sorrel leaf extracts using liquid-chromatography coupled to diode array-, fluorescence-, and mass spectrometric detection. J. Sep. Sci. 2004, 27, 524–528. [Google Scholar] [CrossRef] [PubMed]
- Sun, J.; Liang, F.; Bin, Y.; Li, P.; Duan, C. Screening non-colored phenolics in red wines using liquid chromatography/ultraviolet and mass spectrometry/mass spectrometry libraries. Molecules 2007, 12, 679–693. [Google Scholar] [CrossRef] [PubMed]
- Markowicz Bastos, D.H.; Saldanha, L.A.; Catharino, R.R.; Sawaya, A.; Cunha, I.B.; Carvalho, P.O.; Eberlin, M.N. Phenolic antioxidants identified by ESI-MS from Yerba Maté (Ilex paraguariensis) and green tea (Camelia sinensis) extracts. Molecules 2007, 12, 423–432. [Google Scholar] [CrossRef]
- Benzie, I.F.F.; Strain, J.J. The ferric reducing ability of plasma (FRAP) as a measure of “Antioxidant Power”: The FRAP assay. Anal. Biochem. 1996, 239, 70–76. [Google Scholar] [CrossRef] [PubMed]
- Brito, A.; Areche, C.; Sepúlveda, B.; Kennelly, E.J.; Simirgiotis, M.J. Anthocyanin characterization, total phenolic quantification and antioxidant features of some chilean edible berry extracts. Molecules 2014, 19, 10936–10955. [Google Scholar] [CrossRef] [PubMed]
- Simirgiotis, M.J.; Adachi, S.; To, S.; Yang, H.; Reynertson, K.A.; Basile, M.J.; Gil, R.R.; Weinstein, I.B.; Kennelly, E.J. Cytotoxic chalcones and antioxidants from the fruits of Syzygium samarangense (Wax Jambu). Food Chem. 2008, 107, 813–819. [Google Scholar] [CrossRef] [PubMed]
- Sample Availability: Samples of the compounds and extracts are available from authors.
© 2016 by the authors. Licensee MDPI, Basel, Switzerland. This article is an open access article distributed under the terms and conditions of the Creative Commons by Attribution (CC-BY) license ( http://creativecommons.org/licenses/by/4.0/).
Share and Cite
Simirgiotis, M.J.; Quispe, C.; Bórquez, J.; Areche, C.; Sepúlveda, B. Fast Detection of Phenolic Compounds in Extracts of Easter Pears (Pyrus communis) from the Atacama Desert by Ultrahigh-Performance Liquid Chromatography and Mass Spectrometry (UHPLC–Q/Orbitrap/MS/MS). Molecules 2016, 21, 92. https://doi.org/10.3390/molecules21010092
Simirgiotis MJ, Quispe C, Bórquez J, Areche C, Sepúlveda B. Fast Detection of Phenolic Compounds in Extracts of Easter Pears (Pyrus communis) from the Atacama Desert by Ultrahigh-Performance Liquid Chromatography and Mass Spectrometry (UHPLC–Q/Orbitrap/MS/MS). Molecules. 2016; 21(1):92. https://doi.org/10.3390/molecules21010092
Chicago/Turabian StyleSimirgiotis, Mario J., Cristina Quispe, Jorge Bórquez, Carlos Areche, and Beatriz Sepúlveda. 2016. "Fast Detection of Phenolic Compounds in Extracts of Easter Pears (Pyrus communis) from the Atacama Desert by Ultrahigh-Performance Liquid Chromatography and Mass Spectrometry (UHPLC–Q/Orbitrap/MS/MS)" Molecules 21, no. 1: 92. https://doi.org/10.3390/molecules21010092
APA StyleSimirgiotis, M. J., Quispe, C., Bórquez, J., Areche, C., & Sepúlveda, B. (2016). Fast Detection of Phenolic Compounds in Extracts of Easter Pears (Pyrus communis) from the Atacama Desert by Ultrahigh-Performance Liquid Chromatography and Mass Spectrometry (UHPLC–Q/Orbitrap/MS/MS). Molecules, 21(1), 92. https://doi.org/10.3390/molecules21010092