
Chemical Composition Analysis, Antimicrobial Activity and Cytotoxicity Screening of Moss Extracts (Moss Phytochemistry)

Abstract
:1. Introduction
2. Results and Discussion

| Species | Code | Growth Conditions |
|---|---|---|
| Aulacomnium palustre | AP | Edges of bogs and humid areas; forms homogenous coverage of moss |
| Climacium dendroides | CD | Deciduous forest, humid, shadowy areas |
| Dicranum polysetum | DP | Deciduous forests |
| Hylocomium splendens | HS | Deciduous forests with poor soil; commonly found together with Pleurozium schreberi |
| Pleurozium schreberi | PS | Deciduous and coniferous forests, heaths with poor soil; commonly found together with Hylocomium splendens |
| Polytrichum commune | PC | Coniferous forests, humid habitats; sometimes found together with Sphagnum girgensohnii |
| Polytrichum juniperum | PJ | Coniferous forests, raised and transitional bogs, near decaying wood or tree bases |
| Ptilium crista-castrensis | PCC | Mixed forests, sunny and moderately humid areas |
| Rhytidiadelphus triquetrus | RT | Mixed forests, near tree bases |
| Sphagnum fallax | SF | Middle of bogs, bog pools |
| Sphagnum magellanicum | SM | Bogs with acidic soil, bog pools or near them |
| Sphagnum rubellum | SR | Middle of bogs, bog pools and other very humid areas |
| Sphagnum tenellum | ST | Edges of bogs, bogs, humid areas |
| Species Code | Total Polyphenol Content, GE | Total Carbohydrates, GLE | Radical Scavenging Activity, GE | Extraction Yield *, mg | Extraction Yield **, mg |
|---|---|---|---|---|---|
| AP | 267.5 ± 13.1 | 10.6 ± 0.4 | 39.0 ± 1.9 | 114.2 ± 5.7 | 259 ± 12.8 |
| CD | 272.1 ± 14.3 | 7.6 ± 0.3 | 42.3 ± 2.8 | 98.6 ± 4.7 | 412 ± 22.7 |
| DP | 399.2 ± 19.5 | 8.4 ± 0.3 | 16.4 ± 0.8 | 133.5 ± 6.7 | 482 ± 24.2 |
| HS | 298.4 ± 14.6 | 6.9 ± 0.3 | 59.3 ± 3.1 | 102.6 ± 5.1 | 443 ± 23.2 |
| PS | 275.6 ± 13.4 | 11.4 ± 0.5 | 15.6 ± 0.8 | 145.2 ± 7.3 | 561 ± 27.9 |
| PC | 800.7 ± 39.1 | 12.1 ± 0.5 | 12.6 ± 0.6 | 154.8 ± 7.7 | 513 ± 26.1 |
| PJ | 416.2 ± 20.2 | 5.6 ± 0.2 | 24.1 ± 1.2 | 88.5 ± 4.4 | 510 ± 26.1 |
| PCC | 237.9 ± 11.7 | 9.7 ± 0.3 | 19.6 ± 1.0 | 145.5 ± 7.3 | 464 ± 23.9 |
| RT | 379.1 ± 18.5 | 15.3 ± 0.7 | 11.3 ± 0.5 | 144.8 ± 7.2 | 451 ± 23.5 |
| SF | 783.2 ± 38.1 | 8.9 ± 0.4 | 17.6 ± 0.9 | 142.5 ± 7.1 | 213 ± 10.1 |
| SM | 370.6 ± 18.1 | 6.6 ± 0.3 | 18.2 ± 0.9 | 140.6 ± 7.0 | 378 ± 18.4 |
| SR | 345.7 ± 16.7 | 10.3 ± 0.4 | 16.3 ± 0.8 | 65.3 ± 3.3 | 181 ± 9.8 |
| ST | 280.1 ± 13.7 | 7.9 ± 0.3 | 14.9 ± 0.7 | 149.3 ± 7.4 | 240 ± 11.6 |
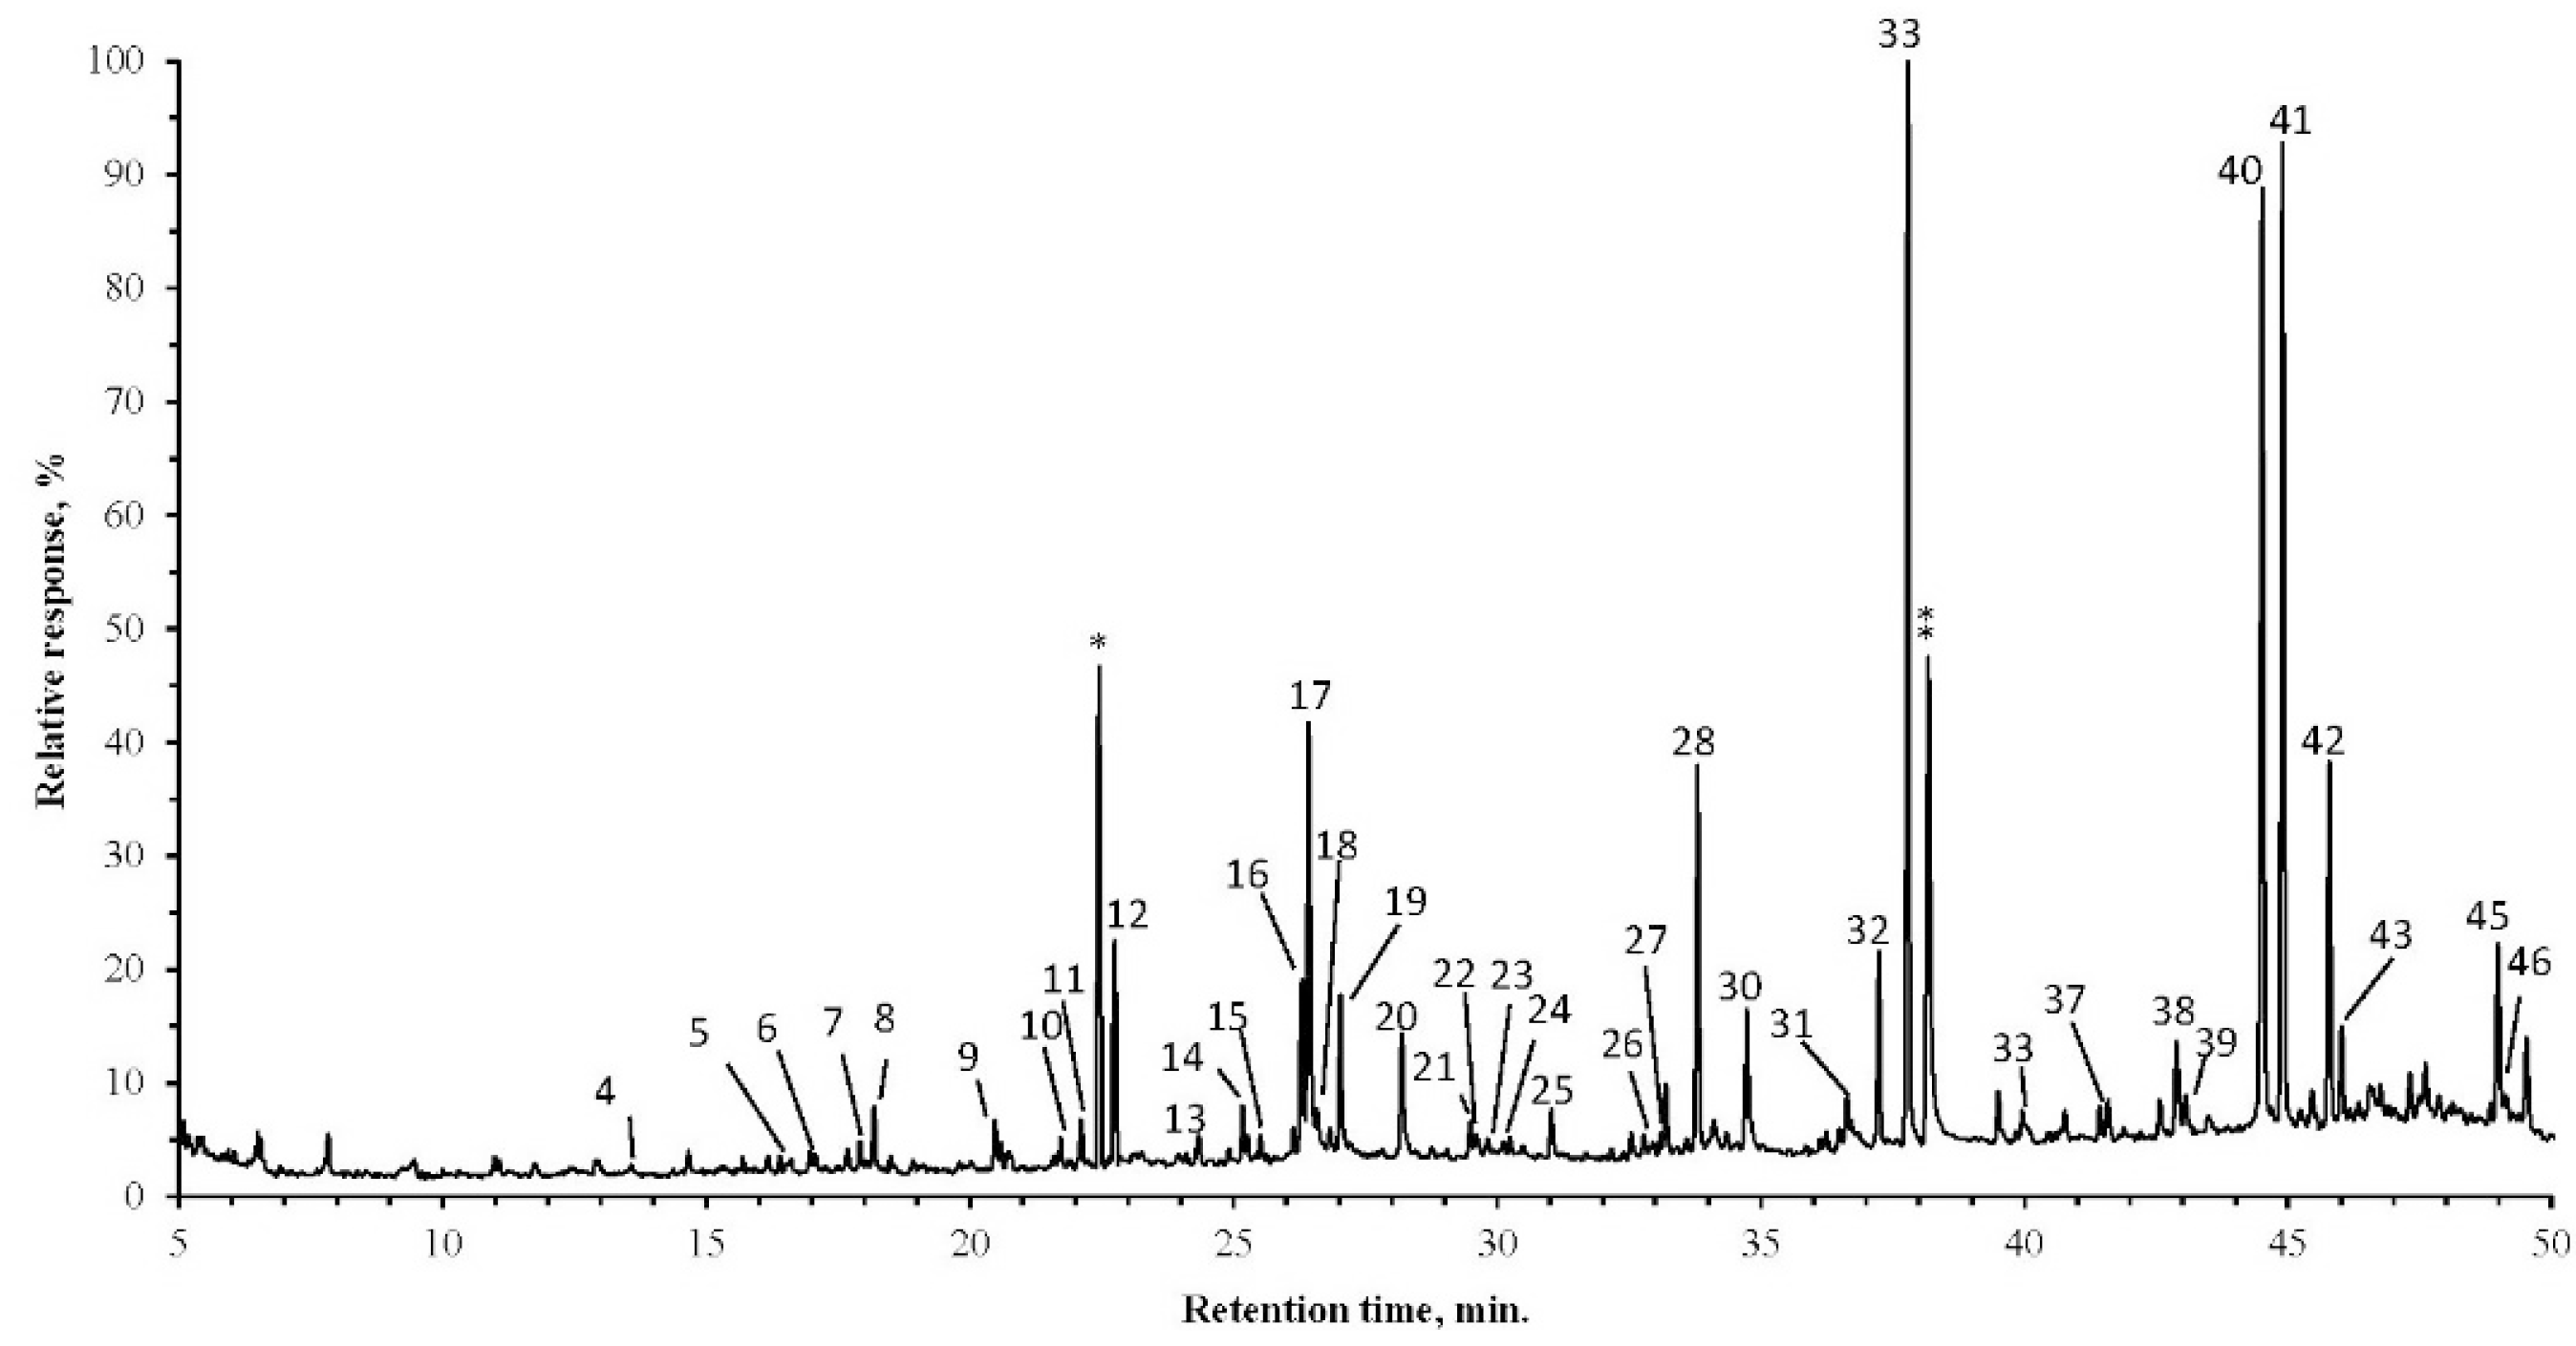
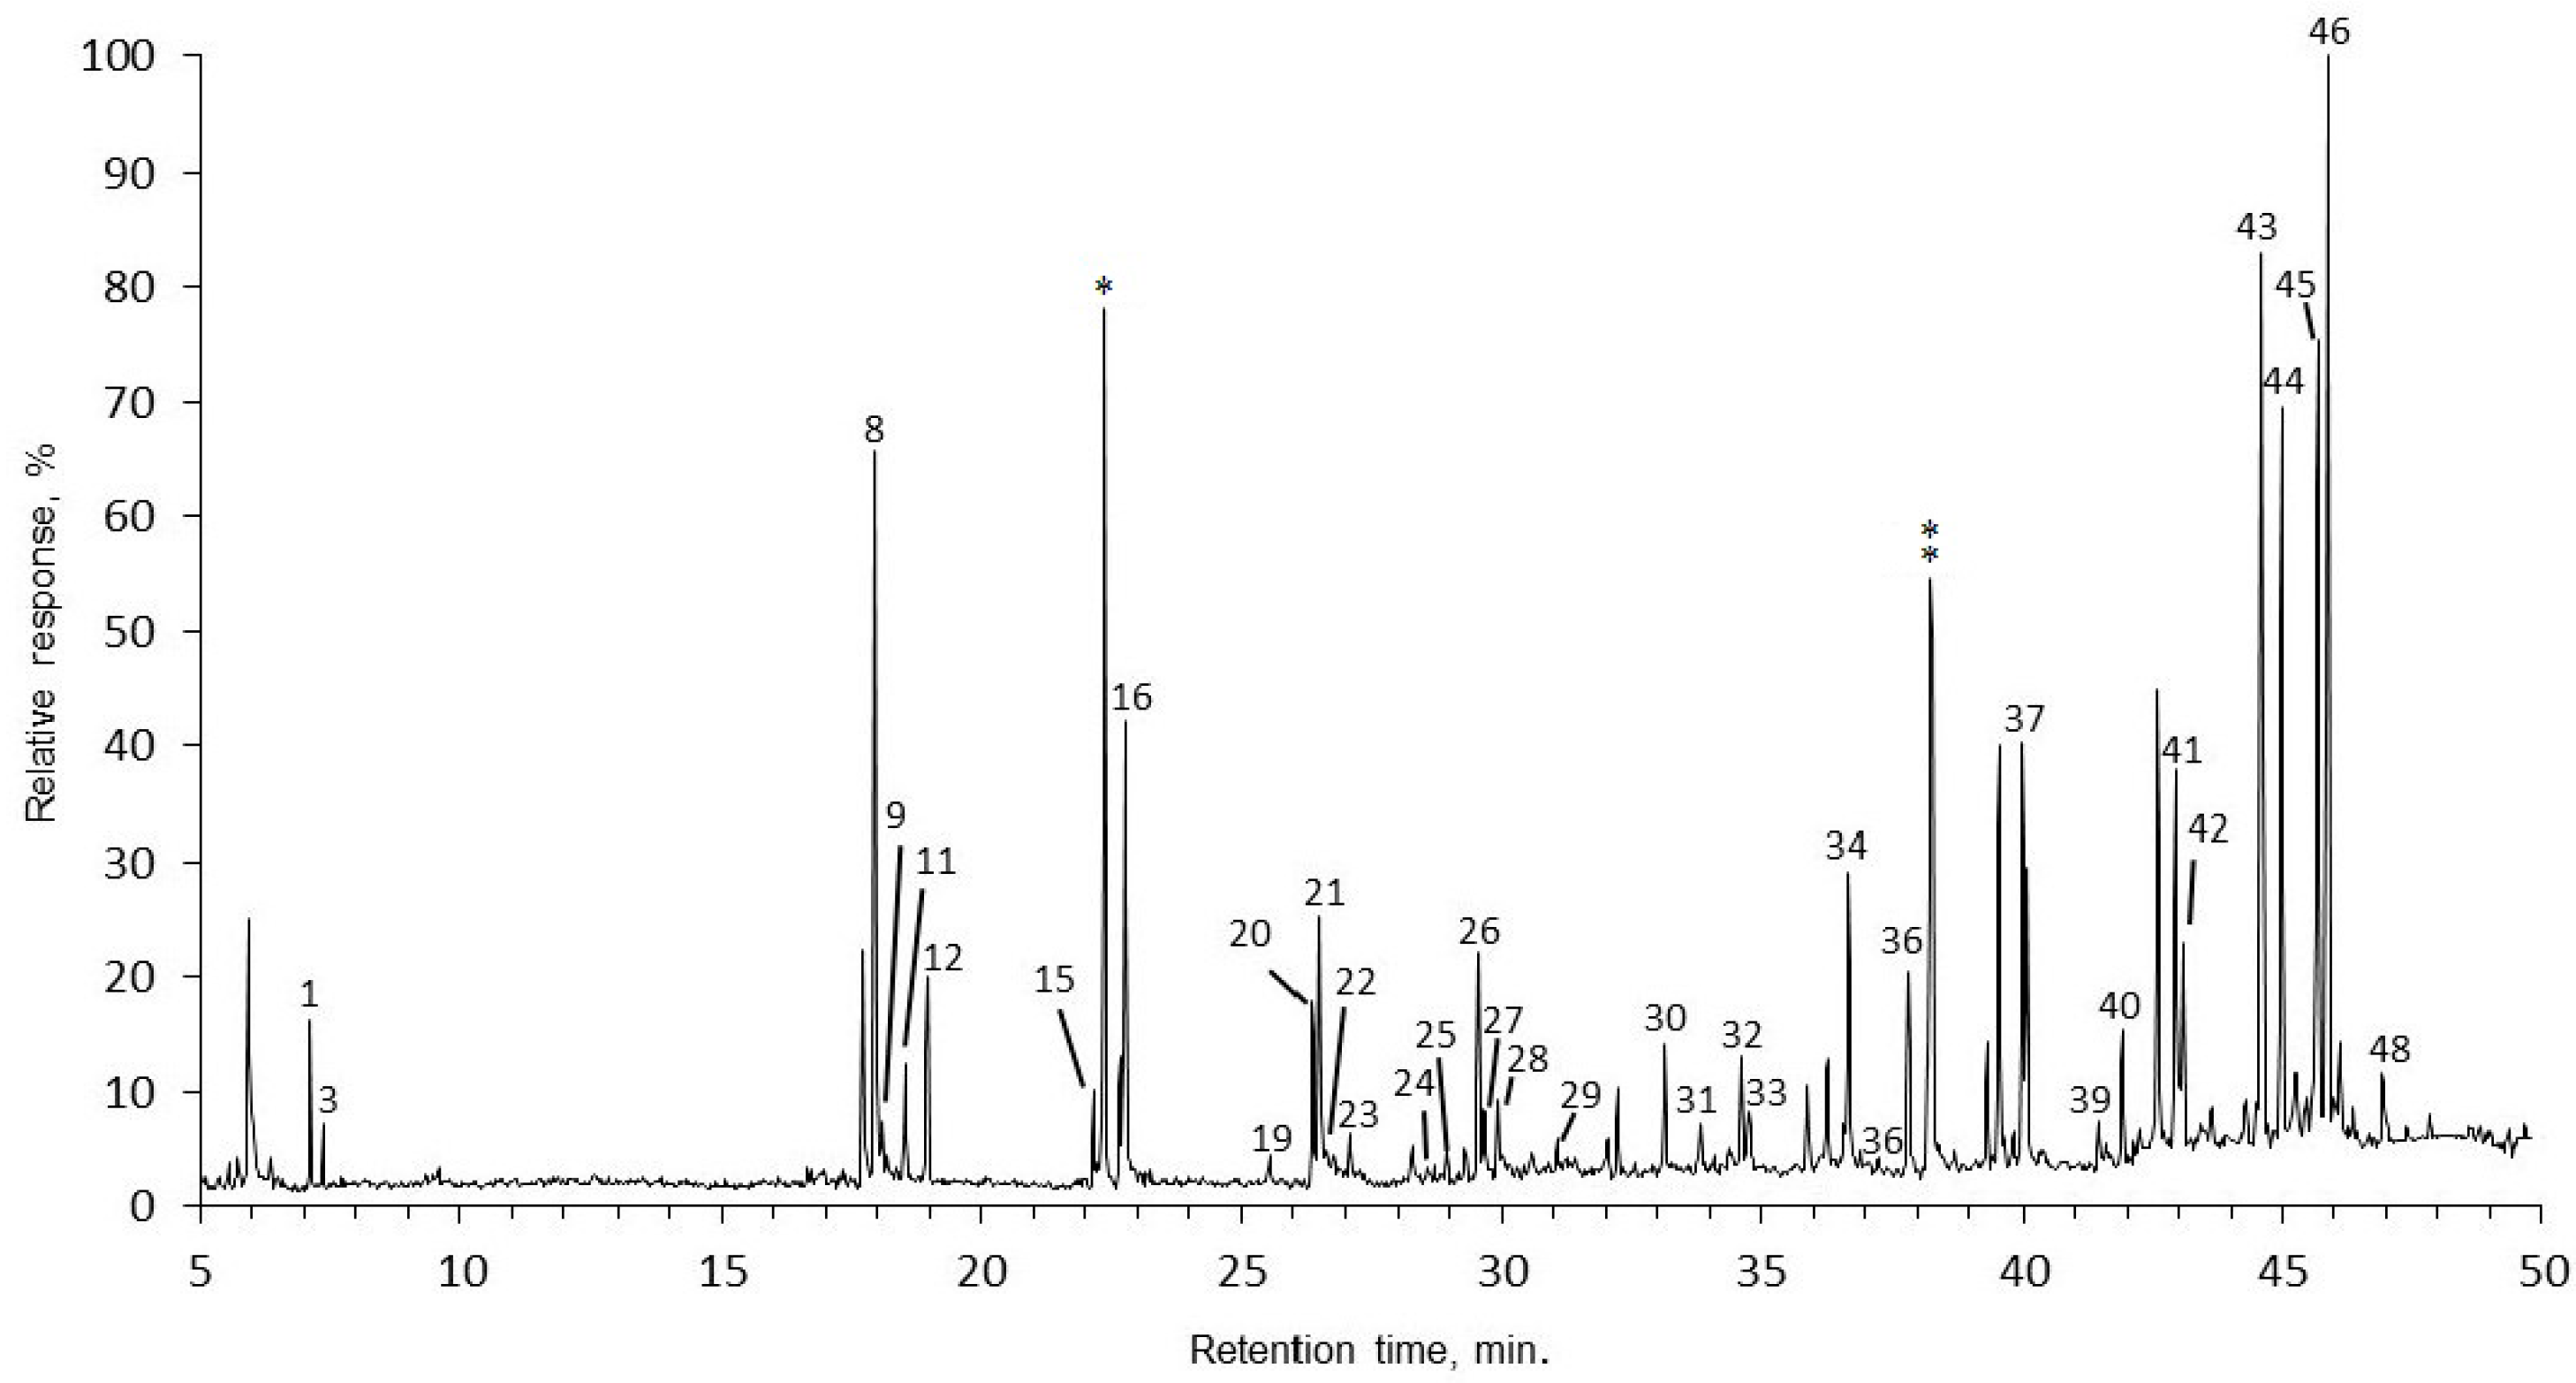
2.1. GC/MS Analysis of the Moss Chloroform Extract

| No. * | RT ** | RIC *** | Components | Rhytidiadelphus triquetrus | Polytrichum commune |
|---|---|---|---|---|---|
| 1. | 7.11 | 1289 | 2,4-Decadienal | 19.0 ± 0.5 | 2.5 ± 0.5 |
| 2. | 7.14 | 1306 | Succinic acid | 0.8 ± 0.1 | ND |
| 3. | 7.37 | 1351 | Nonanoic acid | 7.4 ± 0.2 | 1.2 ± 0.2 |
| 5. | 10.03 | 1481 | Malic acid | 0.6 ± 0.2 | ND |
| 6. | 13.59 | 1645 | Dodecanoic acid | 0.8 ± 0.1 | 3.3 ± 0.1 |
| 7. | 16.42 | 1784 | 2-Methylfructofuranoside | 0.6 ± 0.1 | 2.8 ± 0.1 |
| 8. | 16.97 | 1811 | Azelaic acid | 0.3 ± 0.1 | 3.5 ± 0.1 |
| 9. | 17.96 | 1844 | Neophytadiene | 123.9 ± 1.5 | 5.6 ± 0.2 |
| 10. | 18.09 | 1846 | Hexahydrofarnesyl acetone | 5.3 ± 0.2 | 1.3 ± 0.1 |
| 11. | 18.20 | 1852 | Tetradecanoic acid | 2.7 ± 0.2 | 11.1 ± 0.2 |
| 12. | 18.53 | 1862 | Phyta-1,3(Z)-diene | 16.0 ± 0.5 | 1.7 ± 0.1 |
| 13. | 18.97 | 1877 | Phyta-1,3(E)-diene | 34.4 ± 0.5 | 1.2 ± 0.1 |
| 14. | 20.47 | 1940 | Pentadecanoic acid | 0.3 ± 0.1 | 8.7 ± 0.5 |
| 15. | 21.73 | 2000 | Eicosane | 0.5 ± 0.1 | 5.6 ± 0.2 |
| 16. | 22.20 | 2009 | 9-Hexadecenoate + 7,10,13-Hexadecatrienoic acid | 4.6 ± 0.3 | 8.9 ± 0.3 |
| 17. | 22.77 | 2040 | Hexadecanoic acid | 68.3 ± 1.7 | 2.6 ± 0.2 |
| 18. | 24.38 | 2109 | 9-Heptadecenoic acid | 0.4 ± 0.1 | 6.4 ± 0.2 |
| 19. | 25.17 | 2149 | 1-Octadecanol | 0.4 ± 0.1 | 8.6 ± 0.7 |
| 20. | 25.56 | 2165 | Phytol | 12.6 ± 0.6 | 5.3 ± 0.3 |
| 21. | 26.33 | 2201 | 9,12-Octadecadienoic acid (Z,Z)-, | 28.3 ± 1.6 | 31.2 ± 1.6 |
| 22. | 26.49 | 2207–2209 | 9-Octadecenoic acid + (3Z,6Z,9Z)-3,6,9-Octadecatrienoate | 46.7 ± 2.7 | 74.2 ± 3.2 |
| 23. | 26.62 | 2214 | 11-Octadecenoic acid | 3.2 ± 0.4 | 11.1 ± 0.5 |
| 24. | 27.06 | 2235 | Octadecanoic acid | 6.6 ± 0.3 | 25.5 ± 0.8 |
| 25. | 28.56 | 2295 | Pimaric acid + C23 | 3.3 ± 0.2 | 27.8 ± 1.6 |
| 26. | 28.92 | 2326 | Isopimaric acid | 6.2 ± 1.1 | ND |
| 27. | 29.54 | 2355 | cis-5,8,11,14-Eicosatetraenoic acid | 30.6 ± 1.3 | 7.5 ± 0.5 |
| 28. | 29.64 | 2361 | cis-5,8,11,14,17-Eicosapentaenoic acid | 8.8 ± 0.8 | 5.5 ± 0.3 |
| 29. | 29.93 | 2369 | Dehydroabietic acid | 18.4 ± 0.2 | 4.8 ± 0.4 |
| 31. | 31.06 | 2432 | Eicosanoic acid | 6.0 ± 0.3 | 7.9 ± 1.2 |
| 32. | 33.13 | 2546 | 1-Docosanol | 19.9 ± 1.3 | 28.7 ± 2.5 |
| 33. | 33.83 | 2580 | Hexadecanoic acid, 2,3-dihydroxypropyl ester | 12.2 ± 0.5 | 58.1 ± 3.4 |
| 34. | 34.60 | 2634 | Sucrose | 19.9 ± 1.6 | 1.1 ± 0.2 |
| 35. | 34.76 | 2635 | Docosanoic acid | 11.0 ± 0.7 | 28.7 ± 3.6 |
| 37. | 36.67 | 2746 | Tetracosan-1-ol | 62.8 ± 2.8 | 1.6 ± 0.2 |
| 38. | 37.26 | 2781 | Octadecanoic acid, 2,3-dihydroxypropyl ester | 3.3 ± 0.3 | 31.4 ± 3.1 |
| 39. | 37.83 | 2811 | Squalene | 39.7 ± 1.5 | 247.6 ± 5.3 |
| 40. | 39.98 | 2939 | Hexacosanol | 72.6 ± 2.3 | 8.4 ± 0.2 |
| 41. | 40.63 | 2989 | γ-Tocopherol | 1.4 ± 0.1 | ND |
| 42. | 41.45 | 3040 | Hexacosanoic acid | 6.8 ± 0.3 | 6.2 ± 0.9 |
| 43. | 41.91 | 3061 | Decanyl tetradecanoate | 24.4 ± 1.2 | 4.6 ± 0.6 |
| 44. | 42.95 | 3119 | (+)-α-Tocopherol + Cholesterol | 58.8 ± 4.2 | 55.8 ± 4.8 |
| 45. | 43.08 | 3131 | Octacosanol | 28.0 ± 2.2 | 10.2 ± 0.7 |
| 46. | 44.60 | 3229 | Campesterol | 195.2 ± 6.8 | 453.7 ± 4.3 |
| 47. | 44.99 | 3261 | Stigmasterol | 128.0 ± 7.2 | 408.8 ± 6.7 |
| 48. | 45.69 | 3321 | Diploptene | 147.3 ± 6.3 | ND |
| 49. | 45.87 | 3324 | β-Sitosterol | 180.7 ± 2.8 | 153.8 ± 5.3 |
| 50. | 46.02 | 3339 | Isofucosterol | 0.8 ± 0.1 | 44.6 ± 2.1 |
| 51. | 46.93 | 3386 | Cycloartenol | 11.4 ± 2.1 | ND |
| 53. | 49.06 | 3545 | Phytylhexadecanoate | ND | 6.8 ± 0.2 |
| Identified Substance | AP | CD | DP | HS | PCC | PJ | PS | SF | SM | SR | ST |
|---|---|---|---|---|---|---|---|---|---|---|---|
| Tetradecanoic acid | 14.9 | 4.9 | 16.9 | 14.7 | 13.5 | 0.4 | 28.6 | 4.2 | 3.1 | 63.2 | 12.8 |
| Pentadecanoic acid | 0.1 | 1.2 | 1.5 | 11.3 | 8.3 | 0.4 | 11.9 | 4.2 | 2.9 | 14.5 | 17.3 |
| 9-Hexadecenoic acid | ND | ND | ND | ND | ND | ND | 11.7 | ND | ND | ND | ND |
| N-Hexadecanoic acid | 103.0 | 127.3 | 93.1 | 224.4 | 104.0 | 109.8 | 148.5 | 176.8 | 122.3 | 91.6 | 272.5 |
| (Z)-3,7,11,15-Tetramethylhexadec-2-enoic acid | 0.6 | 1.9 | 0.4 | 1.0 | ND | ND | 58.0 | 12.3 | 2.0 | ND | 4.3 |
| Heptadecanoic acid | 0.3 | 1.1 | 13.4 | 3.3 | 9.8 | ND | 148.5 | 11.4 | 0.7 | 4.0 | 12.0 |
| 9,12-Octadecadienoic acid (Z,Z)- | 20.0 | 187.5 | 34.4 | 169.6 | 33.6 | 86.4 | 49.7 | 191.1 | 57.9 | 50.5 | 174.2 |
| 9,12,15-Octadecatrienoic acid | 104.4 | 223.0 | 70.8 | 416.2 | 75.4 | 230.9 | 108.9 | 241.1 | 85.0 | 80.5 | 219.9 |
| 11-Octadecenoic acid | 0.4 | 2.3 | 14.5 | 48.7 | 15.3 | 16.5 | 19.5 | 21.3 | 14.2 | 22.5 | 29.3 |
| Octadecanoic acid | 21.3 | 11.4 | 24.9 | 59.9 | 29.2 | 34.5 | 24.9 | 25.6 | 17.9 | 27.3 | 38.0 |
| 5,8,11,14-Eicosatetraenoic acid, (all-Z)- | 1.8 | 89.0 | 36.6 | 238.3 | 22.2 | 12.9 | 65.9 | 44.1 | 17.7 | 31.6 | 23.9 |
| 5,8,11,14,17-Eicosapentaenoic acid | 10.3 | 9.6 | 24.1 | 176.1 | 16.1 | 0.3 | 64.9 | 11.9 | 0.1 | 40.1 | 11.1 |
| 8,11,14-Eicosatrienoic acid | ND | 24.9 | 15.1 | 42.2 | 17.0 | 0.2 | 18.2 | 2.7 | 0.5 | ND | 10.4 |
| 11,14-Eicosadienoic acid | ND | 1.6 | ND | 21.1 | ND | 13.1 | 3.8 | 0.9 | 0.2 | 1.9 | 9.2 |
| 11-Eicosenoic acid | ND | ND | 14.1 | ND | 11.3 | 23.1 | 10.5 | 4.7 | 0.3 | ND | 20.1 |
| Eicosanoic acid | 16.2 | 7.3 | 24.1 | 43.9 | 15.9 | 50.1 | 18.2 | 4.7 | 1.5 | 10.5 | 33.2 |
| Docosanoic acid | 17.7 | 18.0 | 21.9 | 49.7 | 26.4 | 57.4 | 23.1 | 27.1 | 23.0 | 36.8 | 32.6 |
| Tricosanoic acid | 16.8 | ND | ND | ND | ND | 14.2 | ND | 11.6 | 14.9 | 12.1 | 15.2 |
| Pentacosanoic acid | 0.4 | 0.3 | ND | 55.6 | ND | 30.2 | 26.1 | 10.3 | 13.4 | 39.4 | 15.5 |
| Hexacosanoic acid | 1.0 | 5.5 | 58.7 | 69.7 | ND | 40.0 | 23.6 | 28.1 | 47.7 | 81.0 | 48.6 |
| Octacosanoic acid | 0.5 | 3.4 | 7.1 | 61.6 | 398.2 | 50.7 | 13.4 | 2.1 | 21.1 | 6.3 | 17.3 |
| 1-Monopalmitoylglycerol | 11.4 | 2.4 | 3.0 | 63.6 | 26.4 | 19.6 | 87.2 | 77.9 | 41.3 | 35.7 | 27.1 |
| Octadecanoic acid 2,3-dihydroxypropyl ester | 14.3 | 0.4 | 20.7 | 19.4 | 38.2 | 27.5 | 65.9 | 53.6 | 24.8 | 28.8 | 18.5 |
| Neophytadiene | 20.2 | 84.8 | 65.6 | 190.3 | 113.8 | 47.3 | 137.0 | 49.3 | 36.3 | 48.2 | 38.4 |
| Phyta-1,3(Z)diene | 1.0 | 10.1 | 5.0 | 20.4 | ND | 1.9 | 33.7 | 12.4 | 4.3 | 9.0 | 8.7 |
| Phyta-1,3(E)diene | 1.2 | 16.5 | 14.8 | 38.6 | ND | 1.3 | 54.5 | 18.4 | 7.5 | 12.7 | 11.1 |
| Phytol | 1.5 | 4.9 | 18.3 | 28.7 | 19.1 | 12.2 | 20.4 | 21.4 | 14.6 | 17.5 | 49.9 |
| Squalene | 174.5 | 42.9 | 64.7 | 117.6 | 43.6 | 206.3 | 111.3 | 14.1 | 19.7 | 37.3 | 25.7 |
| 1-Hexadecanol | ND | ND | 11.0 | ND | 12.0 | ND | ND | ND | 0.2 | ND | 1.0 |
| Hexadecane-1,2-diol | ND | ND | ND | 22.2 | ND | ND | ND | 2.5 | 0.8 | ND | ND |
| 1-Octadecanol | 0.2 | 1.4 | 2.1 | ND | 18.1 | 0.6 | 13.1 | 4.9 | 0.4 | ND | ND |
| 1-Docosanol | 0.3 | 10.0 | 27.7 | 22.9 | 23.9 | 14.0 | 10.8 | 12.8 | 0.9 | 18.7 | ND |
| 1-Tricosanol | ND | ND | ND | 19.4 | ND | 0.1 | 0.9 | ND | ND | 1.7 | ND |
| 1-Tetracosanol | 1.5 | 16.6 | 21.7 | 38.0 | 30.7 | 28.2 | 25.6 | 25.0 | 19.0 | 76.9 | 24.1 |
| 1-Hexacosanol | 20.4 | 28.1 | 49.8 | 55.6 | 83.0 | 3.6 | 26.1 | 34.0 | 30.2 | 117.0 | 44.1 |
| 1-Octacosanol | 20.9 | 37.6 | 54.0 | 57.2 | ND | 5.2 | 98.1 | 50.2 | 22.4 | 4.4 | 49.0 |
| 1-Triacontanol | 37.2 | ND | ND | ND | ND | 22.5 | 3.3 | ND | ND | 7.0 | 2.3 |
| Cholesterol + α-Tocopherol | 64.0 | 99.2 | 168.3 | 189.5 | 107.7 | 80.5 | 231.9 | 64.3 | 18.2 | 57.2 | 42.0 |
| Desmosterol | 1.0 | ND | 117.9 | 49.3 | 59.0 | ND | 102.3 | ND | ND | 63.2 | ND |
| Ergosterol | ND | 0.7 | 5.0 | 91.0 | 49.6 | 27.8 | 144.7 | 189.5 | 82.9 | 81.1 | 91.8 |
| Campesterol | 256.8 | 187.6 | 476.2 | 348.1 | 452.3 | 238.9 | 554.0 | 374.5 | 94.5 | 96.4 | 152.4 |
| Stigmasterol | 273.3 | 157.7 | 495.1 | 282.4 | 506.6 | 206.0 | 362.0 | 387.8 | 122.2 | 189.1 | 152.4 |
| Ergosta-5,8-dien-3β-ol | ND | ND | ND | 282.4 | ND | ND | 183.6 | 157.8 | 53.4 | ND | ND |
| Ergost-7-en-3-ol | ND | ND | ND | ND | 179.4 | ND | ND | 2.8 | 29.7 | ND | 18.3 |
| β-Sitosterol | 140.6 | 299.4 | 356.3 | 430.7 | 361.1 | 161.4 | 552.2 | 518.8 | 231.9 | 199.1 | 176.4 |
| Pimaric acid | 11.4 | ND | ND | ND | 26.6 | ND | ND | 12.2 | 0.3 | ND | 4.2 |
| Isopimaric acid | ND | ND | 16.3 | 22.9 | ND | ND | 24.8 | 15.7 | ND | 37.6 | 10.1 |
| Dehydroabietic acid | 12.5 | 14.6 | 16.9 | 61.5 | 20.0 | 13.0 | 71.0 | 11.9 | ND | 43.8 | 41.2 |
| Abietic acid | ND | 1.2 | ND | 25.9 | 5.1 | ND | 10.9 | ND | ND | ND | 3.8 |
| Heneicosane | 0.1 | 3.5 | ND | 19.3 | ND | ND | ND | 19.9 | 1.3 | 11.2 | 5.3 |
| Tricosane | 1.1 | 22.6 | 2.9 | 85.5 | 26.6 | ND | ND | 25.1 | 1.6 | 22.6 | 40.9 |
| Pentacosane | 11.1 | 20.9 | 13.4 | 53.7 | 29.7 | 13.9 | 23.0 | 22.4 | 13.8 | 19.9 | 17.9 |
| Heptacosane | 1.0 | 8.9 | 28.9 | 42.8 | 96.2 | 26.4 | 30.3 | 23.5 | 1.3 | 26.6 | 1.5 |
| Nonacosane | 20.8 | 9.7 | 60.4 | 77.9 | 21.3 | 16.2 | 39.3 | 11.5 | 0.7 | 35.3 | 14.5 |
| Decanyl tetradecanoate | 0.5 | 5.4 | 23.6 | 16.2 | 3.2 | 5.5 | 78.5 | 1.7 | 2.7 | 13.9 | 15.1 |
| Phytylhexadecanoate | ND | ND | 147.8 | ND | ND | ND | 83.2 | 38.0 | ND | 333.3 | 40.1 |
| Cycloartenol | 33.5 | 28.3 | 202.5 | 92.9 | 177.2 | 55.6 | 211.4 | 3.6 | 55.3 | 77.7 | 85.4 |
| Ursolic acid | 1.6 | ND | ND | ND | ND | 13.6 | ND | 3.5 | 598.2 | 143.7 | 188.9 |
| Diploptene | ND | 109.7 | ND | 280.3 | 86.1 | ND | 275.8 | 2.5 | 0.3 | ND | ND |
| α-Amyrin | ND | 18.5 | ND | ND | ND | ND | ND | ND | ND | 53.0 | ND |
| Oleanolic acid | 2.6 | ND | ND | ND | ND | ND | ND | ND | ND | 165.3 | ND |
| Uvaol | ND | ND | ND | ND | ND | ND | ND | ND | ND | 99.4 | ND |
| Stigmasta-3,5-diene | 2.5 | 5.2 | 11.2 | 22.5 | ND | 1.0 | 47.4 | 11.8 | 4.2 | 8.5 | 5.5 |
2.2. LC-TOF-MS Analysis of the Moss Ethanol Extract
| No. | Formula | PC | RT | AP | CD | DP | HS | PCC | PJ | PS | SF | SM | SR | ST |
|---|---|---|---|---|---|---|---|---|---|---|---|---|---|---|
| v1 | Atraric acid | 3.0 | 27.3 | 14.6 | 44.8 | 5.9 | 4.4 | 14.9 | 23.8 | 74.3 | 2.0 | 4.3 | 5.3 | 7.9 |
| v2 | Benzyl benzoate | 1.6 | 3.4 | 4.1 | 4.2 | ND | 6.9 | 5.4 | 8.8 | 12.6 | 7.5 | 13.2 | ND | 5.1 |
| v3 | 4-Hydroxybenzoic acid | 5.6 | 17.7 | 10.1 | 16.2 | 11.2 | 10.1 | 0.8 | ND | 9.4 | 7.4 | 11.5 | 11.8 | 4.7 |
| v4 | Methyl 4-hydroxybenzoate | 2.5 | 2.8 | 7.6 | 8.8 | 4.1 | 6.5 | 0.5 | 10.1 | 7.7 | 1.5 | 18.9 | 2.3 | 7.2 |
| v5 | 3-Methoxy-4-hydroxybenzoic acid | 7.7 | 12.5 | 7.9 | 13.5 | 1.2 | 18.2 | 0.7 | 15.4 | 14.5 | 18.2 | 26.6 | 12.1 | 13.4 |
| v6 | 4-O-Caffeoylquinic acid | ND | ND | ND | 25.7 | ND | 5.0 | ND | ND | 5.3 | 7.9 | 1.9 | 15.3 | 11.6 |
| v7 | 5-O-Caffeoylquinic acid | ND | ND | ND | 25.7 | ND | 5.0 | ND | ND | 5.3 | 7.9 | 1.9 | 15.3 | 11.6 |
| v8 | Caffeic acid | 6.4 | 3.2 | 41.8 | 2.3 | ND | 4.0 | 5.8 | 2.9 | 4.4 | ND | ND | 2.1 | ND |
| v9 | p-Coumaric acid | 22.3 | 6.7 | 11.4 | 5.9 | 1.0 | 3.5 | 0.2 | 12.9 | 11.2 | 3.5 | 7.3 | 11.5 | 5.0 |
| v10 | Ferulic acid | 0.8 | 2.7 | 21.3 | 3.3 | 1.2 | 1.1 | 19.1 | 2.7 | 3.0 | 3.7 | 5.6 | 1.5 | 3.9 |
| v11 | 7,8-Dihydroxy-5-methoxycoumarin-7-β-sophoroside | 63.2 | 144.1 | 37.1 | 25.0 | 58.0 | 164.9 | 95.9 | 117.3 | 163.8 | 65.7 | 32.8 | 105.3 | 106.5 |
| v12 | 5,6,7,8-Tetrahydroxycoumarin-5-β-glucopyranoside | ND | ND | ND | ND | ND | ND | ND | ND | 2.6 | ND | ND | ND | ND |
| v13 | Abscisic acid | 4.3 | 5.2 | ND | 3.9 | 0.7 | 5.3 | 3.9 | 5.9 | 6.5 | 3.7 | 12.5 | 2.9 | 7.3 |
| v14 | Sphagnic acid | 3.4 | 5.5 | 10.0 | 6.4 | 3.6 | 4.4 | 20.3 | 4.4 | 2.1 | 21.9 | 109.0 | 19.0 | 21.8 |
| v15 | 5,8-Dihydroxy-7-methoxycoumarin 5-β-glucopyranoside | 35.8 | 1.0 | 7.2 | 6.1 | 12.8 | 4.3 | 4.5 | 4.1 | 2.6 | 9.8 | 6.6 | 30.6 | 10.5 |
| v16 | Dimethyl phthalate | 0.8 | 2.7 | 21.3 | 3.3 | 1.2 | 1.1 | 19.1 | 2.7 | 3.0 | 3.7 | 5.7 | 1.5 | 3.9 |
| v17 | Dimethyl terephthalate | 0.8 | 2.7 | 21.3 | 3.3 | 1.2 | 1.1 | 19.1 | 2.7 | 3.0 | 3.7 | 5.7 | 1.5 | 3.9 |
| v18 | Ohioensin H | 208.8 | ND | 0.8 | 6.1 | 5.3 | 4.1 | 6.6 | 5.6 | 2.5 | 10.3 | 11.7 | 7.4 | 7.6 |
| V19 | Harmol propionic acid ester | ND | ND | ND | ND | ND | ND | ND | ND | ND | ND | ND | 0.6 | ND |
| v20 | 7-Hydroxyharmane | ND | ND | ND | ND | ND | ND | ND | ND | ND | ND | ND | 0.6 | ND |
| v21 | Apigenin | ND | 69.0 | 69.5 | 71.6 | 6.0 | 36.4 | ND | ND | 21.7 | ND | 5.8 | ND | ND |
| v22 | 2,3-Dihydro-5ʹ,3ʹʹʹ-dihydroxyamentoflavone | 6.1 | 25.0 | 24.7 | 47.4 | ND | 9.3 | ND | 78.8 | 3.3 | ND | ND | ND | ND |
| v23 | 2,3-Dihydrodicranolomin | 6.1 | 25.0 | 24.7 | 47.4 | ND | 9.3 | ND | 78.8 | 3.3 | ND | ND | ND | ND |
| v24 | Communin A | 20.5 | ND | ND | 3.5 | ND | ND | ND | ND | 2.2 | ND | 1.4 | ND | ND |
| v25 | 2,3-Dihydro-5ʹ-hydroxyrobustaflavone | ND | 0.8 | ND | ND | ND | ND | 3.7 | ND | ND | ND | ND | ND | 1.3 |
| v26 | 3ʹʹʹ-Desoxydicranolomin | ND | 114.8 | 102.7 | ND | ND | 14.7 | ND | ND | 17.3 | ND | 0.7 | ND | ND |
| v27 | 3-Hydroxy-β-ionone | 4.9 | 62.0 | 91.0 | 9.7 | 5.8 | 66.3 | 7.7 | 14.6 | 21.9 | 2.1 | 36.6 | 5.9 | 14.5 |
| v28 | p-Hydroxyacetophenone | 1.2 | 31.2 | 32.3 | 16.3 | 0.0 | 18.4 | 12.0 | ND | 6.2 | 344.4 | 63.1 | 25.2 | 67.7 |
| V29 | 3,5-dioxohexanoic acid | 179.9 | 98.3 | 99.3 | 43.7 | 99.0 | 97.6 | 162.7 | 91.4 | 118.3 | 64.2 | 70.4 | 76.5 | 103.9 |
| V30 | 4-hydroxybenzoic acid | 5.5 | 17.7 | 10.1 | 17.3 | 11.2 | 10.1 | 0.8 | ND | 9.4 | 7.4 | 11.5 | 11.8 | 4.7 |
| v31 | Α-d-furanallulose | ND | ND | ND | ND | ND | ND | 6.3 | ND | 1.3 | 0.8 | 1.6 | 1.0 | ND |
| v32 | Benzoic acid | 11.8 | 5.1 | 0.0 | 5.2 | ND | 8.9 | 4.1 | 8.8 | 15.0 | 4.9 | 4.8 | 11.0 | 13.1 |
| v33 | Protocatechuic acid | 6.3 | 11.3 | 18.4 | 18.5 | 5.2 | 15.9 | 12.2 | 10.6 | 9.5 | 8.2 | 13.0 | 8.7 | 10.9 |
| v34 | Vanillic acid | 6.8 | 12.5 | 8.2 | 13.7 | 4.2 | 18.2 | 10.1 | 15.4 | 14.5 | 11.4 | 13.6 | 9.0 | 13.4 |
| v35 | Matairesinol | ND | ND | ND | 4.4 | 0.4 | ND | ND | ND | ND | ND | ND | ND | ND |
| v36 | Glycine | 7.8 | 31.2 | 18.4 | 20.6 | 16.2 | 35.3 | 31.0 | 20.5 | 14.1 | 12.4 | 19.0 | 19.2 | 23.3 |
| v37 | Alanine | 200.5 | 145.4 | 166.0 | 84.4 | 297.0 | 82.6 | 154.8 | 60.0 | 94.4 | 78.1 | 407.8 | 139.8 | 137.2 |
| v38 | Serine | 42.1 | 77.2 | 57.4 | 43.8 | 72.2 | 112.5 | 176.1 | 144.5 | 178.6 | 27.4 | 46.0 | 27.1 | 89.7 |
| V39 | Glutamic acid | 69.8 | 765.3 | 709.9 | 262.5 | 75.7 | 1039.5 | 890.0 | 846.4 | 1134.6 | 135.6 | 77.7 | 10.8 | 587.8 |
| v40 | Proline | 21.5 | 95.0 | 55.6 | 105.8 | 24.6 | 99.6 | 61.8 | 37.2 | 42.3 | 17.9 | 46.6 | 25.3 | 73.4 |
| v41 | Valine | 397.6 | 253.7 | 208.4 | 188.9 | 290.0 | 255.1 | 373.5 | 443.5 | 188.6 | 84.3 | 176.2 | 53.4 | 298.9 |
| v42 | Threonine | 51.4 | 51.8 | 62.3 | 27.7 | 43.2 | 81.7 | 105.7 | 72.9 | 73.0 | 26.1 | 98.0 | 12.1 | 99.0 |
| v43 | Leucine | 54.5 | 45.0 | 278.4 | 74.9 | 47.4 | 57.2 | 81.0 | 68.7 | 121.0 | 55.3 | 448.3 | 15.1 | 176.0 |
| v44 | Asparagine | 147.6 | ND | ND | ND | ND | ND | 541.1 | 0.0 | ND | ND | 589.6 | 0.9 | ND |
| v45 | Aspartic acid | 194.0 | 269.0 | 276.6 | 42.3 | 52.4 | 419.9 | 507.9 | 216.8 | 427.3 | 49.1 | 67.5 | 15.9 | 186.7 |
| v46 | Glutamine | 29.9 | 9.4 | 8.3 | 4.9 | 5.4 | 5.6 | 6.1 | 17.7 | 7.2 | ND | 9.8 | ND | 1.6 |
| v47 | Lysine | 3.3 | 0.8 | 30.5 | 30.5 | 2.7 | 4.4 | 5.5 | 1.2 | 2.6 | 0.5 | 6.2 | 9.1 | 3.1 |
| v48 | Phenylalanine | 103.4 | 69.1 | 519.1 | 124.6 | 32.6 | 108.6 | 171.7 | 45.4 | 89.9 | 22.5 | 355.7 | 13.3 | 56.3 |
| V49 | Arginine | 5.1 | 30.4 | 15.5 | 11.5 | 3.7 | 53.6 | 25.4 | 84.3 | 107.0 | 59.1 | 95.9 | 4.0 | 9.7 |
| v50 | Tyrosine | 36.2 | 2.4 | 25.1 | 6.4 | 13.3 | 21.2 | 26.7 | 16.4 | 13.3 | 3.3 | 15.9 | 3.6 | 8.6 |
| v51 | Tryptophan | 75.4 | 20.7 | 378.7 | 159.6 | 11.6 | 35.6 | 107.4 | 45.9 | 42.4 | 18.5 | 161.1 | 27.2 | 38.3 |
| Total Substance Group Amounts | AP | CD | DP | HS | PCC | PJ | PS | SF | SM | SR | ST |
|---|---|---|---|---|---|---|---|---|---|---|---|
| Fatty acids | 329.5 | 719.9 | 471.3 | 1707.2 | 796.2 | 771.1 | 877.7 | 836.3 | 446.5 | 614.0 | 1017.4 |
| Monoglycerols | 46.1 | 2.8 | 23.7 | 166.6 | 123.0 | 56.1 | 283.5 | 161.2 | 86.2 | 106.5 | 63.9 |
| Terpenoids | 198.3 | 159.3 | 168.3 | 395.5 | 176.4 | 269.0 | 356.9 | 115.6 | 82.4 | 124.8 | 133.7 |
| Alcohols | 80.7 | 93.7 | 166.3 | 215.3 | 167.7 | 74.2 | 177.9 | 129.5 | 73.8 | 225.6 | 120.5 |
| Sterols | 735.7 | 744.6 | 1618.6 | 1673.4 | 1715.8 | 714.6 | 2130.6 | 1695.5 | 632.8 | 686.2 | 633.2 |
| Diterpenes | 23.9 | 15.8 | 33.1 | 110.2 | 51.7 | 13.0 | 106.7 | 39.8 | 0.3 | 81.4 | 59.3 |
| Alkanes | 34.1 | 65.6 | 105.6 | 279.3 | 173.8 | 56.5 | 92.6 | 102.4 | 18.7 | 115.6 | 80.1 |
| Wax/Wax esters | 0.5 | 5.4 | 171.4 | 16.2 | 3.2 | 5.5 | 161.7 | 39.6 | 2.7 | 347.2 | 55.2 |
| Triterpenes | 37.7 | 156.4 | 202.5 | 373.2 | 263.3 | 69.3 | 487.2 | 9.5 | 653.8 | 539.2 | 274.4 |
| Steroids | 2.5 | 5.2 | 11.2 | 22.5 | ND | 1.0 | 47.4 | 11.8 | 4.2 | 8.5 | 5.5 |
| Polyphenols | 651.9 | 711.2 | 704.6 | 509.3 | 252 | 559.3 | 440.9 | 521.8 | 580.3 | 631.6 | 504.3 |
| Amino acids | 1440.1 | 1866.4 | 2810.2 | 1188.4 | 988 | 2412.4 | 3265.7 | 2121.4 | 2536.3 | 590.1 | 2621.3 |
2.3. Evaluation of the Biological Activity in Moss Extracts
| Species | Rat Glioma Cells (C6) | Human Epidermoid Carcinoma (A431) | Human Lung Carcinoma (A549) | Mouse Melanoma Cell Lines (B16-F10) | Human Breast Adenocarcinoma (MCF-7) | Human Colorectal Carcinoma (CaCo-2) |
|---|---|---|---|---|---|---|
| AP | 51 ± 8 | 63 ± 8 | 100 ± 5 | ND | 100 ± 4 | 84 ± 4 |
| CD | 43 ± 7 | 64 ± 8 | 57 ± 8 | 98 ± 12 | ND | 66 ± 6 |
| DP | 3 ± 0.5 | 27 ± 4 | 57 ± 8 | 12 ± 2 | 67 ± 4 | 45 ± 4 |
| PJ | 68 ± 8 | 84 ± 9 | 24 ± 5 | ND | >100 | 42 ± 5 |
| PC | 53 ± 5 | 23 ± 3 | ND | 24 ± 5 | 47 ± 6 | 24 ± 3 |
| RT | 86 ± 6 | 40 ± 5 | 98 ± 9 | 76 ± 8 | ND | 49 ± 4 |
| PCC | 23 ± 5 | 77 ± 8 | 32 ± 8 | 79 ± 8 | >100 | 42 ± 5 |
| PS | 5 ± 0.4 | 28 ± 4 | 55 ± 7 | 39 ± 6 | >100 | 61 ± 5 |
| SF | 27 ± 4 | 57 ± 4 | >100 | 69 ± 9 | ND | 65 ± 3 |
| ST | 26 ± 3 | 62 ± 7 | >100 | ND | >100 | 41 ± 3 |
| SM | 0.9 ± 0.1 | 13 ± 2 | 44 ± 8 | 89 ± 9 | ND | 43 ± 4 |
| SR | 53 ± 5 | 72 ± 8 | >100 | ND | 70 ± 5 | 42 ± 2 |
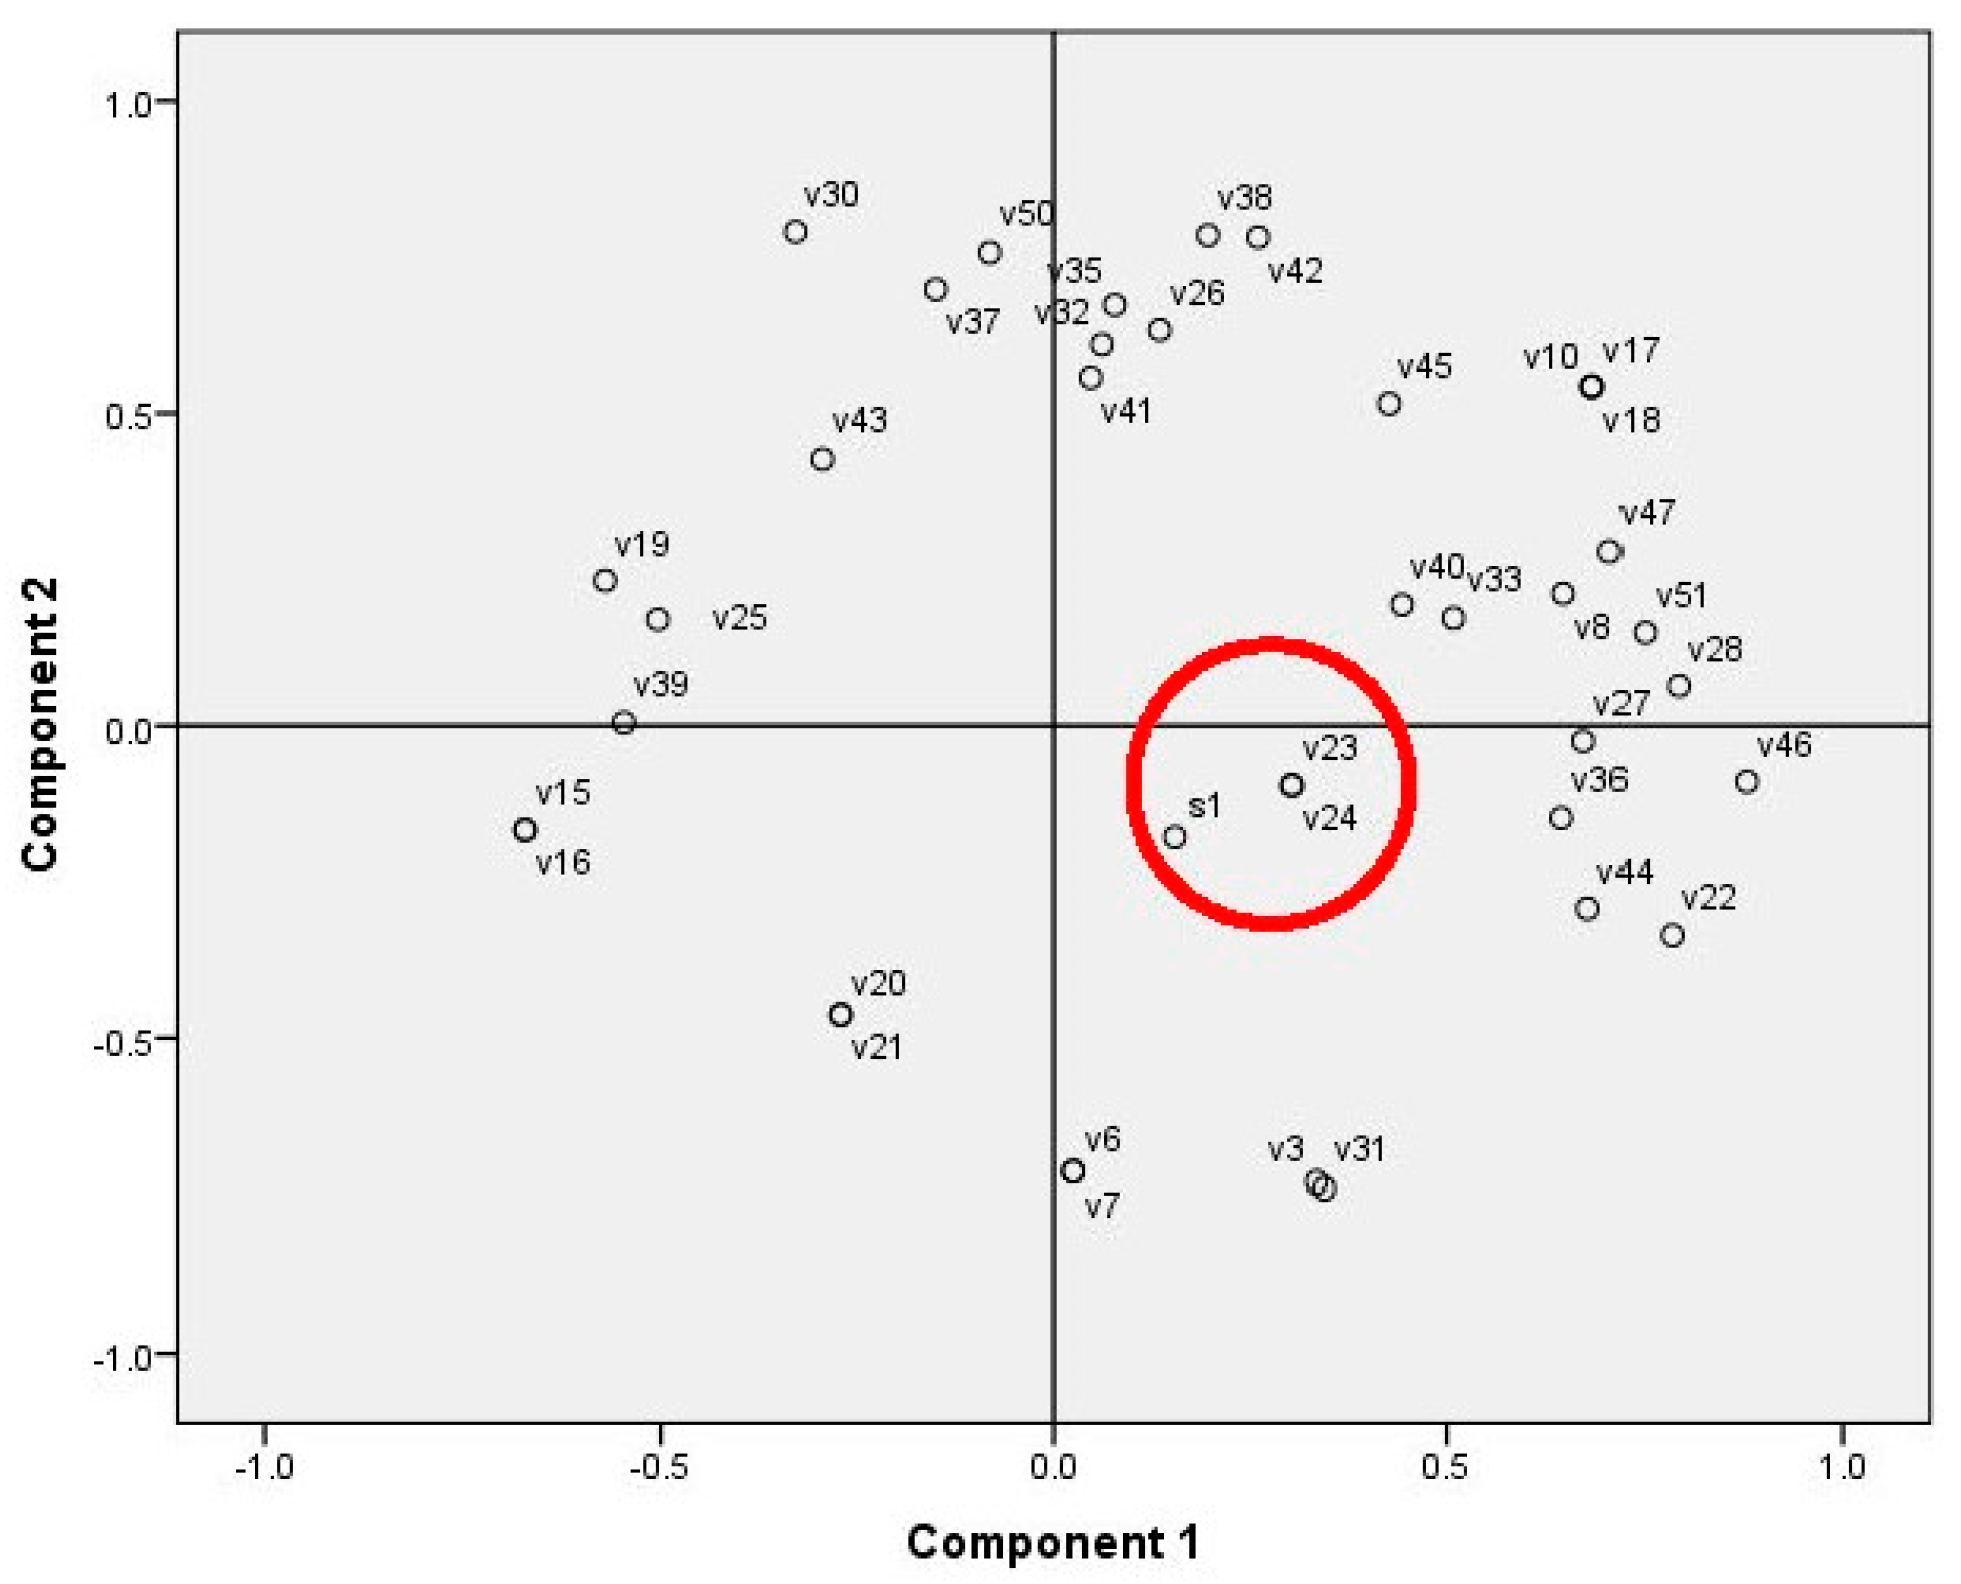
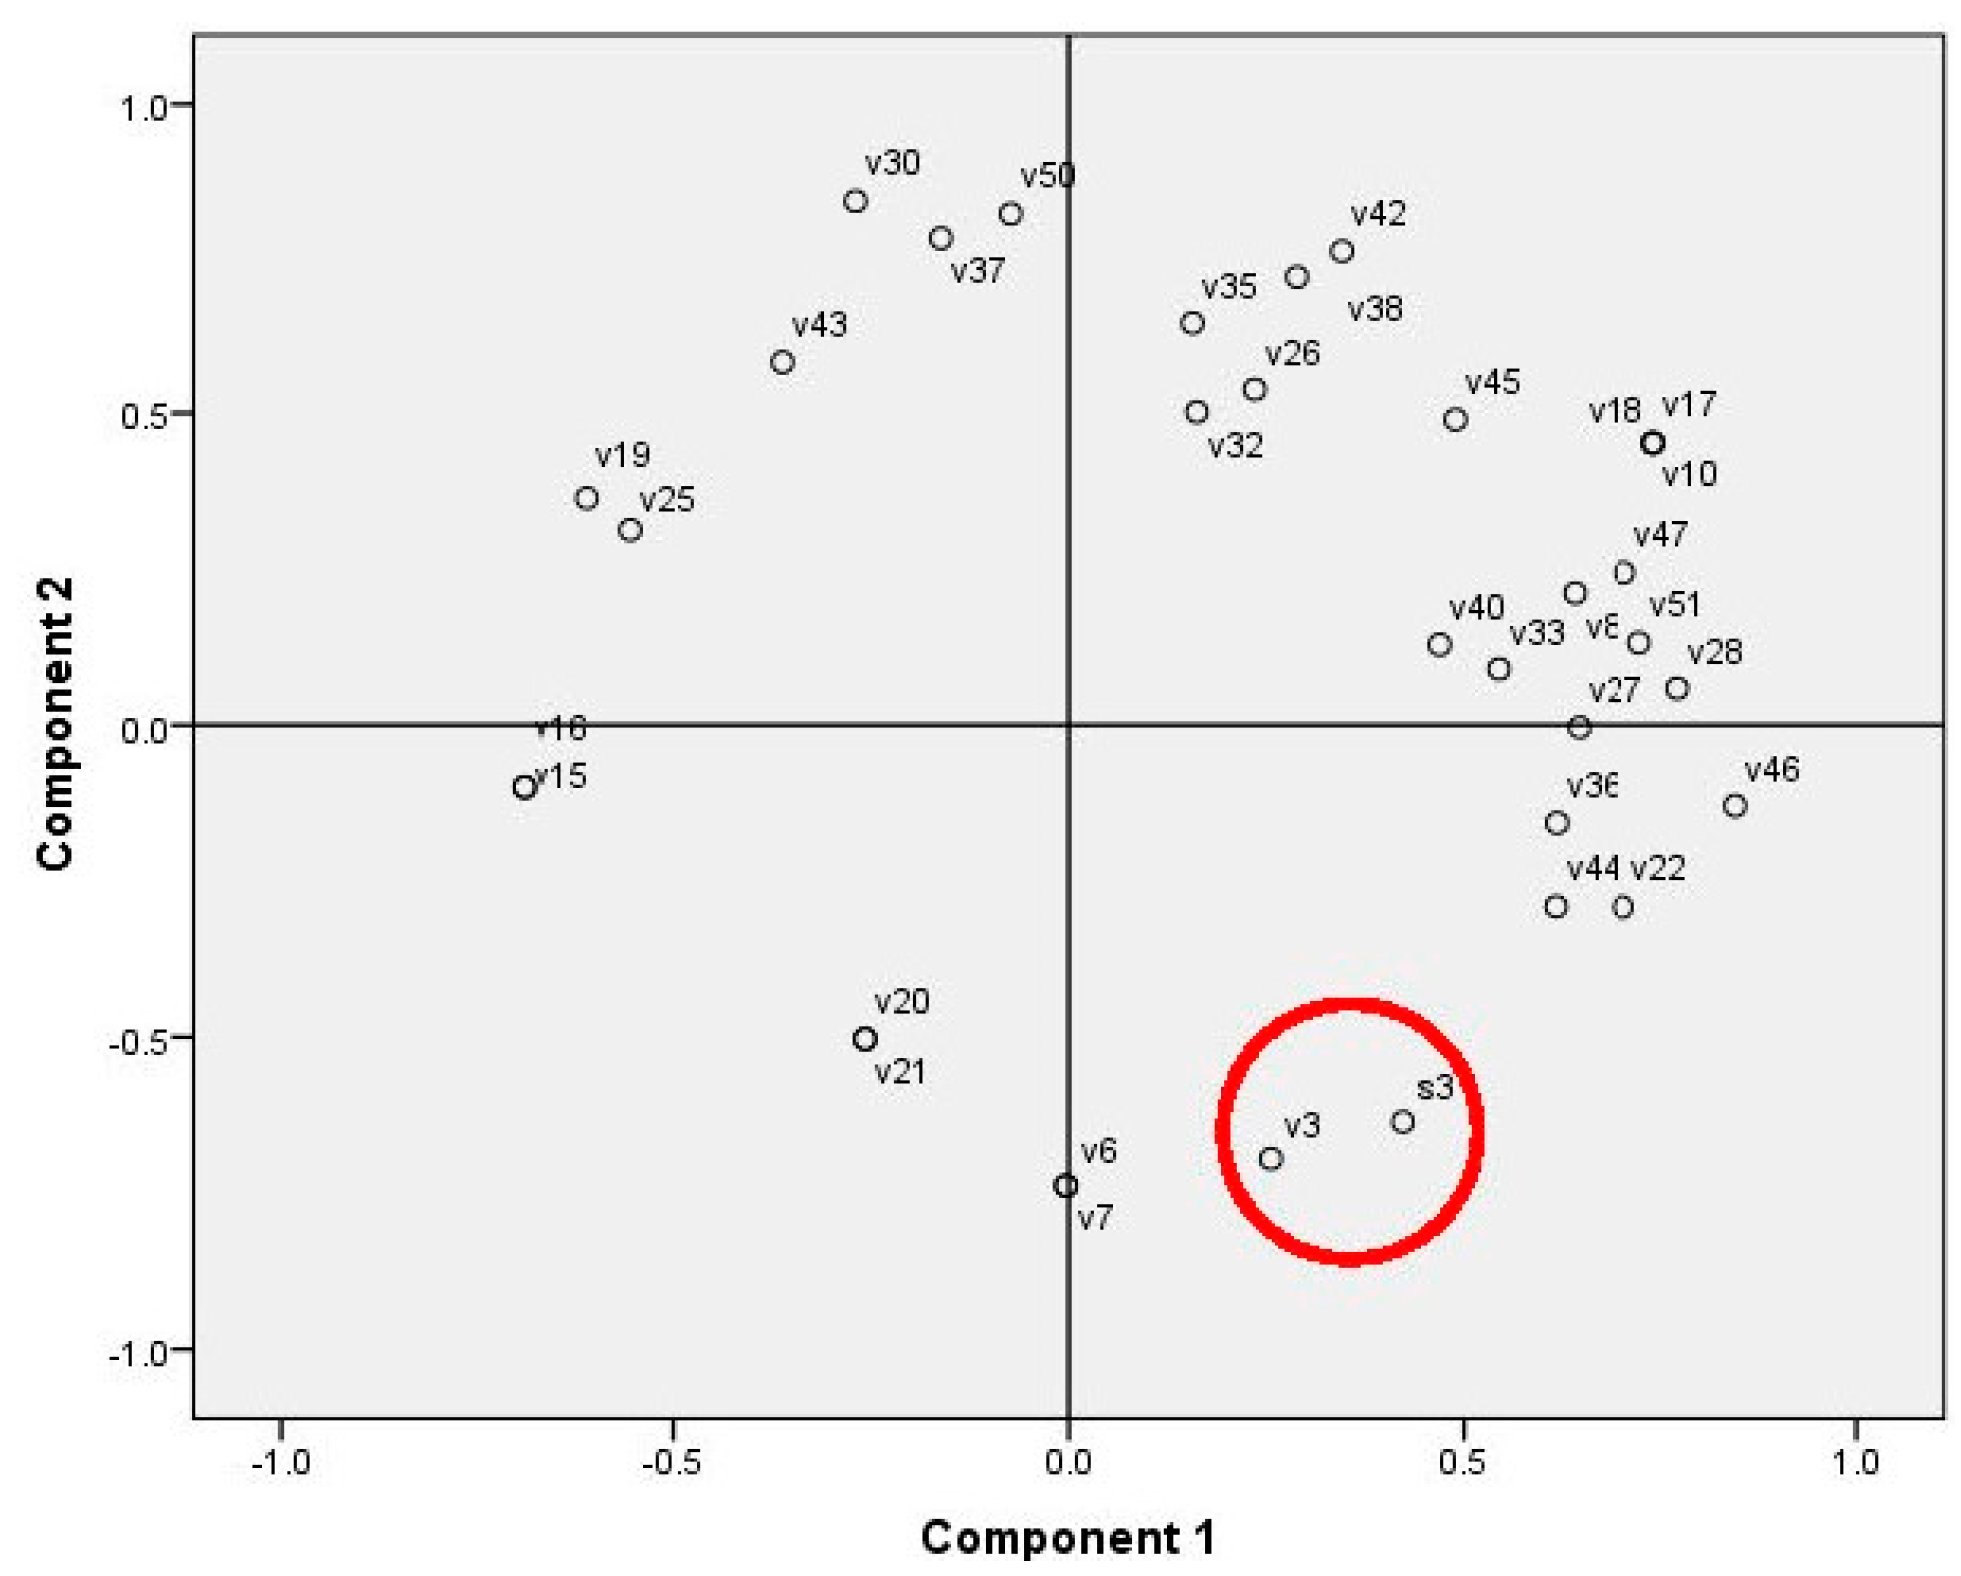
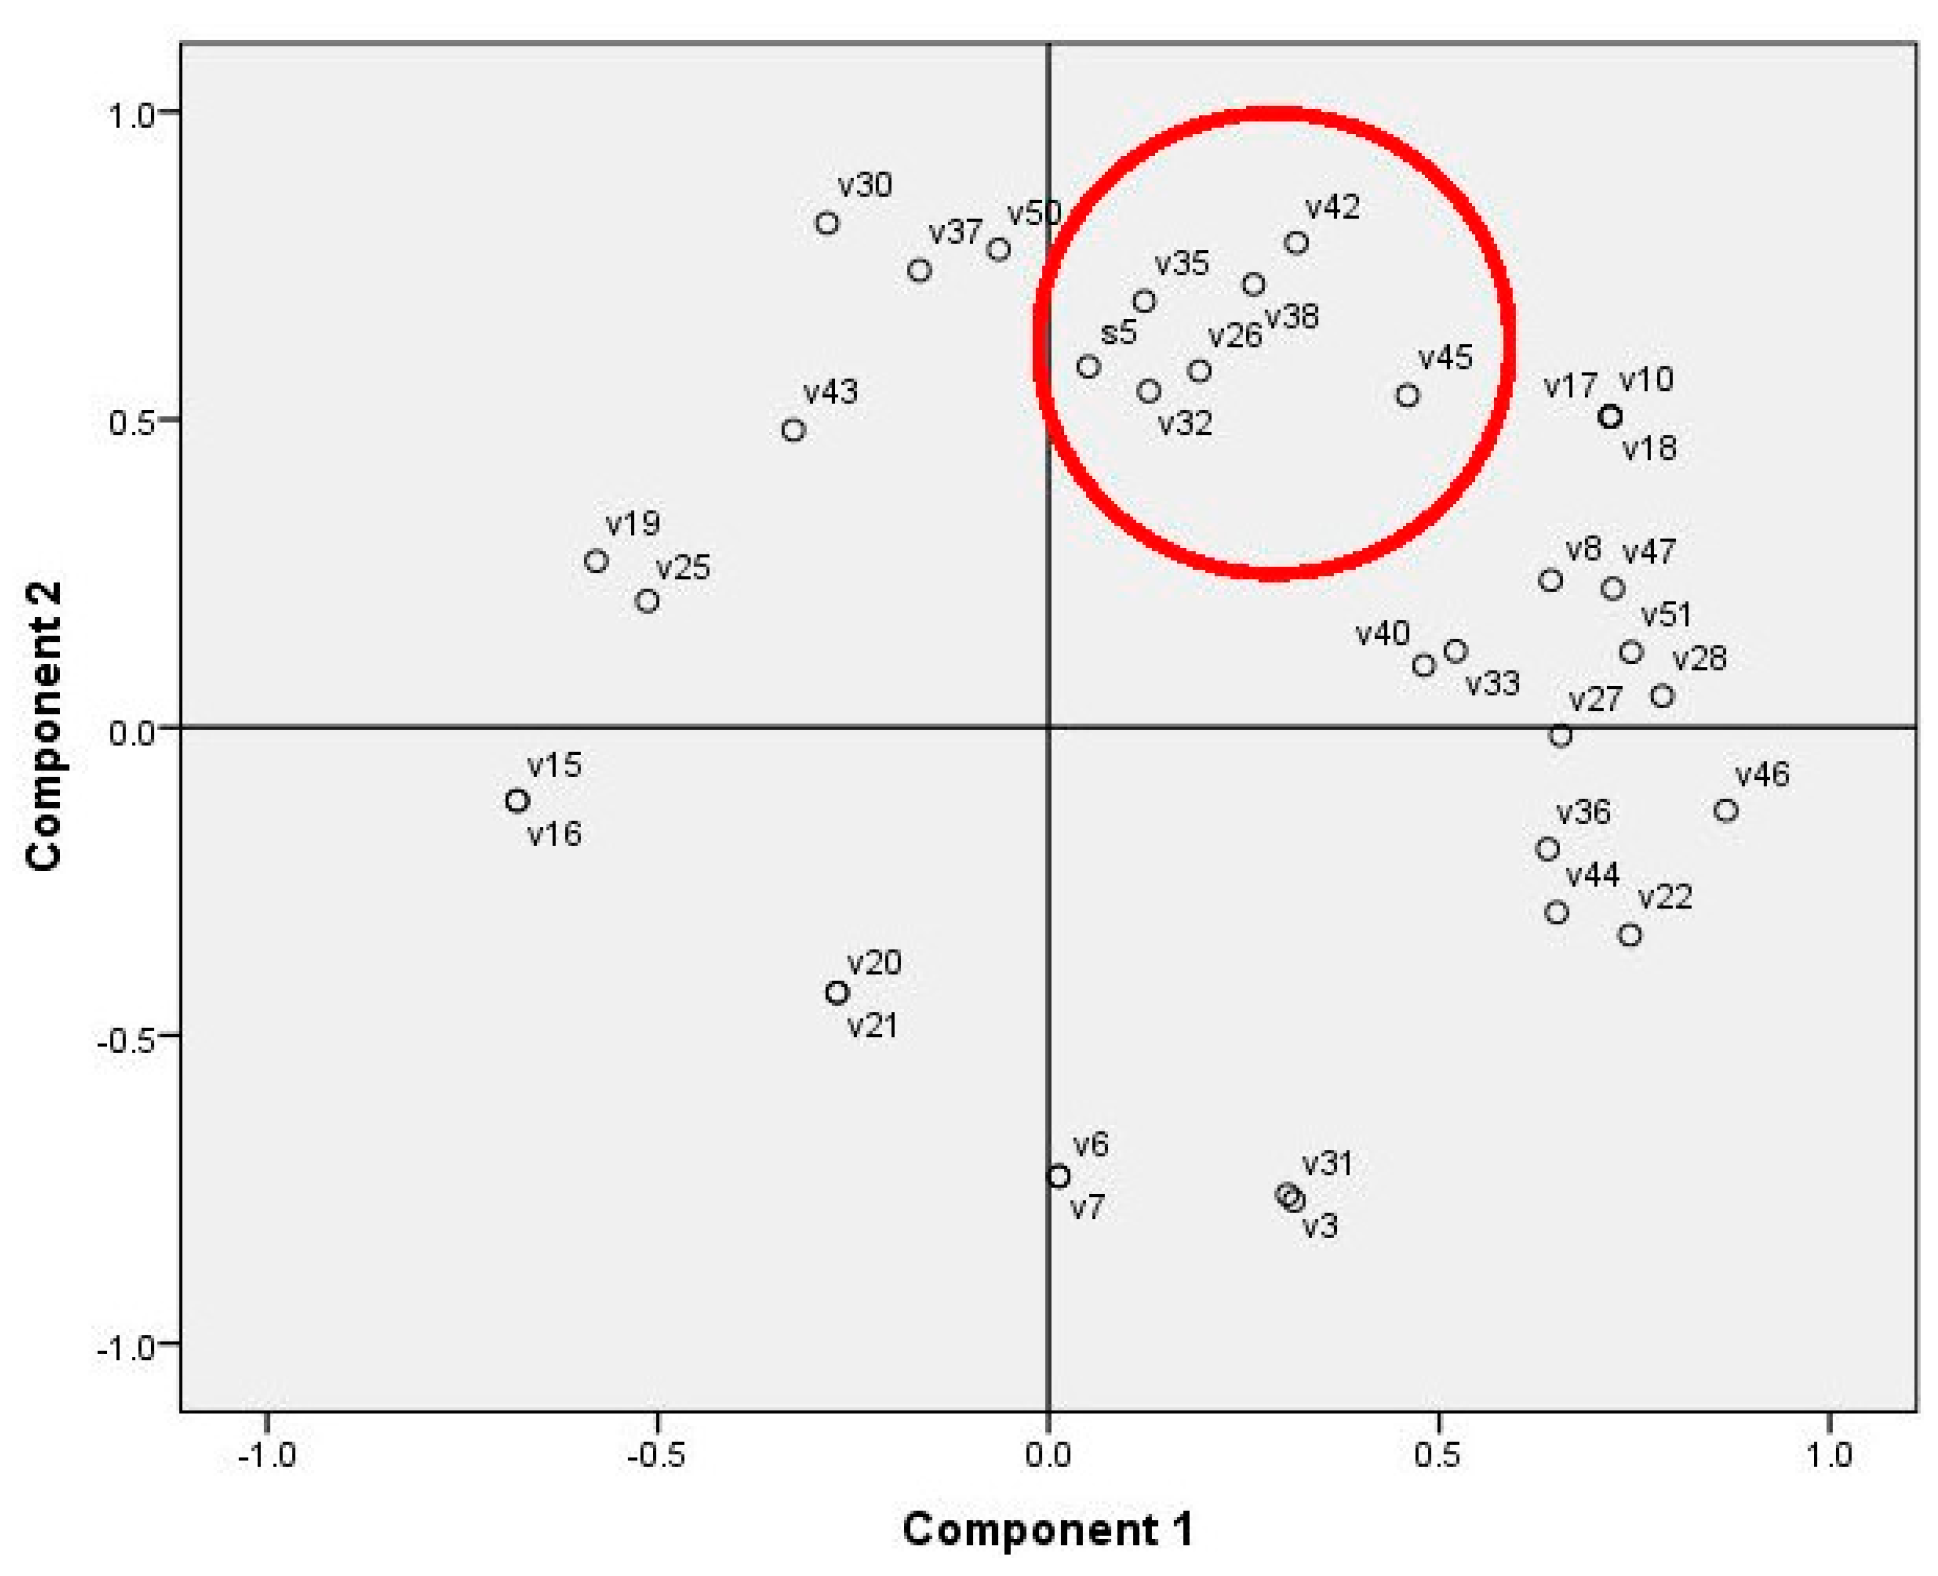
2.4. Statistical Analysis
- (1)
- rat glioma cells: 2,3-dihydro-5ʹ,3ʹʹʹ-dihydroxyamentoflavone and 2,3-dihydrodicranolomin (r = 0.587, p = 0.05);
- (2)
- human lung carcinoma: ohioensin H (r = −0.579, p = 0.05); communin A (r = −0.610, p = 0.05);
- (3)
- human colorectal carcinoma: 5,8-dihydroxy-7-methoxycoumarin-5-β-glucopyranoside and 5,8-dihydroxy-7-methoxycoumarin-5-β-glucopyranoside (r = −0.599, p = 0.05); apigenin (r = 0.751, p = 0.01); 3ʹʹʹ-desoxydicranolomin (r = 0.714, p = 0.01); 3-hydroxy-β-ionone (r = 0.665, p = 0.05).


3. Experimental Section
3.1. Materials
3.2. Extraction and Sample Preparation Procedures
3.2.1. Extraction with Ethanol
3.2.2. Extraction with Chloroform
3.2.3. Derivatization of Substances in Chloroform Extracts
3.3. Analytical Methods
3.3.1. Determination of Total Polyphenol Concentration
3.3.2. Analysis of the Total Amount Carbohydrates
3.3.3. Determination of Radical Scavenging Activity Using DPPH
3.3.4. Analysis of Lipid Extracts by Gas Chromatography-Mass Spectrometry
3.3.5. Analysis of the Ethanol Extracts by Ultra-Performance Liquid Chromatography Coupled with Time-of-Flight Mass Spectrometry
3.3.6. Cytotoxicity Testing of Moss Extracts
3.3.7. Antimicrobial Activity of Moss Extracts
3.3.8. Statistical Analysis
4. Conclusions
Acknowledgments
Author Contributions
Conflicts of Interest
References
- Asakawa, Y.; Ludwiczuk, A.; Nagashima, F. Chemical Constituents of Bryophytes: Bio- and Chemical Diversity, Biological Activity, and Chemosystematics (Progress in the Chemistry of Organic Natural Products); Springer: Vienna, Austria, 2013; p. 796. [Google Scholar]
- Fu, P.; Lin, S.; Shan, L.; Lu, M.; Shen, Y.H.; Tang, J.; Liu, R.H.; Zhang, X.; Zhu, R.L.; Zhang, W.D. Constituents of the moss Polytrichum commune. J. Nat. Prod. 2012, 72, 1335–1337. [Google Scholar] [CrossRef] [PubMed]
- Cheng, X.; Xiao, Y.; Wang, X.; Wang, P.; Li, H.; Yan, H.; Liu, Q. Anti-tumor and pro-apoptic activity of ethanolic extract and its various fractions from Polytrichum commune L. Ex Hedw in L1210 cells. J. Ethnopharmacol. 2012, 143, 49–56. [Google Scholar]
- Krzaczkowski, L.; Wright, M.; Reberioux, D.; Massiot, G.; Etievant, C.; Gairin, J.E. Pharmacological screening of bryophyte extracts that inhibit growth and induce abnormal phenotypes in human HeLa cancer cells. Fund. Clin. Pharmacol. 2009, 23, 473–482. [Google Scholar] [CrossRef] [PubMed]
- Üçüncü, O.; Cansu, T.B.; Özdemir, T.; Alpay-Karaoğlu, Ş.; Yayli, N. Chemical composition and antimicrobial activity of the essential oils of mosses (Tortula muralis Hedw., Homalothecium lutescens (Hedw.) H. Rob., Hypnum cupressiforme Hedw., and Pohlia nutans (Hedw.) Lindb.) from Turkey. Turk. J. Chem. 2010, 34, 825–834. [Google Scholar]
- Asakawa, Y. Biologically active compounds from bryophytes. Pure Appl. Chem. 2007, 79, 557–580. [Google Scholar] [CrossRef]
- Wang, X.N.; Yu, W.T.; Lou, H.X. Antifungal constituents from the Chinese moss Homalia trichomanoides. Chem. Biodivers. 2005, 2, 139–145. [Google Scholar] [CrossRef] [PubMed]
- Singh, M.; Govindarajan, R.; Nath, V.; Rawat, A.K.S.; Mehrotra, S. Antimicrobial, wound healing and antioxidant activity of Plagiochasma appendiculatum Lehm. et Lind. J. Ethnopharmacol. 2006, 107, 67–72. [Google Scholar] [CrossRef] [PubMed]
- Saboljevic, A.; Sokovic, M.; Glamočlija, J.; Čirič, A.; Vujičic, M.; Pejin, B.; Saboljevic, M. Comparison of extract bio-activities of in-situ and in vitro grown selected bryophyte species. Afr. J. Microbiol. Res. 2010, 4, 808–812. [Google Scholar]
- Kang, S.J.; Kim, S.H.; Liu, P.; Jovel, E.; Towers, G.H.N. Antibacterial activities of some mosses including Hylocomnium spendens from South Western British Columbia. Fitoterapia 2007, 78, 373–376. [Google Scholar] [CrossRef] [PubMed]
- Pejin, B.; Biance, A.; Newmaster, S.; Sabovljevic, M.; Vijisic, L.; Vajs, V.; de Rosa, S. Fatty acids of Rhodobryum ontariense (Bryaceae). Nat. Prod. Res. 2012, 26, 696–702. [Google Scholar] [CrossRef] [PubMed]
- Maksimova, V.; Klavina, L.; Bikovens, O.; Zicmanis, A.; Purmalis, O. Structural characterization and chemical classification of some bryophytes found in Latvia. Chem. Biodivers. 2013, 10, 1284–1294. [Google Scholar] [CrossRef] [PubMed]
- Klavina, L. Polysaccharides from Lower Plants: Bryophytes. In Polysaccharides; Ramawat, K.G., Mérillon, J.M., Eds.; Springer International Publishing: Cham, Switzerland, 2015. [Google Scholar]
- Cansu, T.B.; Yayli, B.; Özdemir, T.; Batan, N.; Alpay Karaoģlu, Ş.; Yayli, N. Antimicrobial activity and chemical composition of the essential oils of mosses (Hylocomnium splendes (Hedw.) Schimp. and Leucodon sciuroides (Hedw.) Schwägr.) growing in Turkey. Turk. J. Chem. 2013, 37, 213–219. [Google Scholar]
- Pejin, B.; Bogdanovic-Pristov, J.; Pejin, I.; Sabovljevic, M. Potential antioxidant activity of the moss Bryum moravicum. Nat. Prod. Res. 2013, 27, 900–902. [Google Scholar] [CrossRef] [PubMed]
- Goffinet, B.; Shaw, A.J. Bryophyte Biology; Cambridge University Press: Cambridge, UK, 2008; p. 565. [Google Scholar]
- Tutschek, R. Characterization of a peroxidase from Sphagnum magellanicum. Phytochemistry 1979, 18, 1437–1439. [Google Scholar] [CrossRef]
- Xie, C.F.; Lou, H.X. Secondary metabolites in bryophytes: An ecological aspect. Chem. Biodivers. 2009, 6, 303–312. [Google Scholar] [CrossRef] [PubMed]
- Huang, X.; Xue, J.; Zhang, J.; Qin, Y.; Meyers, P.A.; Wang, H. Effect of different wetness conditions on Sphagnum lipid composition in the Erxianyan peatland, central China. Org. Geochem. 2012, 44, 1–7. [Google Scholar] [CrossRef]
- Aubé, M.; Quenum, M.; Ranasinghe, L.L. Characteristics of Eastern Canadian cultivated Sphagnum and potential use as a substitute for perlite and vermiculite in peat-based horticultural substrates. Mires Peat 2015, 16, 1–18. [Google Scholar]
- Dean, J.R. Extraction Techniques in Analytical Sciences; Wiley: Chicester, UK, 2009. [Google Scholar]
- Samuelson, G.; Bohlin, L. Drugs of Natural Origin; Apotekarsocieteten: Uppsala, Sweden, 2009. [Google Scholar]
- Sun, S.Q.; He, M.; Cao, T.; Zhang, Y.C.; Han, W. Response mechanisms of antioxidants in bryophyte (Hypnum plumeaforme) under the stress of single or combined Pb and/or Ni. Environ. Monit. Assess. 2009, 149, 291–302. [Google Scholar] [CrossRef] [PubMed]
- Dembitsky, V.M. Lipids of bryophytes. Prog. Lipid Res. 1993, 32, 281–356. [Google Scholar] [CrossRef]
- Baas, M.; Pancost, R.; van Geel, B.; Damst, J.S.S. A comparative study of lipids in Sphagnum species. Org. Geochem. 2000, 31, 535–541. [Google Scholar] [CrossRef]
- Glime, J.M. Bryophyte Ecology. Physiological Ecology; E-book; Michigan Technological University, International Association of Bryologists: 2007. Volume 1. Available online: http://www.bryoecol.mtu.edu/ (accessed on 9 February 2015).
- Asakawa, Y. Bryophytes: Their Chemistry and Chemical Taxonomy; Zinsmeister, H.D., Mues, R., Eds.; Oxford University Press: Oxford, UK, 1990. [Google Scholar]
- Singleton, V.L.; Orthorfer, R.; Lamuel-Raventos, R.M. Analysis of total phenols and other oxidation substrates and antioxidants by means of Folin-Ciocalteu reagent. Meth. Enzymol. 1999, 299, 152–178. [Google Scholar]
- Silverstein, R.M.; Webster, F.X.; Kiemle, D.J. Spectrometric Identification of Organic Compounds, 7th ed.; Wiley: Hoboken, NJ, USA, 2005; p. 512. [Google Scholar]
- Narwal, S.S.; Szajdak, L.; Sampietro, D.A. Research Methods in Plant Sciences Vol. 1. Soil Allelochemicals; Studium Press Ltd.: Houston, TX, USA, 2011; p. 440. [Google Scholar]
- Perez, C.; Pauli, M.; Bazveque, P. An antibiotic assay by the agar well diffusion method. Acta Biol. Med. Exp. 1990, 15, 113–115. [Google Scholar]
- Sample Availability: Samples of the compounds are available from the authors.
© 2015 by the authors. Licensee MDPI, Basel, Switzerland. This article is an open access article distributed under the terms and conditions of the Creative Commons Attribution license ( http://creativecommons.org/licenses/by/4.0/).
Share and Cite
Klavina, L.; Springe, G.; Nikolajeva, V.; Martsinkevich, I.; Nakurte, I.; Dzabijeva, D.; Steinberga, I. Chemical Composition Analysis, Antimicrobial Activity and Cytotoxicity Screening of Moss Extracts (Moss Phytochemistry). Molecules 2015, 20, 17221-17243. https://doi.org/10.3390/molecules200917221
Klavina L, Springe G, Nikolajeva V, Martsinkevich I, Nakurte I, Dzabijeva D, Steinberga I. Chemical Composition Analysis, Antimicrobial Activity and Cytotoxicity Screening of Moss Extracts (Moss Phytochemistry). Molecules. 2015; 20(9):17221-17243. https://doi.org/10.3390/molecules200917221
Chicago/Turabian StyleKlavina, Laura, Gunta Springe, Vizma Nikolajeva, Illia Martsinkevich, Ilva Nakurte, Diana Dzabijeva, and Iveta Steinberga. 2015. "Chemical Composition Analysis, Antimicrobial Activity and Cytotoxicity Screening of Moss Extracts (Moss Phytochemistry)" Molecules 20, no. 9: 17221-17243. https://doi.org/10.3390/molecules200917221
APA StyleKlavina, L., Springe, G., Nikolajeva, V., Martsinkevich, I., Nakurte, I., Dzabijeva, D., & Steinberga, I. (2015). Chemical Composition Analysis, Antimicrobial Activity and Cytotoxicity Screening of Moss Extracts (Moss Phytochemistry). Molecules, 20(9), 17221-17243. https://doi.org/10.3390/molecules200917221