
A New Green Ionic Liquid-Based Corrosion Inhibitor for Steel in Acidic Environments


Abstract
:1. Introduction
2. Results and Discussion
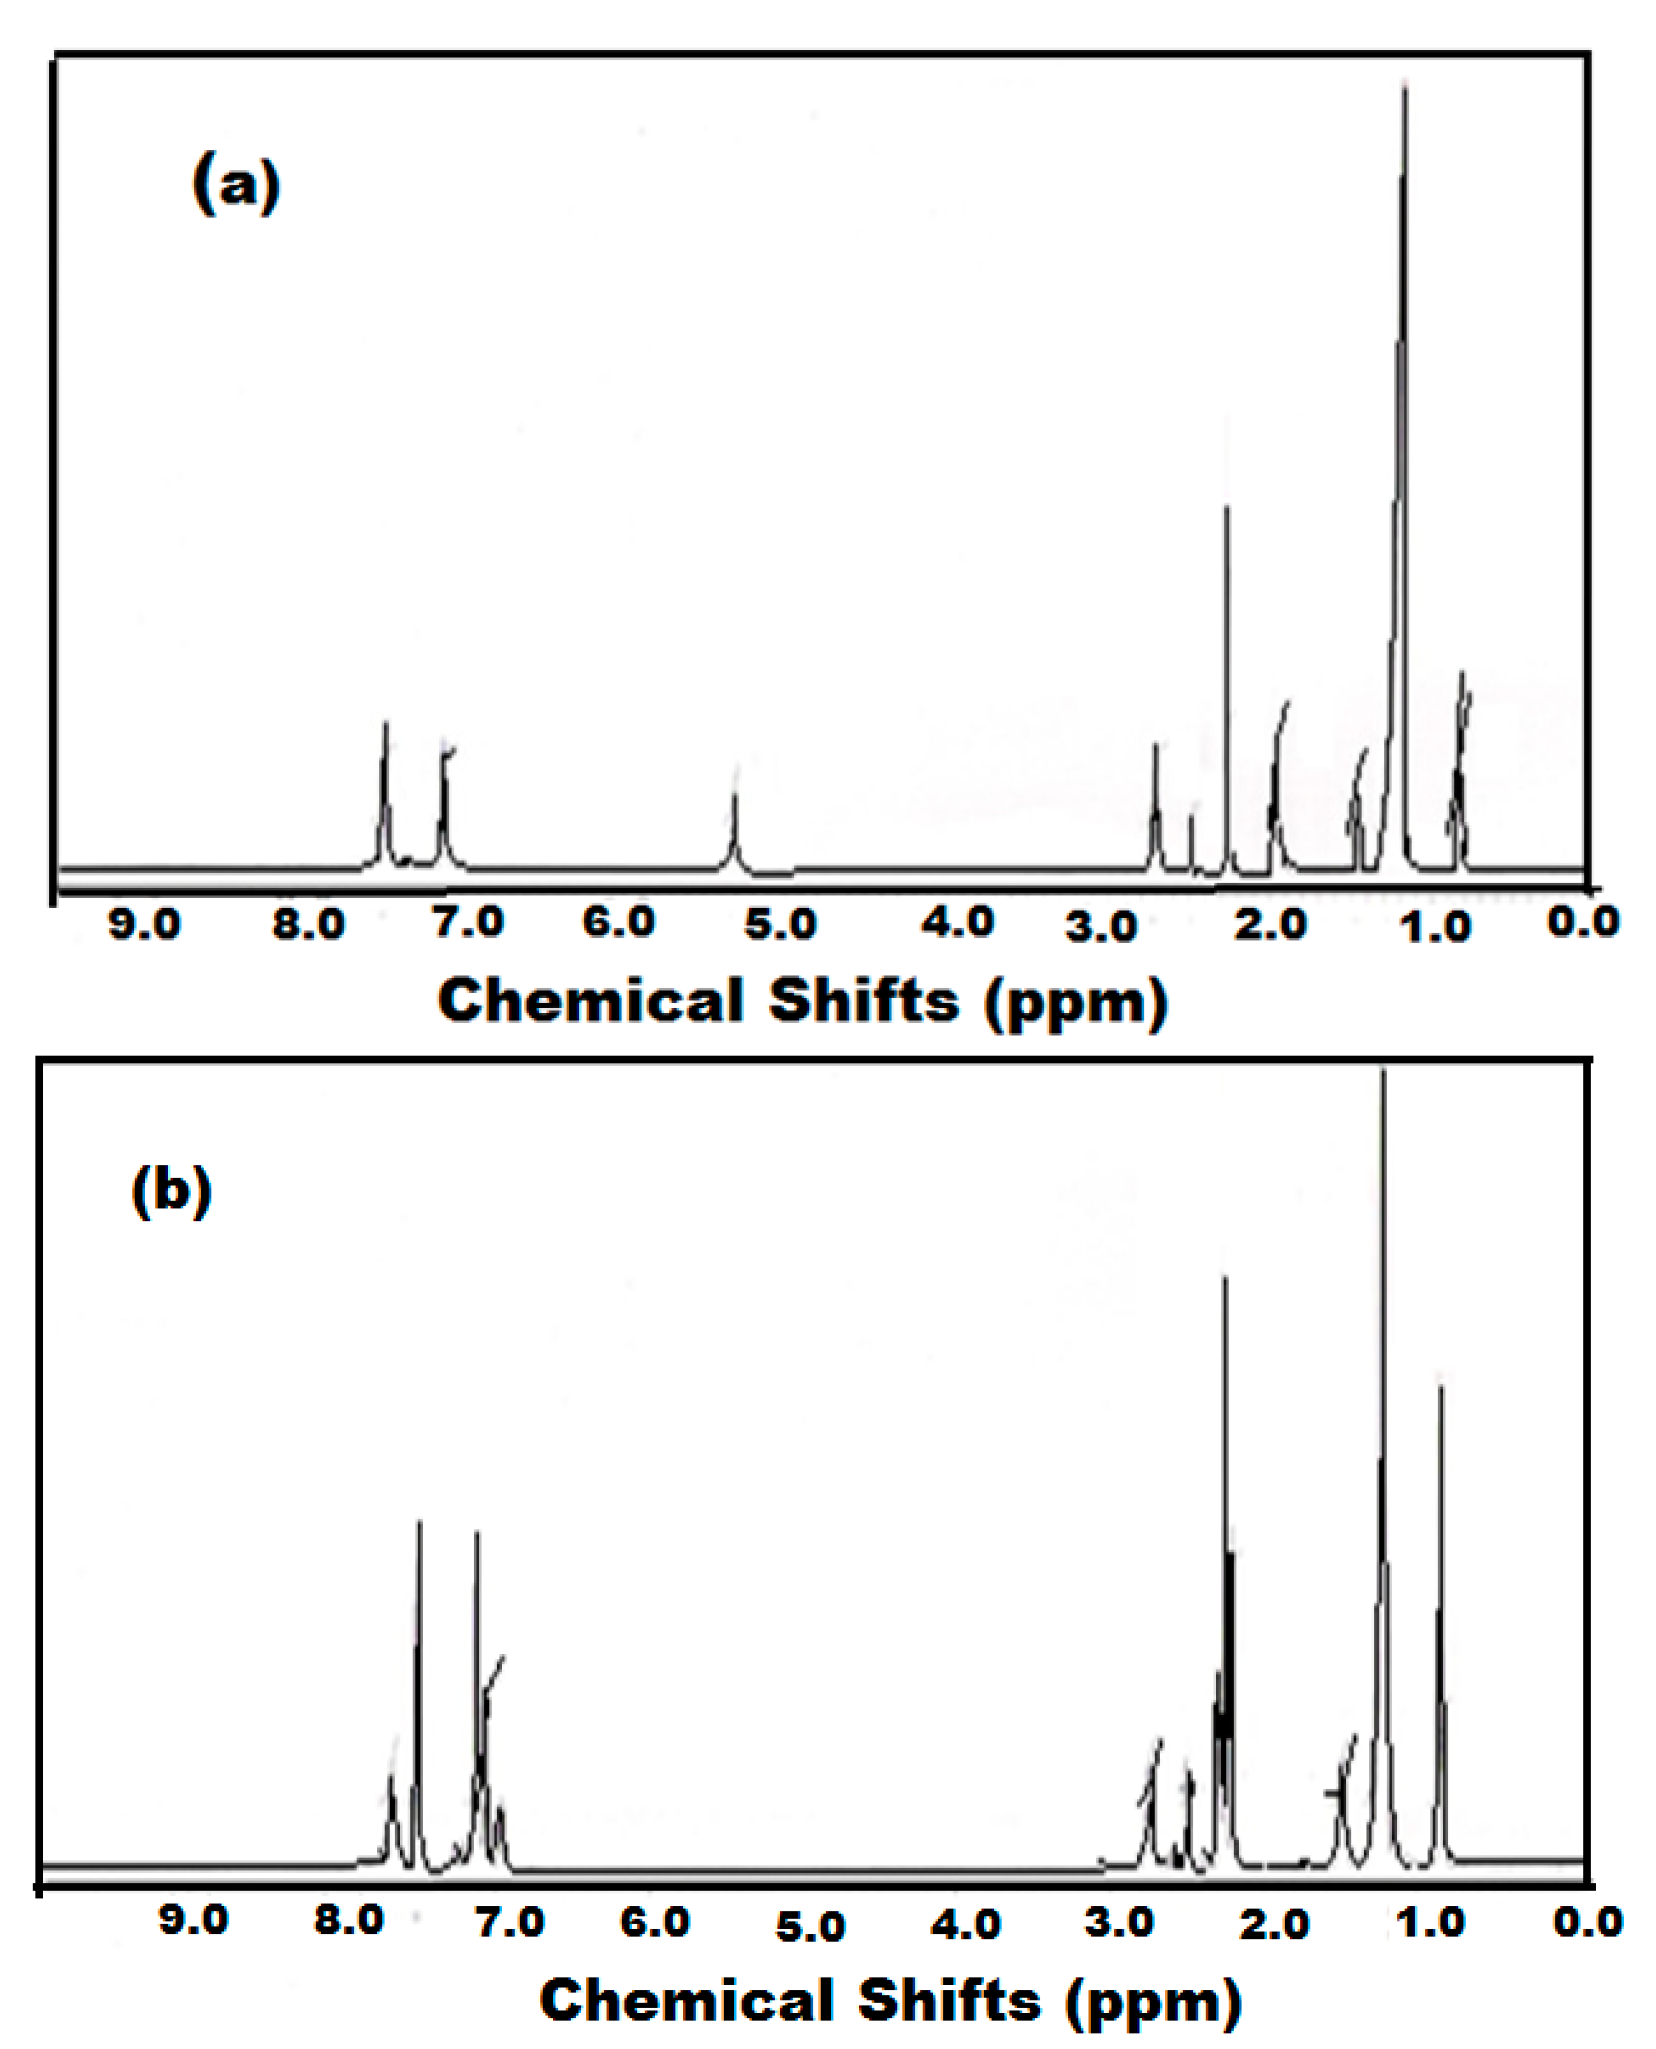
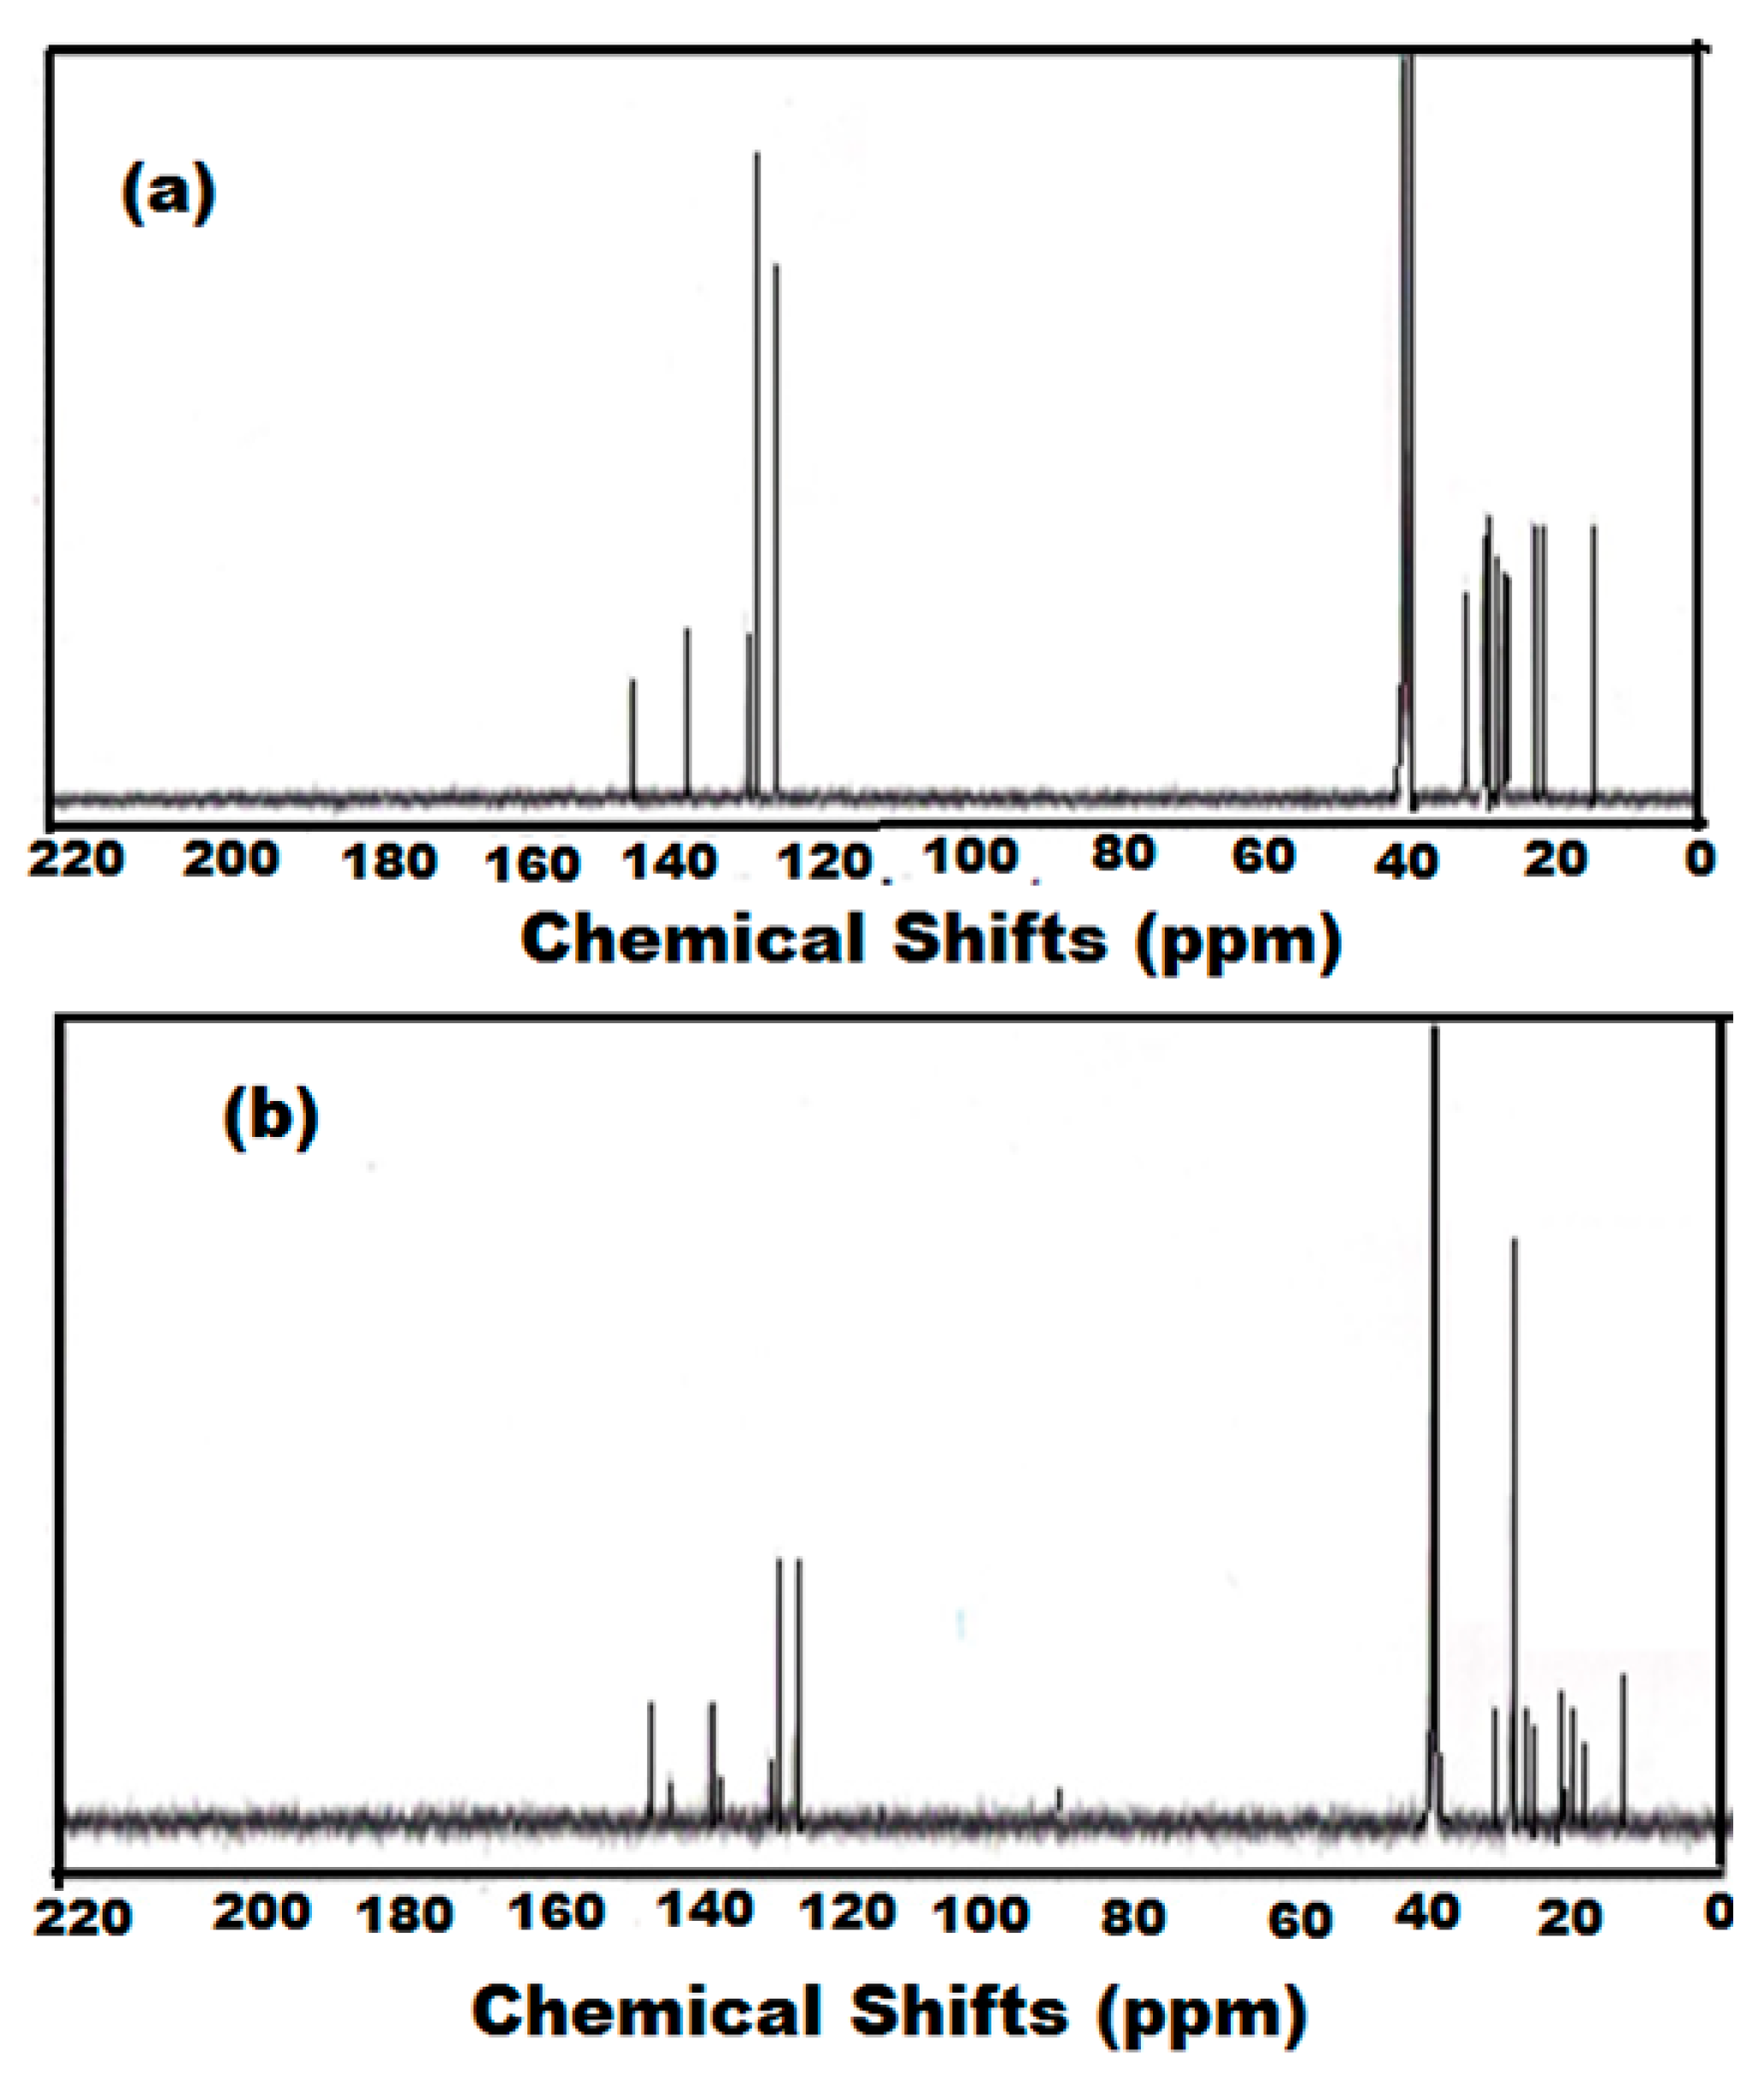
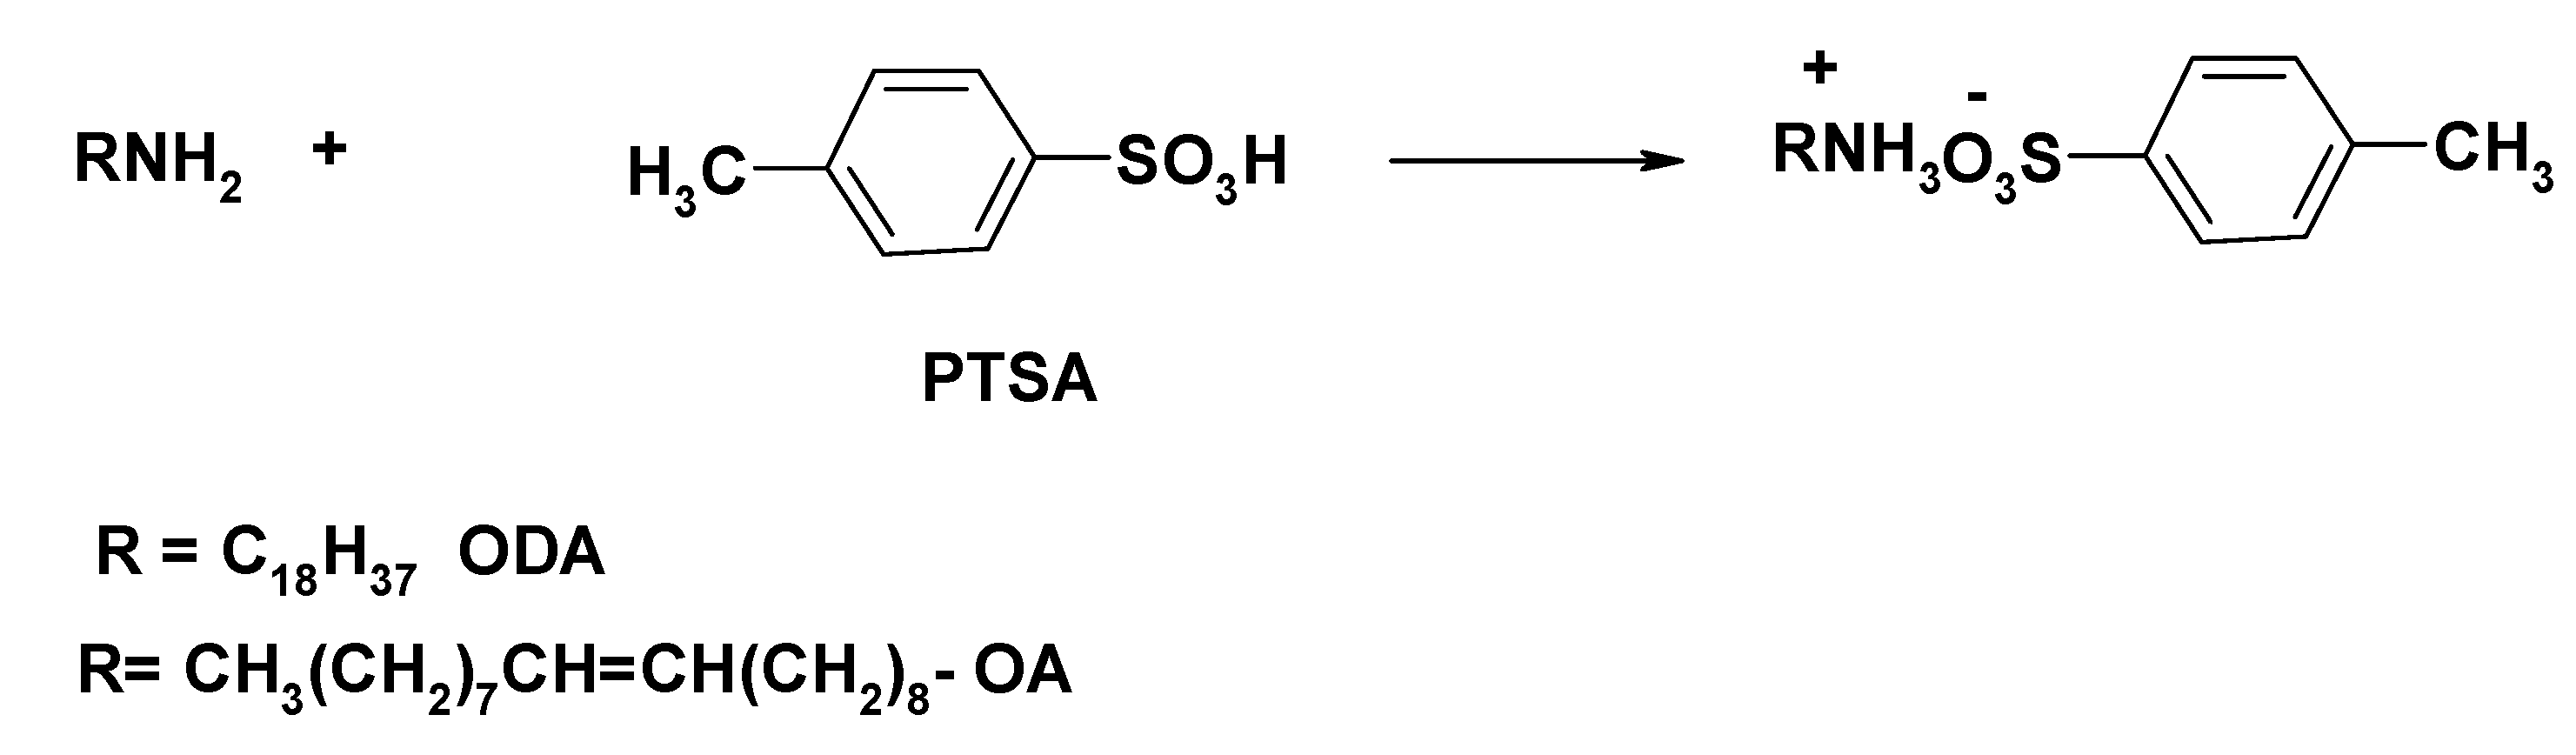
2.1. Preparation of Octadecylammonium Tosylate (ODA-TS) and Oleylammonium Tosylate (OA-TS)


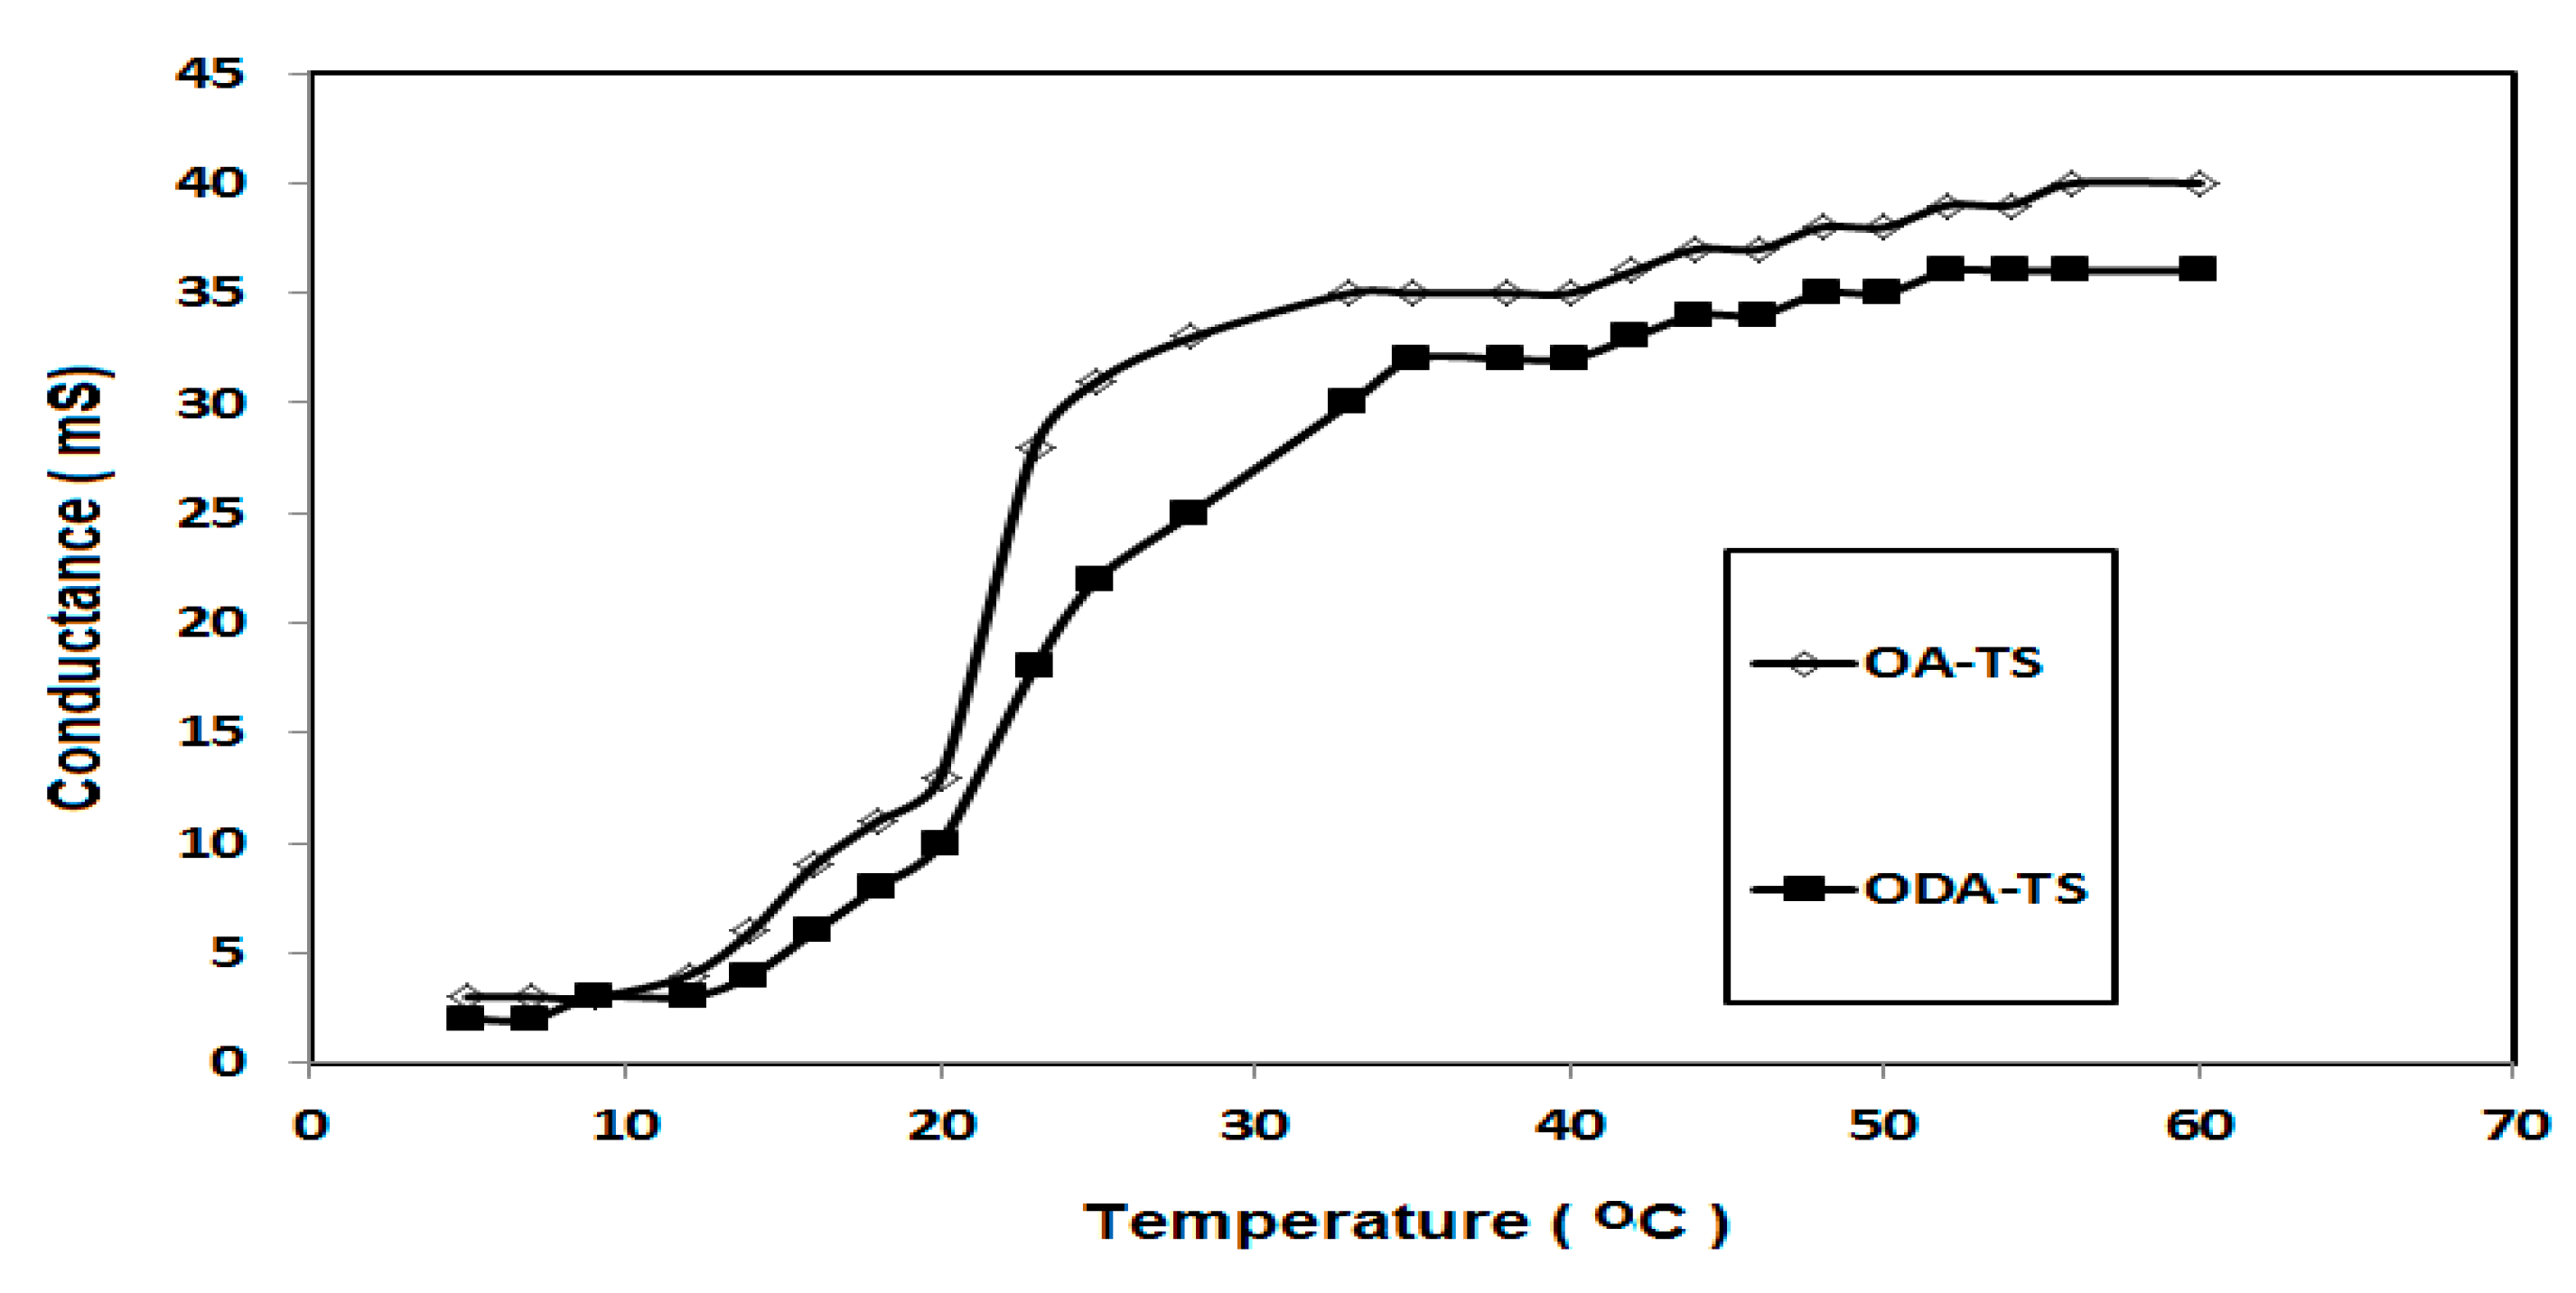
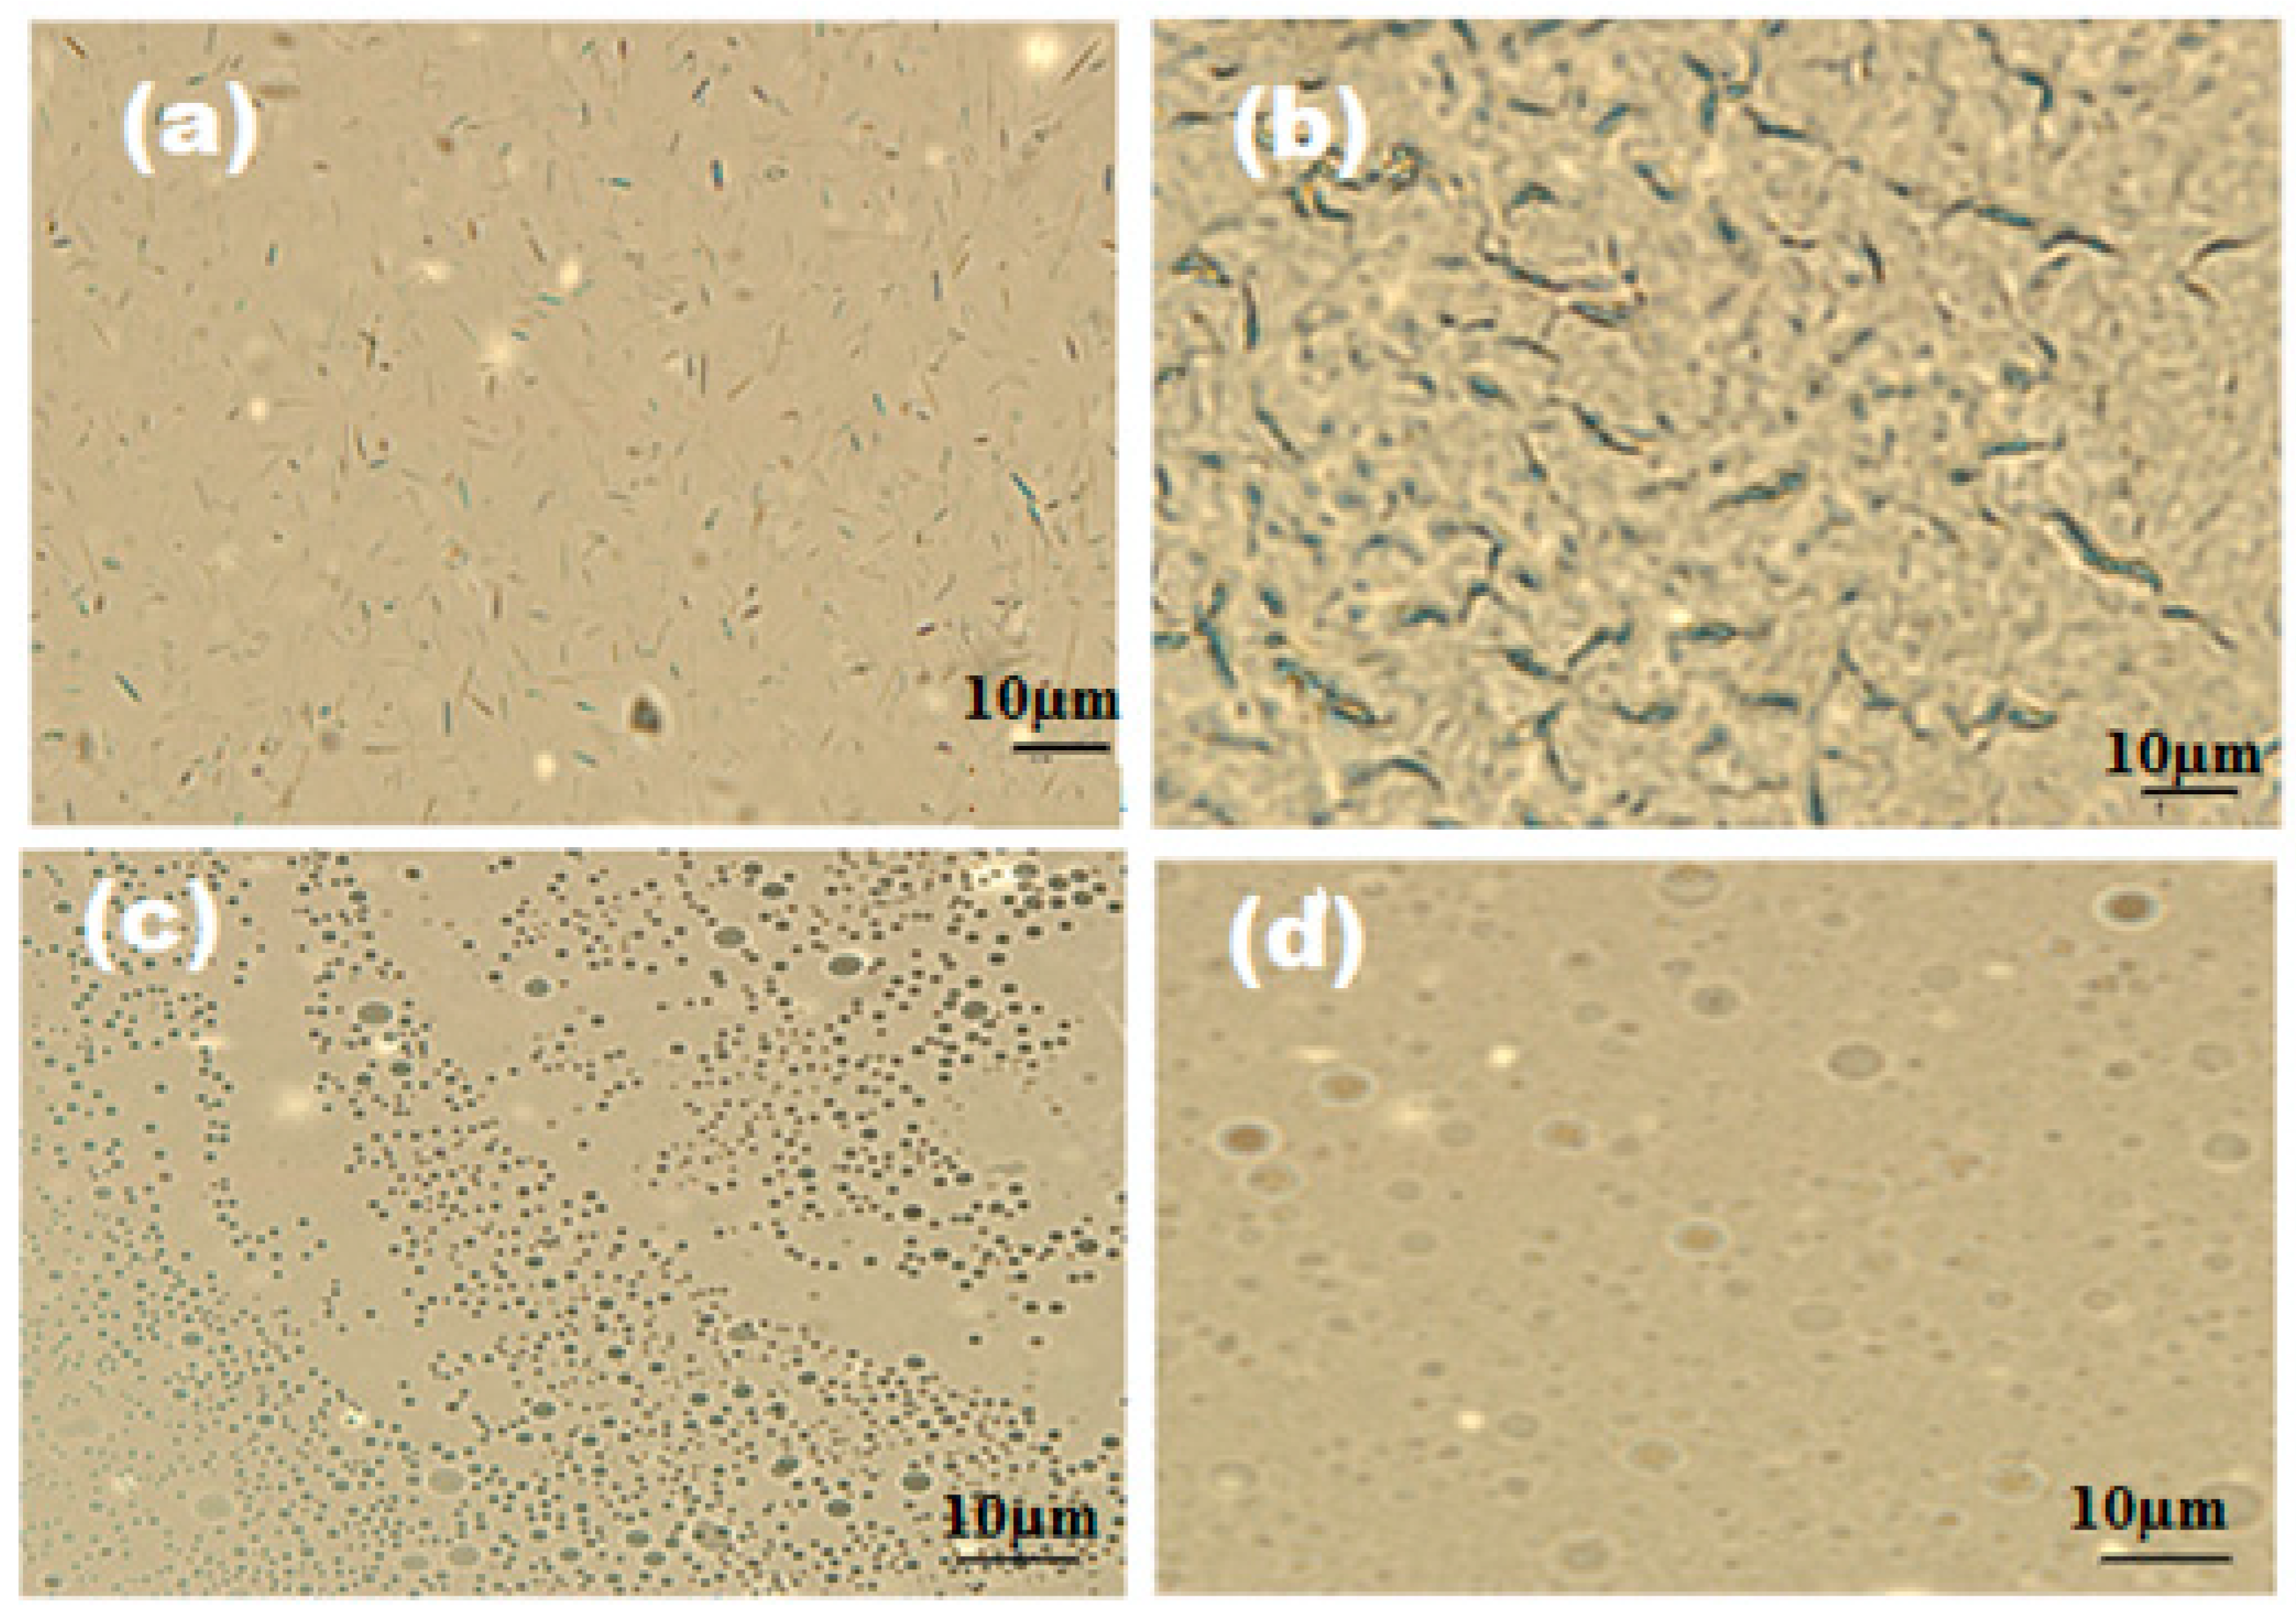
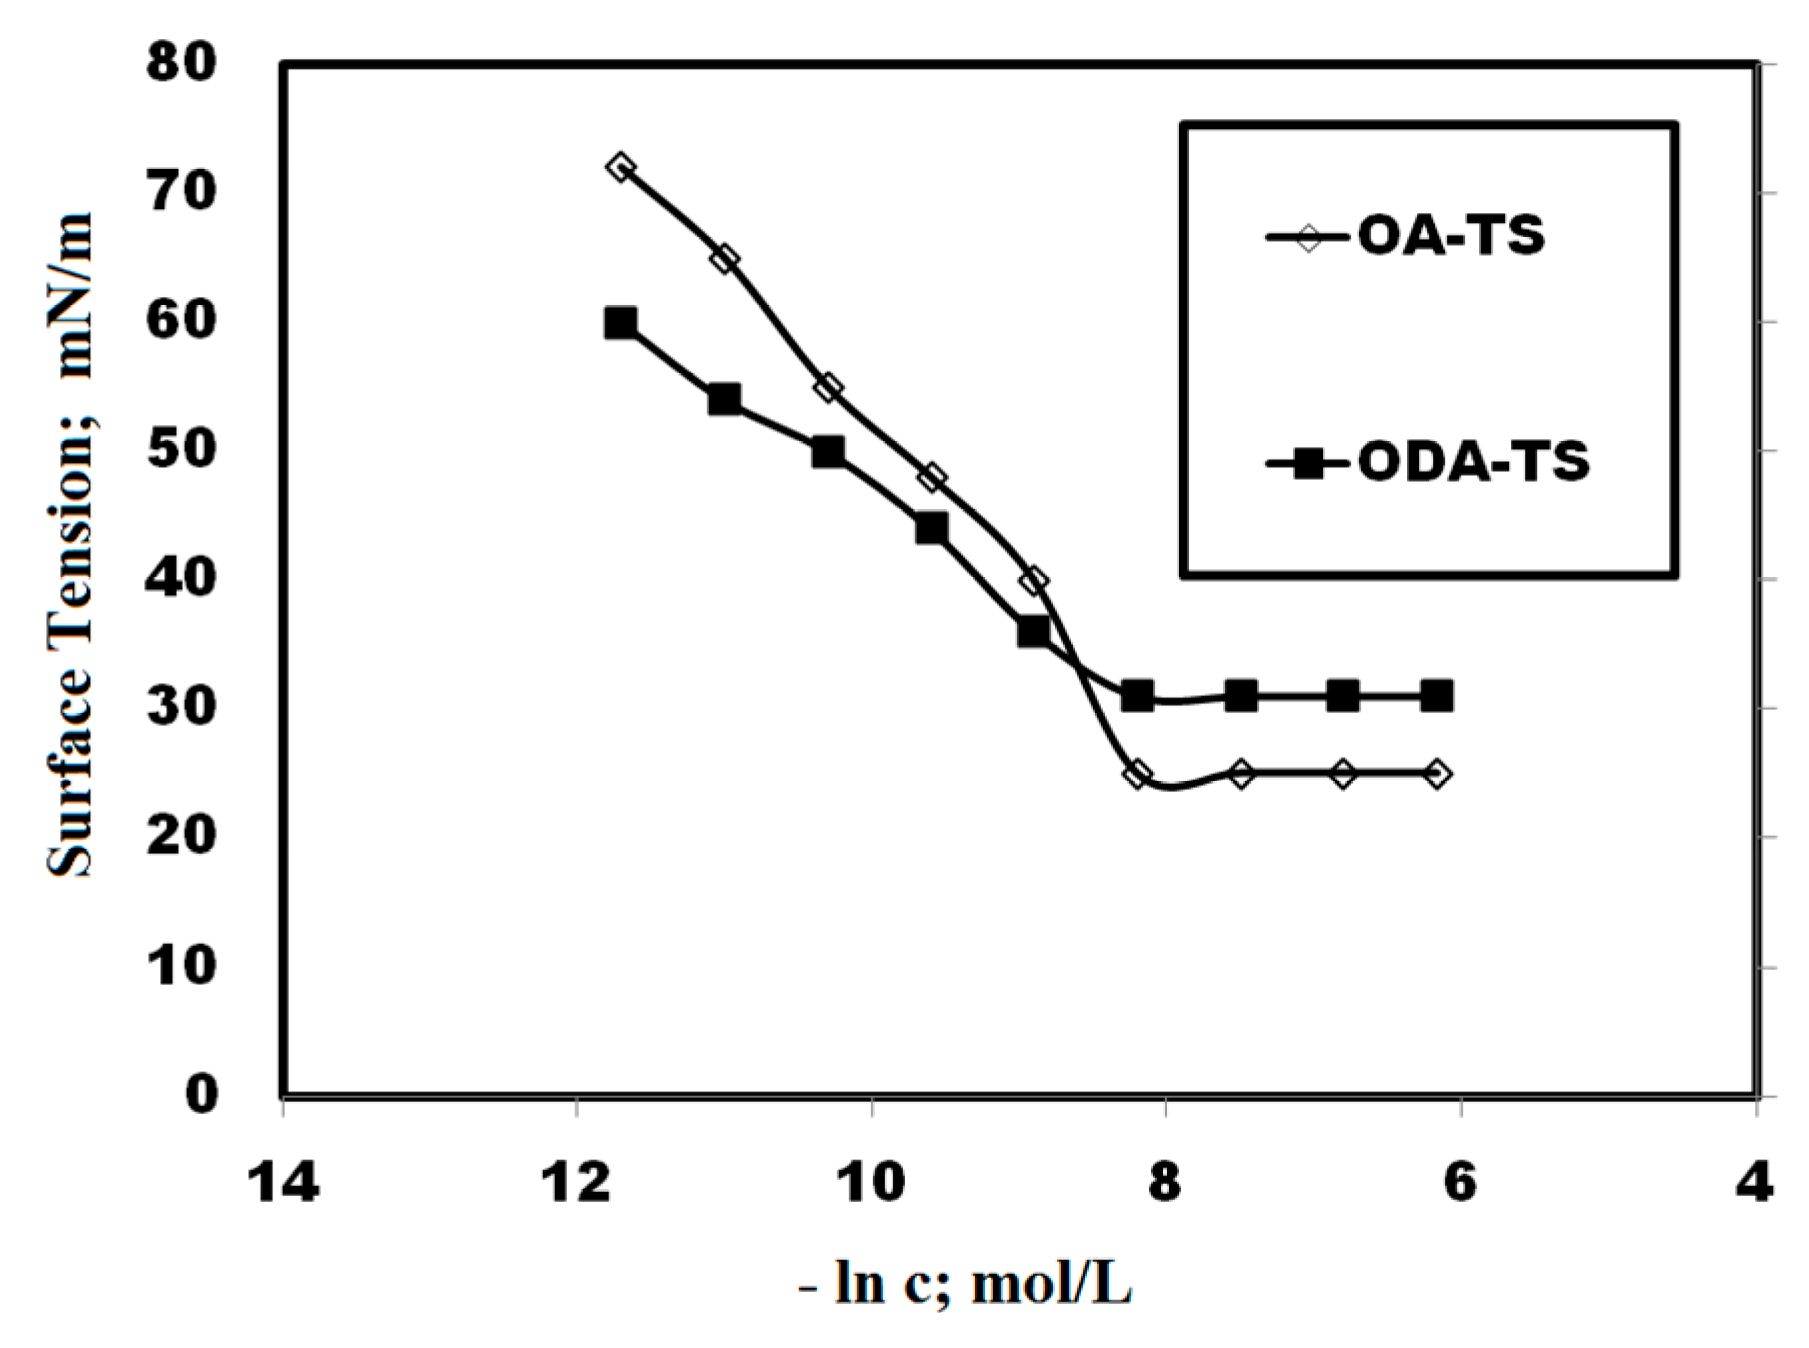
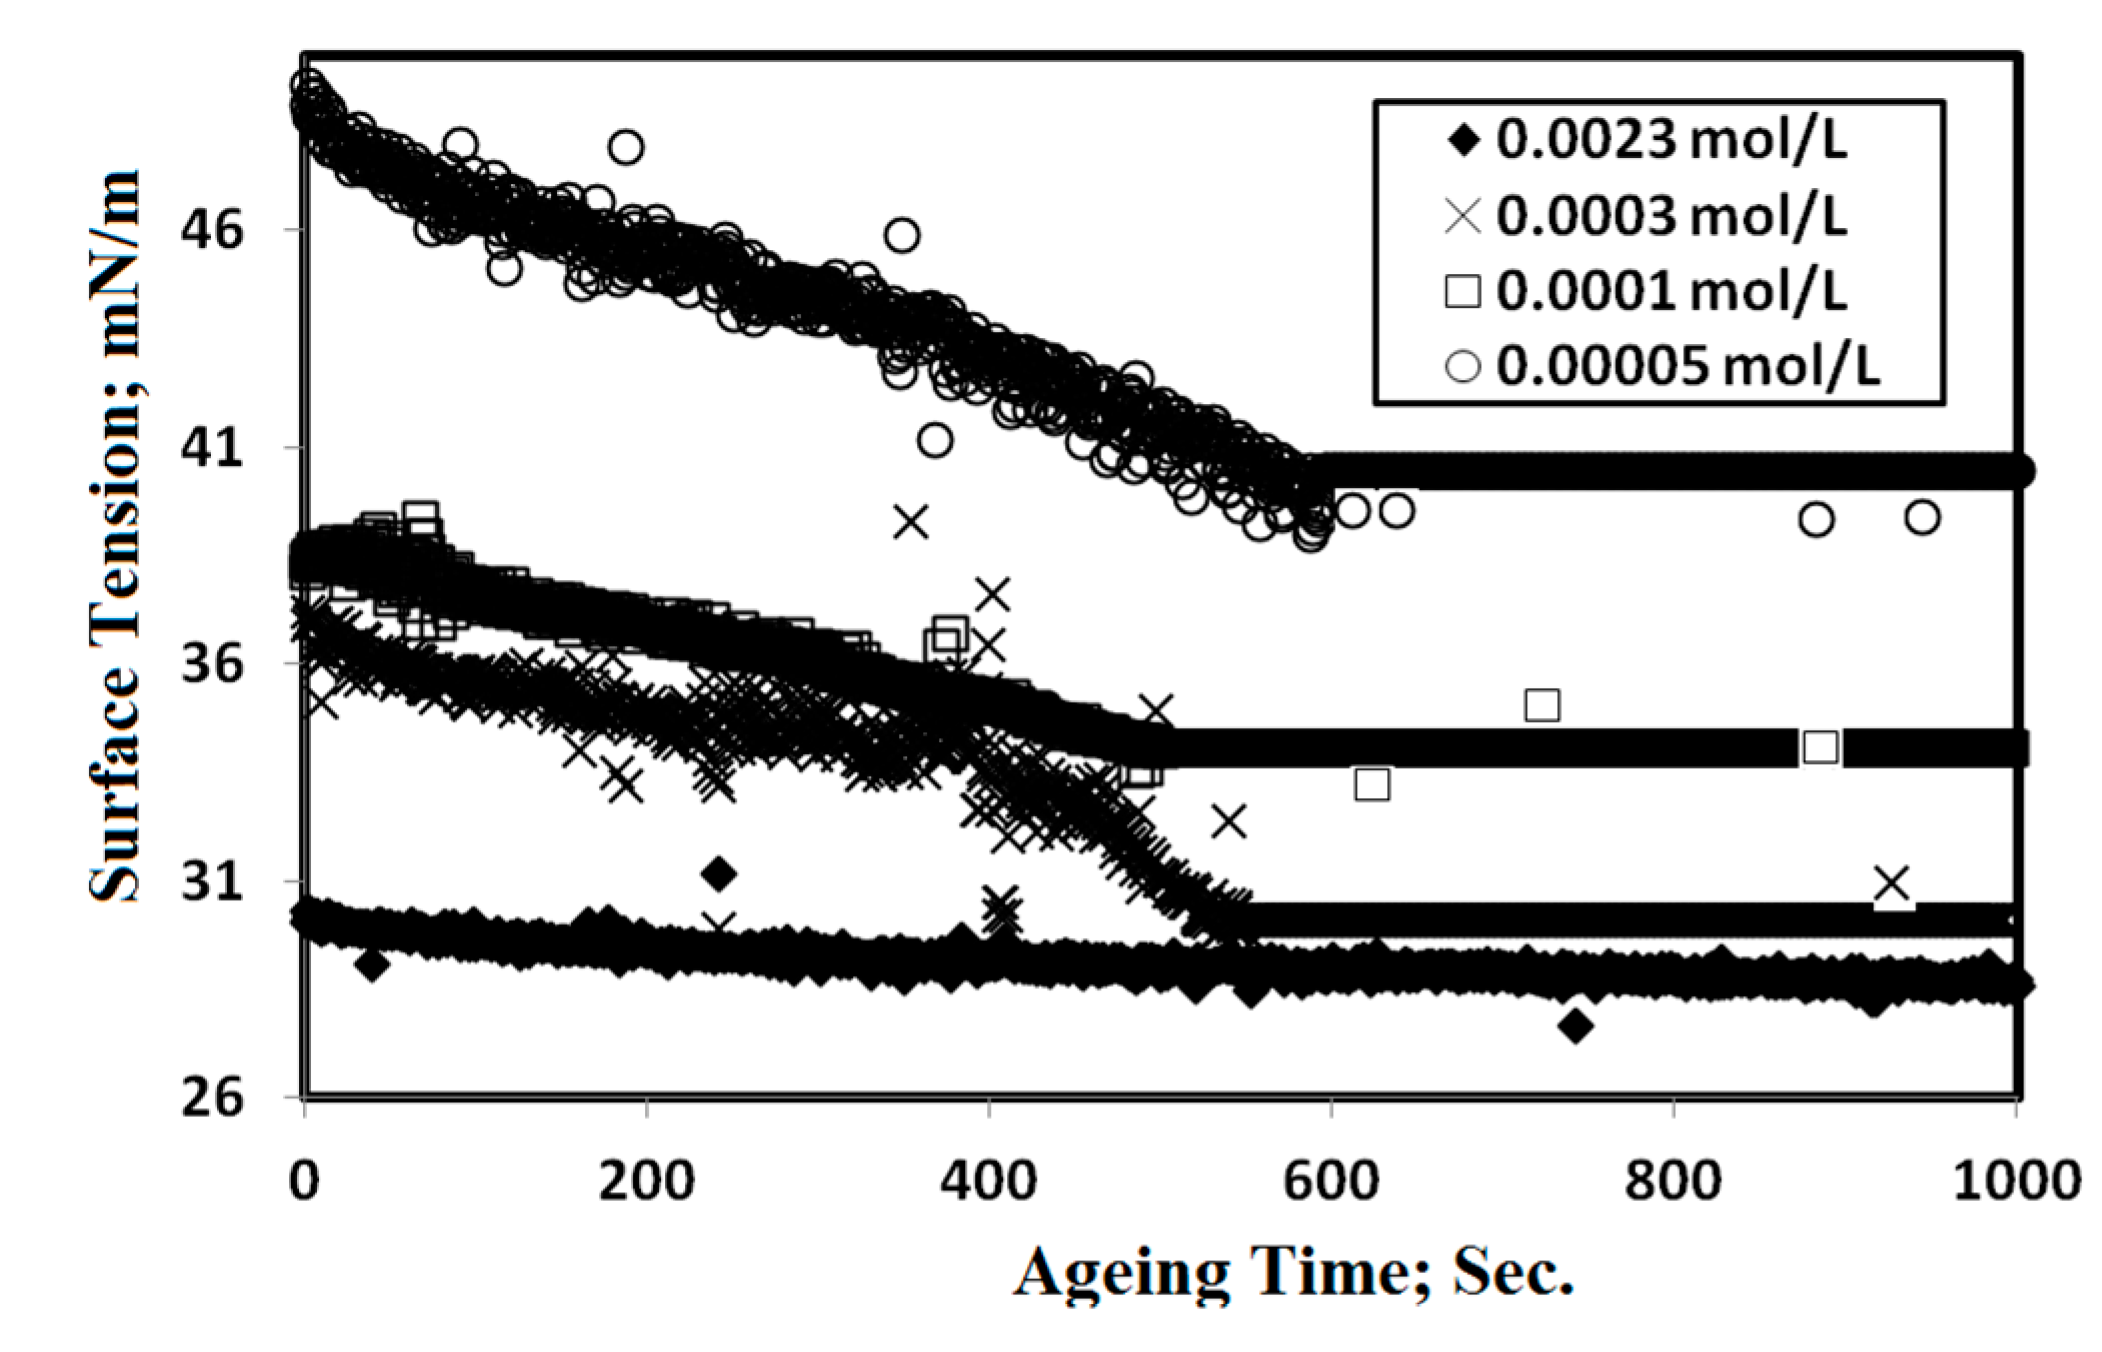
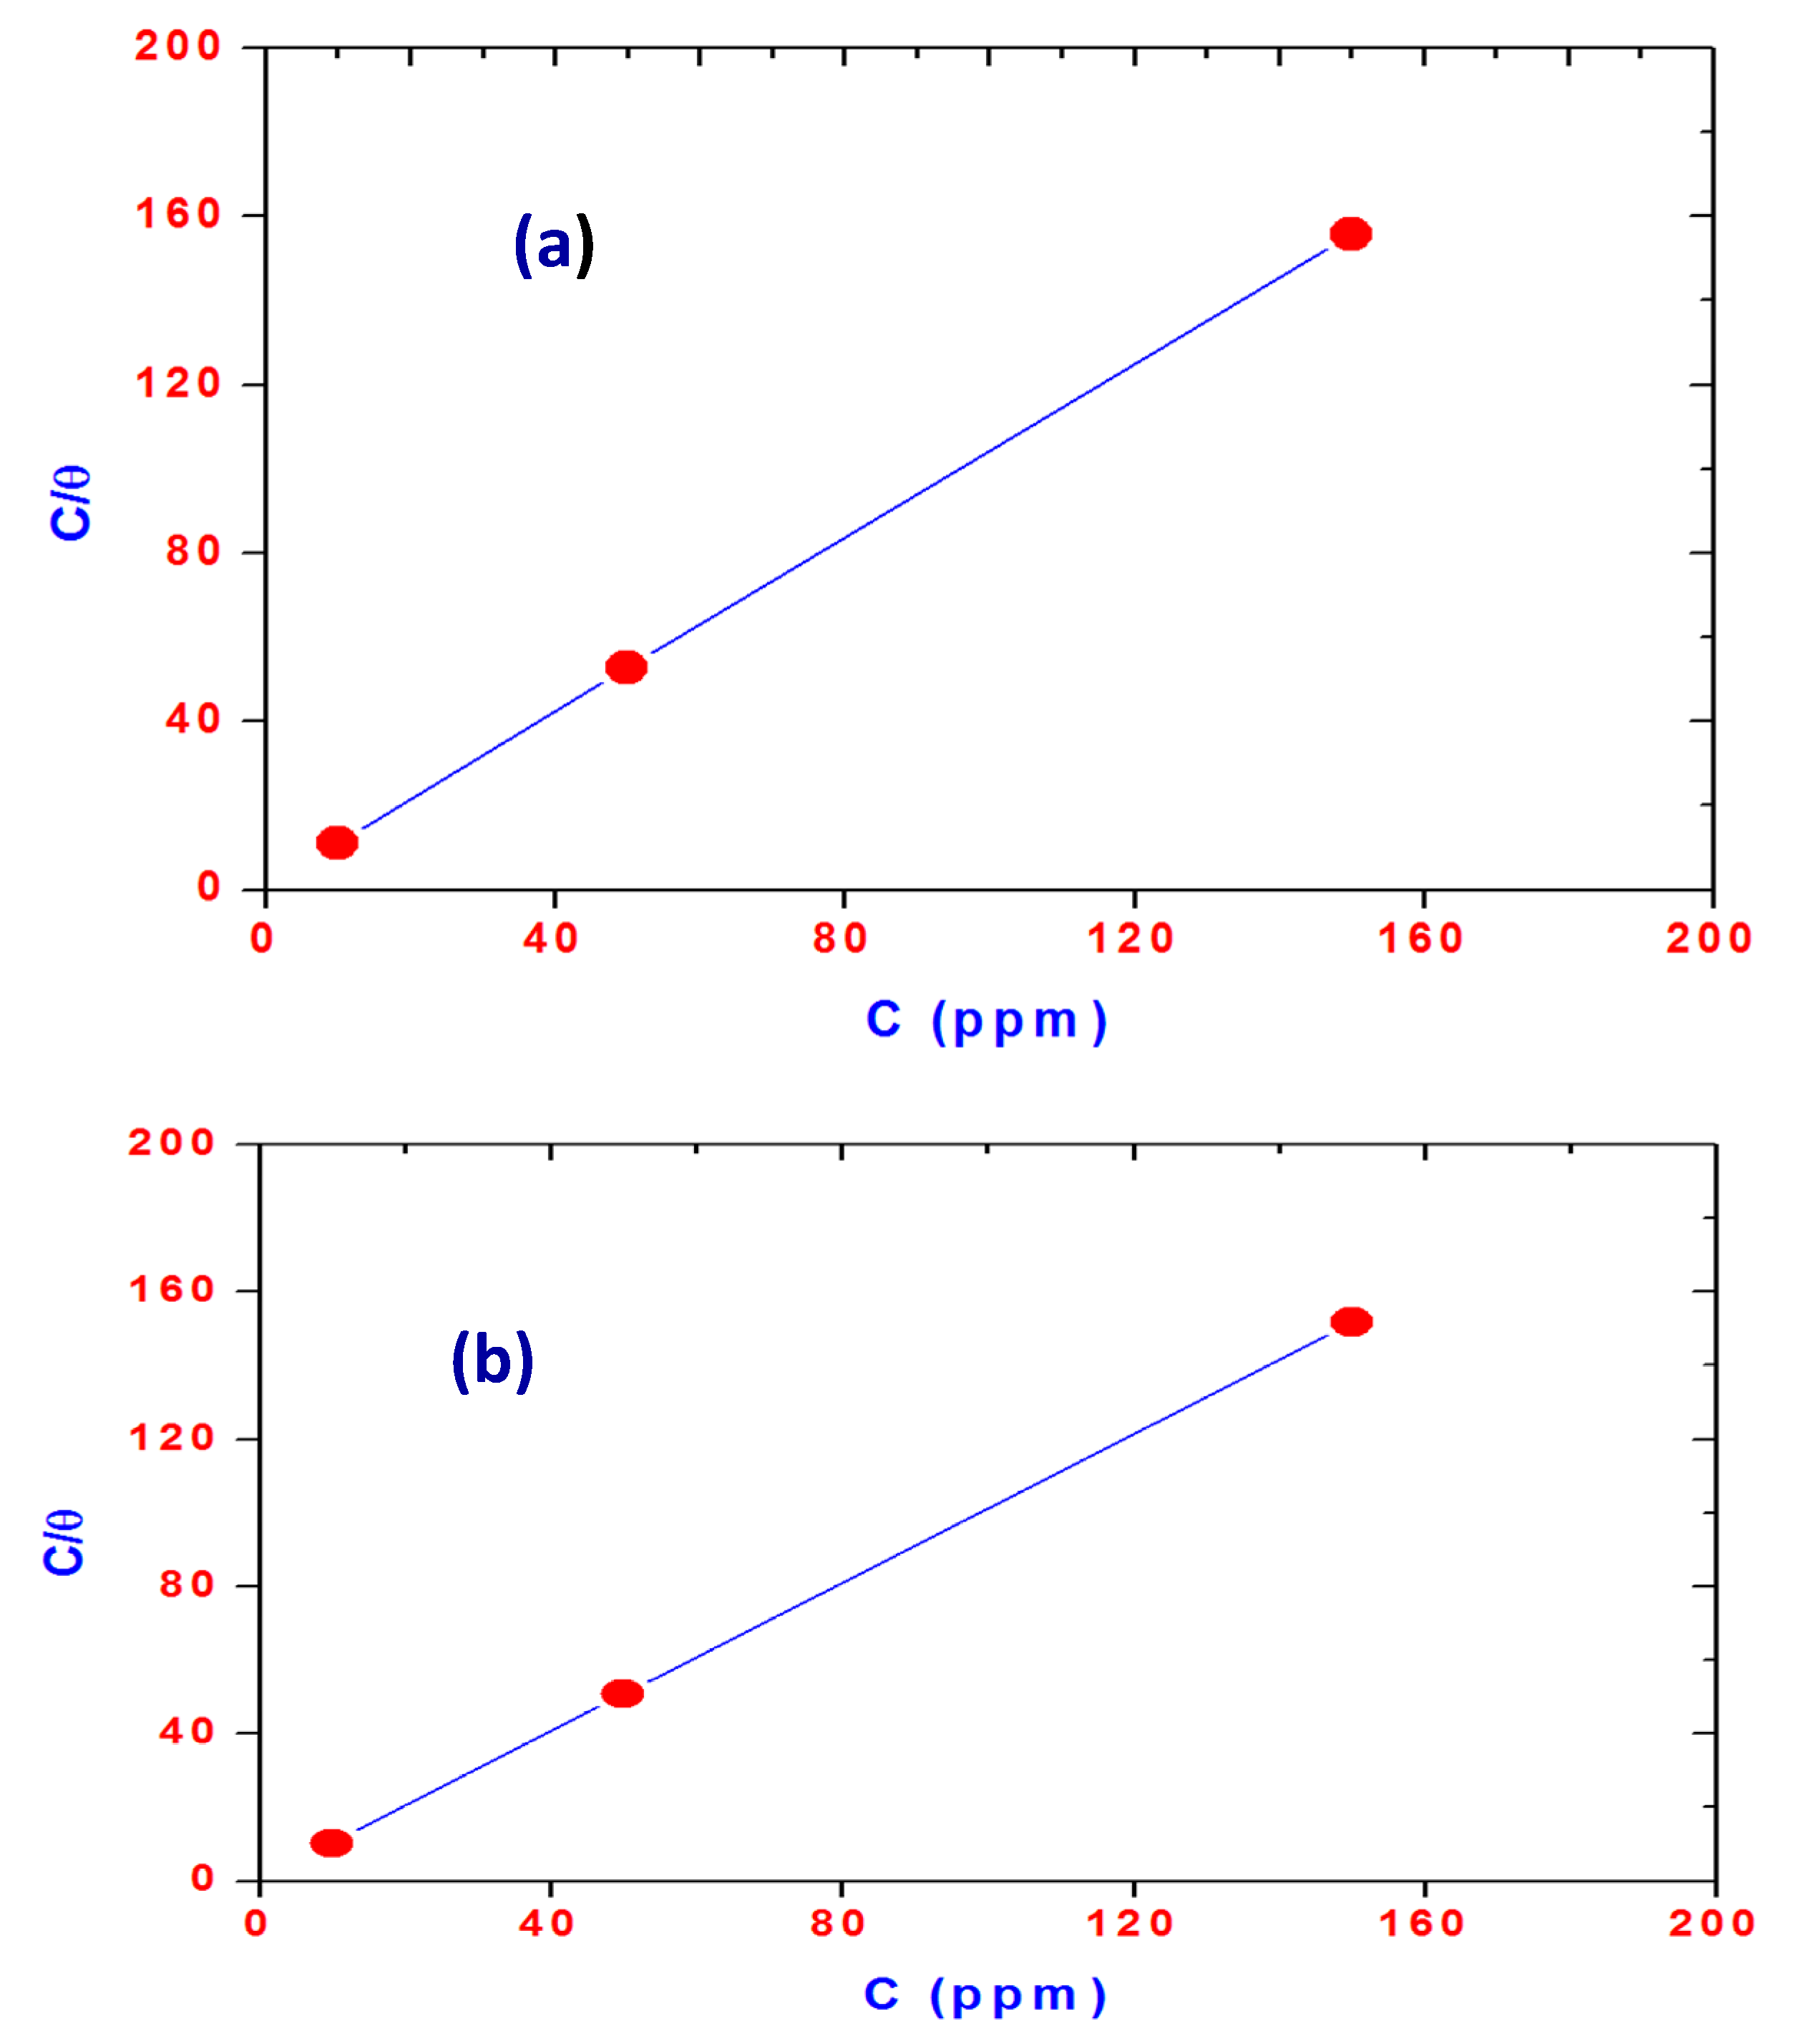
2.2. Surface Properties of OA-TS and ODA-TS


| Compounds | Cac mol/L | γcac mN/m | (−∂ γ/∂ lnc) | Γmax × 10 10 mol/cm2 | Amin nm2/molecule | −ΔG kJ·mol−1 | |
|---|---|---|---|---|---|---|---|
| ΔGagg | ΔGads | ||||||
| ODA-TS | 0.0002 | 31.3 | 8.41 | 3.51 | 0.047 | 20.39 | 21.55 |
| OA-TS | 0.0004 | 25.1 | 13.14 | 5.50 | 0.030 | 18.73 | 19.58 |
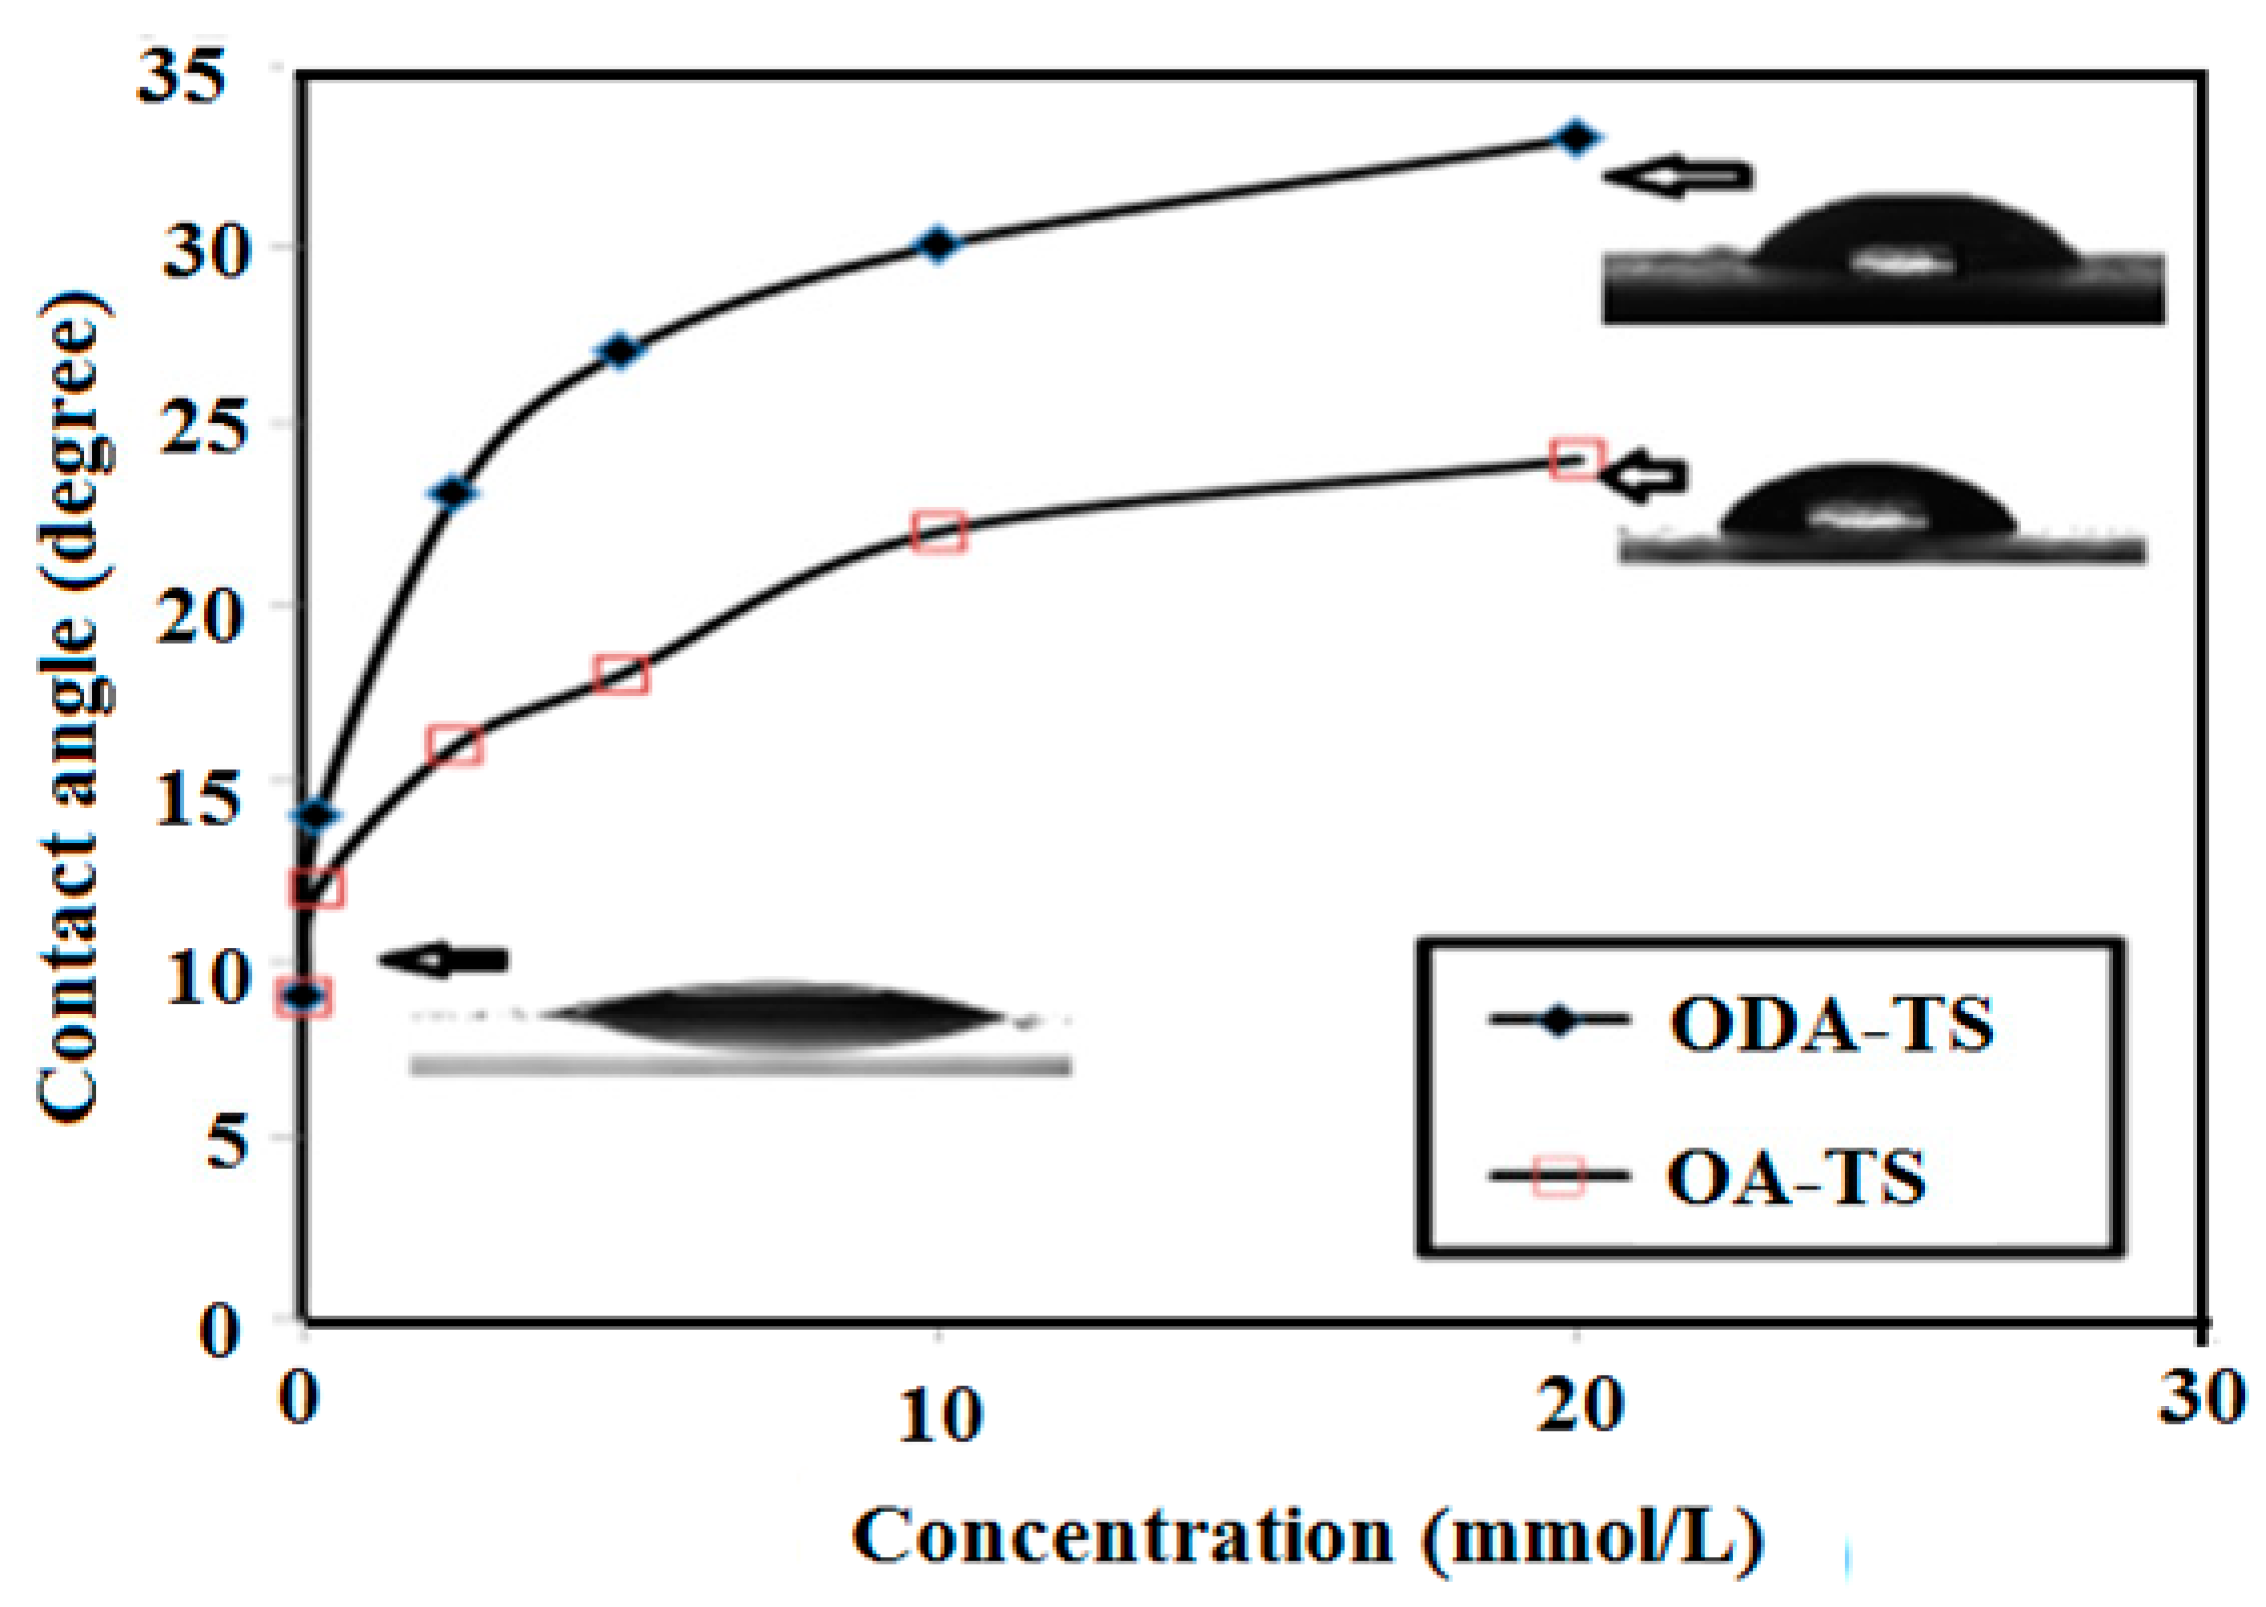
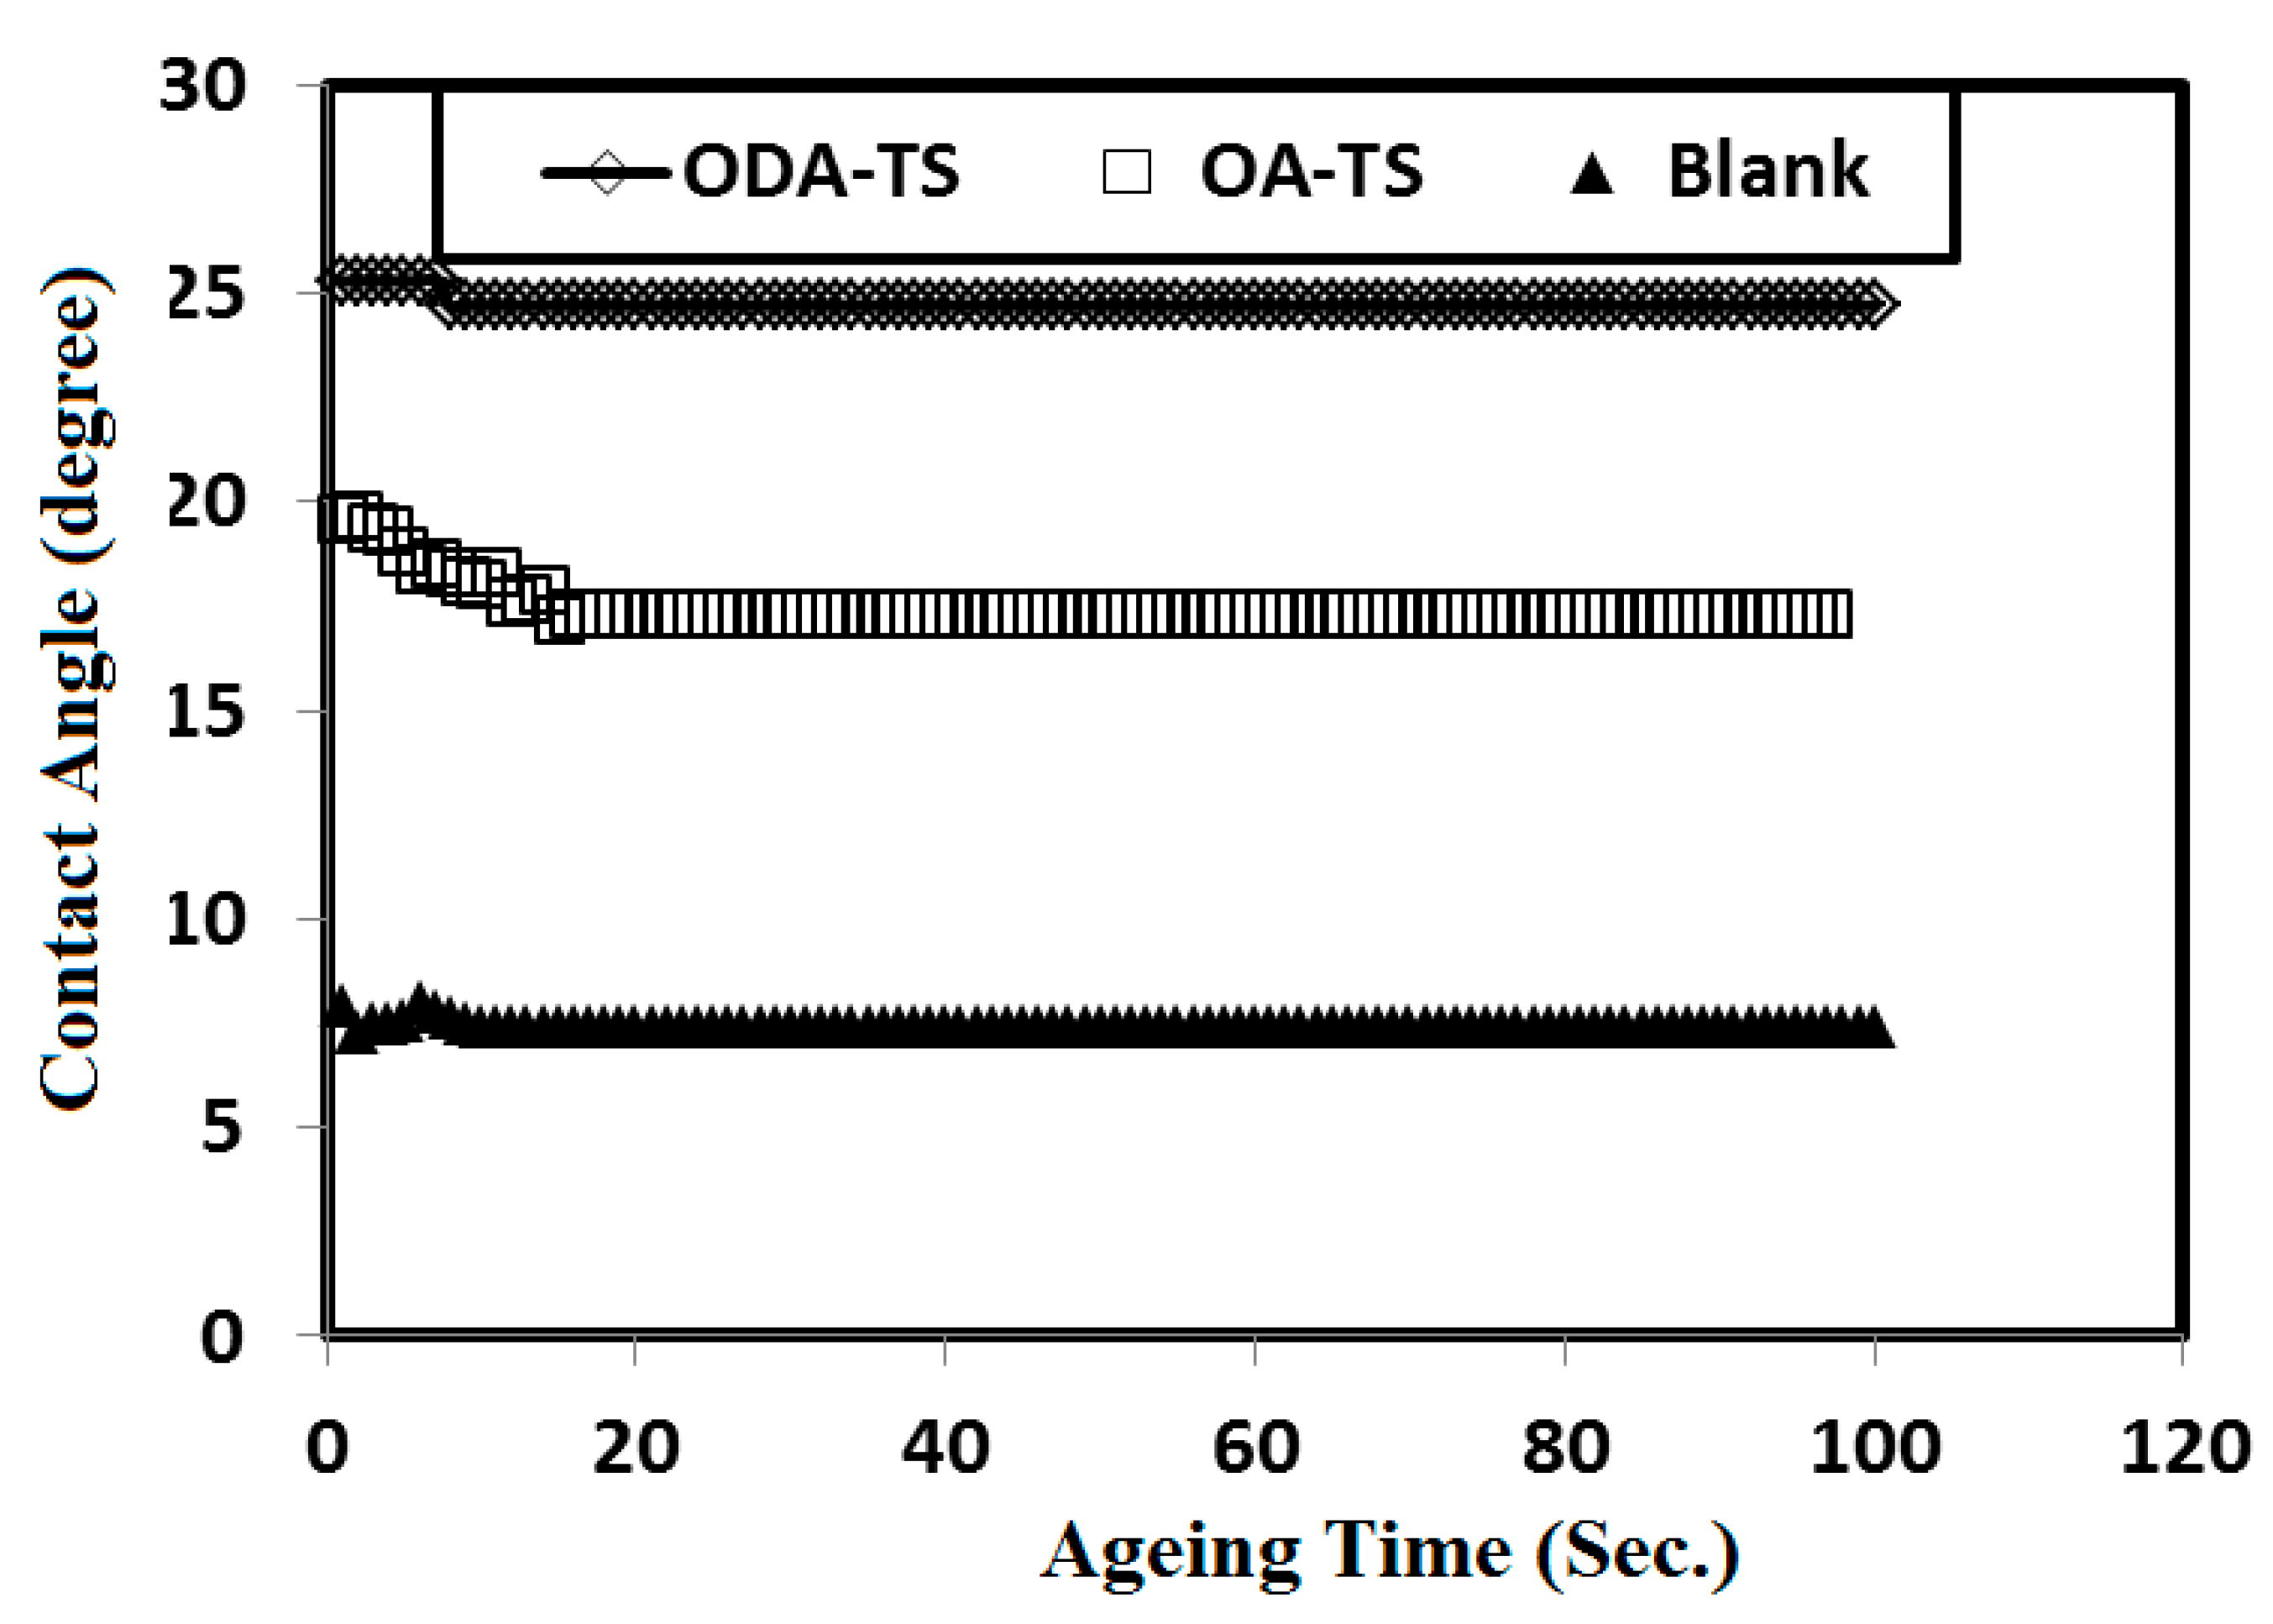
2.3. Contact Angle and Surface Free Energy Measurements

| Concentrations (mmol/L) | Surface Free Energy (mJ/m2) | |
|---|---|---|
| ODA-TS | OA-TS | |
| 0 | 5.1 | 5.1 |
| 0.272 | 8.9 | 6.5 |
| 2.84 | 10.6 | 7.6 |
| 5.70 | 12.4 | 8.5 |
| 11.36 | 14.2 | 10.8 |
| 22.73 | 16.1 | 12.2 |
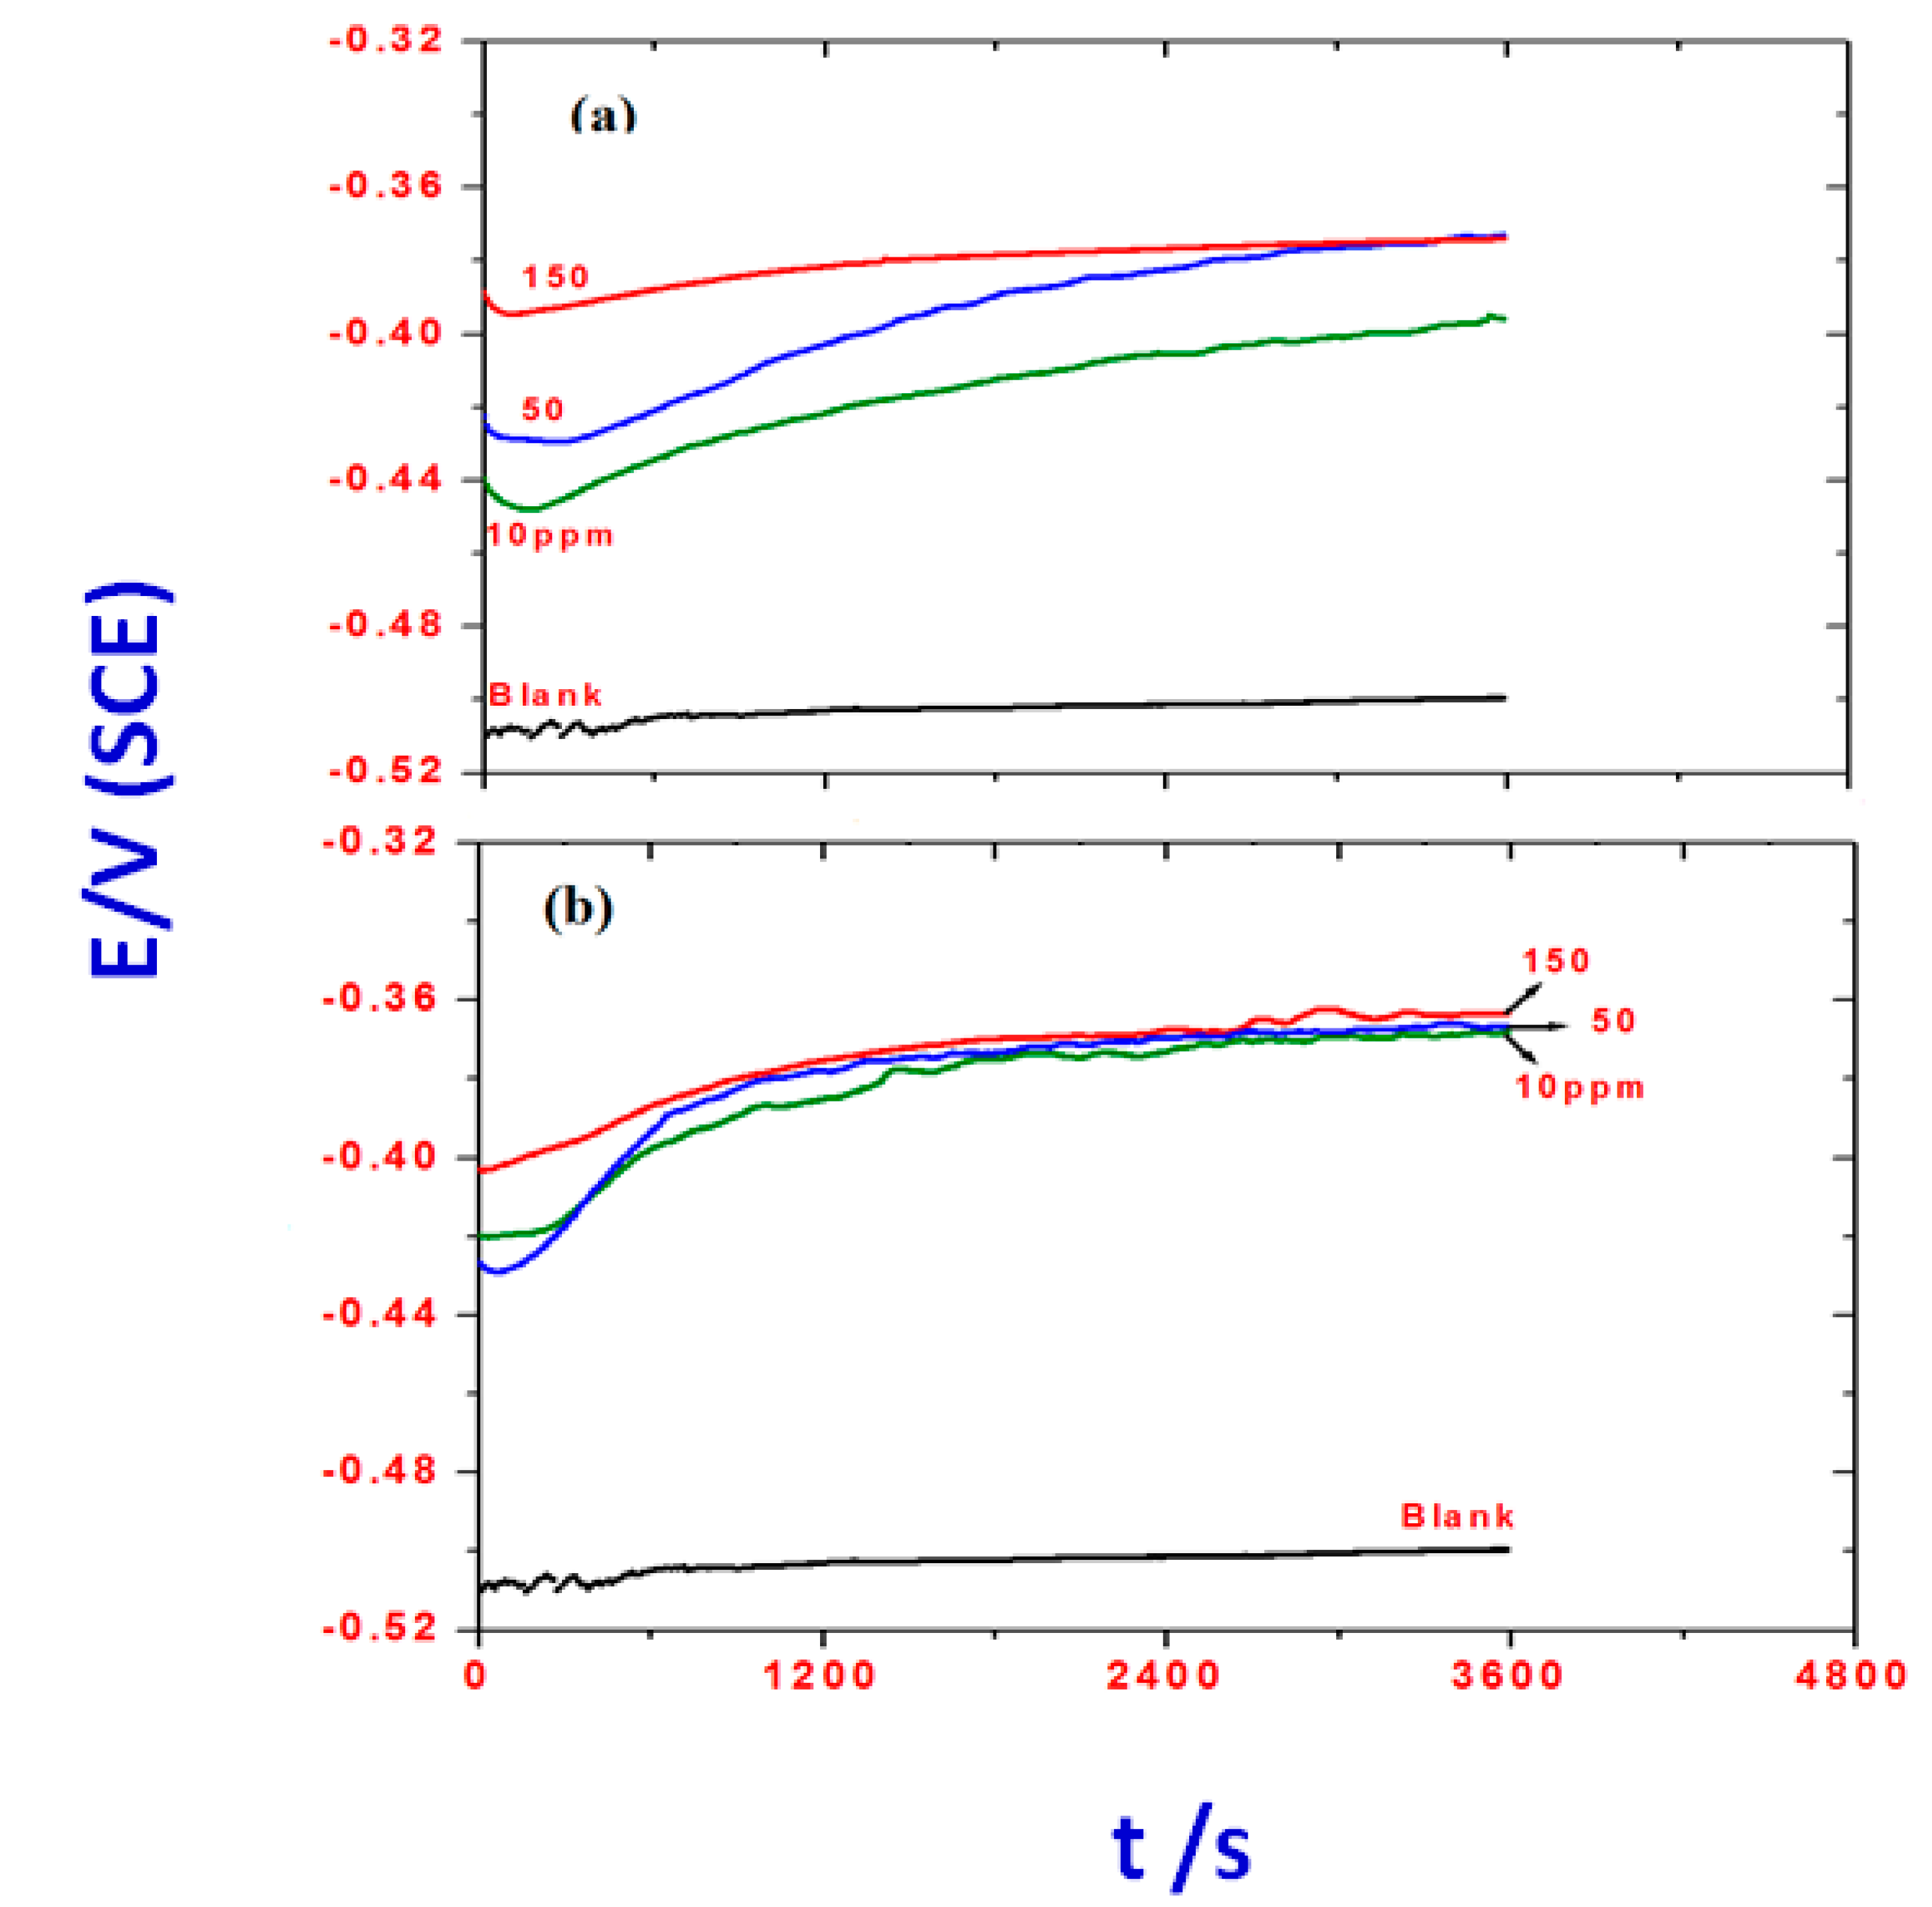
2.4. Monitoring the Open Circuit Potential (EOCP)

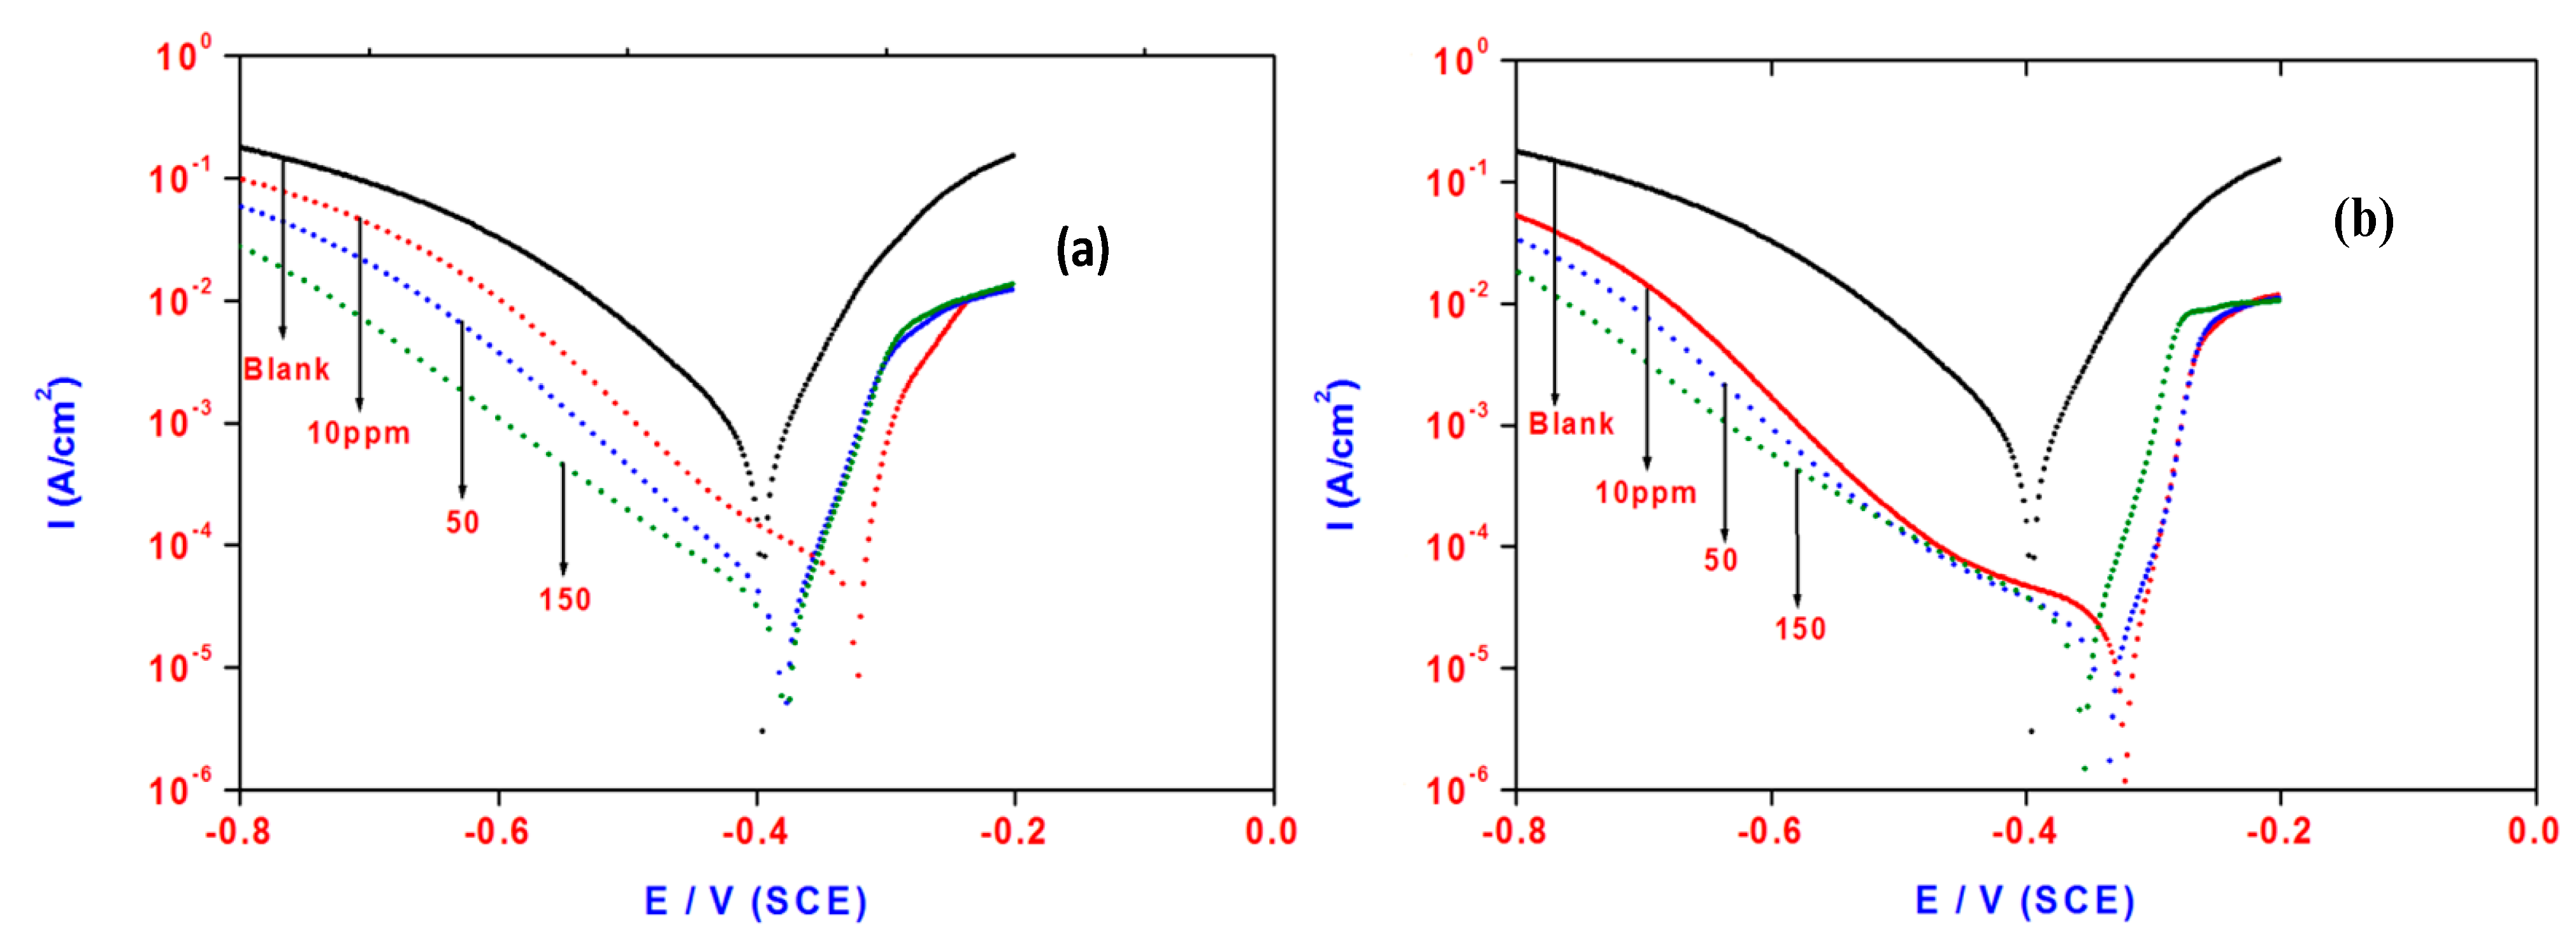
2.5. Polarization Measurements
| Concentrations (mmol/L) | Polarization Method | EIS Method | |||||||
|---|---|---|---|---|---|---|---|---|---|
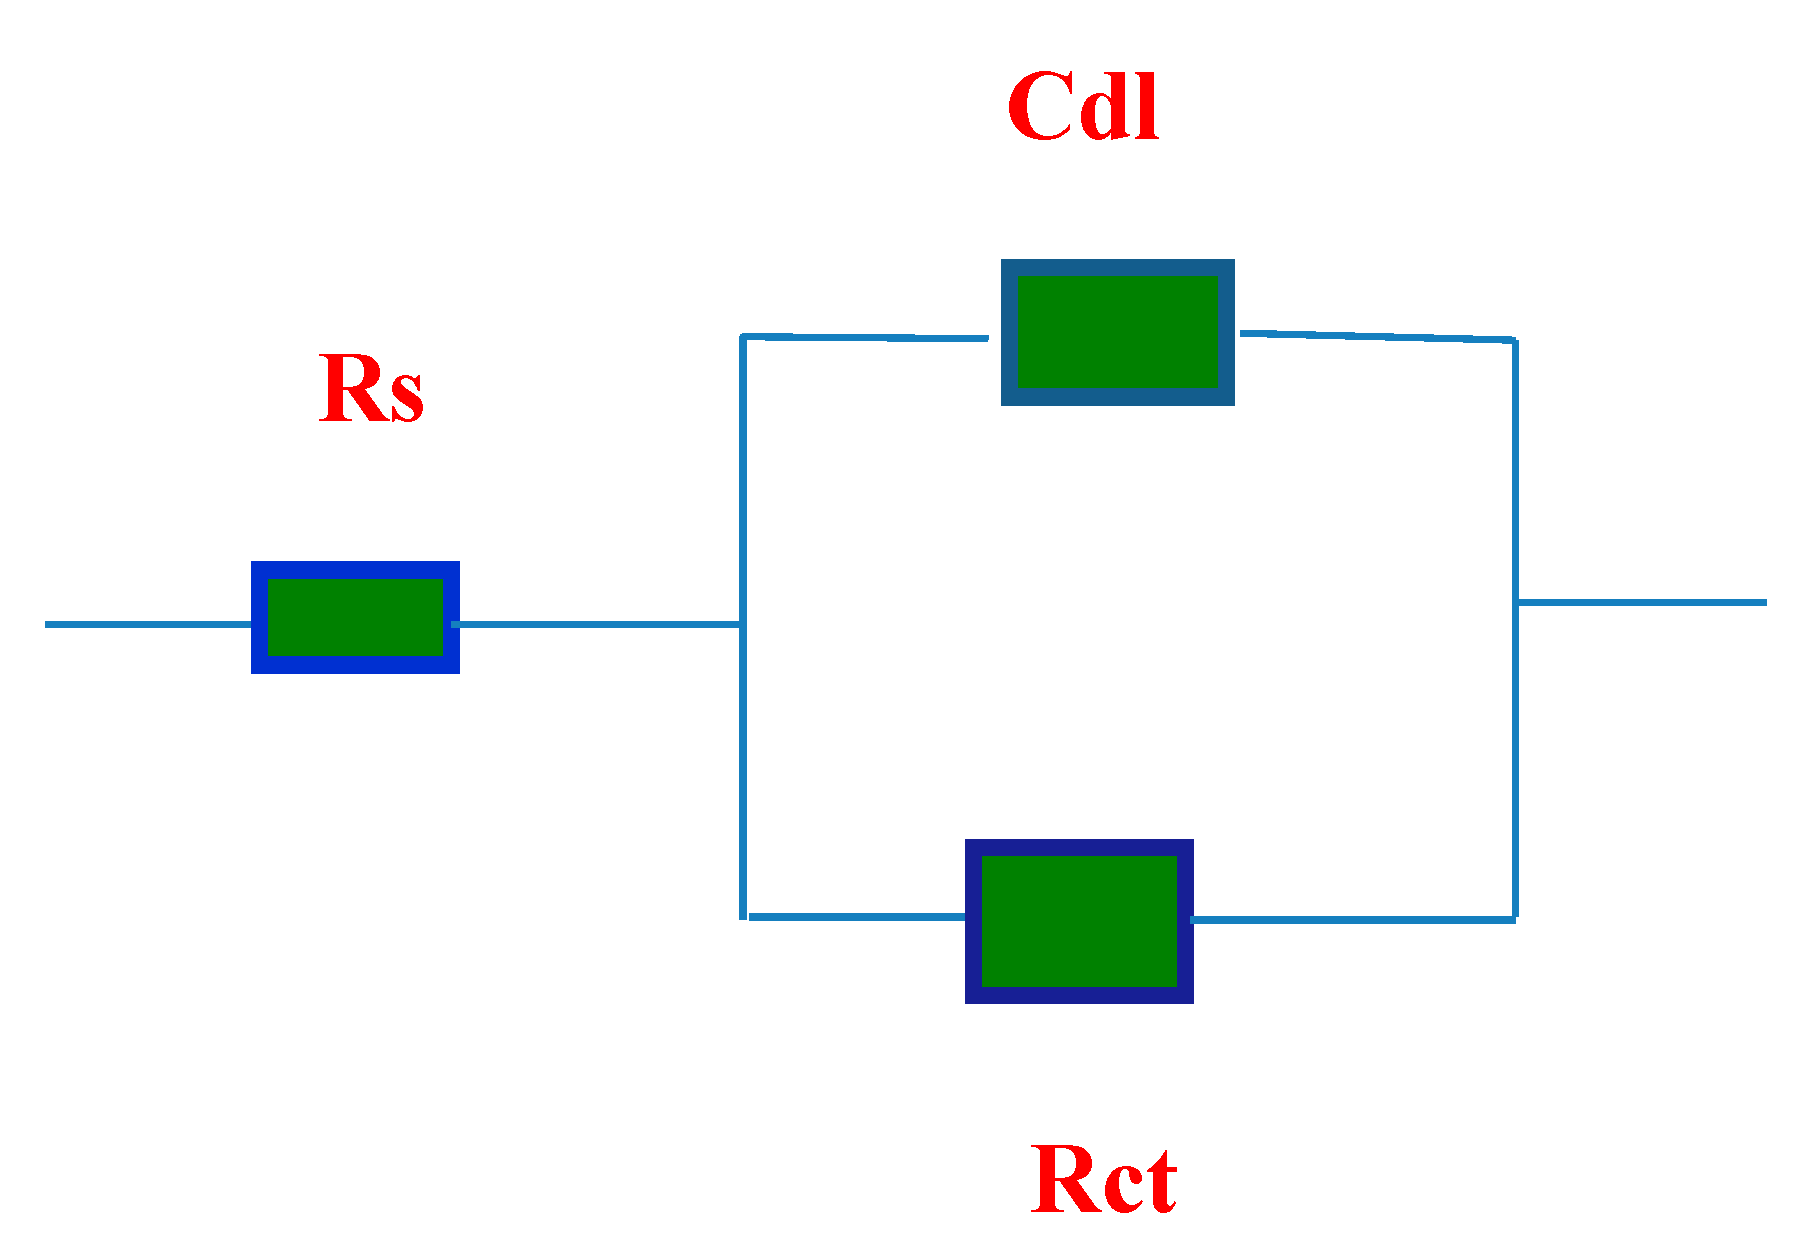
| ba (mV) | bc (mV) | Ecorr (V) | Icorr μA/cm2 | C.R. mm/year | IE% | Rct Ohm | Cdl (μF/cm2) | IE% | |
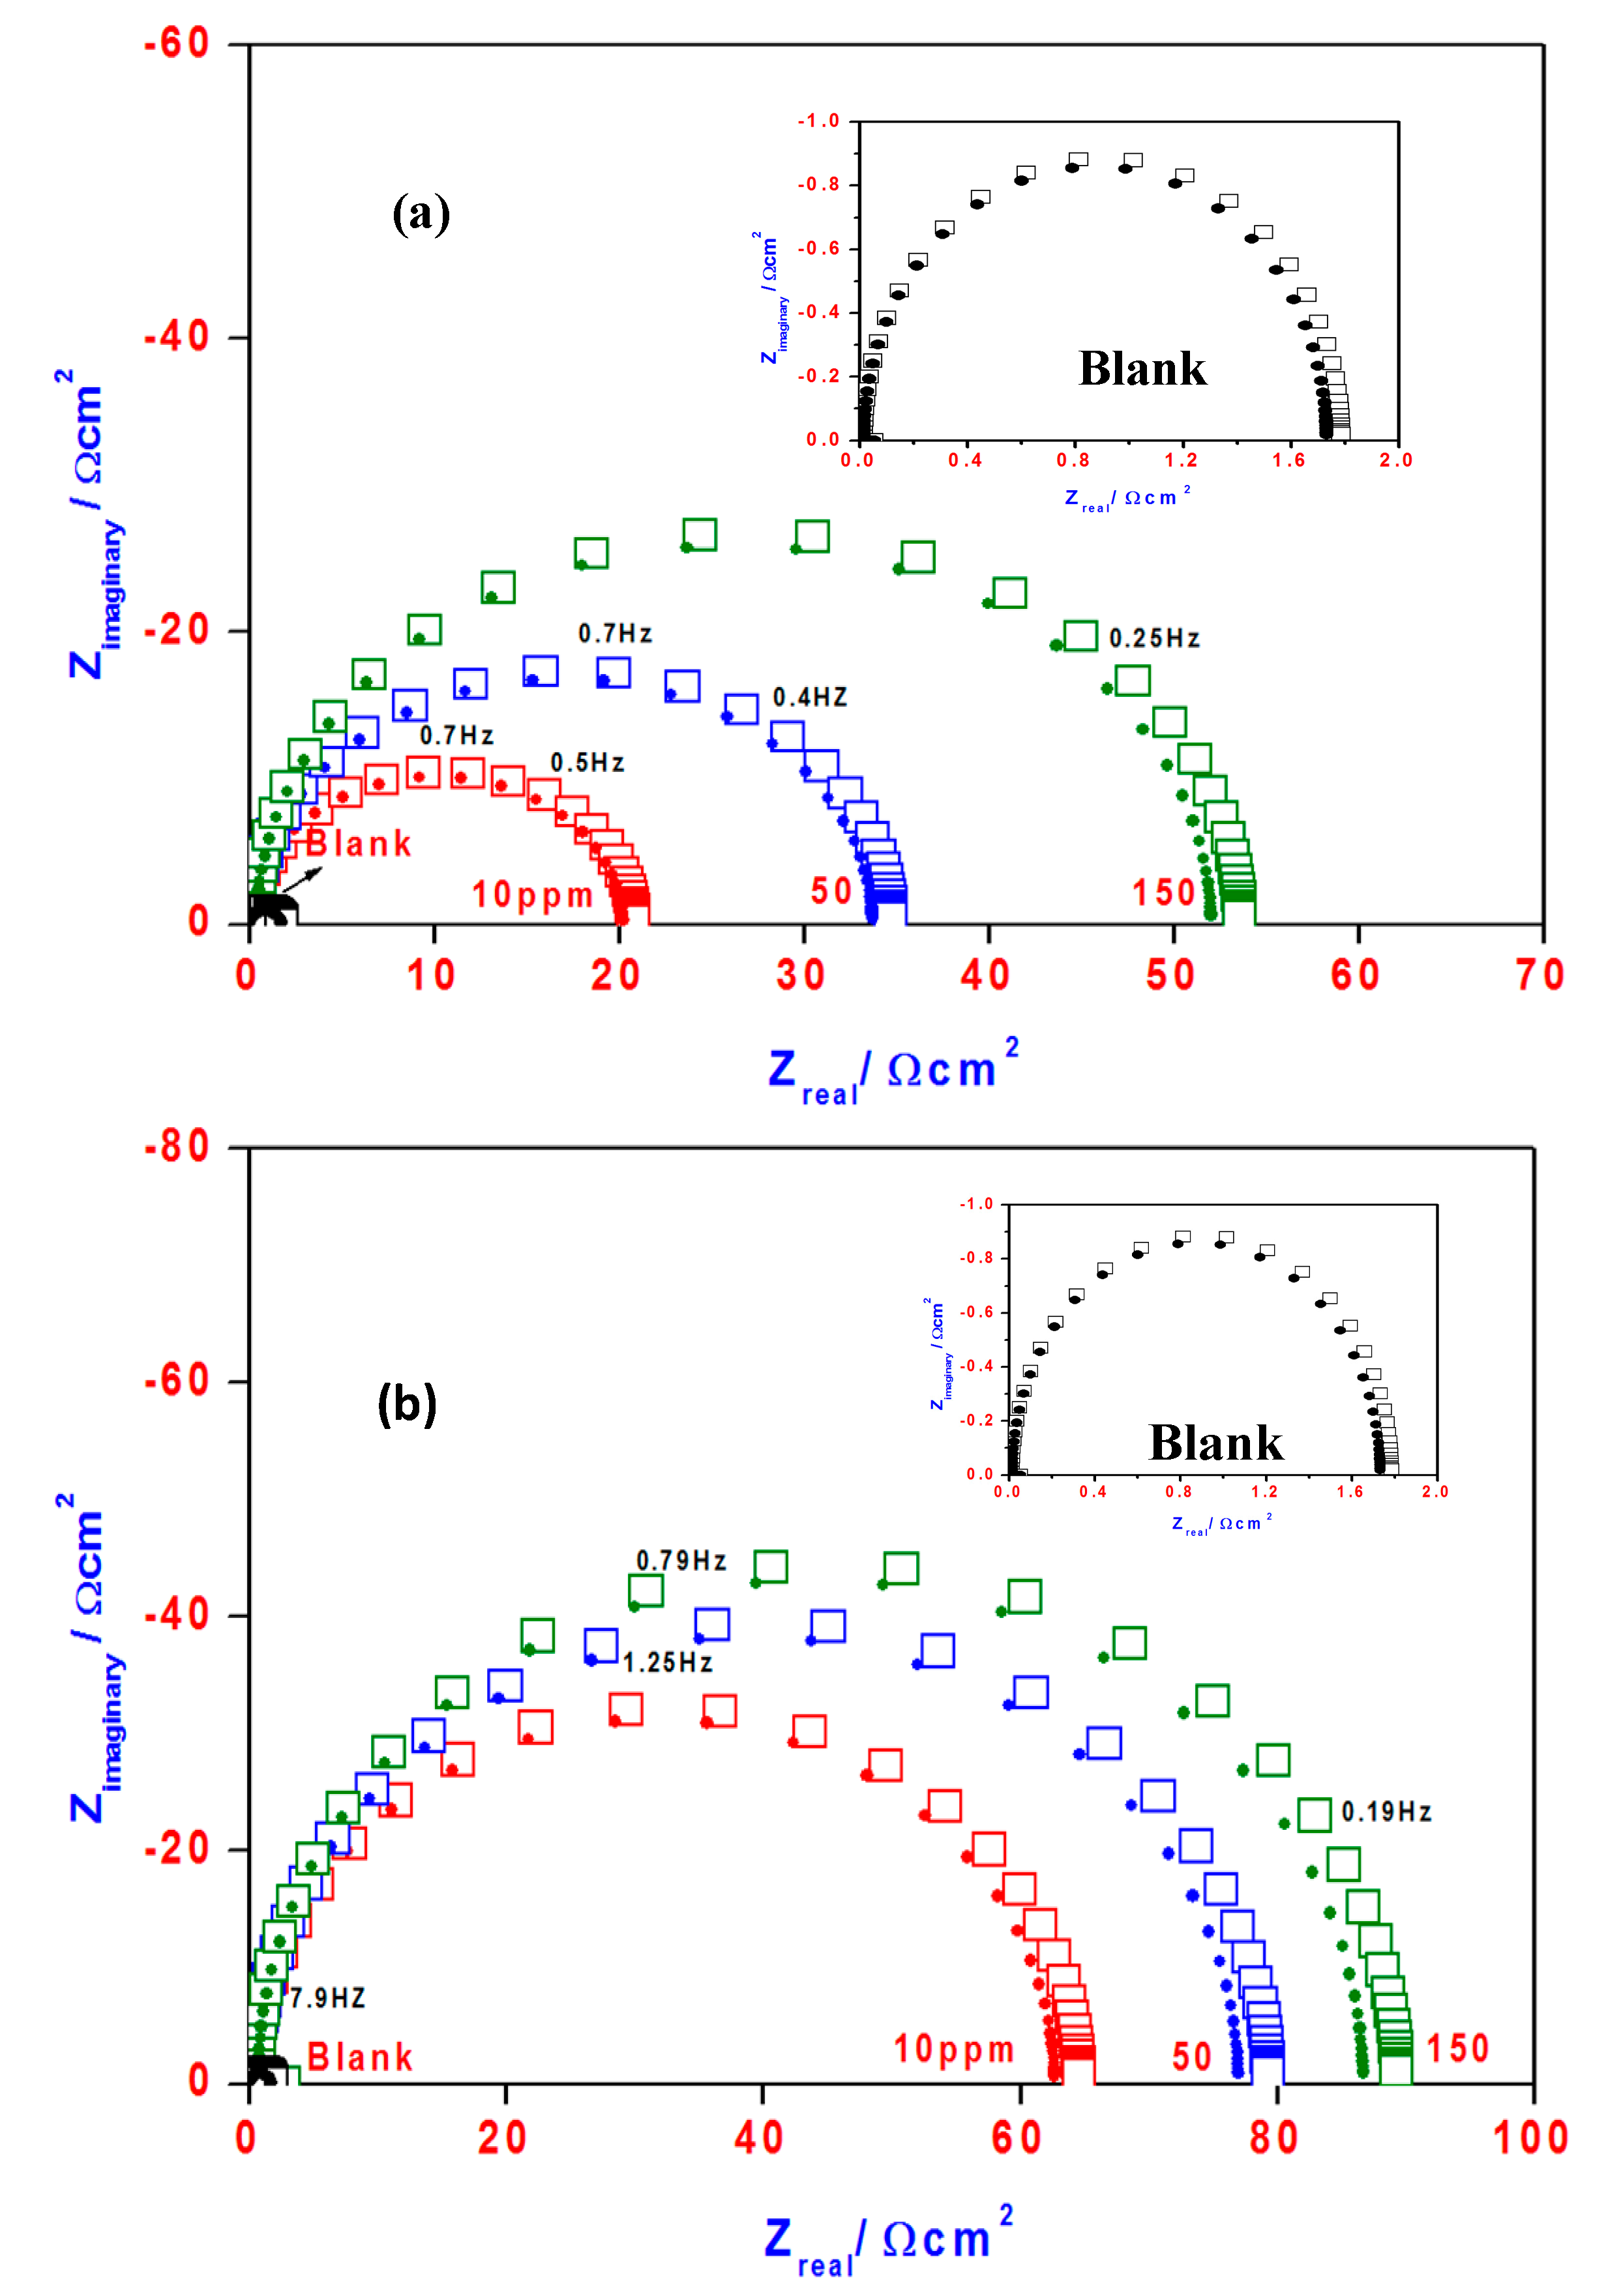
| Blank | 69 | 120 | −0.3955 | 839 | 9.7324 | ____ | 1.80 | 334 | ____ |
| 0.023 | 46 | 202 | −0.3242 | 73 | 0.2204 | 91.1 | 21.6 | 105 | 91.6 |
| 0.114 | 56 | 125 | −0.3784 | 44 | 0.1392 | 94.7 | 35 | 103 | 94.8 |
| 0.341 | 53 | 156 | −0.3775 | 31 | 0.1160 | 96.3 | 54 | 101 | 96.6 |
| Concentrations (mmol/L) | Polarization Method | EIS Method | |||||||
|---|---|---|---|---|---|---|---|---|---|
| ba (mV) | bc (mV) | Ecorr (V) | Icorr μA/cm2 | C.R. mm/year | IE% | Rct Ohm | Cdl (μF/cm2) | IE% | |
| Blank | 69 | 120 | −0.3955 | 839 | 9.7324 | ____ | 1.80 | 334 | ____ |
| 0.023 | 40 | 206 | −0.3235 | 19 | 0.8468 | 97.7 | 65.7 | 95 | 97.2 |
| 0.114 | 42 | 153 | −0.3369 | 12 | 0.5104 | 98.5 | 80.7 | 93 | 97.7 |
| 0.341 | 48 | 116 | −0.3606 | 10 | 0.3596 | 98.8 | 90.3 | 91 | 98.0 |
2.6. Electrochemical Impedance Spectroscopy (EIS)
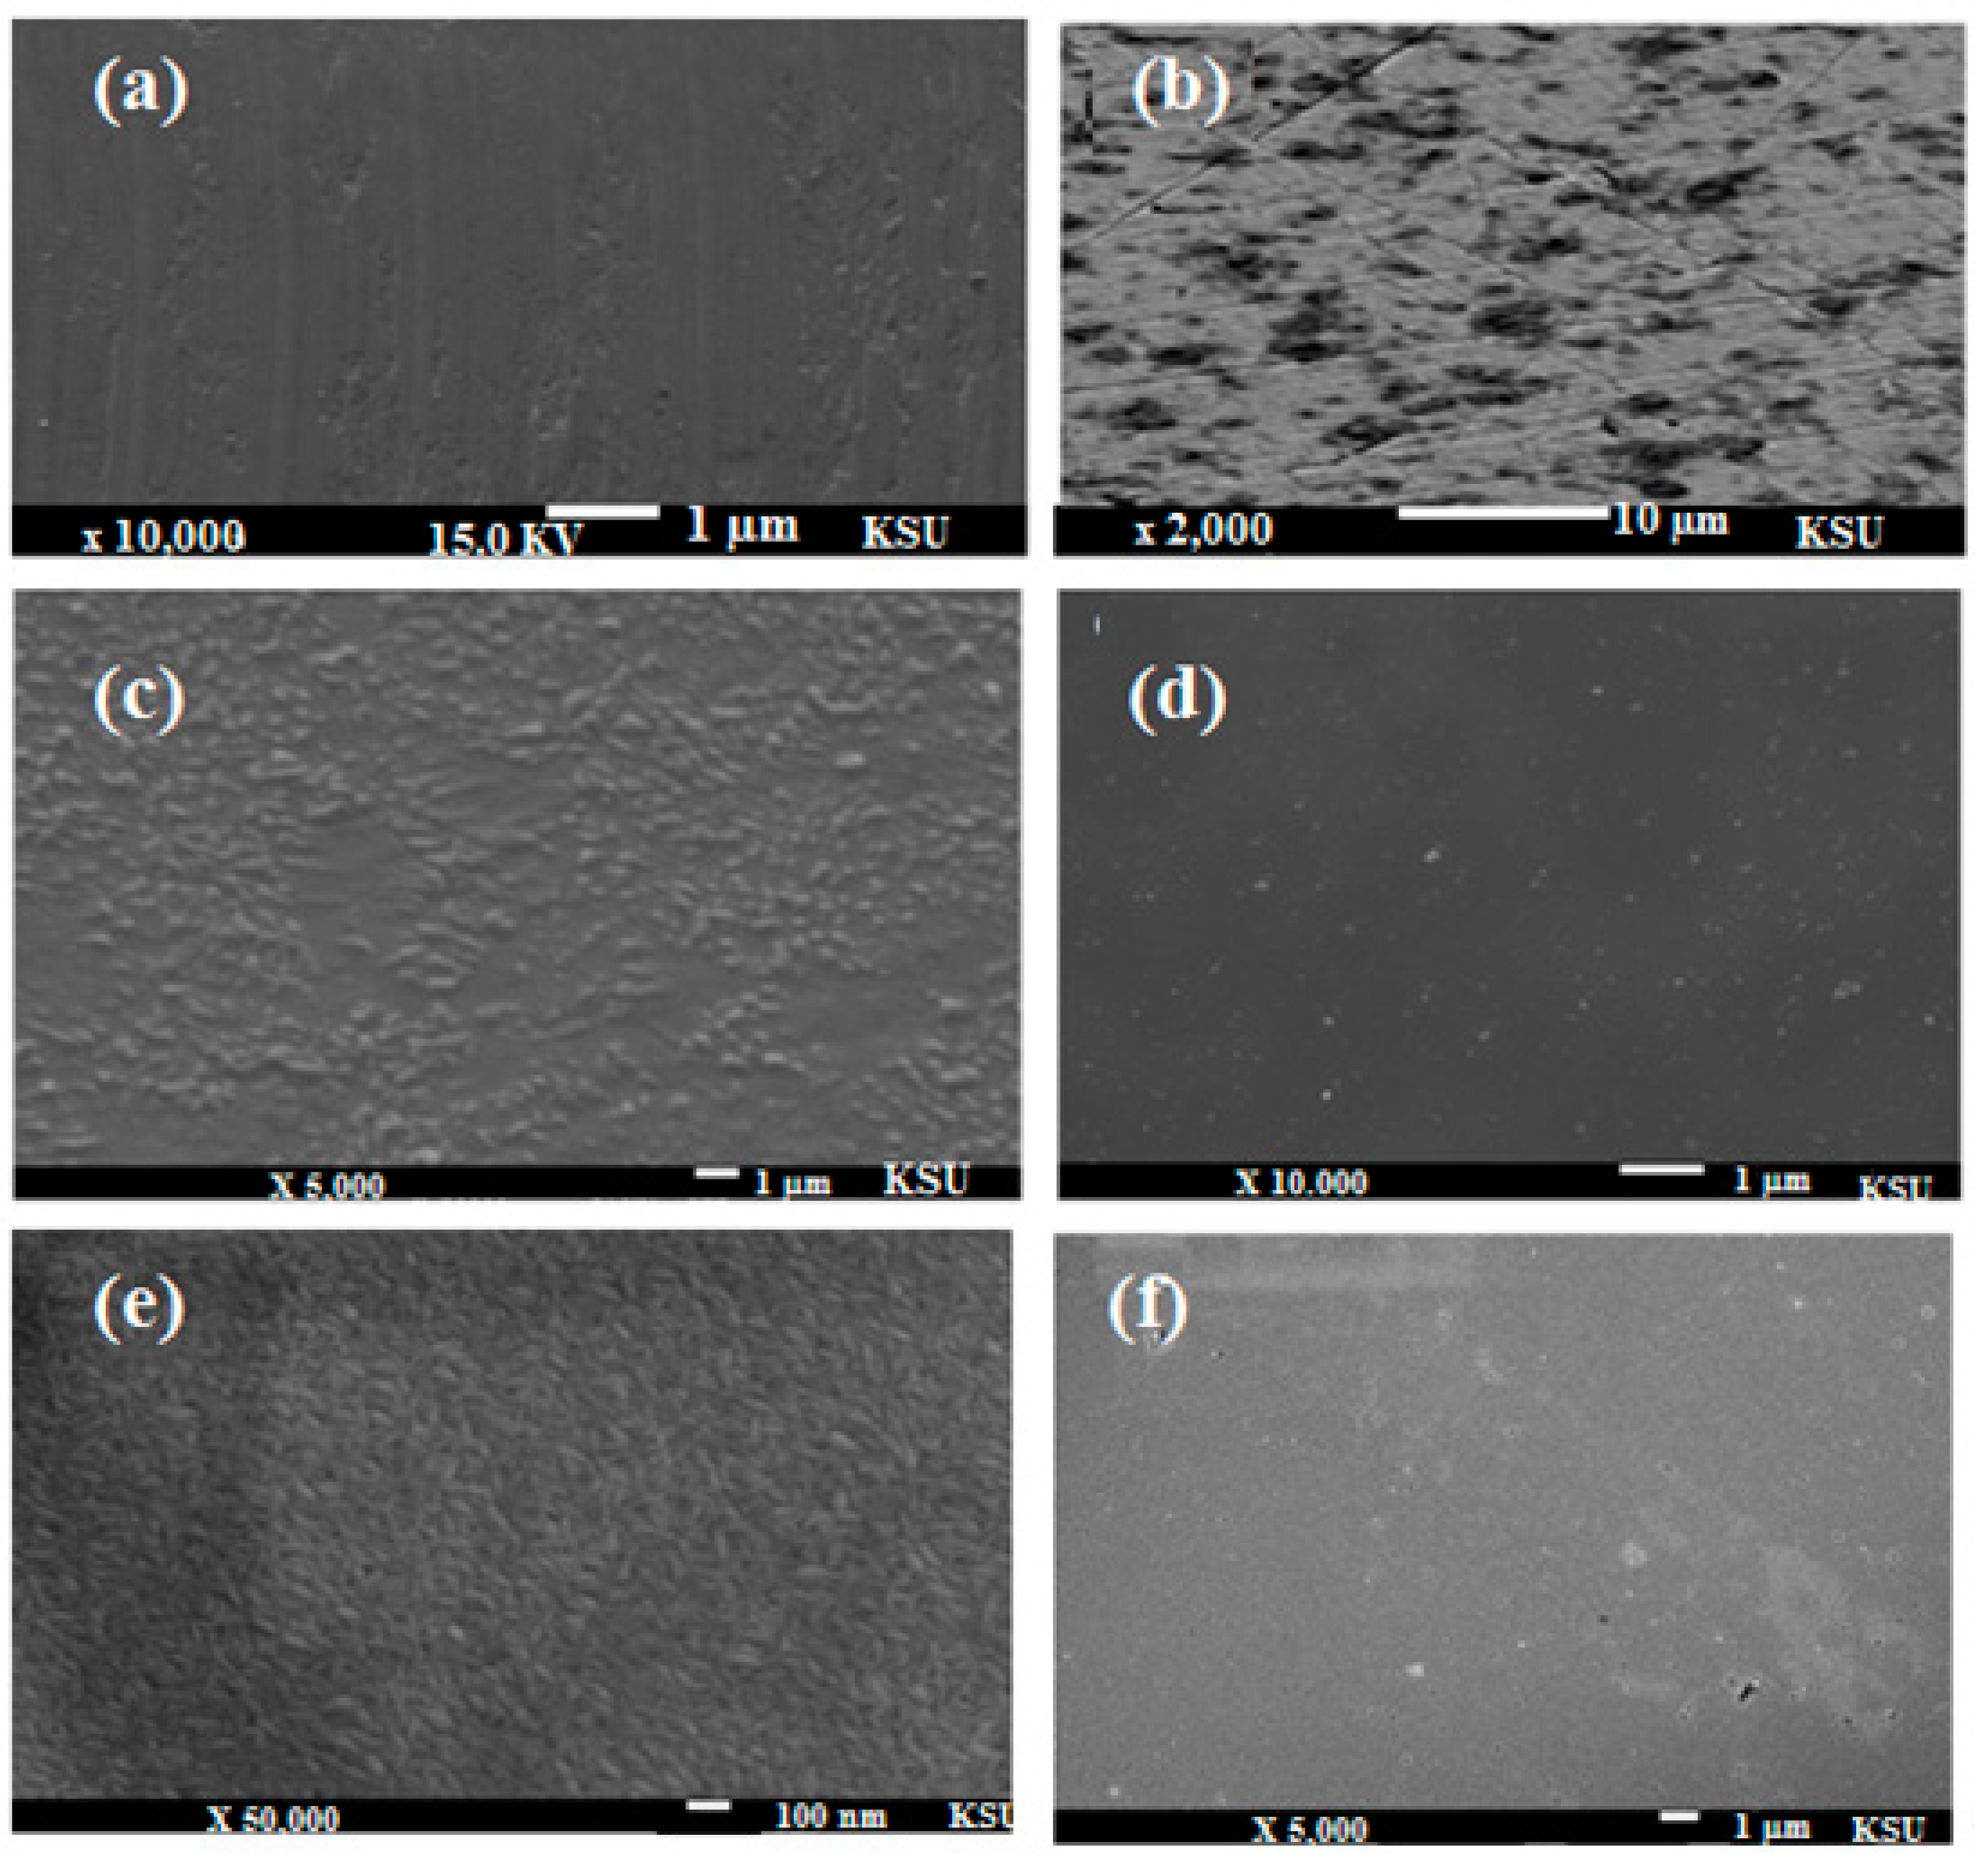
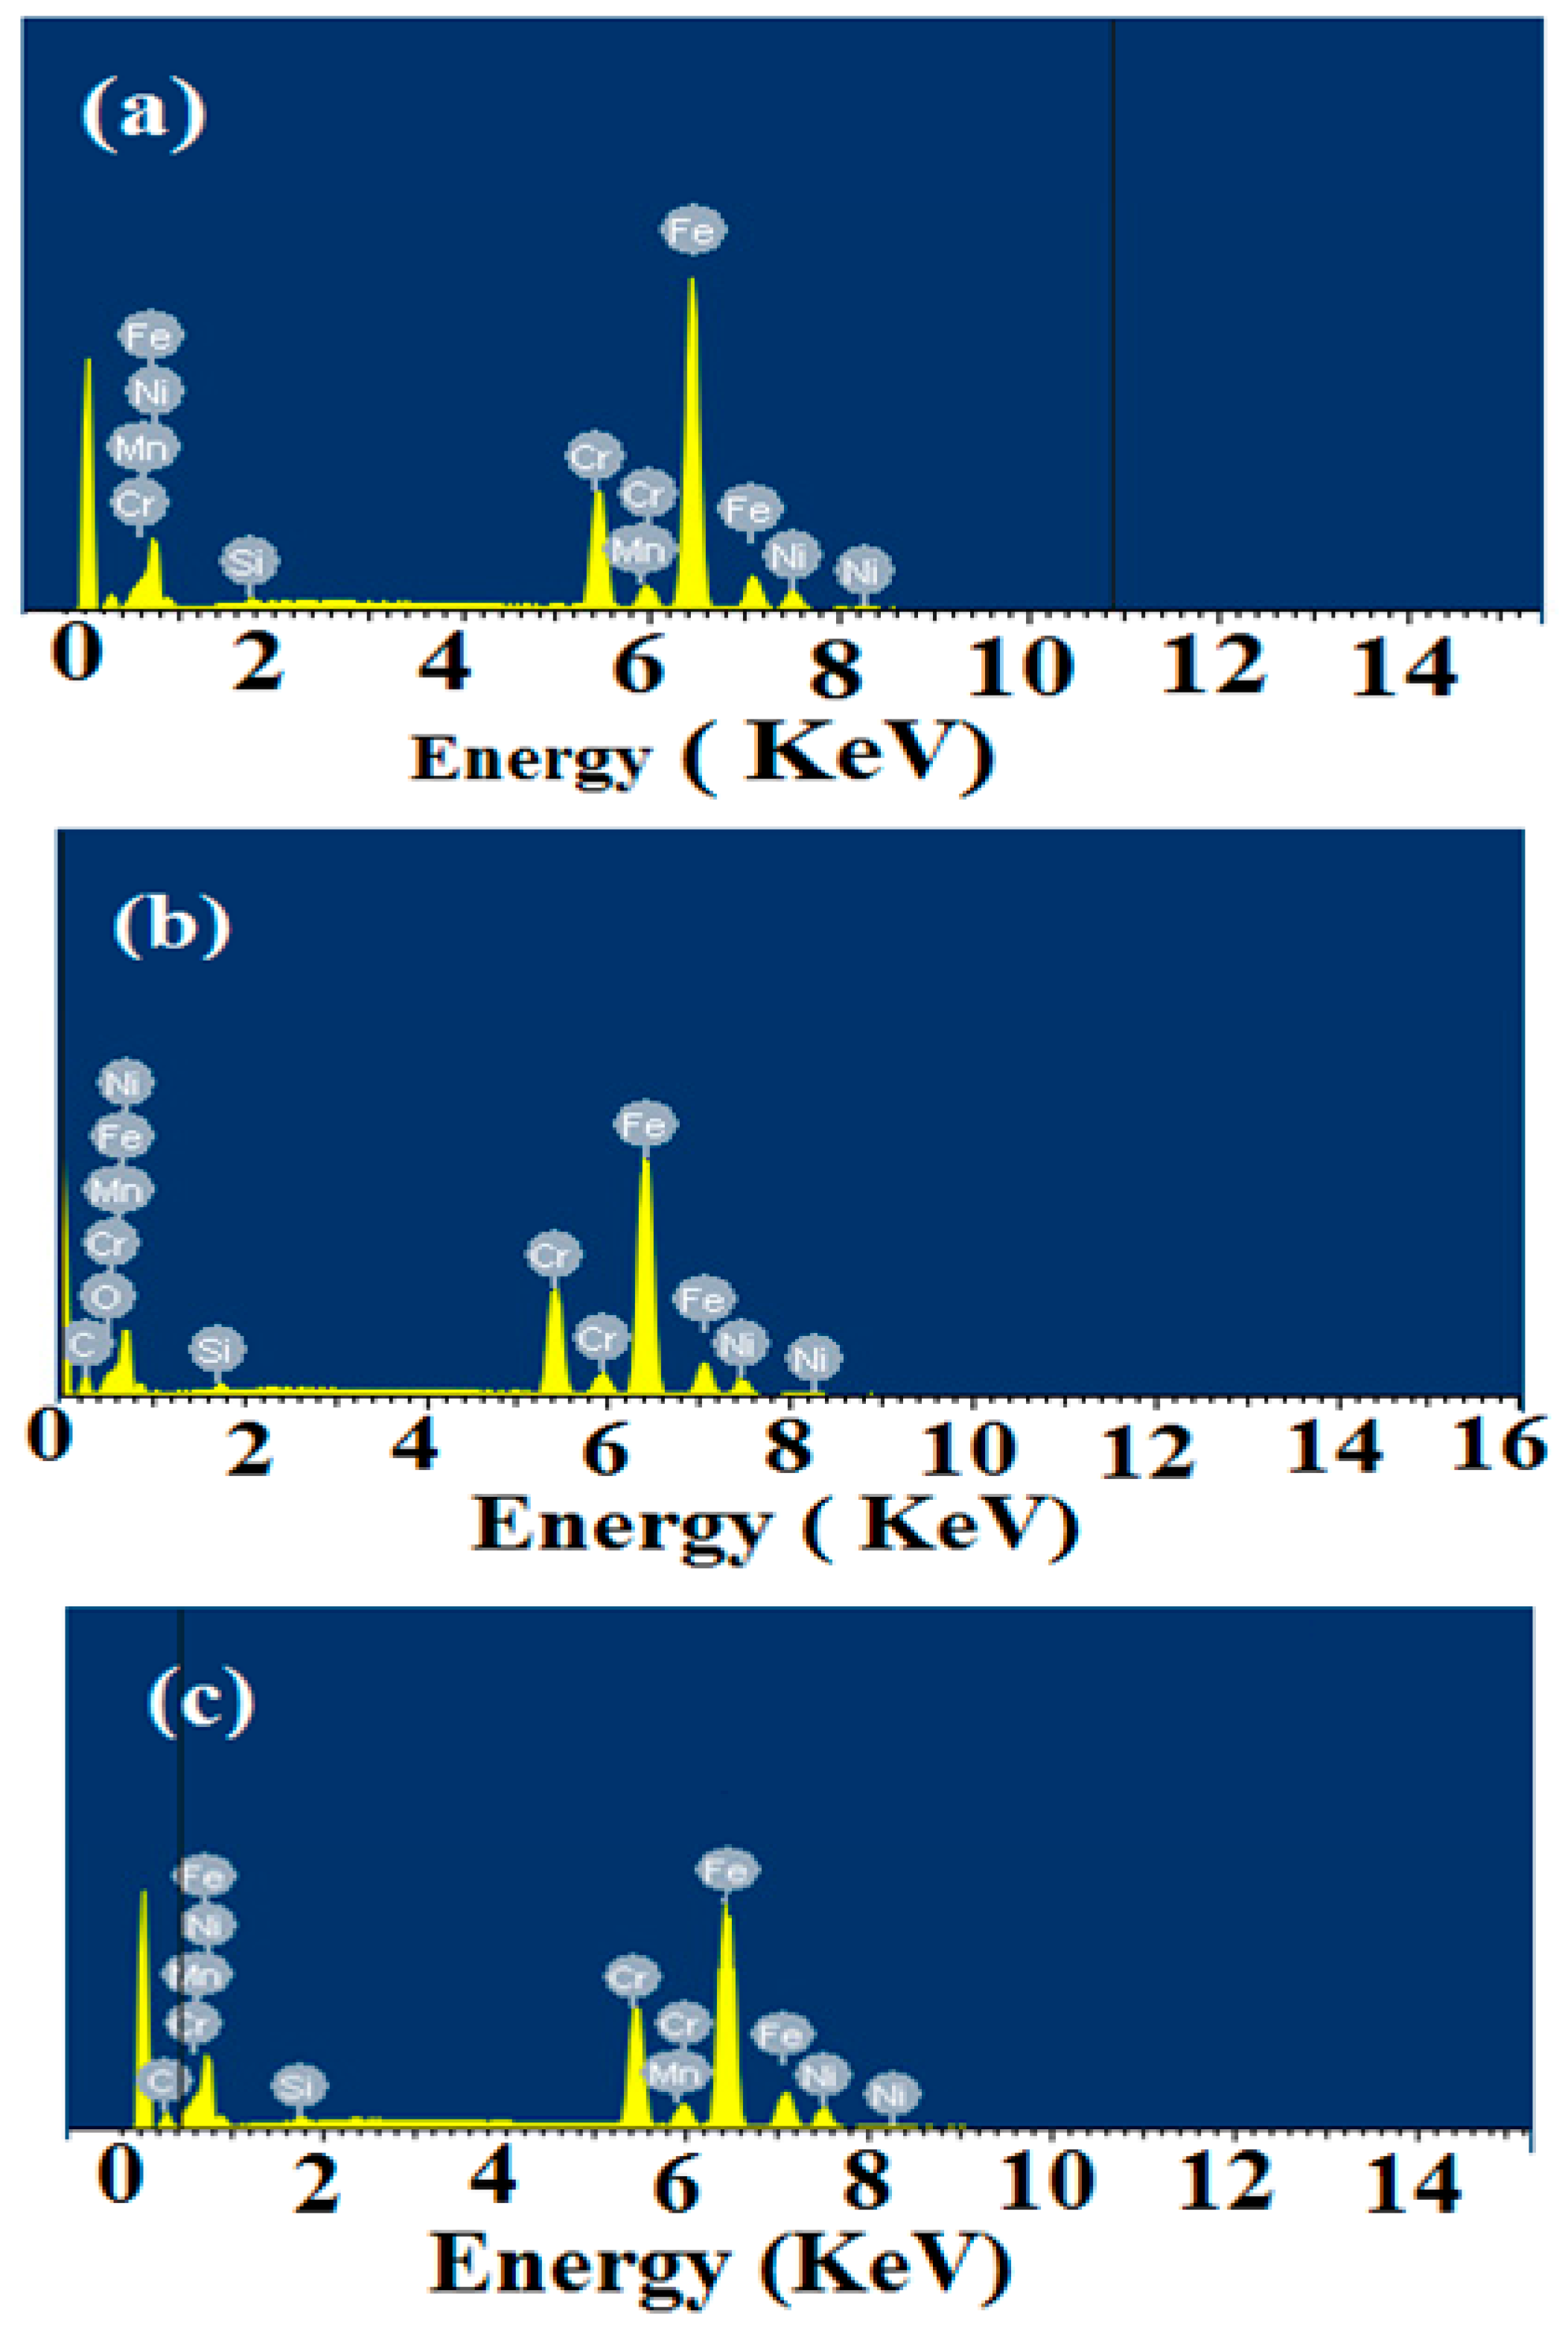
2.7. SEM and EDX Measurements
2.8. Mechanism of Corrosion Inhibition

3. Experimental Section
3.1. Materials
3.2. Synthesis Procedure
3.3. Characterization
3.4. Electrochemical Measurements
4. Conclusions
- (1)
- OA-TS and ODA-TS can act as an effective corrosion inhibitor for steel in 1 M hydrochloric acid.
- (2)
- OA-TS and ODA-TS act as a mixed type inhibitor retarding the anodic and cathodic reactions.
- (3)
- The electrochemical results indicated that the protection efficiency of the inhibitor is highly dependent upon concentration and attains a maximum value (98%) at an inhibitor concentration of 150 ppm.
- (4)
- EIS data indicated that the charge transfer resistances increase with the addition of inhibitor and the corrosion process is mainly controlled by charge transfer reactions.
- (5)
- SEM and EDX techniques revealed the formation of protective films on the steel surface.
Acknowledgments
Author Contributions
Conflicts of Interest
References
- Oguzie, E.; Li, Y.; Wang, F. Corrosion inhibition and adsorption behavior of methionine on mild steel in sulfuric acid and synergistic effect of iodide ion. J. Colloid Interface Sci. 2007, 310, 90–98. [Google Scholar] [CrossRef] [PubMed]
- Seter, M.; Thomson, M.J.; Stoimenovski, J.; MacFarlane, D.R.; Forsyth, M. Dual active ionic liquids and organic salts for inhibition of microbially influenced corrosion. Chem. Commun. 2012, 48, 5983–5985. [Google Scholar] [CrossRef] [PubMed]
- Gopi, D.; Govindaraju, K.; Kavitha, L. Investigation of triazole derived Schiff bases as corrosion inhibitors for mild steel in hydrochloric acid medium. J. Appl. Electrochem. 2010, 40, 1349–1356. [Google Scholar] [CrossRef]
- Gopi, D.; Govindaraju, K.; Collins Prakash, A.; Manivannan, V.; Kavitha, L. Inhibition of mild steel corrosion in groundwater by pyrrole and thienylcarbonyl benzotriazoles. J. Appl. Electrochem. 2009, 39, 269–276. [Google Scholar]
- Popoola, L.T.; Grema, A.S.; Latinwo, G.K.; Gutti, B.; Balogun, A.S. Corrosion problems during oil and gas production and its mitigation. Int. J. Ind. Chem. 2013, 4, 1–15. [Google Scholar] [CrossRef]
- Bentiss, F.; Lagrenee, M.; Traisnel, M.; Mernari, B.; Elattari, H. 3,5-Bis(n-Hydroxyphenyl)-4-amino-1,2,4-triazoles and 3,5-bis(n-aminophenyl)-4-amino-1,2,4-triazoles: A new class of corrosion inhibitors for mild steel in 1 M HCl medium. J. Appl. Electrochem. 1999, 29, 1073–1078. [Google Scholar] [CrossRef]
- Subramania, A.; Sundaram, N.K.; Priya, R.S.; Saminathan, K.; Muralidharan, V.; Vasudevan, T. Aldimines—Effective corrosion inhibitors for mild steel in hydrochloric acid solution. J. Appl. Electrochem. 2004, 34, 693–696. [Google Scholar] [CrossRef]
- Malik, M.A.; Hashim, M.A.; Nabi, F.; Al-Thabaiti, S.A.; Khan, Z. Anti-corrosion ability of surfactants: A review. Int. J. Electrochem. Sci. 2011, 6, 1927–1948. [Google Scholar]
- El-Maksoud, S.A. The effect of organic compounds on the electrochemical behaviour of steel in acidic media. A review. Int. J. Electrochem. Sci. 2008, 3, 528–555. [Google Scholar]
- Atta, A.M.; El-Azabawy, O.E.; Ismail, H.; Hegazy, M. Novel dispersed magnetite core–shell nanogel polymers as corrosion inhibitors for carbon steel in acidic medium. Corros. Sci. 2011, 53, 1680–1689. [Google Scholar] [CrossRef]
- El-Mahdy, G.A.; Atta, A.M.; Al-Lohedan, H.A. Synthesis and characterizations of Fe3O4 nanogel composite for enhancement of the corrosion resistance of steel in HCl solutions. J. Taiwan Inst. Chem. Eng. 2014, 45, 1947–1953. [Google Scholar] [CrossRef]
- Behzadnasab, M.; Mirabedini, S.; Esfandeh, M. Corrosion protection of steel by epoxy nanocomposite coatings containing various combinations of clay and nanoparticulate zirconia. Corros. Sci. 2013, 75, 134–144. [Google Scholar] [CrossRef]
- Gergely, A.; Pfeifer, E.; Bertoti, I.; Torok, T.; Kalman, E. Corrosion protection of cold-rolled steel by zinc-rich epoxy paint coatings loaded with nano-size alumina supported polypyrrole. Corros. Sci. 2011, 53, 3486–3499. [Google Scholar] [CrossRef]
- Saremi, M.; Yeganeh, M. Application of mesoporous silica nanocontainers as smart host of corrosion inhibitor in polypyrrole coatings. Corros. Sci. 2014, 86, 159–170. [Google Scholar] [CrossRef]
- Sababi, M.; Pan, J.; Augustsson, P.E.; Sundell, P.E.; Claesson, P.M. Influence of polyaniline and ceria nanoparticle additives on corrosion protection of a UV-cure coating on carbon steel. Corros. Sci. 2014, 84, 189–197. [Google Scholar] [CrossRef]
- Doner, A.; Solmaz, R.; Ozcan, M.; Karda, G. Experimental and theoretical studies of thiazoles as corrosion inhibitors for mild steel in sulphuric acid solution. Corros. Sci. 2011, 53, 2902–2913. [Google Scholar] [CrossRef]
- Likhanova, N.V.; Dom nguez-Aguilar, M.A.; Olivares-Xometl, O.; Nava-Entzana, N.; Arce, E.; Dorantes, H. The effect of ionic liquids with imidazolium and pyridinium cations on the corrosion inhibition of mild steel in acidic environment. Corros. Sci. 2010, 52, 2088–2097. [Google Scholar] [CrossRef]
- Zhang, Q.; Hua, Y. Corrosion inhibition of mild steel by alkylimidazolium ionic liquids in hydrochloric acid. Electrochim. Acta 2009, 54, 1881–1887. [Google Scholar] [CrossRef]
- Lin, P.C.; Sun, I.W.; Chang, J.K.; Su, C.J.; Lin, J.C. Corrosion characteristics of nickel, copper, and stainless steel in a Lewis neutral chloroaluminate ionic liquid. Corros. Sci. 2011, 53, 4318–4323. [Google Scholar] [CrossRef]
- Tüken, T.; Demir, F.; Kicir, N.; Sigircik, G.; Erbil, M. Inhibition effect of 1-ethyl-3-methylimidazolium dicyanamide against steel corrosion. Corros. Sci. 2012, 59, 110–118. [Google Scholar] [CrossRef]
- Wang, Y.C.; Lee, T.C.; Lin, J.Y.; Chang, J.K.; Tseng, C.M. Corrosion properties of metals in dicyanamide-based ionic liquids. Corros. Sci. 2014, 78, 81–88. [Google Scholar] [CrossRef]
- Gu, T.; Chen, Z.; Jiang, X.; Zhou, L.; Liao, Y.; Duan, M.; Wang, H.; Pu, Q. Synthesis and inhibition of N-alkyl-2-(4-hydroxybut-2-ynyl) pyridinium bromide for mild steel in acid solution: Box–Behnken design optimization and mechanism probe. Corros. Sci. 2015, 90, 191–197. [Google Scholar] [CrossRef]
- Perissi, I.; Bardi, U.; Caporali, S.; Lavacchi, A. High temperature corrosion properties of ionic liquids. Corros. Sci. 2006, 48, 2349–2362. [Google Scholar] [CrossRef]
- Kowsari, E.; Payami, M.; Amini, R.; Ramezanzadeh, B.; Javanbakht, M. Task-specific ionic liquid as a new green inhibitor of mild steel corrosion. Appl. Surf. Sci. 2014, 289, 478–486. [Google Scholar] [CrossRef]
- Huang, P.; Latham, J.-A.; MacFarlane, D.R.; Howlett, P.C.; Forsyth, M. A review of ionic liquid surface film formation on Mg and its alloys for improved corrosion performance. Electrochim. Acta 2013, 110, 501–510. [Google Scholar] [CrossRef]
- Reynolds, J.L.; Erdner, K.R.; Jones, P.B. Photoreduction of benzophenones by amines in room-temperature ionic liquids. Org. Lett. 2002, 4, 917–919. [Google Scholar] [CrossRef] [PubMed]
- Zhao, G.; Jiang, T.; Gao, H.; Han, B.; Huang, J.; Sun, D. Mannich reaction using acidic ionic liquids as catalysts and solvents. Green Chem. 2004, 6, 75–77. [Google Scholar] [CrossRef]
- Luo, J.; Hu, J.; Saak, W.; Beckhaus, R.; Wittstock, G.; Vankelecom, I.F.J.; Agert, C.; Conrad, O. Protic ionic liquid and ionic melts prepared from methanesulfonic acid and 1H-1,2,4-triazole as high temperature PEMFC electrolytes. J. Mater. Chem. 2011, 21, 10426–10436. [Google Scholar] [CrossRef]
- Flores, C.A.; Flores, E.A.; Hernández, E.; Castro, L.V.; García, A.; Alvarez, F.; Vázquez, F.S. Anion and cation effects of ionic liquids and ammonium salts evaluated as dehydrating agents for super-heavy crude oil: Experimental and theoretical points of view. J. Mol. Liq. 2014, 196, 249–257. [Google Scholar] [CrossRef]
- Rosen, M.J.; Kunjappu, J.T. Surfactants and Interfacial Phenomena; John Wiley & Sons: New York, NY, USA, 2012. [Google Scholar]
- Laughlin, R.G. The Aqueous Phase Behavior of Surfactants; Academic Press: London, UK, 1994; Volume 6. [Google Scholar]
- Chandrasekhar, S. Liquid Crystals, 2nd ed.; Cambridge University Press: New York, NY, USA, 1992; pp. 15–55. [Google Scholar]
- Binks, B.; Fletcher, P.; Kotsev, S.; Thompson, R. Adsorption and aggregation of semifluorinated alkanes in binary and ternary mixtures with hydrocarbon and fluorocarbon solvents. Langmuir 1997, 13, 6669–6682. [Google Scholar] [CrossRef]
- Arditty, S.; Schmitt, V.; Giermanska-Kahn, J.; Leal-Calderon, F. Materials based on solid-stabilized emulsions. J. Colloid Interface Sci. 2004, 275, 659–664. [Google Scholar] [CrossRef] [PubMed]
- Li, D.; Neumann, A. A reformulation of the equation of state for interfacial tensions. J. Colloid Interface Sci. 1990, 137, 304–307. [Google Scholar] [CrossRef]
- Wang, X.; Yang, H.; Wang, F. A cationic gemini-surfactant as effective inhibitor for mild steel in HCl solutions. Corros. Sci. 2010, 52, 1268–1276. [Google Scholar] [CrossRef]
- Bentiss, F.; Traisnel, M.; Lagrenee, M. The substituted 1,3,4-oxadiazoles: A new class of corrosion inhibitors of mild steel in acidic media. Corros. Sci. 2000, 42, 127–146. [Google Scholar] [CrossRef]
- Qu, Q.; Hao, Z.; Li, L.; Bai, W.; Liu, Y.; Ding, Z. Synthesis and evaluation of Tris-hydroxymethyl-(2-hydroxybenzylidenamino)-methane as a corrosion inhibitor for cold rolled steel in hydrochloric acid. Corros. Sci. 2009, 51, 569–574. [Google Scholar] [CrossRef]
- Bentiss, F.; Lebrini, M.; Lagrenée, M. Thermodynamic characterization of metal dissolution and inhibitor adsorption processes in mild steel/2,5-bis(n-thienyl)-1,3,4-thiadiazoles/hydrochloric acid system. Corros. Sci. 2005, 47, 2915–2931. [Google Scholar] [CrossRef]
- Qu, Q.; Jiang, S.; Bai, W.; Li, L. Effect of ethylenediamine tetraacetic acid disodium on the corrosion of cold rolled steel in the presence of benzotriazole in hydrochloric acid. Electrochim. Acta 2007, 52, 6811–6819. [Google Scholar] [CrossRef]
- Deyab, M.; El-Rehim, S.A. On surfactant–polymer association and its effect on the corrosion behavior of carbon steel in cyclohexane propionic acid. Corros. Sci. 2012, 65, 309–316. [Google Scholar] [CrossRef]
- McCafferty, E.; Hackerman, N. Double layer capacitance of iron and corrosion inhibition with polymethylene diamines. J. Electrochem. Soc. 1972, 119, 146–153. [Google Scholar] [CrossRef]
- Muralidharan, S.; Phani, K.; Pitchumani, S.; Ravichandran, S.; Iyer, S. Polyamino benzoquinone polymers: A new class of corrosion inhibitors for mild steel. J. Electrochem. Soc. 1995, 142, 1478–1483. [Google Scholar] [CrossRef]
- Fekry, A.; Mohamed, R.R. Acetyl thiourea chitosan as an eco-friendly inhibitor for mild steel in sulphuric acid medium. Electrochim. Acta 2010, 55, 1933–1939. [Google Scholar] [CrossRef]
- Amin, M.A. Weight loss, polarization, electrochemical impedance spectroscopy, SEM and EDX studies of the corrosion inhibition of copper in aerated NaCl solutions. J. Appl. Electrochem. 2006, 36, 215–226. [Google Scholar] [CrossRef]
- Lebrini, M.; Bentiss, F.; Vezin, H.; Lagrenee, M. The inhibition of mild steel corrosion in acidic solutions by 2,5-bis(4-pyridyl)-1,3,4-thiadiazole: Structure-activity correlation. Corros. Sci. 2006, 48, 1279–1291. [Google Scholar] [CrossRef]
- Goulart, C.M.; Esteves-Souza, A.; Martinez-Huitle, C.A.; Rodrigues, C.J.F.; Maciel, M.A.M.; Echevarria, A. Experimental and theoretical evaluation of semicarbazones and thiosemicarbazones as organic corrosion inhibitors. Corros. Sci. 2013, 67, 281–291. [Google Scholar] [CrossRef]
- Kele, H.; Kele, M.; Dehri, I.; Serinda, O. The inhibitive effect of 6-amino-m-cresol and its Schiff base on the corrosion of mild steel in 0.5 M HCI medium. Mater. Chem. Phys. 2008, 112, 173–179. [Google Scholar] [CrossRef]
- Bayol, E.; Gürten, A.; Dursun, M.; Kayakirilmaz, K. Adsorption behavior and inhibition corrosion effect of sodium carboxymethyl cellulose on mild steel in acidic medium. Acta Phys. Chim. Sin. 2008, 24, 2236–2242. [Google Scholar] [CrossRef]
- Avci, G. Inhibitor effect of N,N-methylenediacrylamide on corrosion behavior of mild steel in 0.5 M HCl. Mater. Chem. Phys. 2008, 112, 234–238. [Google Scholar] [CrossRef]
- Lebrini, M.; Robert, F.; Vezin, H.; Roos, C. Electrochemical and quantum chemical studies of some indole derivatives as corrosion inhibitors for C38 steel in molar hydrochloric acid. Corros. Sci. 2010, 52, 3367–3376. [Google Scholar] [CrossRef]
- Bahrami, M.; Hosseini, S.; Pilvar, P. Experimental and theoretical investigation of organic compounds as inhibitors for mild steel corrosion in sulfuric acid medium. Corros. Sci. 2010, 52, 2793–2803. [Google Scholar] [CrossRef]
- Abiola, O.; Oforka, N. Adsorption of (4-amino-2-methyl-5-pyrimidinyl methylthio) acetic acid on mild steel from hydrochloric acid solution (HCl)—Part 1. Mater. Chem. Phys. 2004, 83, 315–322. [Google Scholar] [CrossRef]
- Mert, B.D.; Mert, M.E.; Karda, G.; Yazici, B. Experimental and theoretical investigation of 3-amino-1,2,4-triazole-5-thiol as a corrosion inhibitor for carbon steel in HCl medium. Corros. Sci. 2011, 53, 4265–4272. [Google Scholar] [CrossRef]
- Wang, X.; Yang, H.; Wang, F. An investigation of benzimidazole derivative as corrosion inhibitor for mild steel in different concentration HCl solutions. Corros. Sci. 2011, 53, 113–121. [Google Scholar] [CrossRef]
- Negm, N.; Elkholy, Y.; Zahran, M.; Tawfik, S. Corrosion inhibition efficiency and surface activity of benzothiazol-3-ium cationic Schiff base derivatives in hydrochloric acid. Corros. Sci. 2010, 52, 3523–3536. [Google Scholar] [CrossRef]
- Tebbji, K.; Faska, N.; Tounsi, A.; Oudda, H.; Benkaddour, M.; Hammouti, B. The effect of some lactones as inhibitors for the corrosion of mild steel in 1M hydrochloric acid. Mater. Chem. Phys. 2007, 106, 260–267. [Google Scholar] [CrossRef]
- Solmaz, R.; Karda, G.; Yazici, B.; Erbil, M. Adsorption and corrosion inhibitive properties of 2-amino-5-mercapto-1,3,4-thiadiazole on mild steel in hydrochloric acid media. Colloids Surf. A Physicochem. Eng. Asp. 2008, 312, 154–164. [Google Scholar] [CrossRef]
- Solmaz, R.; Karda, G.; Culha, M.; Yazc, B.; Erbil, M. Investigation of adsorption and inhibitive effect of 2-mercaptothiazoline on corrosion of mild steel in hydrochloric acid media. Electrochim. Acta 2008, 53, 1881–1887. [Google Scholar] [CrossRef]
- Behpour, M.; Ghoreishi, S.; Salavati-Niasari, M.; Ebrahimi, B. Evaluating two new synthesized S–N Schiff bases on the corrosion of copper in 15% hydrochloric acid. Mater. Chem. Phys. 2008, 107, 153–157. [Google Scholar] [CrossRef]
- Li, S.L.; Wang, Y.G.; Chen, S.H.; Yu, R.; Lei, S.B.; Ma, H.Y.; Liu, X.D. Some aspects of quantum chemical calculations for the study of Schiff base corrosion inhibitors on copper in NaCl solutions. Corros. Sci. 1999, 41, 1769–1782. [Google Scholar] [CrossRef]
- Vautier-Giongo, C.; Bales, B.L. Estimate of the Ionization Degree of Ionic Micelles Based on Krafft Temperature Measurements. J. Phys. Chem. B 2003, 107, 5398–5403. [Google Scholar] [CrossRef]
- Sample Availability: Samples of the compounds OA-TS and ODA-TS are available from the authors.
© 2015 by the authors. Licensee MDPI, Basel, Switzerland. This article is an open access article distributed under the terms and conditions of the Creative Commons Attribution license ( http://creativecommons.org/licenses/by/4.0/).
Share and Cite
Atta, A.M.; El-Mahdy, G.A.; Al-Lohedan, H.A.; Ezzat, A.R.O. A New Green Ionic Liquid-Based Corrosion Inhibitor for Steel in Acidic Environments. Molecules 2015, 20, 11131-11153. https://doi.org/10.3390/molecules200611131
Atta AM, El-Mahdy GA, Al-Lohedan HA, Ezzat ARO. A New Green Ionic Liquid-Based Corrosion Inhibitor for Steel in Acidic Environments. Molecules. 2015; 20(6):11131-11153. https://doi.org/10.3390/molecules200611131
Chicago/Turabian StyleAtta, Ayman M., Gamal A. El-Mahdy, Hamad A. Al-Lohedan, and Abdel Rahman O. Ezzat. 2015. "A New Green Ionic Liquid-Based Corrosion Inhibitor for Steel in Acidic Environments" Molecules 20, no. 6: 11131-11153. https://doi.org/10.3390/molecules200611131
APA StyleAtta, A. M., El-Mahdy, G. A., Al-Lohedan, H. A., & Ezzat, A. R. O. (2015). A New Green Ionic Liquid-Based Corrosion Inhibitor for Steel in Acidic Environments. Molecules, 20(6), 11131-11153. https://doi.org/10.3390/molecules200611131