
Characterization of Anthocyanins in Perilla frutescens var. acuta Extract by Advanced UPLC-ESI-IT-TOF-MSn Method and Their Anticancer Bioactivity

Abstract
:1. Introduction

2. Results and Discussion
2.1. Total Anthocyanin Content (TAC)
2.2. UPLC-ESI-IT-TOF-MSn Analysis

| Peak No. | Compound Assigned | Rt (min) a | λmax (nm) | Measured Signal (m/z) | Therotical Mass (m/z) | Error (ppm) | Molecular Weight (m/z) | Molecule Formula |
|---|---|---|---|---|---|---|---|---|
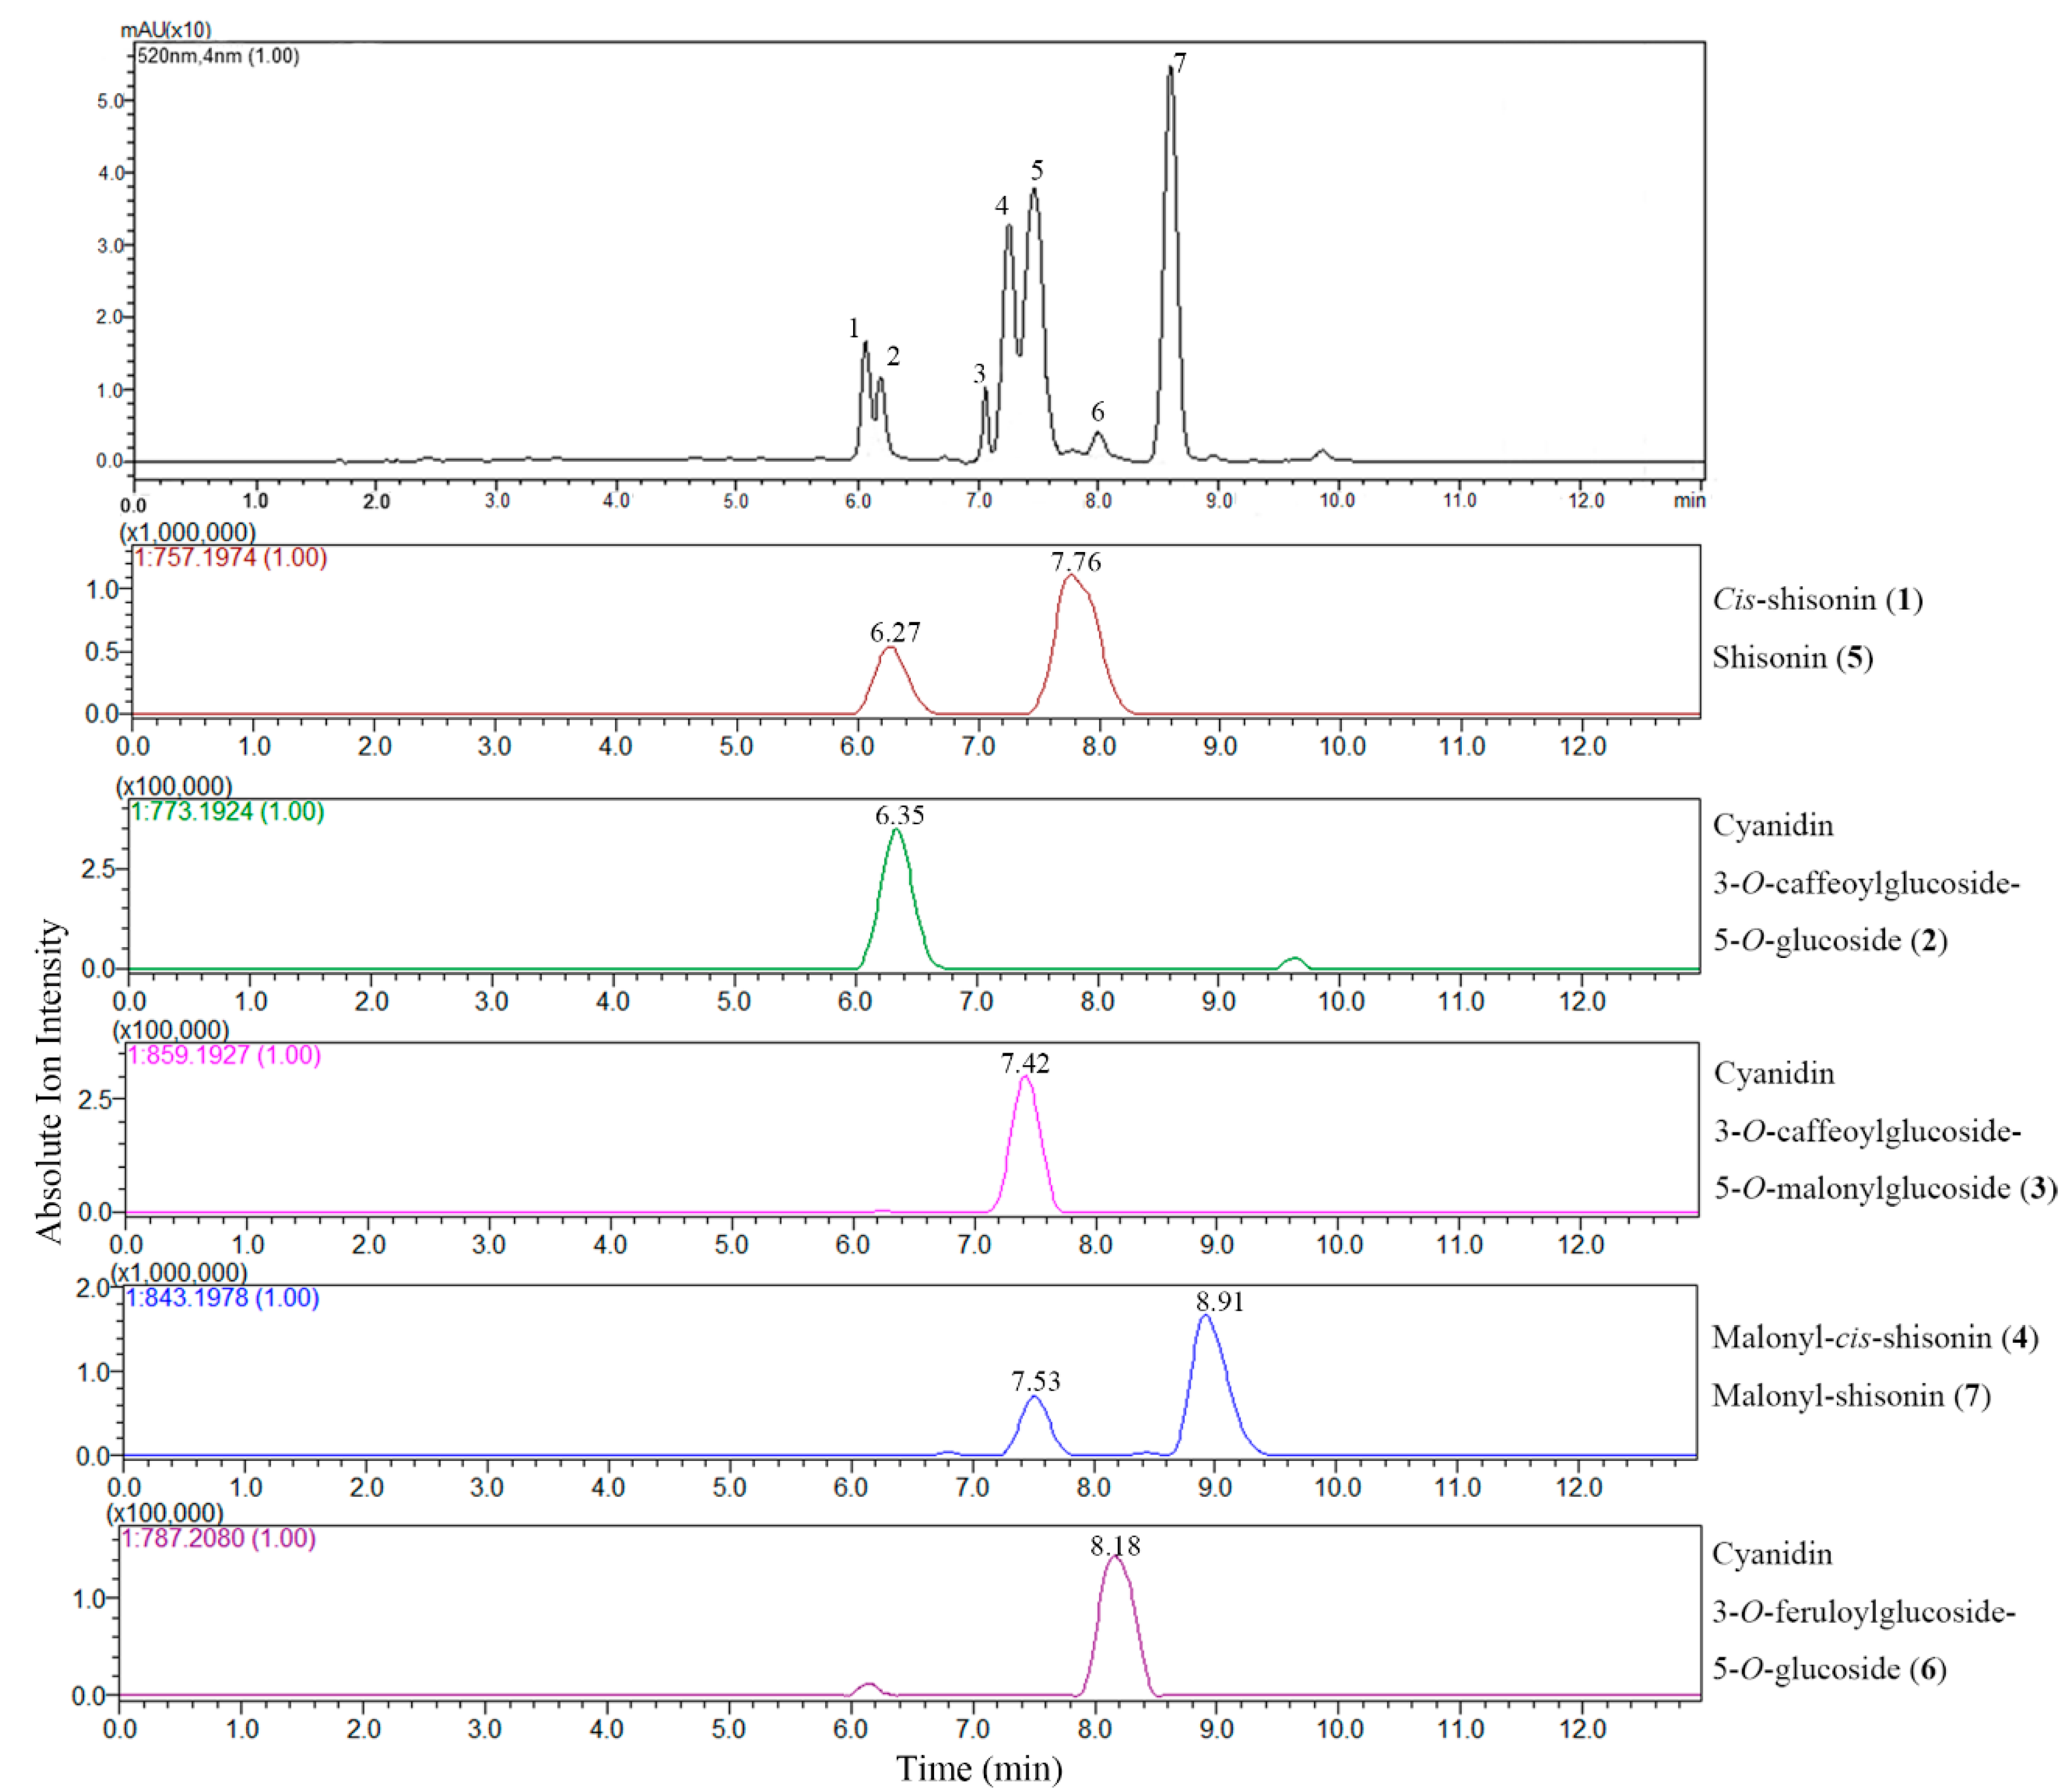
| 1 | Cis-shisonin | 6.27 | 283, 315, 528 | 757.1965 | 757.1974 | 1.19 | 757.1980 | C36H37O18+ |
| 2 | Cyanidin 3-O-caffeoylglucoside- 5-O-glucoside | 6.35 | 283, 318, 525 | 773.1932 | 773.1924 | 1.03 | 773.1929 | C36H37O19+ |
| 3 | Cyanidin 3-O-caffeoylglucoside- 5-O-malonylglucoside | 7.42 | 282, 317, 525 | 859.1926 | 859.1927 | 1.16 | 859.1933 | C39H39O22+ |
| 4 | Malonyl-cis-shisonin | 7.53 | 282, 313, 527 | 843.1965 | 843.1978 | 1.54 | 843.1984 | C39H39O21+ |
| 5 | Shisonin | 7.76 | 284, 315, 525 | 757.1973 | 757.1974 | 0.26 | 757.1980 | C36H37O18+ |
| 6 | Cyanidin 3-O-feruloylglucoside- 5-O-glucoside | 8.18 | 283, 316, 523 | 787.2097 | 787.2080 | 2.16 | 787.2086 | C37H39O19+ |
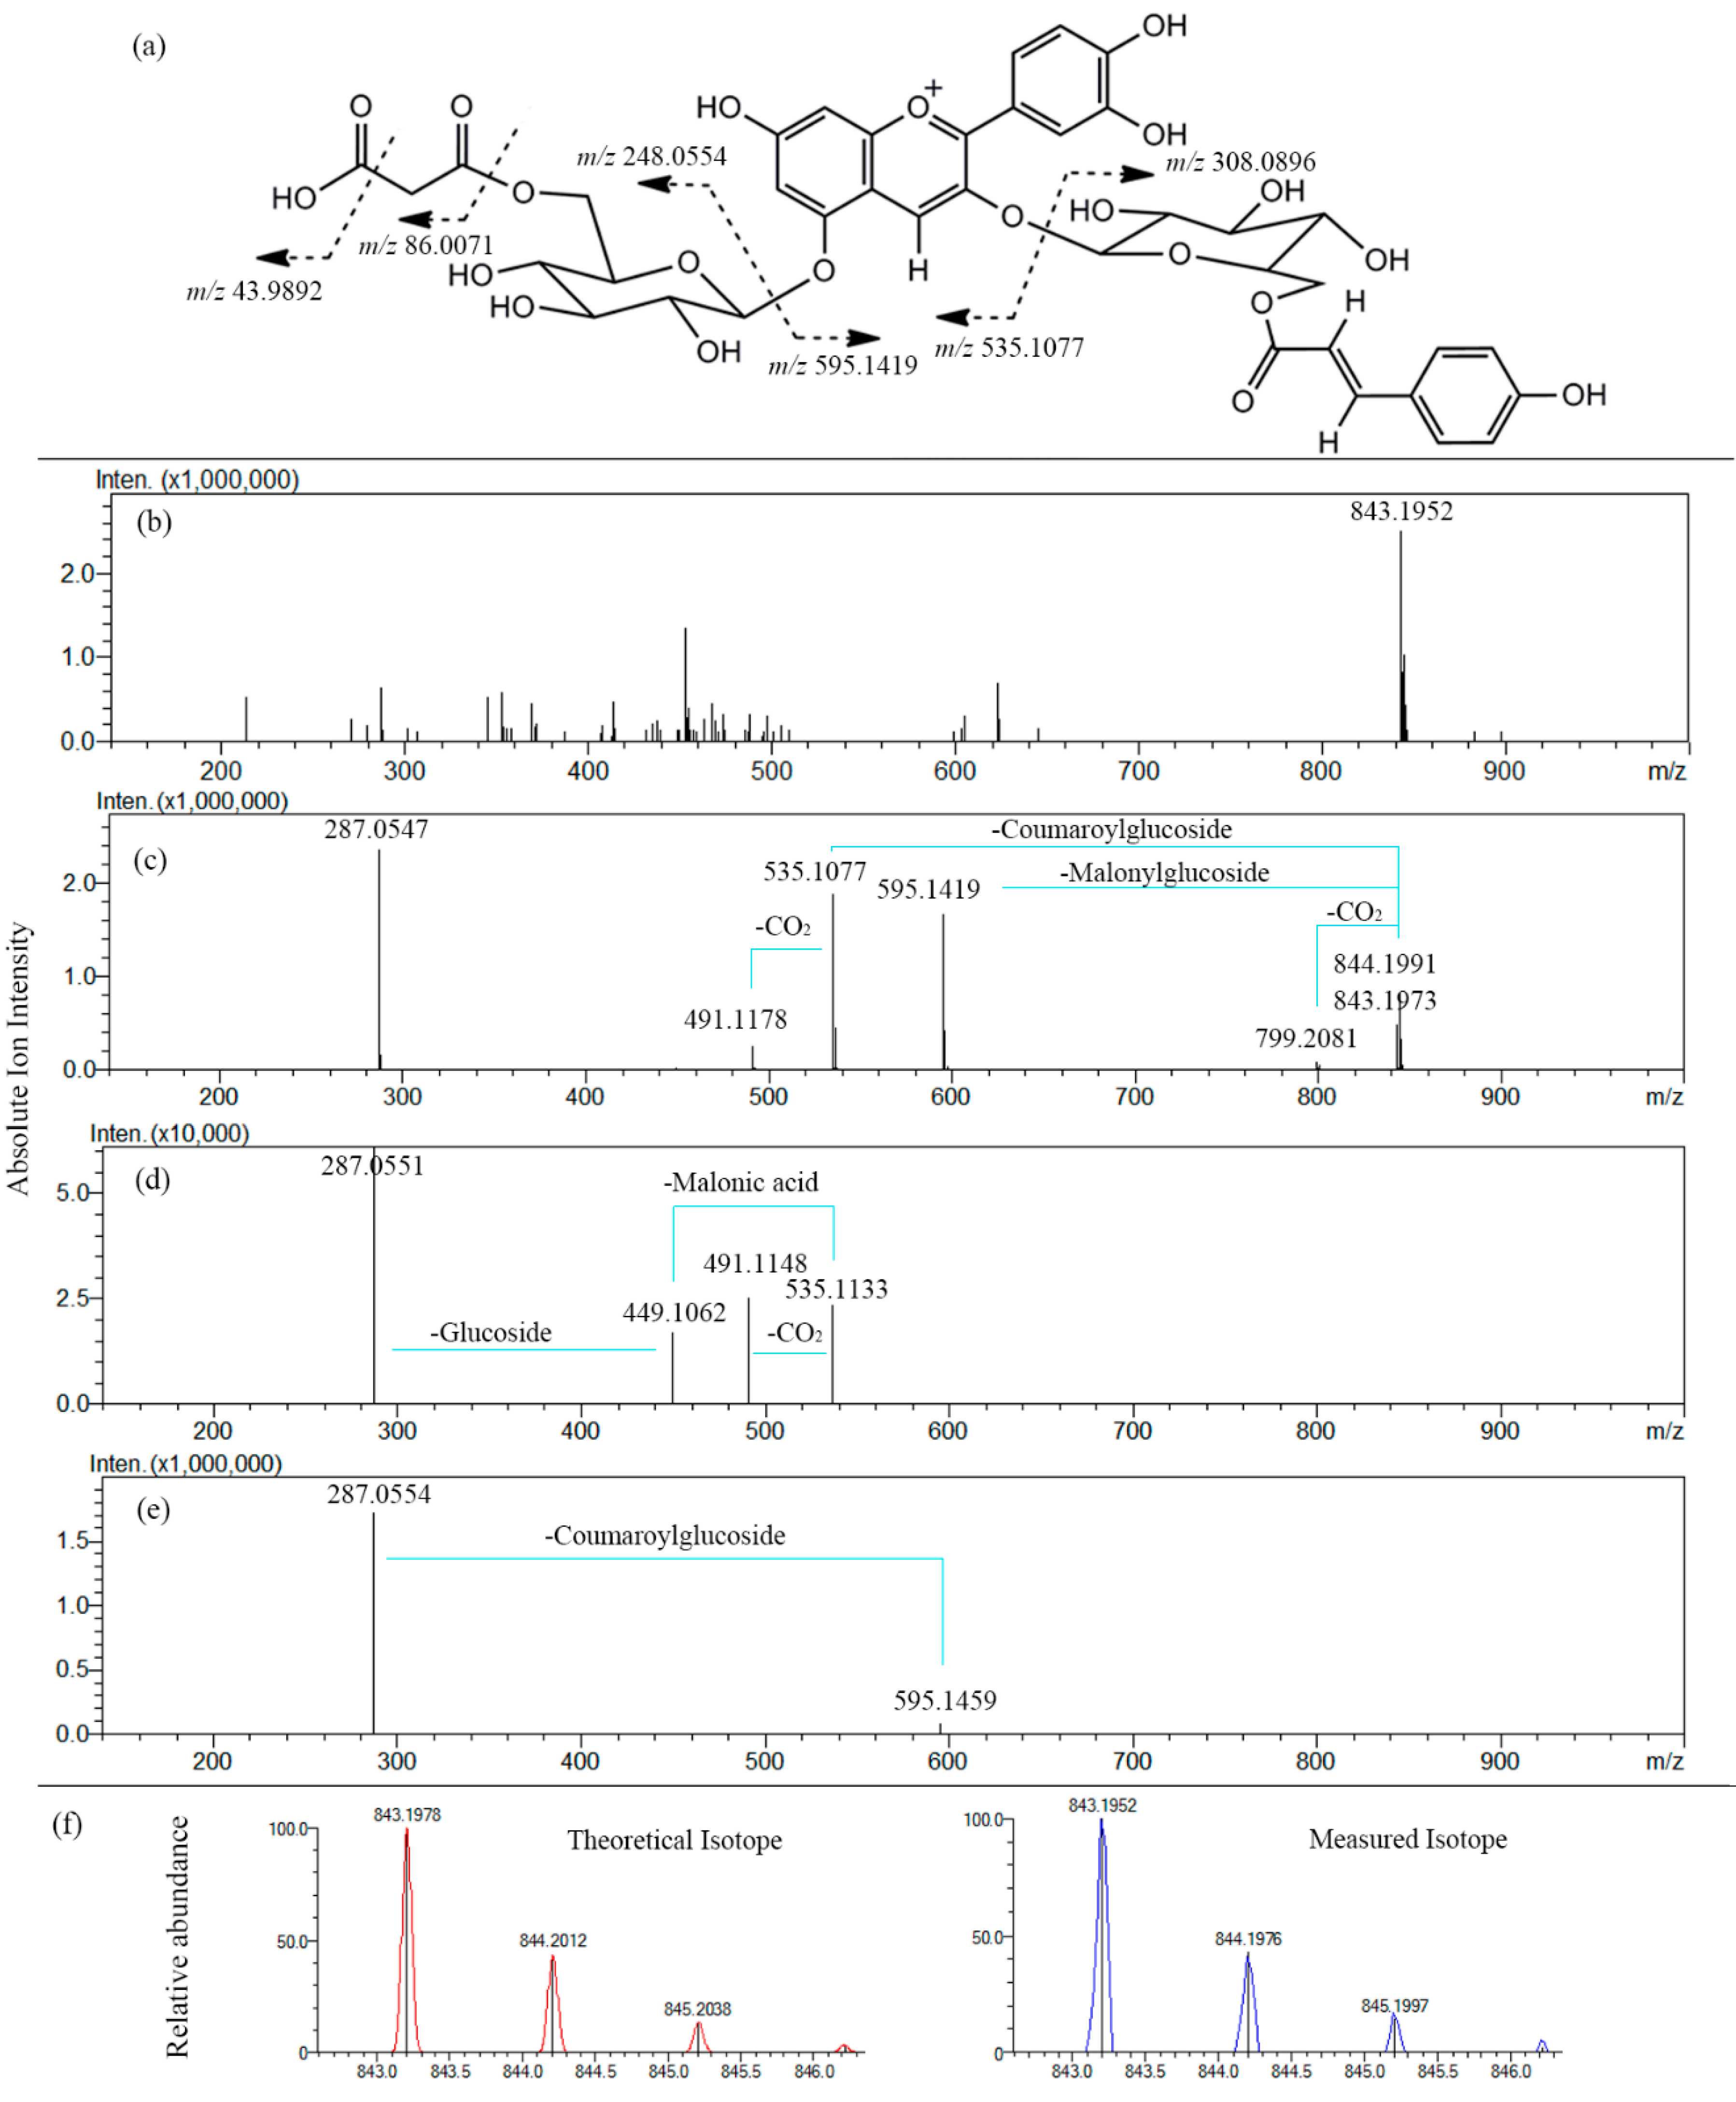
| 7 | Malonyl-shisonin | 8.91 | 283, 312, 528 | 843.1952 | 843.1978 | 3.08 | 843.1984 | C39H39O21+ |
| Anthocyanins | MSn Fragment Ions in Positive Ion Mode (m/z) (Fragment Type) a,b | ||
|---|---|---|---|
| MS1 | MS2 | MS3 | |
| Cis-shisonin | 757.1965 [M]+ | 595.1422 [M-Glc]+ 287.0556 [Cy]+ 449.1002 [M-Glc-Cou]+ | 287.0541 [Cy]+ |
| Cyanidin 3-O-caffeoylglucoside- 5-O-glucoside | 773.1932 [M]+ | 611.1394 [M-Glc]+ 287.0549 [Cy]+ 449.1051 [M-Glc-Caf]+ | 287.0543 [Cy]+ |
| Cyanidin 3-O-caffeoylglucoside- 5-O-malonylglucoside | 859.1926 [M]+ | 287.0560 [Cy]+ 535.1085 [M-Glc-Caf]+ 611.1397 [M-Glc-Mal]+ 491.1186 [M-Glc-Caf-CO2]+ 815.2015 [M-CO2]+ 449.1007 [M-Glc-Mal-Caf]+ | 287.0552 [Cy]+ 491.1178 [M-Glc-Caf-CO2]+ 449.1007 [M-Glc-Mal-Caf]+ |
| Malonyl-cis-shisonin | 843.1965 [M]+ | 595.1440 [M-Glc-Mal]+ 535.1077 [M-Glc-Cou]+ 287.0560 [Cy]+ 491.1178 [M-Glc-Cou-CO2]+ 799.2107 [M-CO2]+ | 287.0550 [Cy]+ 491.1175 [M-Glc-Cou-CO2]+ 449.1033 [M-Glc-Mal-Cou]+ |
| Shisonin | 757.1973 [M]+ | 595.1444 [M-Glc]+ 287.0537 [Cy]+ 449.1059 [M-Glc-Cou]+ | 287.0541 [Cy]+ |
| Cyanidin 3-O-feruloylglucoside- 5-O-glucoside | 787.2097 [M]+ | 625.1547 [M-Glc]+ 287.0523 [Cy]+ 449.1104 [M-Glc-Fer]+ | 287.0539 [Cy]+ |
| Malonyl-shisonin | 843.1952 [M]+ | 595.1459 [M-Glc-Mal]+ 535.1095 [M-Glc-Cou]+ 287.0543 [Cy]+ 491.1181 [M-Glc-Cou-CO2]+ 799.2019 [M-CO2]+ | 287.0551 [Cy]+ 491.1148 [M-Glc-Cou-CO2]+ 449.1062 [M-Glc-Mal-Cou]+ |
2.2.1. Extracted Ion Chromatogram (EIC) Analysis


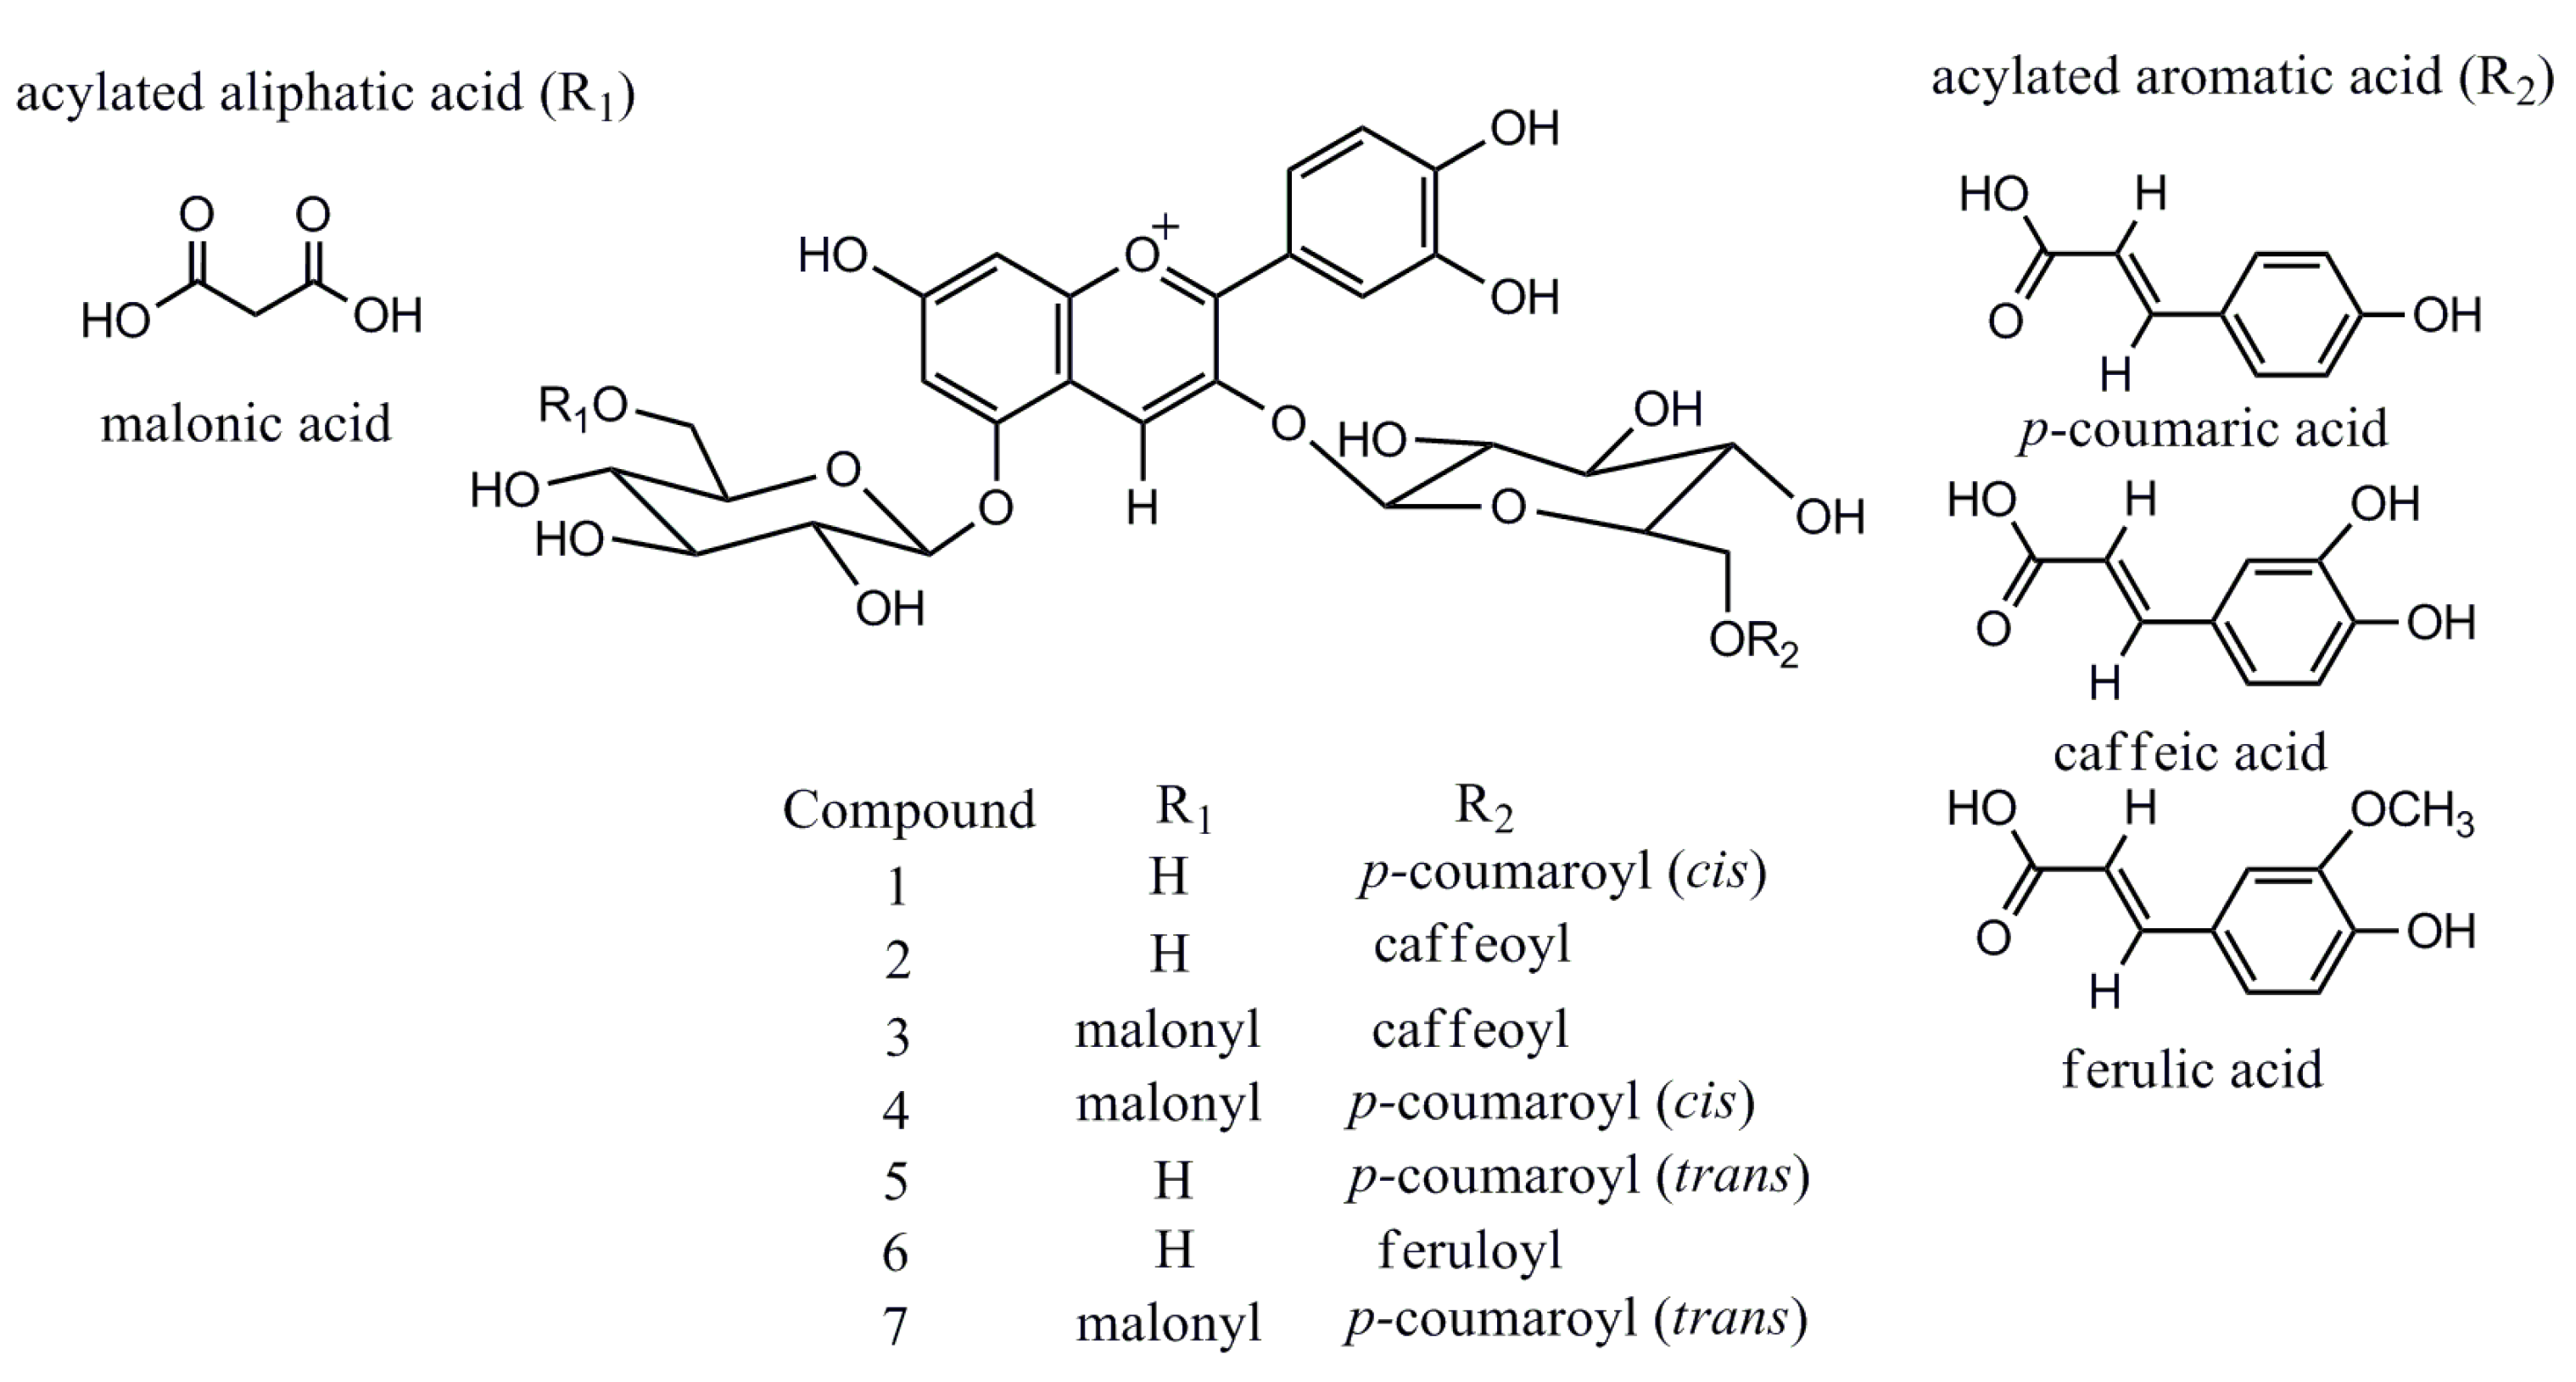
2.2.2. Fragmentation Patterns of Perilla Anthocyanins
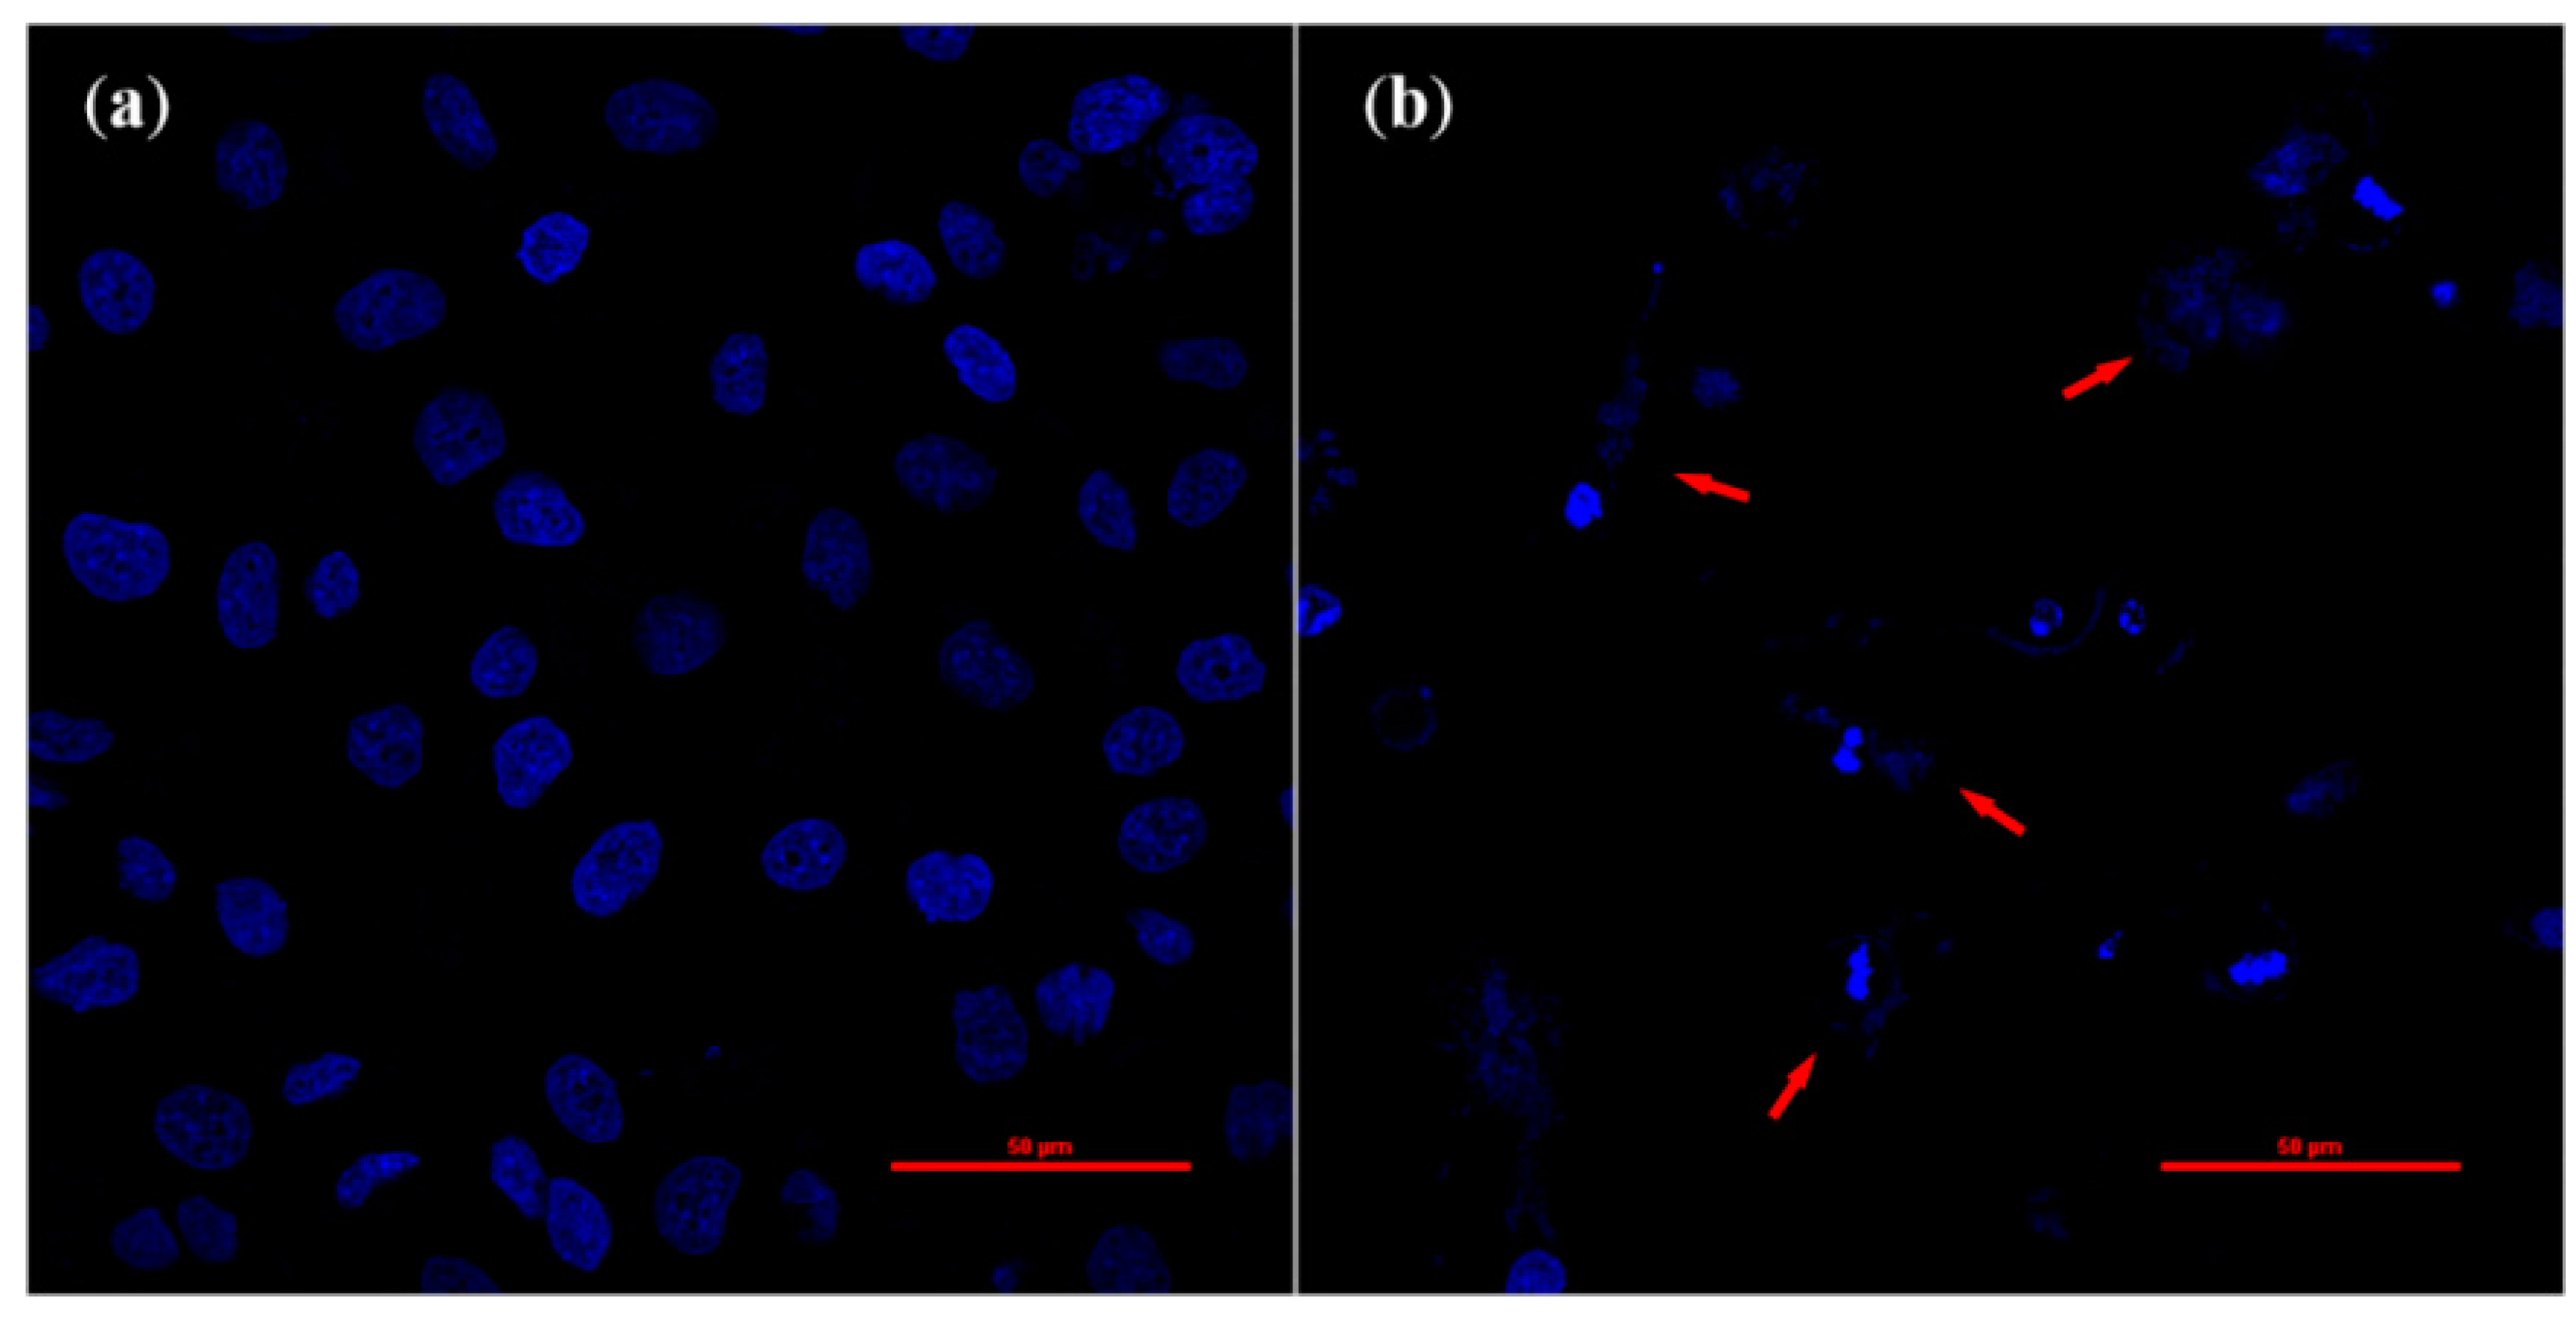
2.3. Cell Morphology Changes during Apoptosis

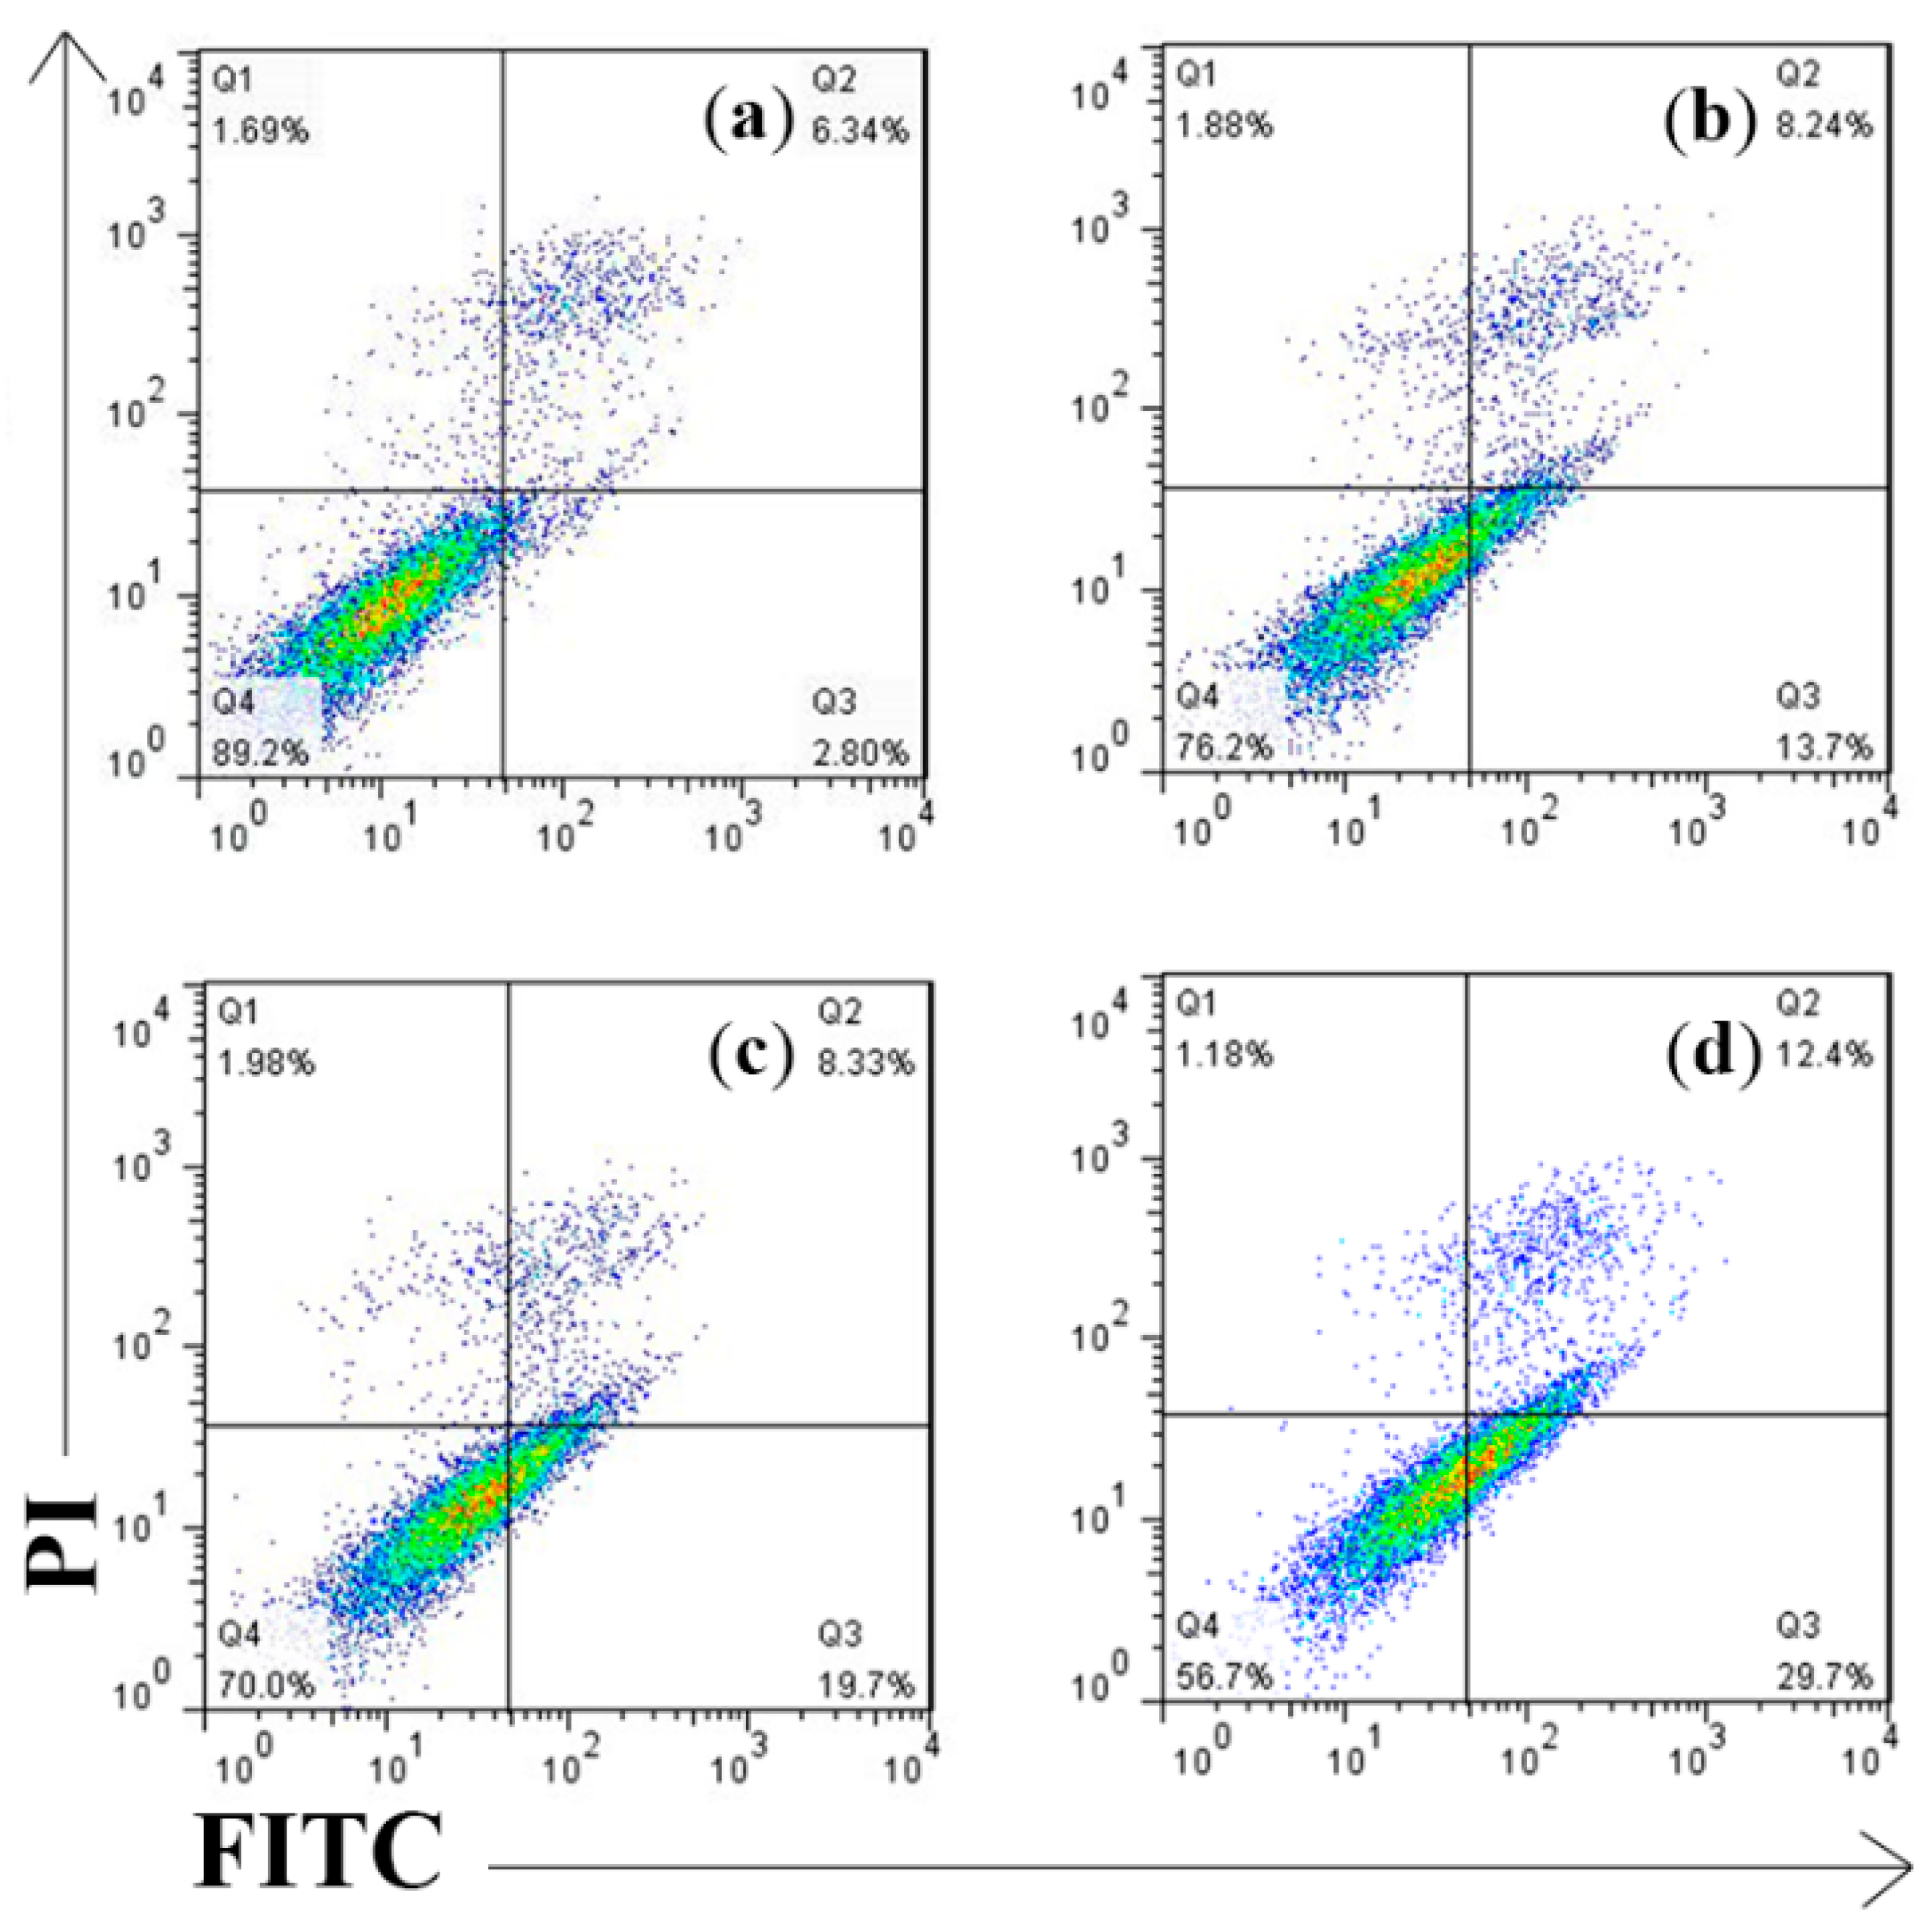
2.4. Cell Apoptosis Detected by Annexin V-FITC/PI Assay

3. Experimental Section
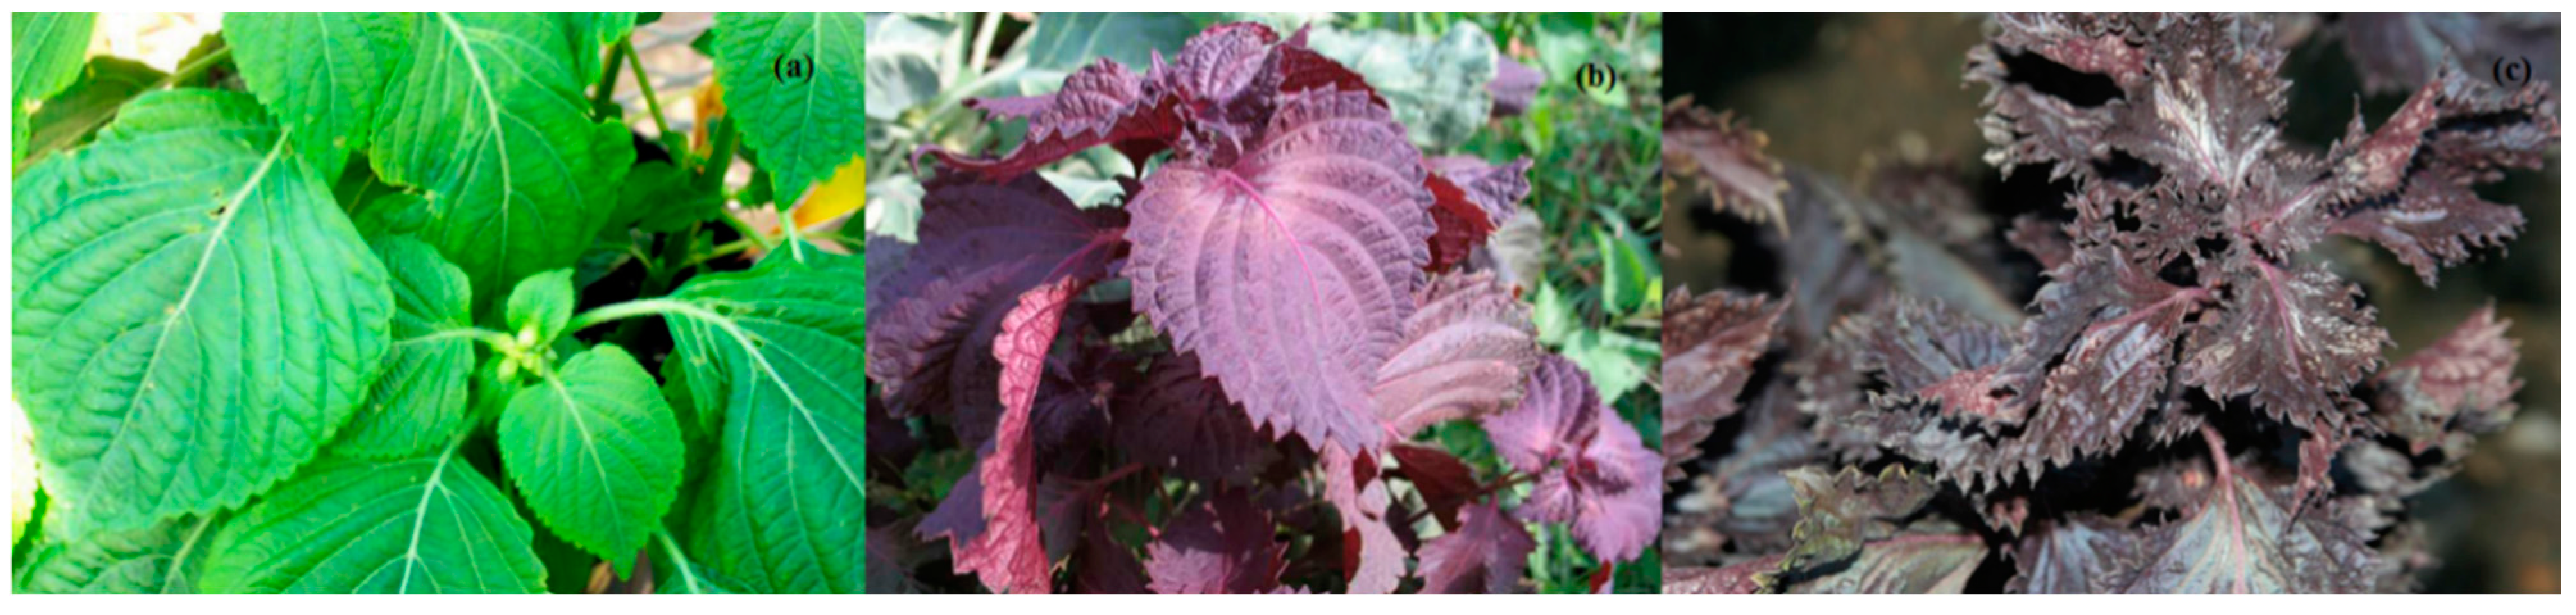
3.1. Plant Material
3.2. Reagents
3.3. Cell Lines
3.4. Extraction and Isolation
3.5. Total Anthocyanin Content (TAC)
3.6. UPLC-ESI-IT-TOF-MSn Analysis
3.7. DAPI Fluorescence Staining
3.8. Annexin-V FITC/PI Flow Cytometric Analysis
4. Conclusions
Supplementary Materials
Acknowledgments
Author Contributions
Conflicts of Interest
References
- Meng, L.; Lozano, Y.; Bombarda, I.; Gaydou, E.M.; Li, B. Polyphenol extraction from eight Perilla frutescens cultivars. C. R. Chim. 2009, 12, 602–611. [Google Scholar] [CrossRef]
- Nitta, M.; Lee, J.; Ohnishi, O. Asianperilla crops and their weedy forms: Their cultivation, utilization and genetic relationships. Econ. Bot. 2003, 57, 245–253. [Google Scholar] [CrossRef]
- Kim, D.H.; Kim, Y.C.; Choi, U.K. Optimization of antibacterial activity of Perilla frutescens var. acuta leaf against staphylococcus aureus using evolutionary operation factorial design technique. Int. J. Mol. Sci. 2011, 12, 2395–2407. [Google Scholar]
- Jun, H.I.; Kim, B.T.; Song, G.S.; Kim, Y.S. Structural characterization of phenolic antioxidants from purple perilla (Perilla frutescens var. acuta) leaves. Food Chem. 2014, 148, 367–372. [Google Scholar] [CrossRef]
- Oh, H.A.; Park, C.S.; Ahn, H.J.; Park, Y.S.; Kim, H.M. Effect of Perilla frutescens var. acuta kudo and rosmarinic acid on allergic inflammatory reactions. Exp. Biol. Med. 2011, 236, 99–106. [Google Scholar]
- Yoshida, K.; Kondo, T.; Kameda, K.; Goto, T. Structure of anthocyanins isolated from purple leaves of Perilla ocimoides L. var. crispa benth and their isomerization by irradiation of light. Agric. Biol. Chem. 1990, 54, 1745–1751. [Google Scholar]
- Yamazaki, M.; Nakajima, J.; Yamanashi, M.; Sugiyama, M.; Makita, Y.; Springob, K.; Awazuhara, M.; Saito, K. Metabolomics and differential gene expression in anthocyanin chemo-varietal forms of Perilla frutescens. Phytochemistry 2003, 62, 987–995. [Google Scholar] [CrossRef] [PubMed]
- Meng, L.; Lozano, Y.F.; Gaydou, E.M.; Li, B. Antioxidant activities of polyphenols extracted from Perilla frutescens varieties. Molecules 2009, 14, 133–140. [Google Scholar] [CrossRef]
- Wang, L.S.; Stoner, G.D. Anthocyanins and their role in cancer prevention. Cancer Lett. 2008, 269, 281–290. [Google Scholar] [CrossRef] [PubMed]
- Chang, Y.C.; Huang, H.P.; Hsu, J.D.; Yang, S.F.; Wang, C.J. Hibiscus anthocyanins rich extract-induced apoptotic cell death in human promyelocytic leukemia cells. Toxicol. Appl. Pharmacol. 2005, 205, 201–212. [Google Scholar] [CrossRef] [PubMed]
- Chirinos, R.; Campos, D.; Betalleluz, I.; Giusti, M.M.; Schwartz, S.J.; Tian, Q.; Pedreschi, R.; Larondelle, Y. High-performance liquid chromatography with photodiode array detection (HPLC-DAD)/HPLC-Mass spectrometry (MS) profiling of anthocyanins from andean mashua tubers (tropaeolum tuberosum ruiz and pavon) and their contribution to the overall antioxidant activity. J. Agric. Food Chem. 2006, 54, 7089–7097. [Google Scholar] [CrossRef] [PubMed]
- Lee, M.J.; Park, J.S.; Choi, D.S.; Jung, M.Y. Characterization and quantitation of anthocyanins in purple-fleshed sweet potatoes cultivated in korea by HPLC-DAD and HPLC-ESI-QTOF-MS/MS. J. Agric. Food Chem. 2013, 61, 3148–3158. [Google Scholar] [CrossRef] [PubMed]
- Bridle, P.; Timberlake, C. Anthocyanins as natural food colours—Selected aspects. Food Chem. 1997, 58, 103–109. [Google Scholar] [CrossRef]
- Yamazaki, M.; Makita, Y.; Springob, K.; Saito, K. Regulatory mechanisms for anthocyanin biosynthesis in chemotypes of Perilla frutescens var. crispa. Biochem. Eng. J. 2003, 14, 191–197. [Google Scholar] [CrossRef]
- Bunea, A.; Rugina, D.; Sconta, Z.; Pop, R.M.; Pintea, A.; Socaciu, C.; Tabaran, F.; Grootaert, C.; Struijs, K.; VanCamp, J. Anthocyanin determination in blueberry extracts from various cultivars and their antiproliferative and apoptotic properties in b16-f10 metastatic murine melanoma cells. Phytochemistry 2013, 95, 436–444. [Google Scholar] [CrossRef] [PubMed]
- Qi, C.; Li, S.; Jia, Y.; Wang, L. Blueberry anthocyanins induce G2/M cell cycle arrest and apoptosis of oral cancer kb cells through down-regulation methylation of p53. Zhongguo yi Chuan Xue Hui Bian Ji 2014, 36, 566–573. [Google Scholar]
- Sehitoglu, M.H.; Farooqi, A.A.; Qureshi, M.Z.; Butt, G.; Aras, A. Anthocyanins: Targeting of signaling networks in cancer cells. Asian Pac. J. Cancer Prev. APJCP 2014, 15, 2379–2381. [Google Scholar] [CrossRef]
- Zou, T.; Wang, D.; Guo, H.; Zhu, Y.; Luo, X.; Liu, F.; Ling, W. Optimization of microwave-assisted extraction of anthocyanins from mulberry and identification of anthocyanins in extract using HPLC-ESI-MS. J. Food Sci. 2012, 77, C46–C50. [Google Scholar] [CrossRef] [PubMed]
- Kerio, L.C.; Wachira, F.N.; Wanyoko, J.K.; Rotich, M.K. Characterization of anthocyanins in kenyan teas: Extraction and identification. Food Chem. 2012, 131, 31–38. [Google Scholar] [CrossRef]
- Giusti, M.M.; Wrolstad, R.E. Characterization and measurement of anthocyanins by UV-visible spectroscopy. Curr. Protoc. Food Anal. Chem. 2001. [Google Scholar] [CrossRef]
- Sample Availability: Samples of the anthocyanin extract of P. frutescens var. acuta and the Hela cell line are available from the authors.
© 2015 by the authors. Licensee MDPI, Basel, Switzerland. This article is an open access article distributed under the terms and conditions of the Creative Commons Attribution license ( http://creativecommons.org/licenses/by/4.0/).
Share and Cite
He, Y.-K.; Yao, Y.-Y.; Chang, Y.-N. Characterization of Anthocyanins in Perilla frutescens var. acuta Extract by Advanced UPLC-ESI-IT-TOF-MSn Method and Their Anticancer Bioactivity. Molecules 2015, 20, 9155-9169. https://doi.org/10.3390/molecules20059155
He Y-K, Yao Y-Y, Chang Y-N. Characterization of Anthocyanins in Perilla frutescens var. acuta Extract by Advanced UPLC-ESI-IT-TOF-MSn Method and Their Anticancer Bioactivity. Molecules. 2015; 20(5):9155-9169. https://doi.org/10.3390/molecules20059155
Chicago/Turabian StyleHe, Yan-Kang, You-Yuan Yao, and Ya-Ning Chang. 2015. "Characterization of Anthocyanins in Perilla frutescens var. acuta Extract by Advanced UPLC-ESI-IT-TOF-MSn Method and Their Anticancer Bioactivity" Molecules 20, no. 5: 9155-9169. https://doi.org/10.3390/molecules20059155
APA StyleHe, Y.-K., Yao, Y.-Y., & Chang, Y.-N. (2015). Characterization of Anthocyanins in Perilla frutescens var. acuta Extract by Advanced UPLC-ESI-IT-TOF-MSn Method and Their Anticancer Bioactivity. Molecules, 20(5), 9155-9169. https://doi.org/10.3390/molecules20059155