Abstract
Elymus sibiricus as an important forage grass and gene pool for improving cereal crops, that is widely distributed in West and North China. Information on its genetic diversity and relationships is limited but necessary for germplasm collection, conservation and future breeding. Start Codon Targeted (SCoT) markers were used for studying the genetic diversity and relationships among 53 E. sibiricus accessions from its primary distribution area in China. A total of 173 bands were generated from 16 SCoT primers, 159 bands of which were polymorphic with the percentage of polymorphic bands (PPB) of 91.91%. Based upon population structure analysis five groups were formed. The cluster analysis separated the accessions into two major clusters and three sub-clusters, similar to results of principal coordinate analysis (PCoA). The molecular variance analysis (AMOVA) showed that genetic variation was greater within geographical regions (50.99%) than between them (49.01%). Furthermore, the study also suggested that collecting and evaluating E. sibiricus germplasm for major geographic regions and special environments broadens the available genetic base and illustrates the range of variation. The results of the present study showed that SCoT markers were efficient in assessing the genetic diversity among E. sibiricus accessions.
1. Introduction
Elymus L. is the largest genus of the tribe Triticeae and includes about 150 species worldwide []. Elymus sibiricus (Siberian wild rye) is one of the most important species of the genus. It is a perennial, self-pollinating and allotetraploid forage grass indigenous to northern Asia, but its geographic distribution extends from Sweden to Japan and even to parts of Alaska and Canada []. As a commercially useful species, as E. sibiricus is widely used in natural grassland and cultivated pastures due to excellent cold tolerance, good forage quality and adaptability, and it therefore plays an important role in Chinese animal husbandry and sustenance [].
Genetic diversity is the foundation of species diversity and an important precursor in a study of any species, because its quantity and distribution has an effect on the evolutionary potential of species or populations []. Information on the genetic diversity and relationships among E. sibiricus accessions is limited but necessary for germplasm collection, conservation and breeding program. Several previous studies have examined E. sibiricus accessions and populations from Qinghai-Tibet Plateau [,,] and worldwide [] with the goal of improving the understanding of breeding materials. However, the genetic diversity and variation of most native E. sibiricus accessions from its primary distribution area including Qinghai-Tibet Plateau, Sichuan, Gansu, Inner Mongolia, and Xinjiang Provinces have not been well characterized. Thus, further analysis of the genetic diversity and variation of Chinese wild E. sibiricus accessions, cultivars and breeding lines from species range and their comparison may produce new insights and give a better understanding of the distribution of genetic diversity.
Traditional DNA markers have numerous applications in plant genetic diversity research. These markers include inter simple sequence repeat (ISSR) markers [], sequence-related amplified polymorphism (SRAP) markers [], and simple sequence repeat (SSR) markers [] etc. In recent years, many new alternative and promising markers techniques have emerged. Start Codon Targeted (SCoT) polymorphisms are dominant and reproducible markers that are based on the short conserved region in plant genes surrounding the ATG translation start (or initiation) codon and use a single 18-mer primer in the polymerase chain reaction (PCR) assays and higher annealing temperature (50 °C) []. Markers are visualized by standard gel electrophoresis with agarose gels and staining making this technique suitable for the vast majority of plant research labs with standard equipment []. Lower recombination levels between SCoT markers and the gene/trait than random markers such as RAPDs, ISSRs or SSRs, making it possible to be used directly in marker-assisted breeding programs []. SCoT markers have been successfully used to assess genetic diversity and structure, identify cultivars, and for quantitative trait loci (QTL) mapping and DNA fingerprinting in different species, including rice, tritordeums, sugarcane, grape, potato, mango, myrica rubra, peanut, and garbanzo [,,,,,,,,,].
The present study examines the level of genetic diversity and its molecular variation of 53 E. sibiricus accessions from five geographic regions in China. The purposes of this study were: (a) to assess the genetic diversity and phylogenetic relationship among 53 E. sibiricus accessions; and (b) to examine the effectiveness of the SCoT markers in E. sibiricus genetic diversity study. These results could facilitate E. sibiricus germplasm collection, conservation and future breeding.
2. Results and Discussion
2.1. Polymorphism of SCoT Markers
We analyzed the genetic diversity and variation of 53 E. sibiricus accessions from the species range in China (Table 1, Figure 1). A total of 173 bands were generated from 16 SCoT primers (Table 2). The total bands (TB) per primer ranged from six (SCoT30 and SCoT54) to 18 (SCoT23). The average band per primer was 10.8. The percentage of polymorphic bands (91.91%) was higher than the PPB values previous studies of SRAP variation (PPB = 86.48%) [], SSR variation (PPB = 86.88%) [], ISSR variation (PPB = 77.20%) [], and RAPD variation (PPB = 78.65%) []. Previous studies showed that environment parameters are highly correlated with the magnitude and distribution of genetic diversity [,]. Compared with previous genetic diversity studies that mainly focused on populations or accessions from the Qinghai-Tibet Plateau, the present study had a wide geographical range. Thus, diverse geographical origin or ecological conditions may have contributed to the higher genetic diversity found among the E. sibiricus accessions tested.
Figure 1.
The geographic distribution of materials used in the study.
Polymorphic information content (PIC) varied from 0.20 (SCoT54) to 0.50 (SCoT41, SCoT42, SCoT62) with an average of 0.45 for this species. The resolving power (Rp) of the 16 SCoT primers ranged from 1.40 (SCoT54) to 6.49 (SCoT41). These primers (e.g. SCoT41, SCoT62) with higher PIC and Rp values have more potential for further study, allowing investigating more individuals or sampling sites with a reduced number of primers.
Table 1.
E. sibiricus accessions used in the study.
| POP | Code | Accession | Origin | Status |
|---|---|---|---|---|
| QX | 1 | Tongde | Qinghai, China | Cultivar |
| QX | 2 | PI504462 | Qinghai, China | Wild |
| QX | 3 | Qingmu1 | Qinghai, China | Cultivar |
| QX | 4 | PI504463 | Qinghai, China | Wild |
| QX | 5 | PI531669 | Qinghai, China | Wild |
| QX | 6 | PI639859 | Tibet, China | Wild |
| XJ | 7 | PI499468 | Xinjiang, China | Cultivated |
| XJ | 8 | PI499462 | Xinjiang, China | Wild |
| XJ | 9 | PI619577 | Xinjiang, China | Wild |
| XJ | 10 | PI595182 | Xinjiang, China | Wild |
| XJ | 11 | PI499614 | Xinjiang, China | Wild |
| XJ | 12 | PI499617 | Xinjiang, China | Wild |
| XJ | 13 | PI499619 | Xinjiang, China | Wild |
| XJ | 14 | PI595180 | Xinjiang, China | Wild |
| XJ | 15 | PI655140 | Xinjiang, China | Wild |
| XJ | 16 | Y2003 | Xinjiang, China | Wild |
| SC | 17 | Y1005 | Sichuan, China | Wild |
| SC | 18 | Chuancao2 | Hongyuan, Sichuan, China | Cultivar |
| SC | 19 | Hongyuan | Hongyuan, Sichuan, China | Breeding line |
| SC | 20 | SAU133 | Aba, Sichuan, China | wild |
| SC | 21 | SAU139 | Kangding, Sichuan, China | Wild |
| SC | 22 | SAU003 | Kangding, Sichuan, China | wild |
| SC | 23 | SAU137 | Aba, Sichuan, China | Wild |
| SC | 24 | SC02 | Ruoergai, Sichuan, China | Wild |
| SC | 25 | SC03 | Ruoergai, Sichuan, China | Wild |
| NM | 26 | PI499457 | Inner Mongolia, China | Cultivated |
| NM | 27 | PI499453 | Inner Mongolia, China | Wild |
| NM | 28 | PI499456 | Inner Mongolia, China | Cultivated |
| NM | 29 | PI499458 | Inner Mongolia, China | Cultivated |
| NM | 30 | PI499459 | Inner Mongolia, China | Cultivated |
| NM | 31 | W6 614214 | Inner Mongolia, China | Cultivated |
| GS | 32 | MQ01 | Maqu, Gansu, China | Wild |
| GS | 33 | HZ01 | Hezuo, Gansu, China | Wild |
| GS | 34 | HZ02 | Hezuo, Gansu, China | Wild |
| GS | 35 | HZ03 | Hezuo, Gansu, China | Wild |
| GS | 36 | XH03 | Xiahe, Gansu, China | Wild |
| GS | 37 | XH09 | Xiahe, Gansu, China | Wild |
| GS | 38 | XH02 | Xiahe, Gansu, China | Wild |
| GS | 39 | XH06 | Xiahe, Gansu, China | Wild |
| GS | 40 | LT04 | Lintan, Gansu, China | Wild |
| GS | 41 | LT02 | Lintan, Gansu, China | Wild |
| GS | 42 | LT05 | Lintan, Gansu, China | Wild |
| GS | 43 | LT01 | Lintan, Gansu, China | Wild |
| GS | 44 | LQ01 | Luqu, Gansu, China | Wild |
| GS | 45 | LQ03 | Luqu, Gansu, China | Wild |
| GS | 46 | LQ04 | Luqu, Gansu, China | Wild |
| GS | 47 | LQ09 | Luqu, Gansu, China | Wild |
| GS | 48 | LQ10 | Luqu, Gansu, China | Wild |
| GS | 49 | ZHN01 | Zhuoni, Gansu, China | Wild |
| GS | 50 | ZHN05 | Zhuoni, Gansu, China | Wild |
| GS | 51 | ZHN06 | Zhuoni, Gansu, China | Wild |
| GS | 52 | ZHN03 | Zhuoni, Gansu, China | Wild |
| GS | 53 | ZHN04 | Zhuoni, Gansu, China | Wild |
Note: QX = Qinghai-Tibet Plateau; XJ = Xinjiang, China; SC = Sichuan, China; NM = Inner Mongolia, China; GS = Gansu, China.
Table 2.
16 SCoT primers used to genotype E. sibiricus accessions, cultivars and breeding line, the total bands (TB), polymorphic bands (PB), percentage of polymorphic bands (PPB). Polymorphic information content (PIC), and resolving power of primer (Rp).
| Primer ID | Primer Sequence (5'–3') | TB | PB | PPB(%) | PIC | Rp |
|---|---|---|---|---|---|---|
| SCoT 5 | CAACAATGGCTACCACGA | 10 | 9 | 90.00 | 0.45 | 2.65 |
| SCoT 7 | CAACAATGGCTACCACGG | 7 | 6 | 85.7 | 0.41 | 2.53 |
| SCoT 9 | CAACAATGGCTACCAGCA | 12 | 9 | 75.00 | 0.44 | 3.35 |
| SCoT 10 | CAACAATGGCTACCAGCC | 13 | 11 | 84.62 | 0.45 | 2.40 |
| SCoT 23 | CACCATGGCTACCACCAG | 18 | 18 | 100.00 | 0.47 | 5.20 |
| SCoT 26 | ACCATGGCTACCACCGTC | 10 | 10 | 100.00 | 0.47 | 3.59 |
| SCoT 30 | CCATGGCTACCACCGGCG | 6 | 5 | 83.33 | 0.46 | 2.71 |
| SCoT 35 | CATGGCTACCACCGGCCC | 7 | 6 | 85.71 | 0.48 | 3.56 |
| SCoT 41 | CAATGGCTACCACTGACA | 17 | 16 | 94.12 | 0.50 | 6.49 |
| SCoT 42 | CAATGGCTACCATTAGCG | 11 | 10 | 90.91 | 0.50 | 2.56 |
| SCoT 44 | CAATGGCTACCATTAGCC | 7 | 7 | 100.00 | 0.47 | 1.94 |
| SCoT 45 | ACAATGGCTACCACTGAC | 11 | 7 | 63.64 | 0.45 | 2.14 |
| SCoT 54 | ACAATGGCTACCACCAGC | 6 | 4 | 66.67 | 0.20 | 1.40 |
| SCoT 60 | ACAATGGCTACCACCACA | 12 | 9 | 75.00 | 0.47 | 3.67 |
| SCoT 61 | CAACAATGGCTACCACCG | 10 | 9 | 90.00 | 0.46 | 3.32 |
| SCoT 62 | ACCATGGCTACCACGGAG | 16 | 14 | 87.50 | 0.50 | 3.86 |
| Mean | 10.8 | 9.4 | 89.60 | 0.45 | --- | |
| Total | 173 | 159 | 91.91 | --- | 51.37 |
SCoT markers were used for the first time in E. sibiricus due to several advantages to other marker techniques: easier development of species-specific primers than SSR [], lower cost than AFLP [] and higher reproducibility than RAPD []. The results of the present study showed that SCoT markers were efficient in assessing the genetic diversity among E. sibiricus accessions.
2.2. Genetic Diversity Analysis
2.2.1. Genetic Diversity among Regions
The NPB values ranged from 52 (NM) to 97 (QX), with an average of 65.8. The PPB values ranged from 30.06% (XJ) to 56.07% (QX), with an average of 37.63% (Table 3). The Shannon information index of diversity (I) values ranged from 0.1615 to 0.3002, with an average of 0.1983. The Nei’s genetic diversity (H) values ranged from 0.1068 to 0.2217, with an average of 0.1369. And the observed number of alleles values (Na) ranged from 1.3006 to 1.5797, with an average of 1.3841. This results was similar to previous reports of SRAP [] (I = 0.2267, H = 0.1508) and SSR [] (I = 0.1930, H = 0.1296), but lower than ISSR [] (I = 0.269, H = 0.181) and RAPD [] (I = 0.263, H = 0.176). Among the five geographical regions, the higher genetic diversity was observed in QX (NPB = 97; PPB = 56.07%; I = 0.3002; H = 0.2217; Na = 1.5797), followed by SC > GS > XJ > NM. Some factors could cause the differentiation of genetic variation of five geographical regions: climate conditions [], topography [], and sample size [] etc. In many species, genetic variation is often positively associated with population size []. Different sample sizes of the five geographical regions may have an effect on measurement of genetic variation. However, eco-geographical factors may be more important than current sample size in determining patterns of diversity. Yan et al. [] found that latitude, longitude and altitude are important factors that influence genetic difference of Elymus species. For example, accessions from the QX group originated from Qinghai and Tibet. The wider geographical range and diverse weather conditions may have contributed to higher estimate of genetic diversity among accessions in QX group. Therefore, in order to broaden the genetic base and sample the full extent of available variation, collecting and evaluating E. sibiricus germplasm from wide geographic regions and special eco-environment is important.
Table 3.
Genetic variability within five geographic regions of E. sibiricus detected by SCoT markers.
| POP | NPB | PPB (%) | I | H | Na |
|---|---|---|---|---|---|
| QX | 97 | 56.07 | 0.3002 | 0.2217 | 1.5797 |
| XJ | 56 | 32.37 | 0.1662 | 0.1113 | 1.3237 |
| SC | 65 | 35.57 | 0.1978 | 0.1327 | 1.3757 |
| NM | 52 | 30.06 | 0.1657 | 0.1119 | 1.3006 |
| GS | 59 | 34.10 | 0.1615 | 0.1068 | 1.3410 |
| Mean | 65.8 | 37.63 | 0.1983 | 0.1369 | 1.3841 |
Note: NPB, number of polymorphic band; PPB, percentage of polymorphic bands; I, Shannon information index of diversity; H, Nei’s genetic diversity; Na, observed number of alleles.
2.2.2. Genetic Diversity within Regions
AMOVA analysis showed that 50.99% of variation was apportioned within geographic regions and 49.01% was apportioned among geographic groups (Table 4). Similar patterns of genetic variation were found in wild E. sibiricus populations and other self-pollinating species such as Elymus glaucus and Elymus trachycaulu [,]. Previous researches using RAPD marker [], ISSR marker [], SRAP marker [], and Gliadin [] detected 59.95%, 57.52%, 65.29% and 63.4% genetic variation within E. sibiricus populations, respectively.
Table 4.
Analysis of molecular variance (AMOVA) of five geographic regions.
| Source of Variance | d.f. | Sum of Squares | Variance Component | Total Variation (%) |
|---|---|---|---|---|
| Among geographic regions | 4 | 408.93 | 9.45 | 49.01 |
| Within geographic regions | 48 | 472.09 | 9.83 | 50.99 |
Previous reports revealed that self-pollinating species have relatively less within-population genetic variation than out-crossing species []. But other studies also demonstrated that gene mutation, gene flow, population size, sampling strategy can influence genetic variation [,,,]. In this study, accessions came from different geographic regions. Complex eco-geographical factors (e.g., intricate landforms and weather conditions) within the plant distribution may be related to genetic divergence within geographic regions, e.g., In Qinghai-Tibet Plateau, E. sibiricus germplasm are usually located in distant mountains, strongly isolated from each other by plateaus and valleys. These mountain and river valleys could serve as genetic barriers for pollinator movement and seed dispersal. The results of the present study suggested that more genetic variation of the species could be captured when sampling a larger number of plants from populations or geographic regions.
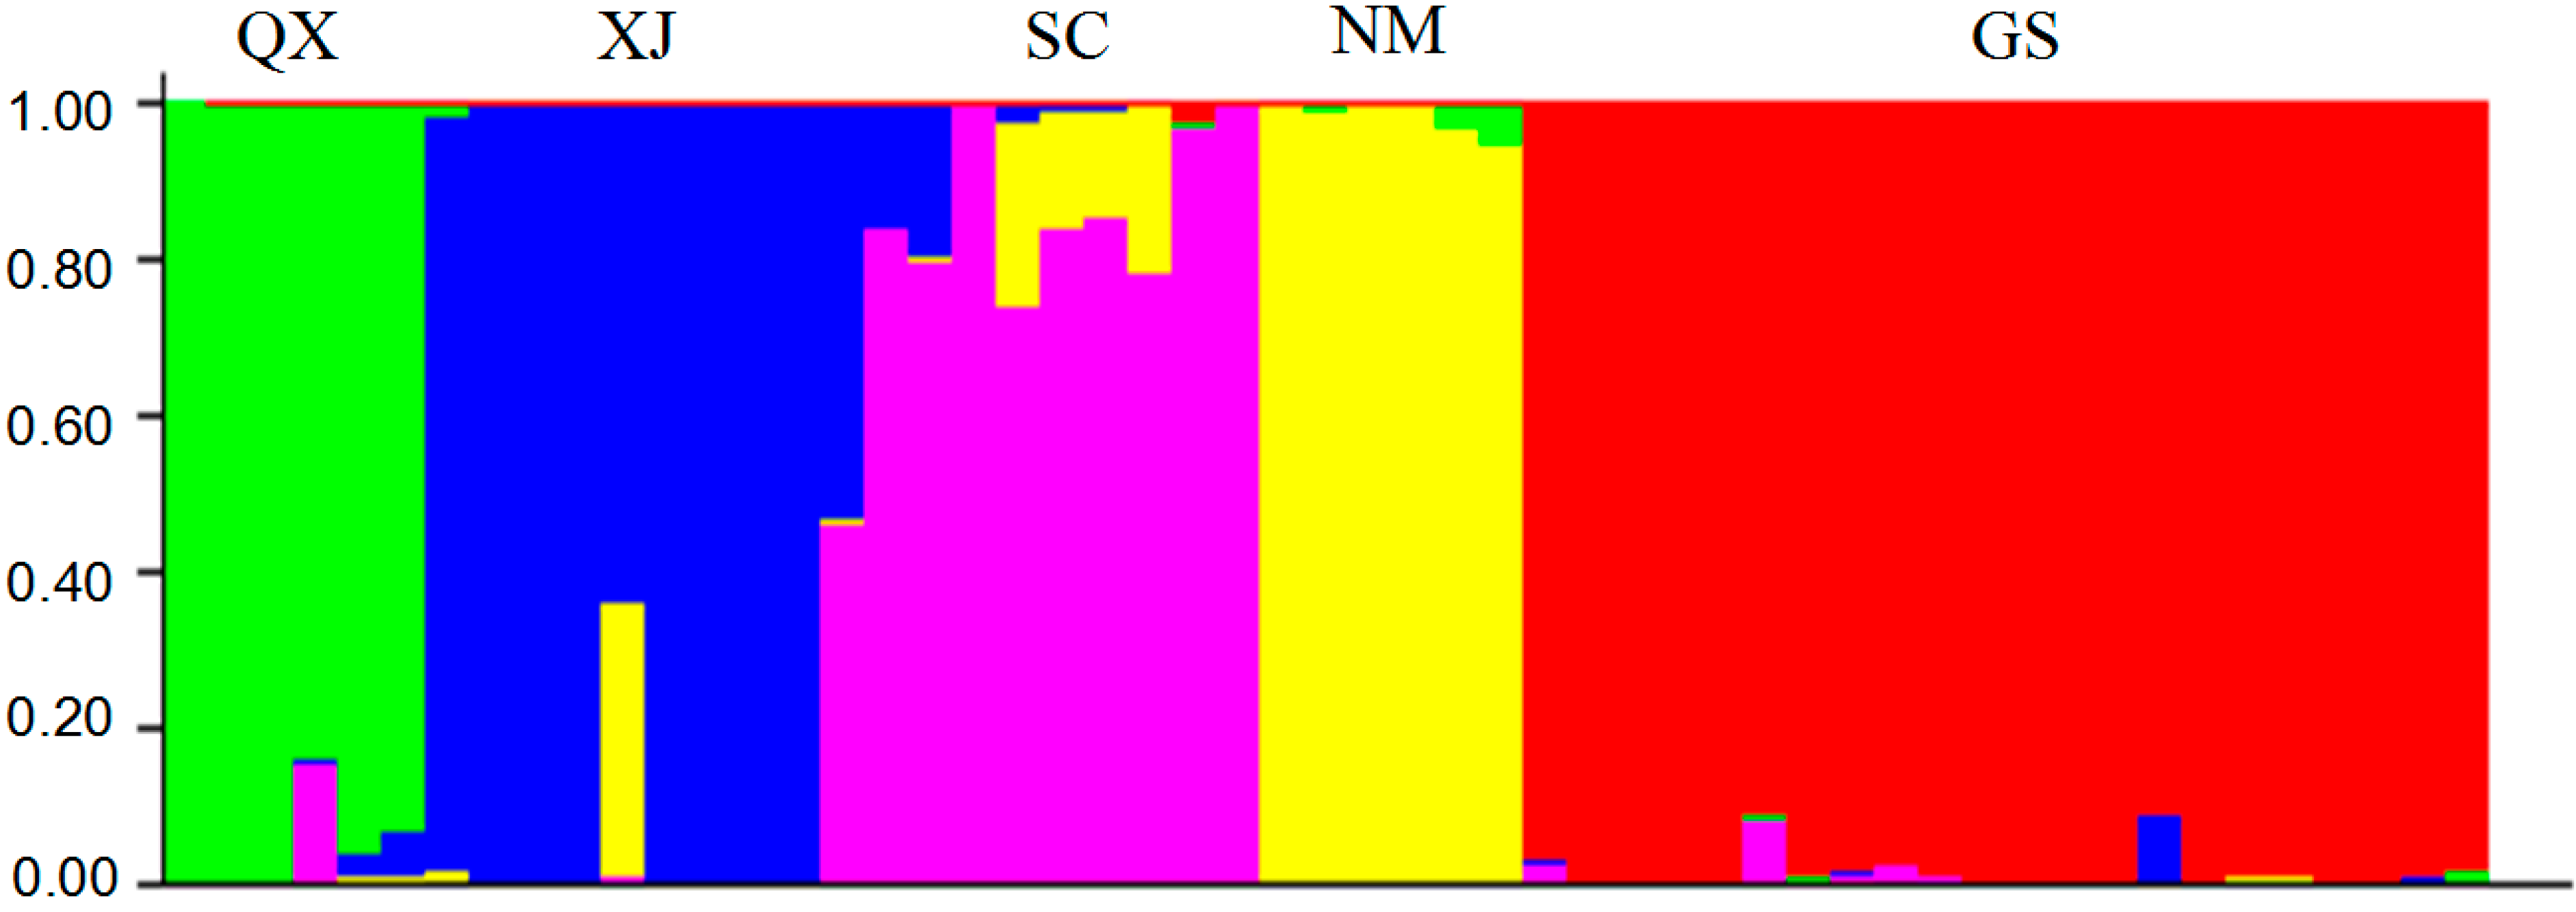
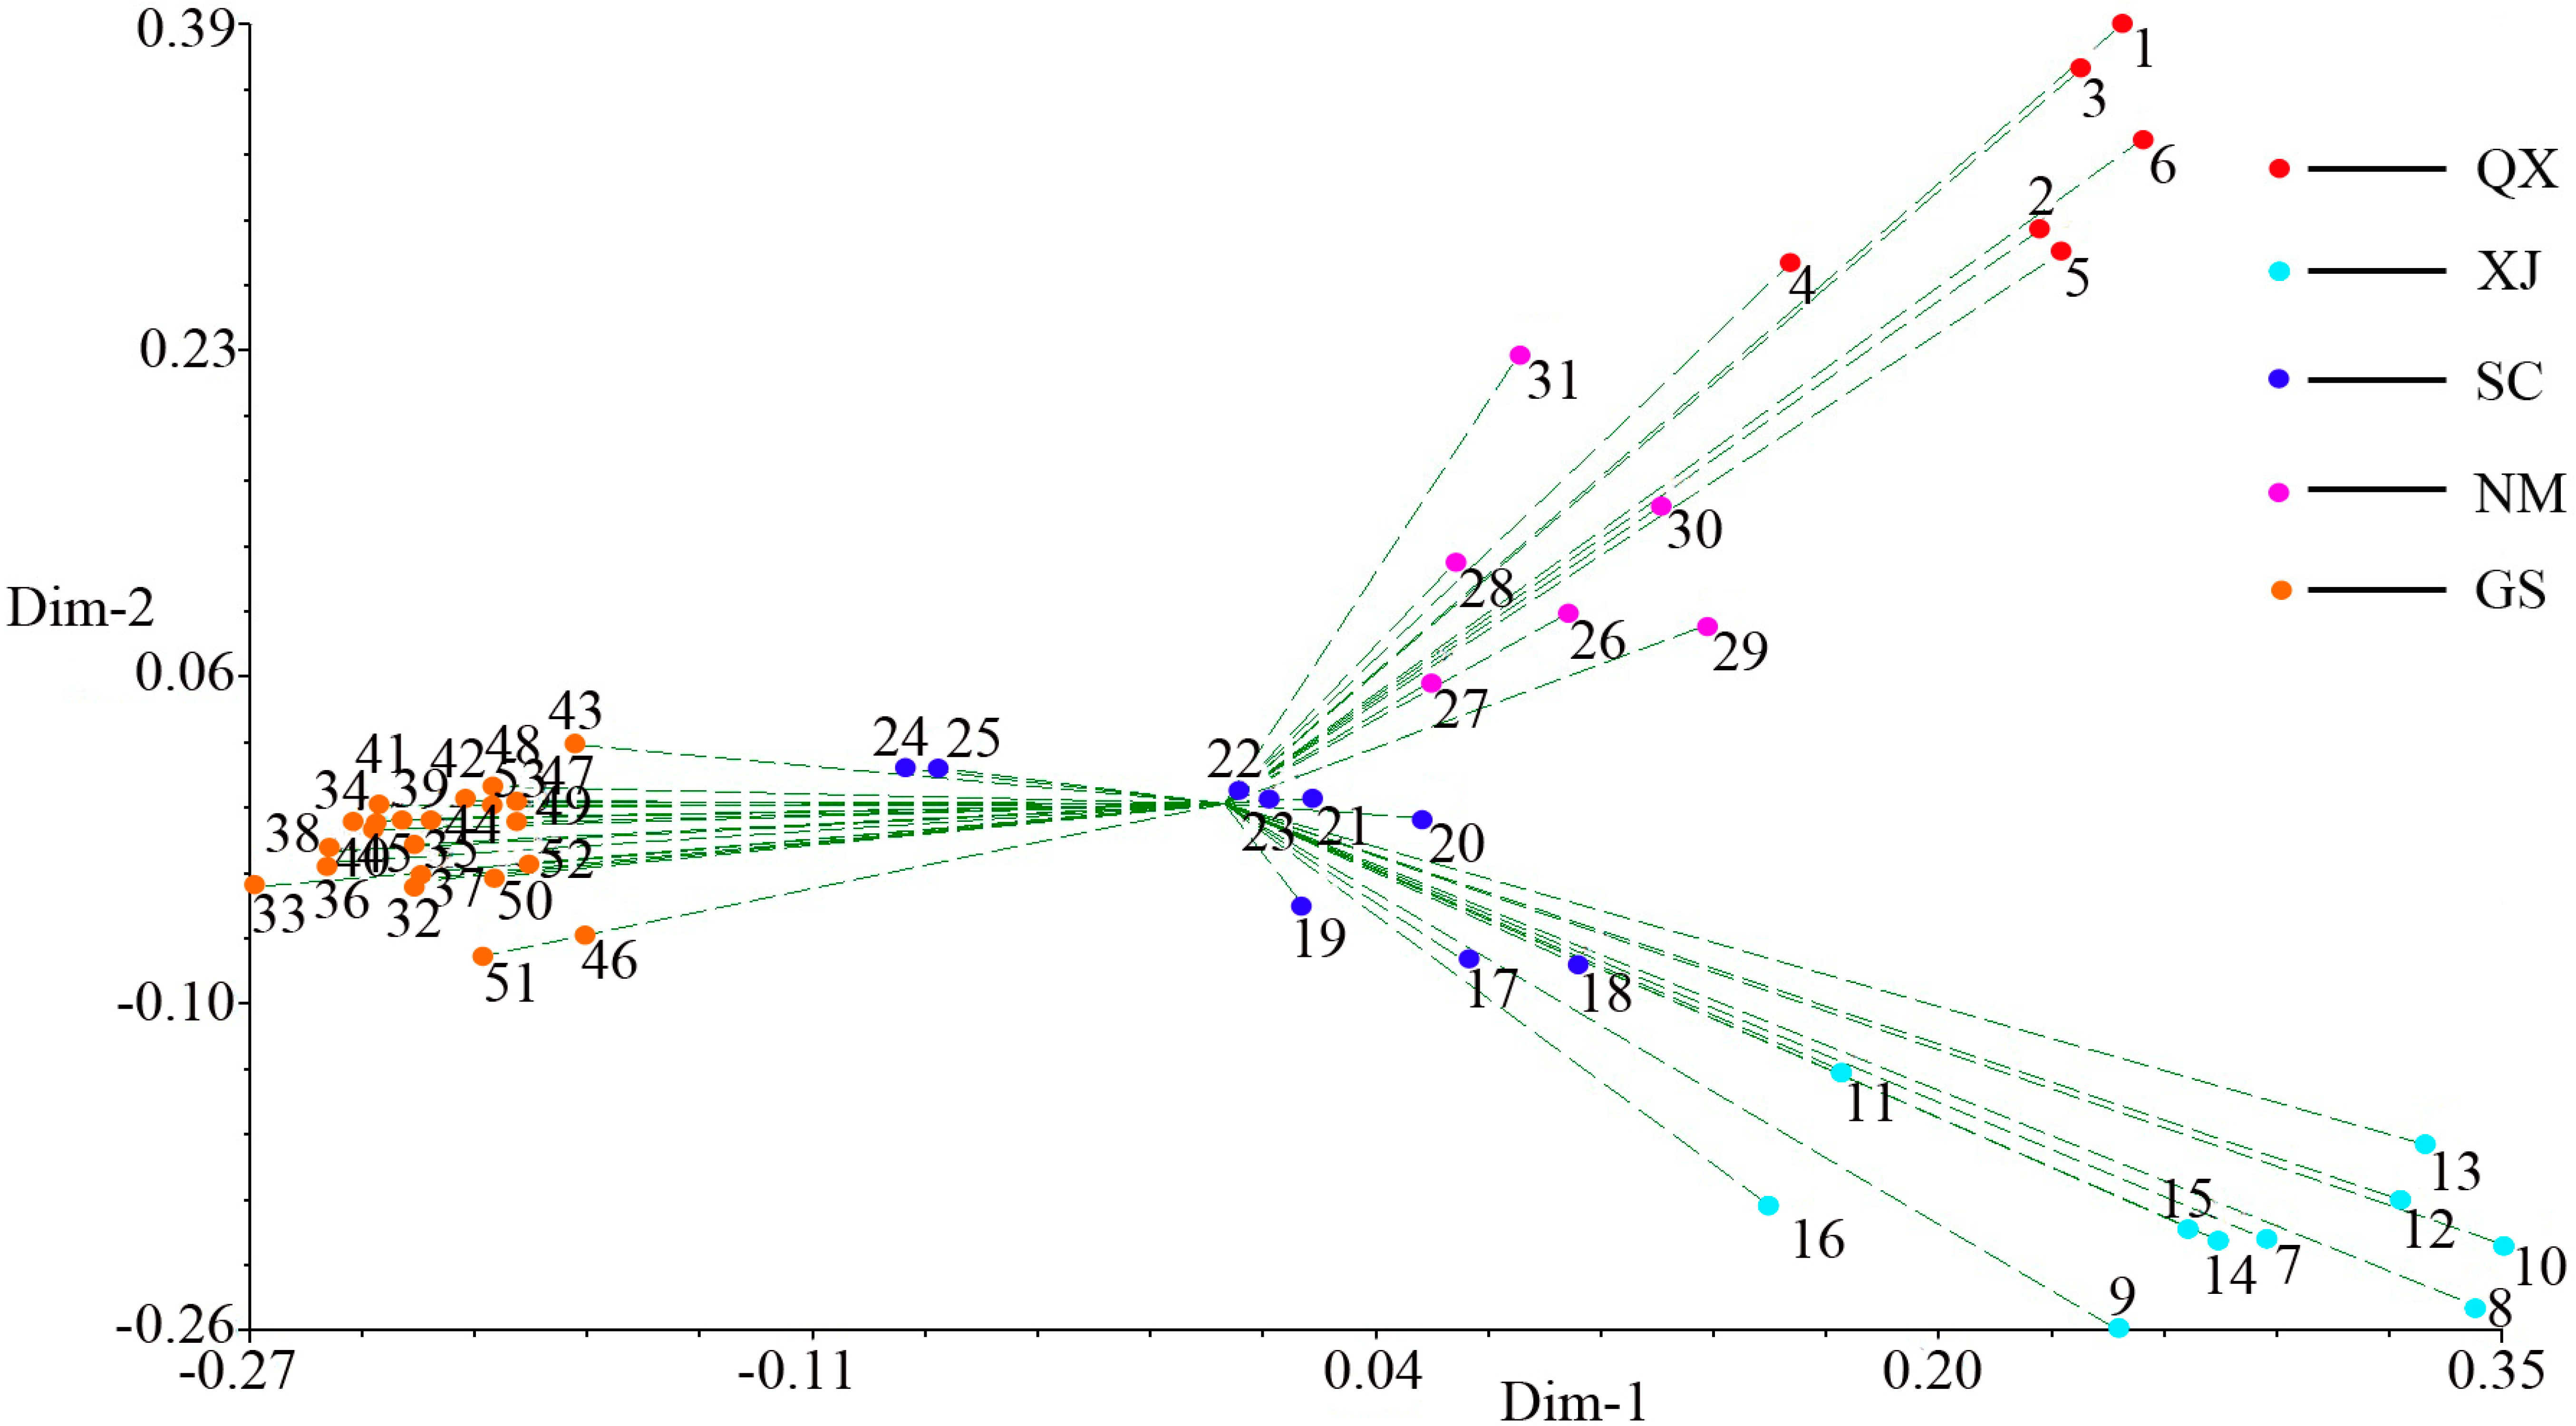
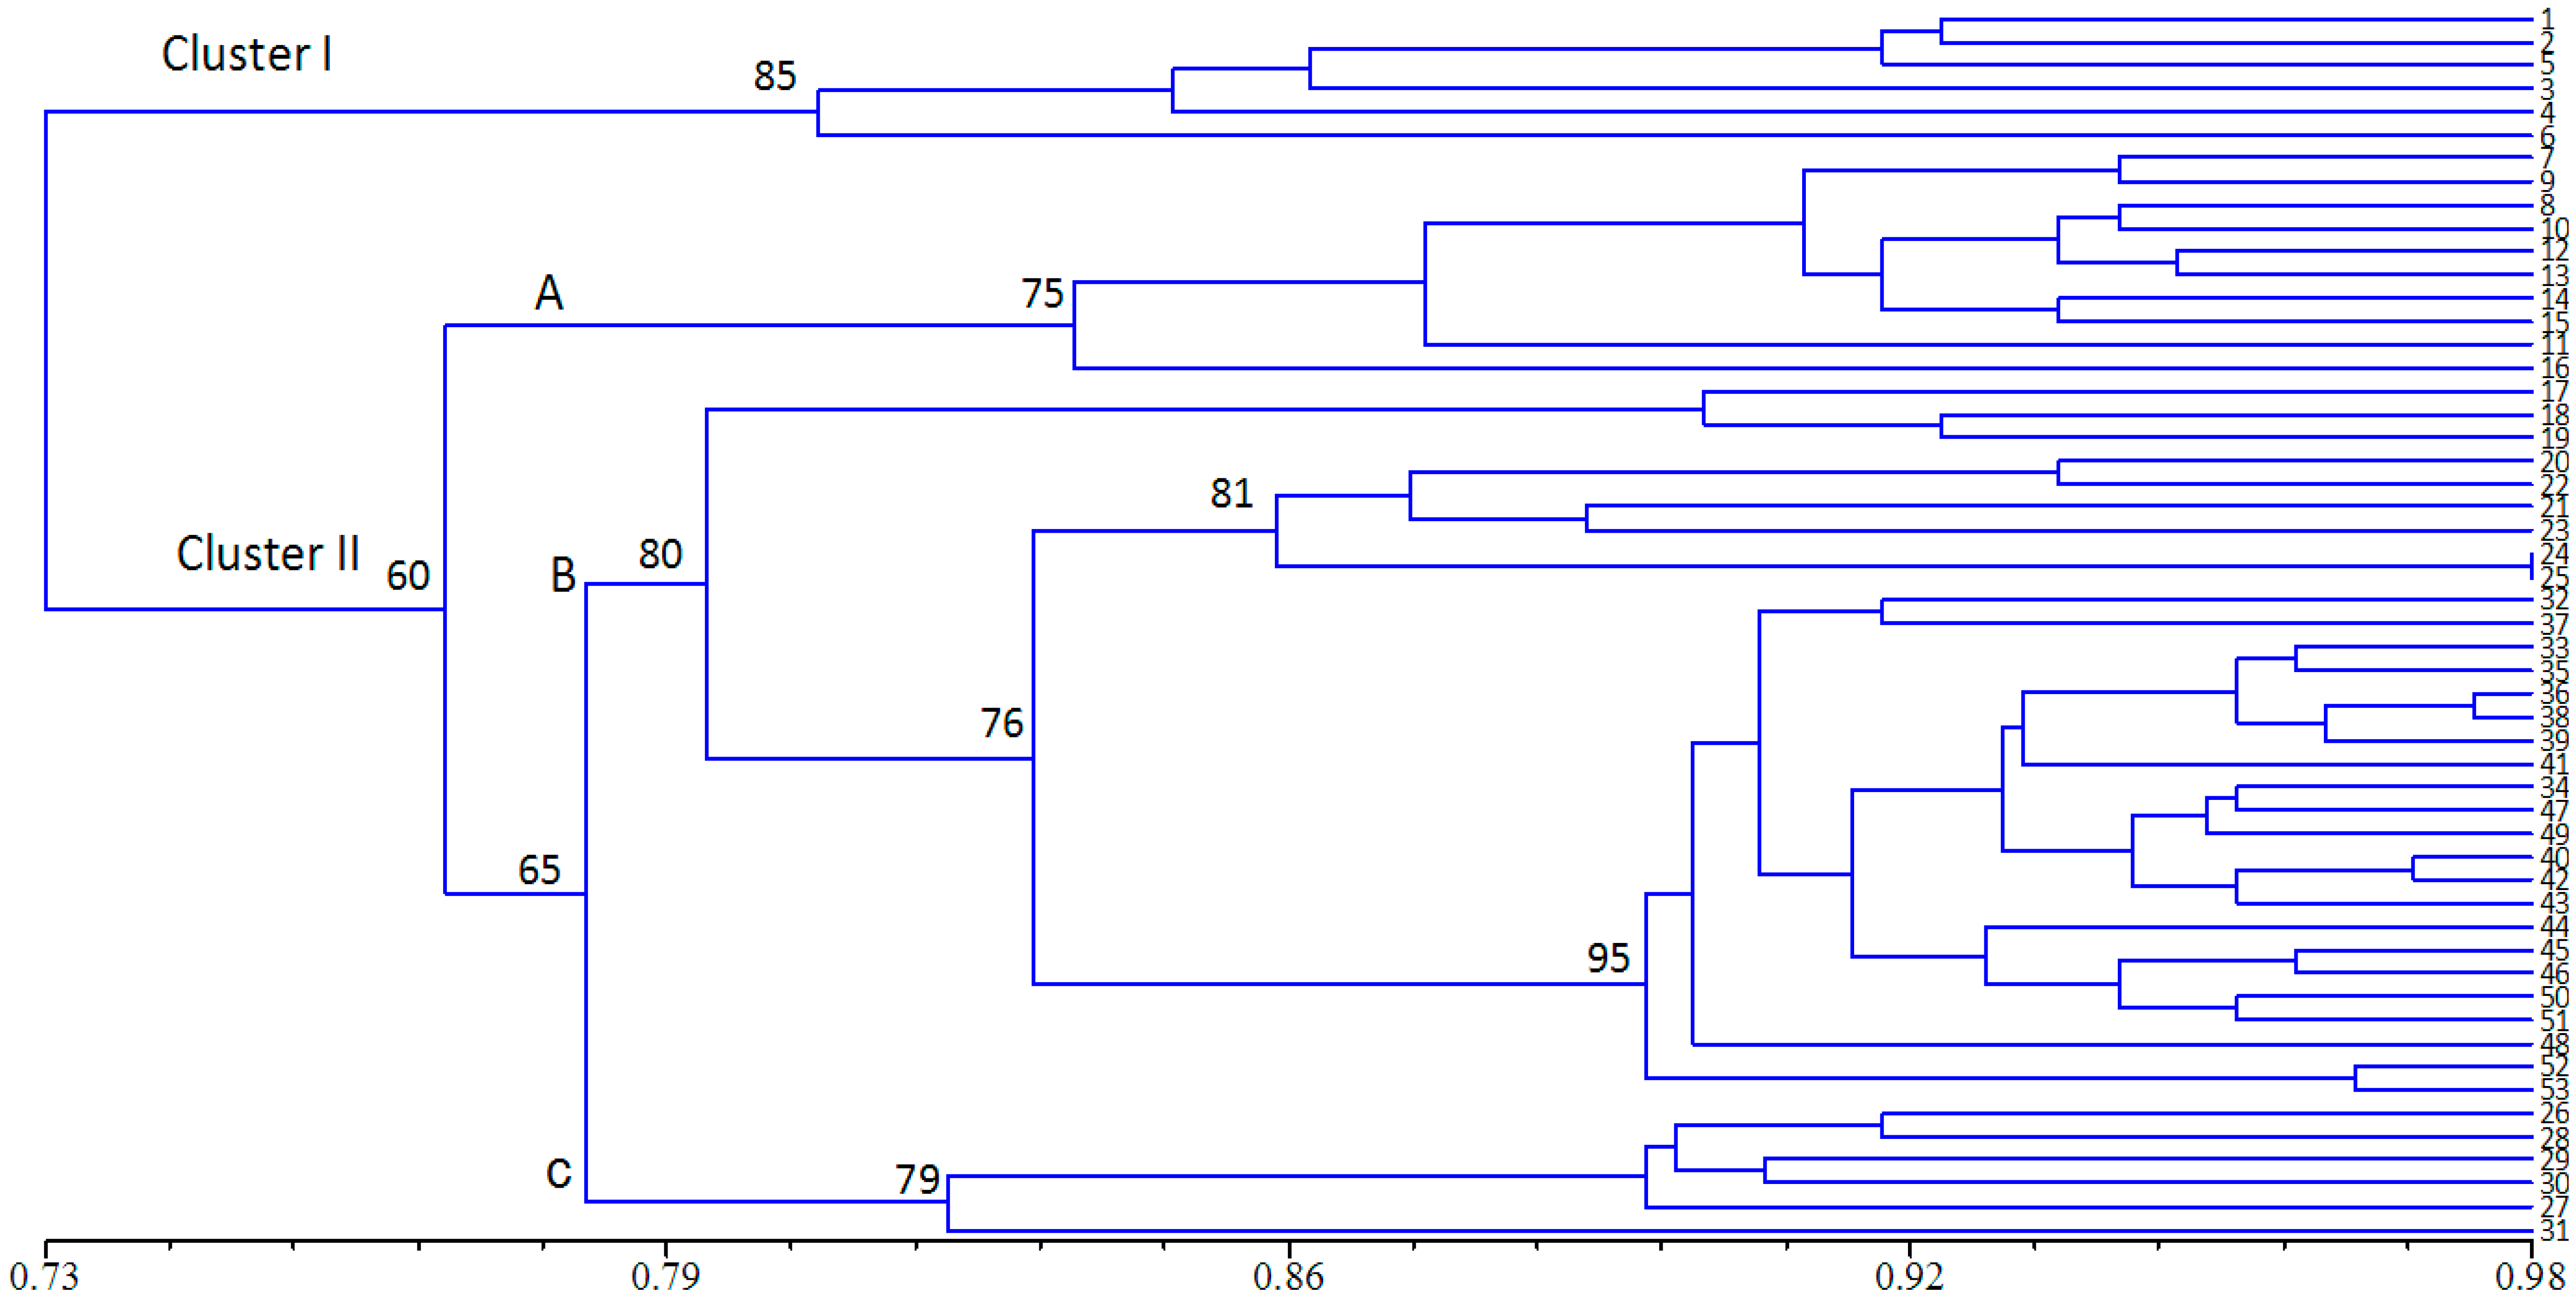
2.3. Population Structure and Cluster Analysis
The population structure of the 53 accessions was estimated using the Hardy-Weinberg Equilibrium by using STRUCTURE V2.3.4 software. Based on maximum likelihood and delta K (ΔK) values, the number of optimum groups was five (Figure 2). Among them, six accessions from Qinghai-Tibet Plateau were assigned to group 1 (QX); ten accessions from Xinjiang were assigned to group 2 (XJ); nine accessions from Sichuan were assigned to group 3 (SC); six accessions from Inner Mongolia were assigned to group 4 (NM); the rest twenty-two accessions from Gansu were assigned to group 5 (GS).
Figure 2.
Five subgroups of 53 E. sibiricus accessions inferred from STRUCTURE analysis. The vertical coordinate of each subgroup indicates the membership coefficients for each accessions. Green zone: QX; Blue zone: XJ; Pink zone: SC; Yellow zone: NM; Red zone: GS.
A dendrogram was constructed using data from UPGMA cluster analysis based on the genetic similarity matrix from all the accessions (Figure 3). The 53 accessions were clustered into two major clusters (with a similarity index of 0.73). Cluster I included 6 accessions collected from Qinghai and Tibet. Cluster II included 47 accessions: six from Inner Mongolia, nine from Sichuan, ten from Xinjiang, and twenty-two from Gansu. Furthermore, cluster II was classed into three sub-clusters. The first cluster (A) included all ten accessions from Xinjiang. The second cluster (B) included thirty one accessions collected from Sichuan and Gansu. The third cluster (C) included six accessions from Inner Mongolia. The dendrogram was almost in accordance with geographic origin of E. sibiricus, but this trend isn’t absolute. For example, nine Sichuan accessions were divided into two clusters. Six accessions were grouped with Gansu accessions with 76% bootstrap support. Ma et al. [] evaluated eight E. sibiricus populations from the eastern Qinghai-Tibet Plateau regions using ISSR markers, which showed that there was no distinct geographical tendency in the distribution of the genetic diversity. Some geographically close accessions were clustered in different groups and geographically distant ones were clustered in the same groups. The various selection forces tend to produce genetic heterogeneity under the different small niches []. Moreover, the role of ecological factors in determining the extent and distribution of genetic diversity has been well documented [,,]. Qinghai-Tibet Plateau is geographically isolated from other regions by towering mountains, which could result in the genetic difference between cluster I and cluster II. The relationship observed in the principal coordinate analysis (PCoA) was in agreement with the UPGMA analysis: about 42.43% of the total variation was described by the first three PCo, with PCo1 accounting for 21.83%, PCo2 for 12.00% and PCo3 for 8.60%, respectively (Figure 4). This multivariate approach was chosen to complement the cluster analysis information, because cluster analysis has a higher resolution for analysis of closely related populations, whereas the PCoA is more informative regarding distances among major groups.
2.4. Conservation Implications
It is critical to understand the genetic diversity and variation among and within accessions to choose the effective strategy for conservation and sampling management. In this study, SCoT provided significant information on the genetic variation of E. sibiricus accessions and demonstrated an effective tool for the future tasks of genetic analysis, germplasm collection and conservation. The high degree of genetic variation and distinct geographical differentiation of E. sibiricus had been documented in this study. The ecological factors such as climatic types and eco-environment played a pivotal role in the divergence. Therefore, more attention should be paid to special eco-geographical groups (e.g., Qinghai-Tibet Plateau) with regard to the E. sibiricus germplasm collection and conservation.A major limitation of plant improvement programs is the lack of plant materials exhibiting rich genetic variation []. Past studies in wheatgrass [] and orchardgrass [] have demonstrated the importance of incorporation of useful genetic diversity into cultivars or cultivated materials. Based on Population structure and cluster analysis, most wild accessions from Xinjiang, Gansu and Inner Mongolia have been identified as genetically divergent to three E. sibiricus cultivars: “Tongde”, “Qingmu 1” and “Chuancao 2”. Thus, these accessions could be used as important genetic resources for genetic improvement of E. sibiricus in future breeding program.
Figure 3.
UPGMA-derived dendrogram of 53 E. sibiricus accessions based on Jaccard’s genetic similarity, only bootstrap values higher than 50% are presented. Accessions designations refer to Table 1.
Figure 4.
Principal coordinates analysis for the first and second coordinates estimated for SCoT markers using Jaccard’s genetic similarity matrix for 53 E. sibiricus accessions.
3. Experimental Section
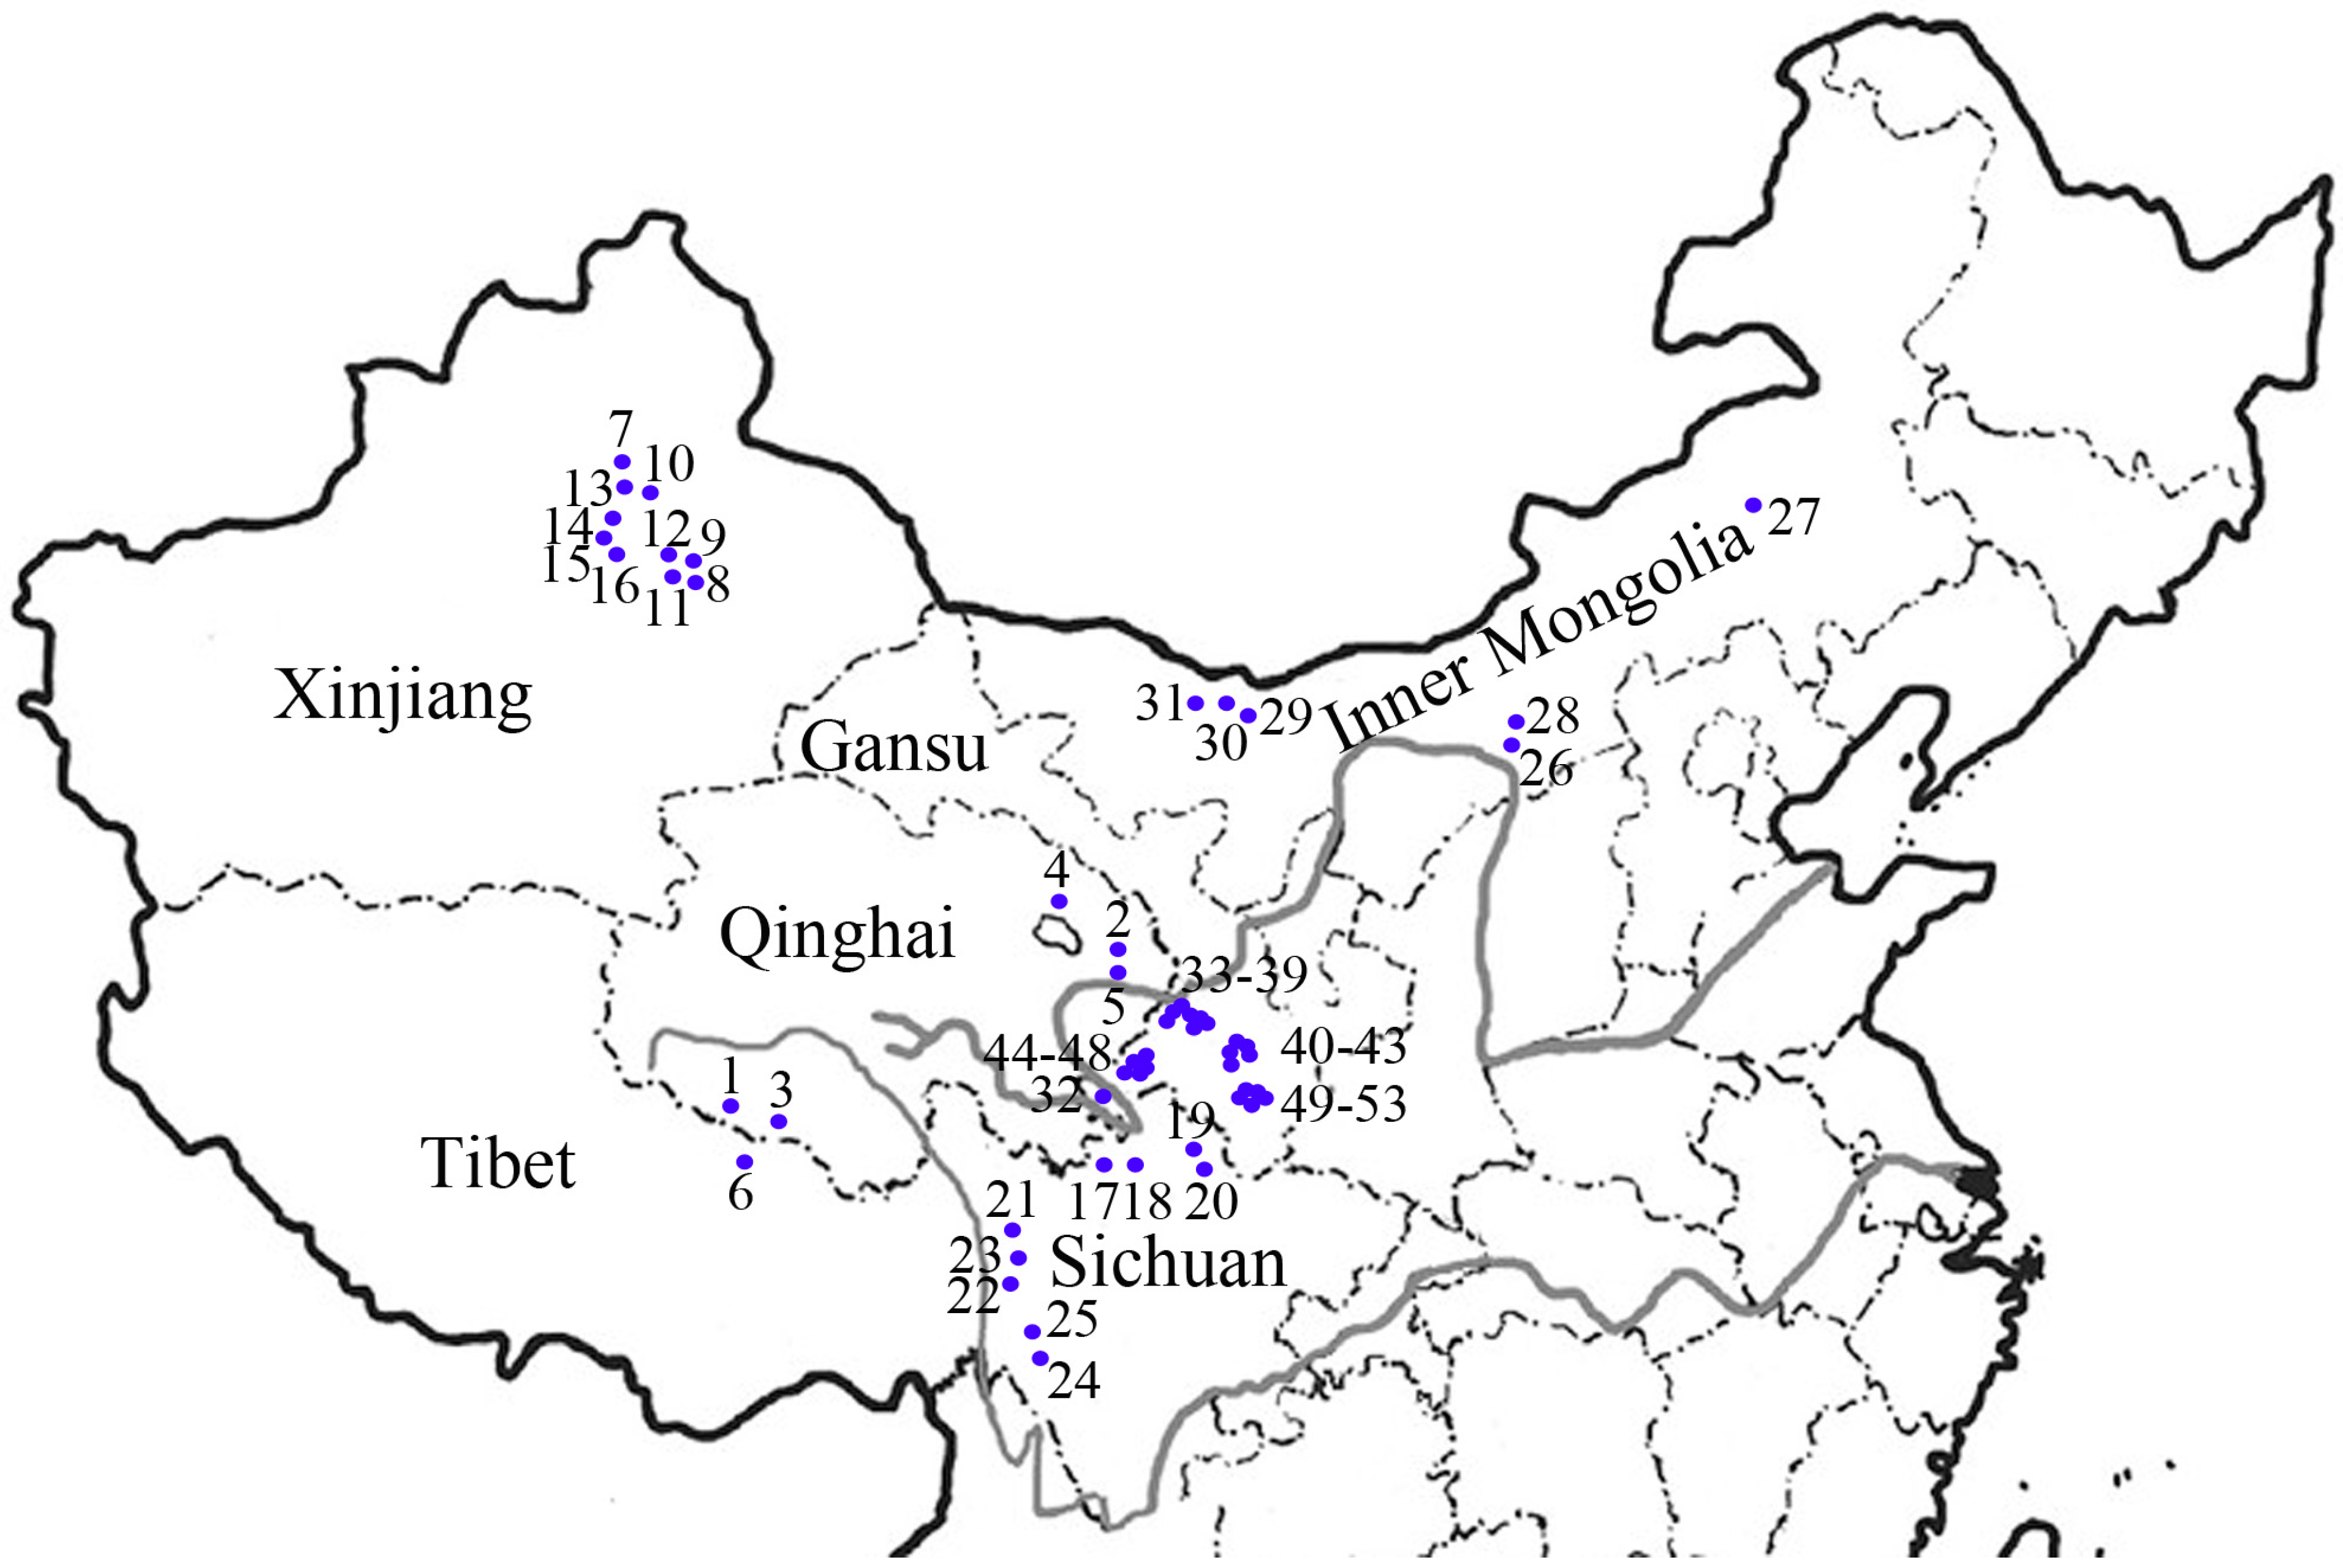
3.1. Plant Materials
A total of 53 E. sibiricus accessions were from the species range in China, comprising cultivars, breeding lines, cultivated and wild collections (Table 1). Materials were obtained from National Genetic Resources Program (USDA), the State Key Laboratory of Grassland Agro-ecosystems (Lanzhou University, China), Sichuan Agricultural University (Ya’an, China), and Sichuan Academy of Grassland Science (Sichuan, China). All accessions were grouped into five geographic regions: QX, XJ, SC, NM and GS based on their origin and physico-geographical regionalization.
3.2. DNA Extraction
Twenty-five individuals of each accession were sampled for the extraction of bulk DNA. Plant tissues were collected from young seedlings, lyophilized, and used for DNA extraction using Tiangen plant genomic DNA kit, following the manufacturer’s protocol (Tiangen Biotech, Beijing, China). DNA quantity and quality were determined using a Nanodrop spectrophotometer (NanoDrop Products, Wilmington, DE, USA) and agarose gel electrophoresis.
3.3. SCoT-PCR Amplification
A total of 16 SCoT primers were randomly selected (Table 2). These primer sequences were published in previous studies [,]. Amplification was carried out in 15 μL samples containing 3 μL 25 ng/μL DNA, 7.5 μL 2× Reaction Mix (Tiangen), 0.15 μL 10 μM primer, 0.4 μL 2.5 U/μL Golden DNA Polymerase (Tiangen), and 3.95 μL of sterile ddH2O. PCR amplification was performed under the following conditions []: denaturation at 94 °C for 3 min, followed by 36 cycles of 94 °C for 1 min, 50 °C for 1 min, 72 °C for 2 min, and final extension at 72 °C for 5 min. The amplification products were separated in 1.6% agarose gels containing 0.12 μg/mL of Goldview through electrophoresis in 1X TBE buffer solution. The gel was photographed by a Gel Doc (TM) XR System (Bio-Rad, Hercules, CA, USA).
3.4. Data Analysis
The amplified bands were scored as presence (1) or absence (0), and only reproducible bands were considered. Polymorphic information content (PIC) values were calculated for each SCoT primers according to the formula: PIC = 1 − p2 − q2 []; where p is frequency of present band and q is frequency of absent band. The band informativeness (Ib) was calculated as Ib = 1 − (2 × |0.5 − p|) [], where p is the proportion of the varieties or genotypes containing the band. The resolving power of the primer (Rp) was measured in accordance with Rp = ΣIb []. The resulting present/absent data matrix was analyzed using POPGENE 32 Version 1.31 []. Number of polymorphic band (NPB), percentage polymorphic band (PPB), Shannon information index of diversity (I), Nei’s gene diversity (H), and observed number of alleles (Na) were calculated. The Analysis of Molecular Variance (AMOVA) was used to partition the total SCoT variation into within populations and among populations []. A dendrogram was constructed by Jaccard’s genetic similarity matrix to display accession relationships using the unweighted pair group method with arithmetic mean (UPGMA) of NTSYS (version 2.10) []. A principal coordinate analysis (PCoA) was constructed based on Jaccard’s genetic similarity matrix using DCENTER module in NTSYS. A bootstrap analysis with 1000 replicates was performed to obtain the confidence of branches of the cluster tree using the Winboot software []. Population structure of the 53 E. sibiricus accessions was analyzed using STRUCTRE v2.3.4 software [] with the ‘admixture mode’, burn-in period of 10,000 iterations and a run of 100,000 replications of Markov Chain Monte Carlo (MCMC) after burn in. For each run, 10 independent runs of STRUCTURE were performed with the number of clusters (K) varying from 1 to 10. Maximum likelihood and delta K (△K) values were used to determine the optimum number of groups [,].The input files for POPGENE and AMOVA were prepared with the aid of DCFA1.1 program written by Zhang [].
4. Conclusions
In the original research of Collard and Mackill [] the use of SCoTs for genetic diversity assessment was suggested. However, SCoTs target potential coding genomic regions producing a dominant marker-system, but several co-dominant markers are also generated. Despite the high potential of SCoTs for targeted fingerprinting or QTL mapping purposes, those characteristics also consent their use for genetic diversity assessment []. The results of the present study showed that the highly reproducible SCoT markers were efficient in assessing the genetic diversity and relationships among E. sibiricus accessions.
Acknowledgments
This study was supported by grants from the Chinese National Basic Research Program (973 Program) (No. 2014CB138704), the Chinese National Natural Science Foundation (No. 31302023), and the program for Changjiang Scholars and Innovative Research Team in University (IRT13019).
Author Contributions
Conceived and designed the experiments: W.X., Y.W.; Performed the experiments: J.Z., X.Z.; Analyzed the data: W.X., J.Z.; Wrote the paper: W.X., J.Z.
Conflicts of Interest
The authors declare no conflict of interest.
References
- Dewey, D.R. The Genomic system of classification as a guide to intergeneric hybridization with the perennial triticeae. In Gene Manipulation in Plant Improvement; Gustafson, J.P., Ed.; Plenum: New York, NY, USA, 1984; pp. 209–279. [Google Scholar]
- Bowden, W.M.; Cody, W.J. Recognition of Elymus sibiricus L. from Alaska and the district of Mackenzie. Bull. Torrey Bot. Club 1961, 88, 153–155. [Google Scholar] [CrossRef]
- Yan, J.J.; Bai, S.Q.; Ma, X.; Gan, Y.M.; Zhang, J.B. Genetic diversity of Elymus sibiricus and its breeding in China (In Chinese with English abstract). Chin. Bull. Bot. 2007, 24, 226–231. [Google Scholar]
- Futuyma, D.J. Evolutionary Biology; Sinauer Associates: Sunderland, MA, USA, 1986; p. 2. [Google Scholar]
- Ma, X.; Zhang, X.Q.; Zhou, Y.H.; Bai, S.Q.; Liu, W. Assessing genetic diversity of Elymus sibiricus (Poaceae: Triticeae) populations from Qinghai-Tibet Plateau by ISSR markers. Biochem. Syst. Ecol. 2008, 36, 514–522. [Google Scholar] [CrossRef]
- Yan, J.J.; Bai, S.Q.; Zhang, X.Q.; You, M.H.; Zhang, C.B.; Li, D.X.; Zeng, Y. Genetic diversity of wild Elymus sibiricus germplasm from the Qinghai-Tibetan Plateau in China detected by SRAP markers (In Chinese with English abstract). Acta Prataculturae Sin. 2010, 19, 173–183. [Google Scholar]
- Xie, W.G.; Zhao, X.H.; Zhang, J.Q.; Wang, Y.R.; Liu, W.X. Assessment of genetic diversity of Siberian wild rye (Elymus sibiricus L.) germplasms with variation of seed shattering and implication for future genetic improvement. Biochem. Syst. Ecol. 2015, 58, 211–218. [Google Scholar]
- Ma, X.; Chen, S.Y.; Zhang, X.Q.; Bai, S.Q.; Zhang, C.B. Assessment of Worldwide Genetic Diversity of Siberian Wild Rye (Elymus sibiricus L.) Germplasm Based on Gliadin Analysis. Molecules 2012, 17, 4424–4434. [Google Scholar]
- Collard, B.C.; Mackill, D.J. Start Codon Targeted (SCoT) polymorphism: A simple, novel DNA marker technique for generating gene-targeted markers in plants. Plan. Mol. Biol. Rep. 2009, 27, 86–93. [Google Scholar] [CrossRef]
- Mulpuri, S.; Muddanuru, T.; Francis, G. Start codon targeted (SCoT) polymorphism in toxic and non-toxic accessions of Jatropha curcas L. and development of a codominant SCAR marker. Plan. Sci. 2013, 207, 117–127. [Google Scholar]
- Cabo, S.; Ferreira, L.; Carvalho, A.; Martins-Lopes, P.; Martín, A.; Lima-Brito, J.E. Potential of Start Codon Targeted (SCoT) markers for DNA fingerprinting of newly synthesized tritordeums and their respective parents. J. Appl. Genet. 2014, 55, 307–312. [Google Scholar] [CrossRef] [PubMed]
- Que, Y.X.; Pan, Y.B.; Lu, Y.H.; Yang, C.; Yang, Y.T.; Huang, N.; Xu, L.P. Genetic analysis of diversity within a Chinese local sugarcane germplasm based on start codon targeted polymorphism. BioMed Res. Int. 2014, 2014, 468375. [Google Scholar] [CrossRef] [PubMed]
- Guo, D.L.; Zhang, J.Y.; Liu, C.H. Genetic diversity in some grape varieties revealed by SCoT analyses. Mol. Biol. Rep. 2012, 39, 5307–5313. [Google Scholar] [CrossRef] [PubMed]
- Gorji, A.M.; Matyas, K.K.; Dublecz, Z.; Decsi, K.; Cernak, I.; Hoffmann, B.; Taller, J.; Polgar, Z. In vitro osmotic stress tolerance in potato and identification of major QTLs. Am. J. Potato Res. 2012, 89, 453–464. [Google Scholar] [CrossRef]
- Luo, C.; He, X.H.; Chen, H.; Ou, S.J.; Gao, M.P. Analysis of diversity and relationships among mango cultivars using Start Codon Targeted (SCoT) markers. Biochem. Syst. Ecol. 2010, 38, 1176–1184. [Google Scholar] [CrossRef]
- Chen, F.Y.; Liu, J.H. Germplasm genetic diversity of Myrica rubra in Zhejiang Province studied using inter-primer binding site and start codon-targeted polymorphism markers. Sci. Hortic. 2014, 170, 169–175. [Google Scholar] [CrossRef]
- Gorji, A.M.; Poczai, P.; Polgar, Z.; Taller, J. Efficiency of arbitrarily amplified dominant markers (SCoT, ISSR and RAPD) for diagnostic fingerprinting in tetraploid potato. Am. J. Potato Res. 2011, 88, 226–237. [Google Scholar] [CrossRef]
- Xiong, F.Q.; Zhong, R.C.; Han, Z.Q.; Jiang, J.; He, L.Q.; Zhuang, W.J.; Tang, R.H. Start codon targeted polymorphism for evaluation of functional genetic variation and relationships in cultivated peanut (Arachis hypogaea L.) genotypes. Mol. Biol. Rep. 2011, 38, 3487–3494. [Google Scholar] [CrossRef]
- Amirmoradi, B.; Talebi, R.; Karami, E. Comparison of genetic variation and differentiation among annual Cicer species using start codon targeted (SCoT) polymorphism, DAMD-PCR, and ISSR markers. Plant Syst. Evol. 2012, 298, 1679–1688. [Google Scholar] [CrossRef]
- Yan, J.J.; Bai, S.Q.; Zhang, X.Q.; Chang, D.; You, M.H.; Zhang, C.B.; Li, D.X. Genetic diversity of native Elymus sibiricus populations in the Southeastern Margin of Qinghai-Tibetan Plateau as detected by SRAP and SSR markers (In Chinese with English abstract). Acta Prataculturae Sin. 2010, 19, 122–134. [Google Scholar]
- Ma, X.; Chen, S.Y.; Bai, S.Q.; Zhang, X.Q.; Li, D.X.; Zhang, C.B.; Yan, J.J. RAPD analysis of genetic diversity and population structure of Elymus sibiricus (Poaceae) native to the southeastern Qinghai-Tibet Plateau, China. Genet. Mol. Res. 2012, 11, 2708–2718. [Google Scholar] [CrossRef] [PubMed]
- Jiang, L.F.; Qi, X.; Zhang, X.Q.; Huang, L.K.; Ma, X.; Xie, W.G. Analysis of diversity and relationships among orchardgrass (Dactylis glomerata L.) accessions using start codon-targeted markers. Genet. Mol. Res. 2014, 13, 4406–4418. [Google Scholar]
- Xie, W.G.; Zhang, X.Q.; Ma, X.; Huang, L.K.; Zeng, B. Genetic variation of Dactylis glomerata germplasm from Southwest China detected by SSR markers (In Chinese with English abstract). Acta Pratac. Sin. 2009, 18, 138–146. [Google Scholar]
- Yan, X.B.; Guo, Y.X.; Zhou, H.; Wang, K. Analysis of geographical conditions affected on genetic variation and relationship among populations of Elymus (In Chinese with English abstract). J. Plan. Resour. Environ. 2006, 15, 17–24. [Google Scholar]
- Xie, W.G.; Zhang, X.Q.; Ma, X.; Cai, H.W.; Huang, L.K.; Peng, Y.; Zeng, B. Diversity comparison and phylogenetic relationships of cocksfoot (Dactylis glomerata L.) germplasm as revealed by SSR markers.) germplasm as revealed by SSR markers. Can. J. Plant. Sci. 2010, 90, 13–21. [Google Scholar]
- Wilson, B.L.; Kitzmiller, J.; Rolle, W.; Hipkins, V.D. Isozyme variation and its environmental correlates in Elymus glaucus from the California Floristic Province. Can. J. Bot. 2001, 79, 139–153. [Google Scholar]
- MacRitchie, D.; Sun, G. Evaluating the potential of barley and wheat microsatellite markers for genetic analysis of Elymus trachycaulus complex species. Theor. Appl. Genet. 2004, 108, 720–724. [Google Scholar] [CrossRef] [PubMed]
- Schoen, D.J.; Brown, A. Intraspecific variation in population gene diversity and effective population size correlates with the mating system in plants. Proc. Natl. Acad. Sci. USA 1991, 88, 4494–4497. [Google Scholar] [CrossRef] [PubMed]
- Hogbin, P.M.; Peakall, R. Evaluation of the contribution of genetic research to the management of the endangered plant Zieria prostrata. Conserv. Biol. 1999, 13, 514–522. [Google Scholar] [CrossRef]
- Ellstrand, N.C.; Elam, D.R. Population genetic consequences of small population size: Implications for plant conservation. Annu. Rev. Ecol. Syst. 1993, 24, 217–242. [Google Scholar] [CrossRef]
- Jin, Y.; Lu, B.R. Sampling strategy for genetic diversity (In Chinese with English abstract). Chin. Biodivers. 2002, 11, 155–161. [Google Scholar]
- Chen, S.Y.; Zhang, X.Q.; Ma, X.; Huang, L.K. Assessment of genetic diversity and differentiation of Elymus nutans indigenous to Qinghai-Tibet Plateau using simple sequence repeats markers. Can. J. Plant. Sci. 2013, 93, 1089–1096. [Google Scholar] [CrossRef]
- Jensen, K.B.; Mott, I.W.; Robins, J.G.; Waldron, B.L.; Nelson, M. Genetic improvement and diversity in snake River Wheatgrass (Elymus wawawaiensis) (Poaceae: Triticeae). Rangel. Ecol. Manag. 2012, 65, 76–84. [Google Scholar] [CrossRef]
- Robins, J.G.; Bushman, B.S.; Jensen, K.B. Dry matter yield combining ability among nine sources of cocksfoot germplasm. Euphytica 2012, 188, 419–428. [Google Scholar] [CrossRef]
- Ghislain, M.; Zhang, D.P.; Fajardo, D.; Huamán, Z.; Hijmans, R.J. Marker-assisted sampling of the cultivated Andean potato Solanum phureja collection using RAPD markers. Genet. Resour. Crop Evol. 1999, 46, 547–555. [Google Scholar] [CrossRef]
- Prevost, A.; Wilkinson, M. A new system of comparing PCR primers applied to ISSR fingerprinting of potato cultivars. Theor. Appl. Genet. 1999, 98, 107–112. [Google Scholar] [CrossRef]
- Yeh, F.; Yang, R.; Boyle, T. POPGENE Version 1.31,Microsoft Windows-Based Freeware for Population Genetic Analysis: Quick User Guide; University of Alberta: Edmonton, AB, Canada, 1999. [Google Scholar]
- Mengoni, A.; Bazzicalupo, M. The statistical treatment of data and the analysis of molecular variance (AMOVA) in molecular microbial ecology. Ann. Microbiol. 2002, 52, 95–102. [Google Scholar]
- Rohlf, F.J. NTSYS-pc: Numerical Taxonomy and Multivariate Analysis System; Exeter Software: New York, NY, USA, 1992. [Google Scholar]
- Yap, I.V.; Nelson, R.J. Winboot: A Program for Performing Bootstrap Analysis of Binary Data to Determine the Confidence Limits of UPGMA-based Dendrograms; International Rice Research Institute: Manila, Philippines, 1996. [Google Scholar]
- Pritchard, J.K.; Stephens, M.; Donnelly, P. Inference of population structure from multilocus genotype data. Genetics 2000, 155, 945–959. [Google Scholar] [PubMed]
- Evanno, G.; Regnaut, S.; Goudet, J. Detecting the number of clusters of individuals using the software STRUCTURE: A simulation study. Mol. Ecol. 2005, 14, 2611–2620. [Google Scholar] [CrossRef] [PubMed]
- Zhang, F.M.; Ge, S. Data analysis in population genetics. I. analysis of RAPD data with AMOVA (In Chinese with English abstract). Chin. Biodivers. 2002, 4, 438–444. [Google Scholar]
- Poczai, P.; Varga, I.; Laos, M.; Cseh, A.; Bell, N.; Valkonen, J.P.T.; Hyvönen, J. Advances in plant gene-targeted and functional markers: A review. Plant Methods 2013, 9, 6. [Google Scholar] [CrossRef] [PubMed]
- Sample Availability: Samples of the compounds are available from the authors.
© 2015 by the authors. Licensee MDPI, Basel, Switzerland. This article is an open access article distributed under the terms and conditions of the Creative Commons Attribution license ( http://creativecommons.org/licenses/by/4.0/).