
Simultaneous Determination of Ferulic Acid and Phthalides of Angelica Sinensis Based on UPLC-Q-TOF/MS


Abstract
:1. Introduction
2. Results and Discussion
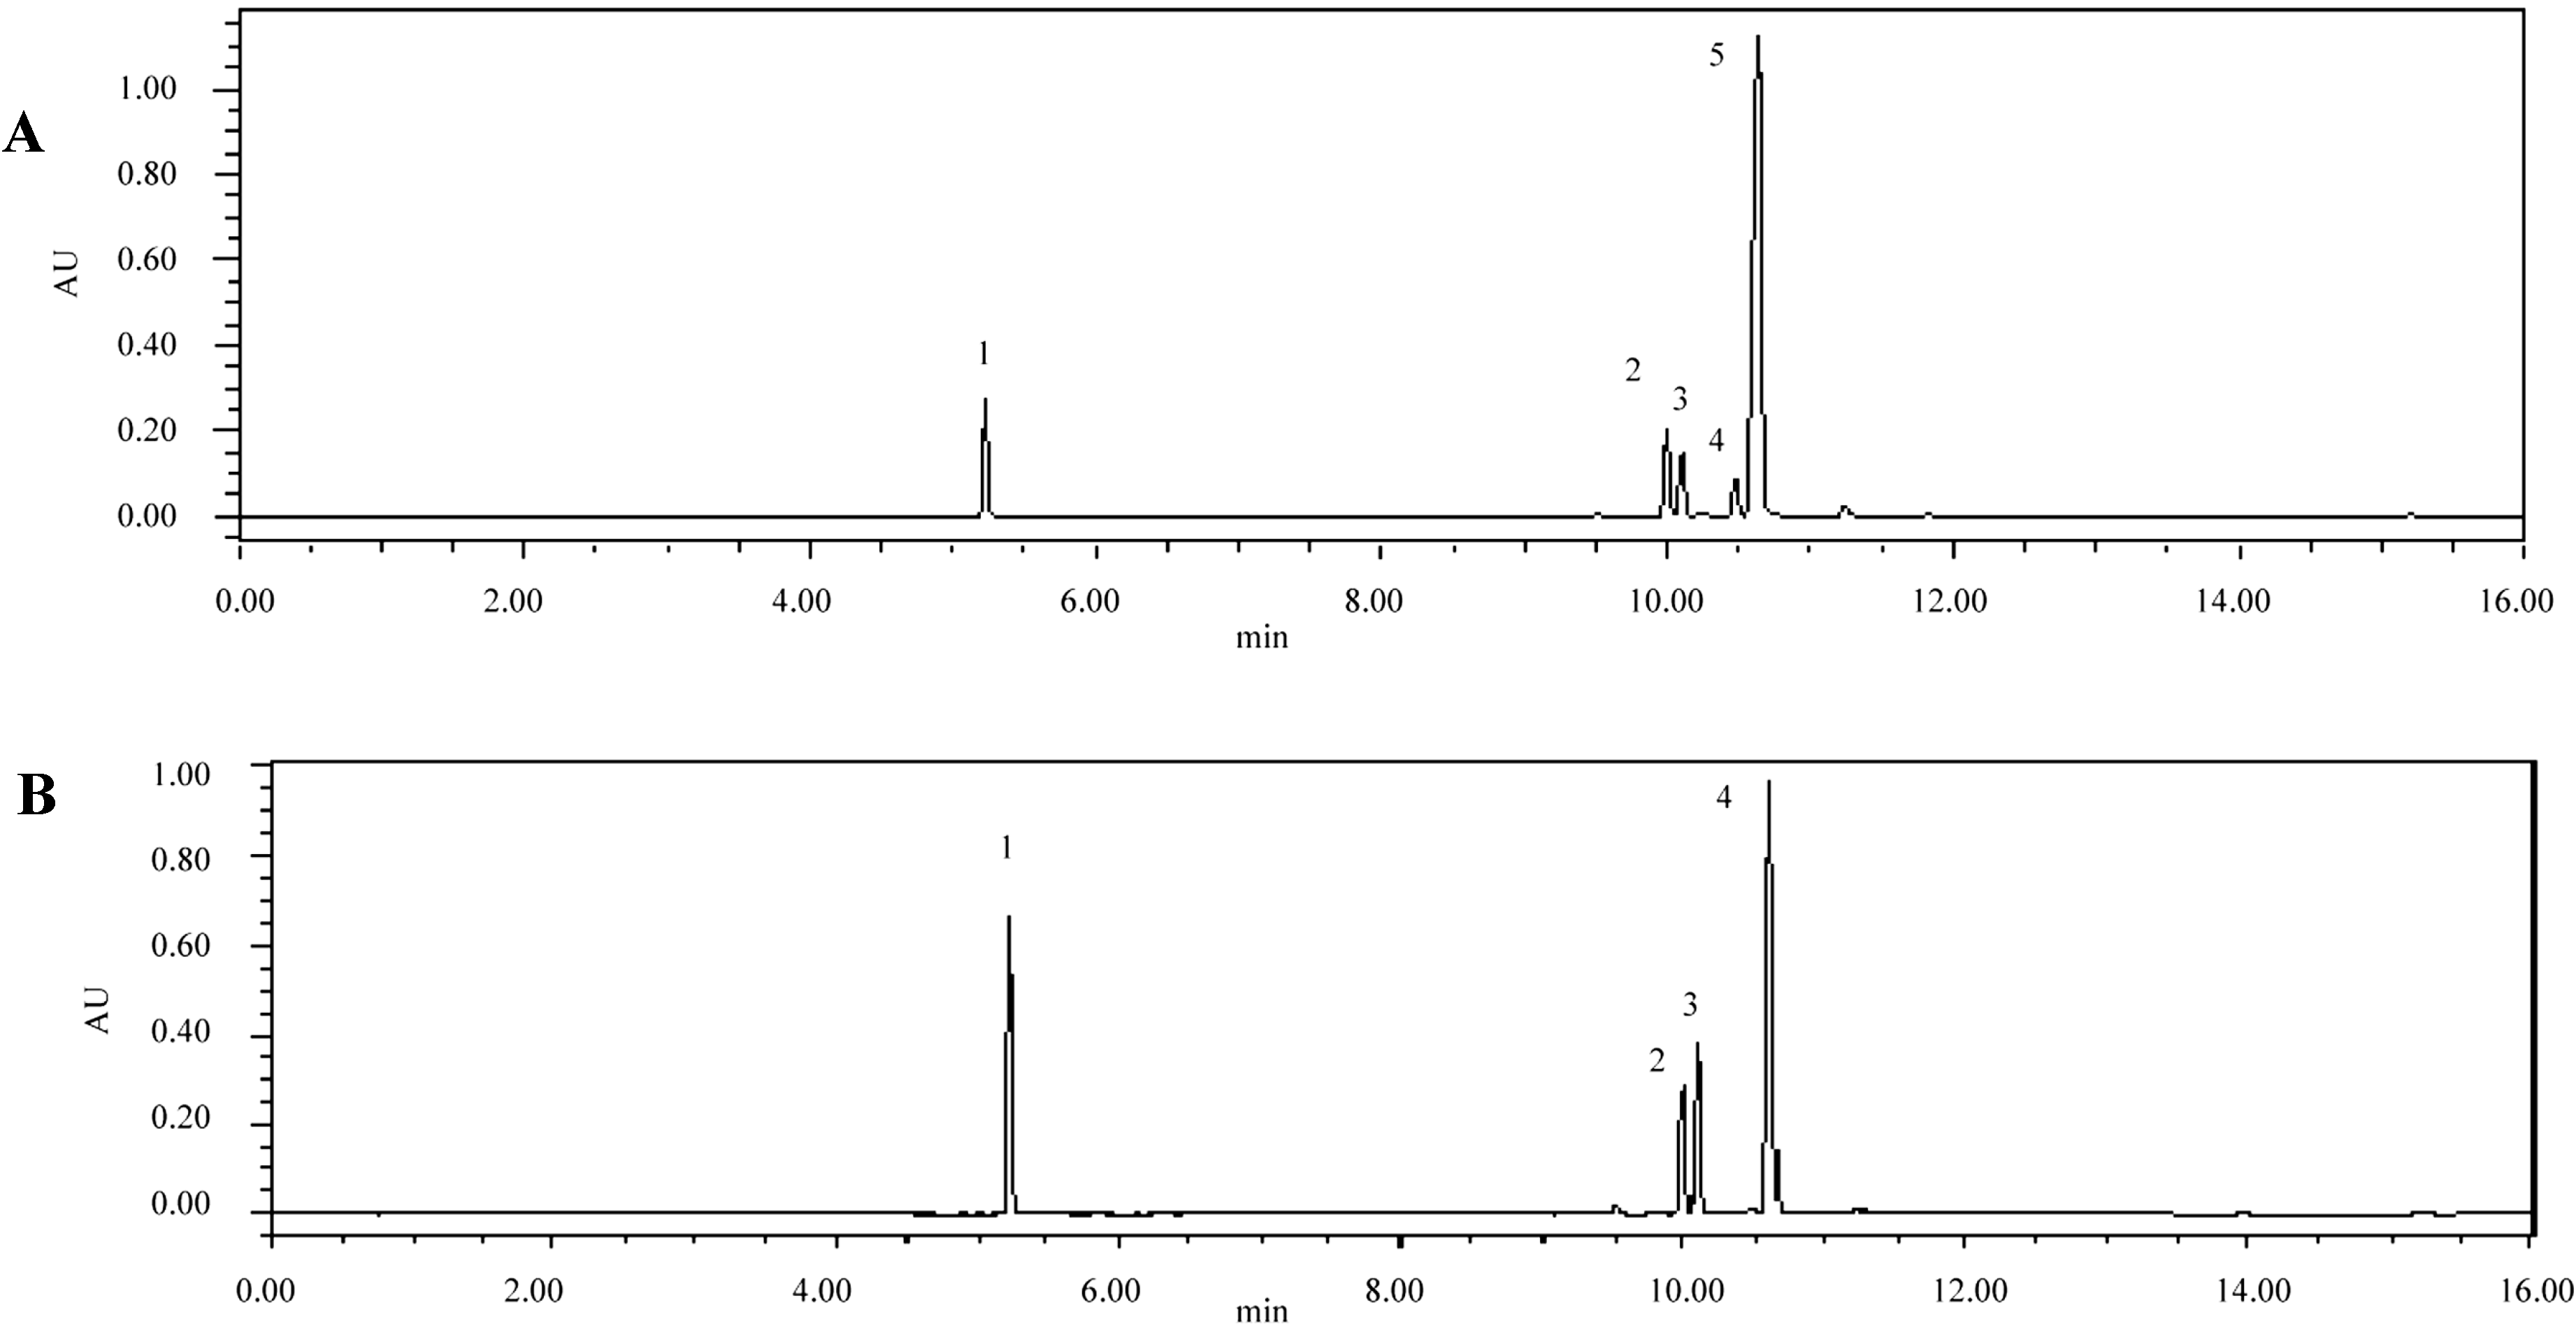
2.1. Optimization of Detection Wavelength
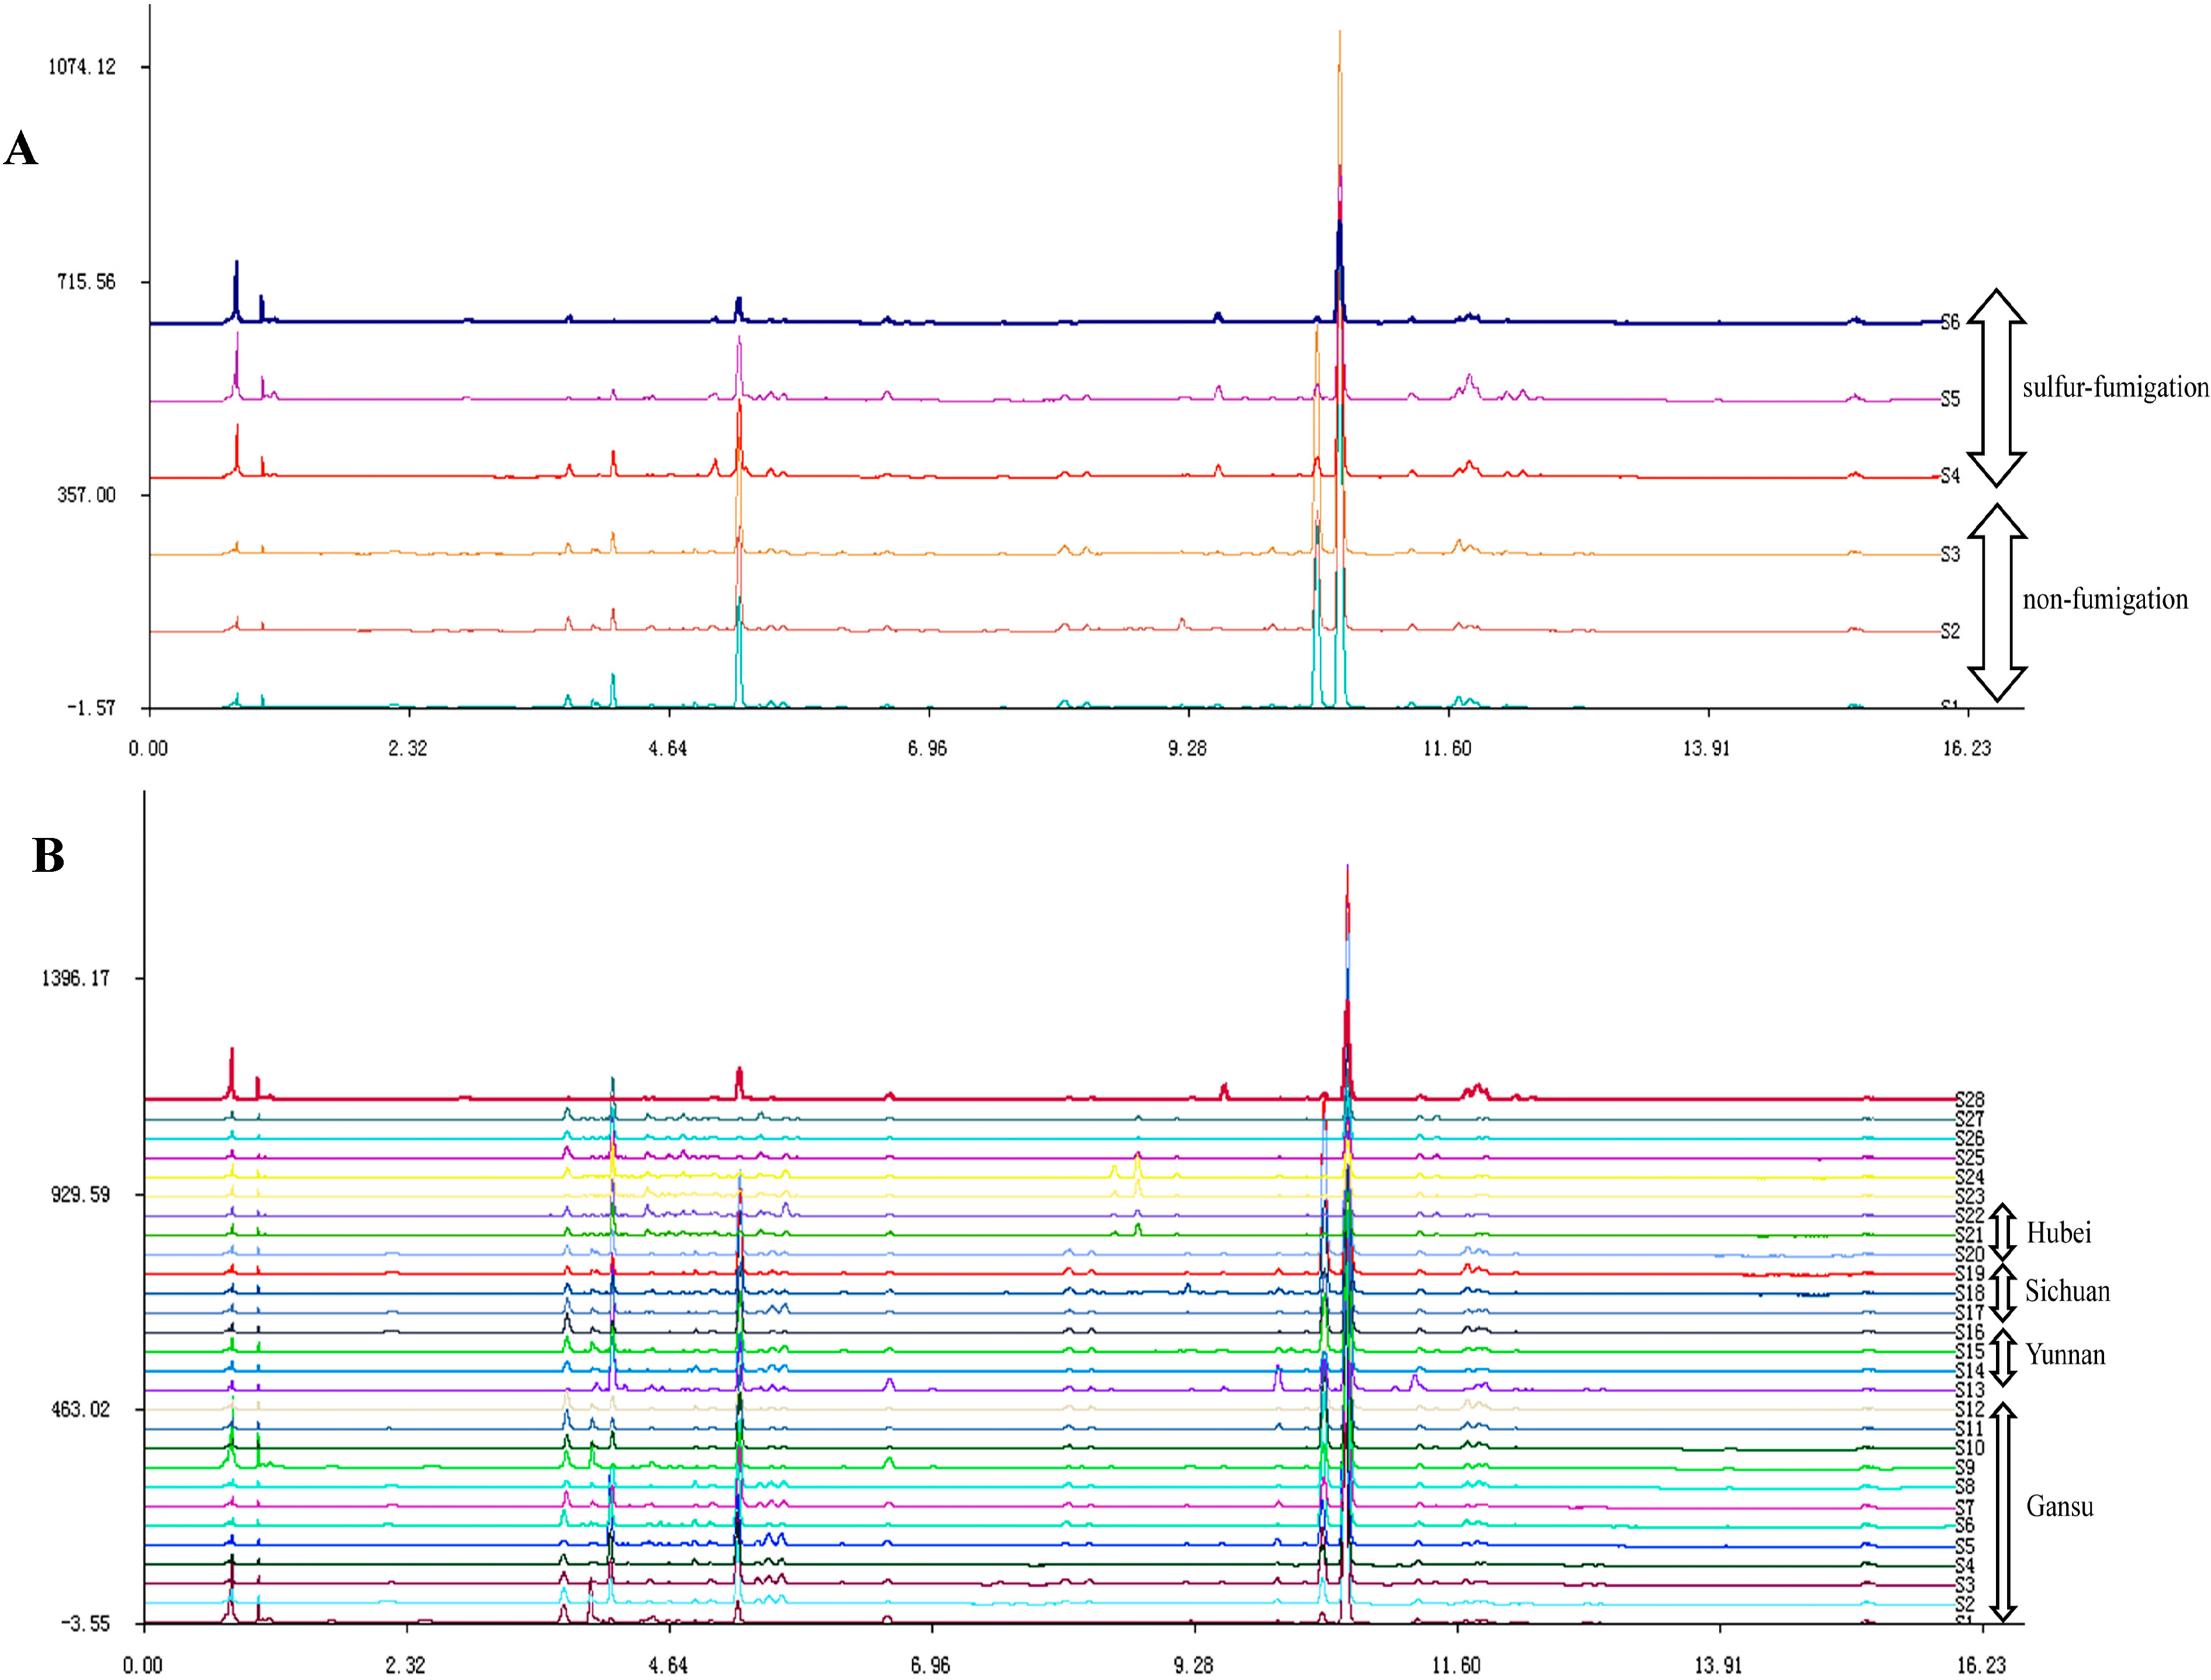
2.2. UPLC Fingerprints


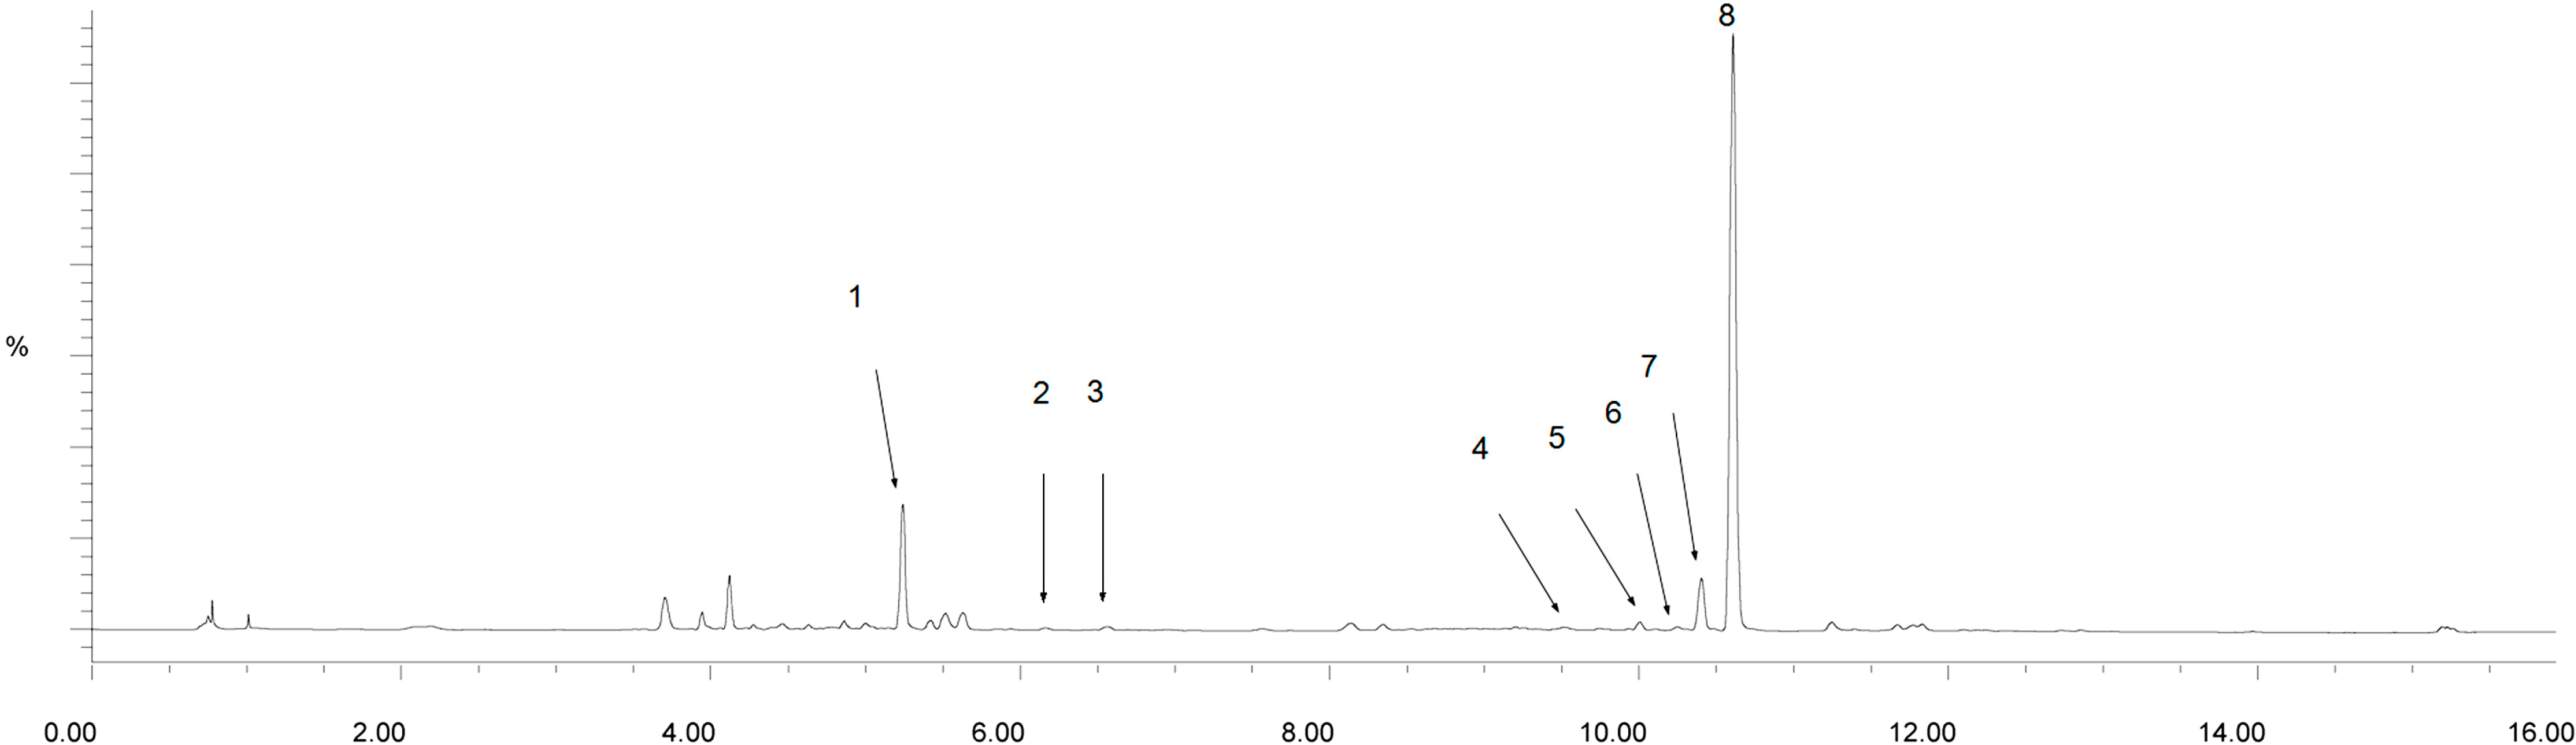
2.3. Identification of the Major Peaks in AS by UPLC-Q-TOF/MS Analysis

| Peak no. | tR (min) | Assigned Identity | Molecular Fomular | Mean Measured Mass (Da) | Theoretical Exact Mass (Da) | ppm |
|---|---|---|---|---|---|---|
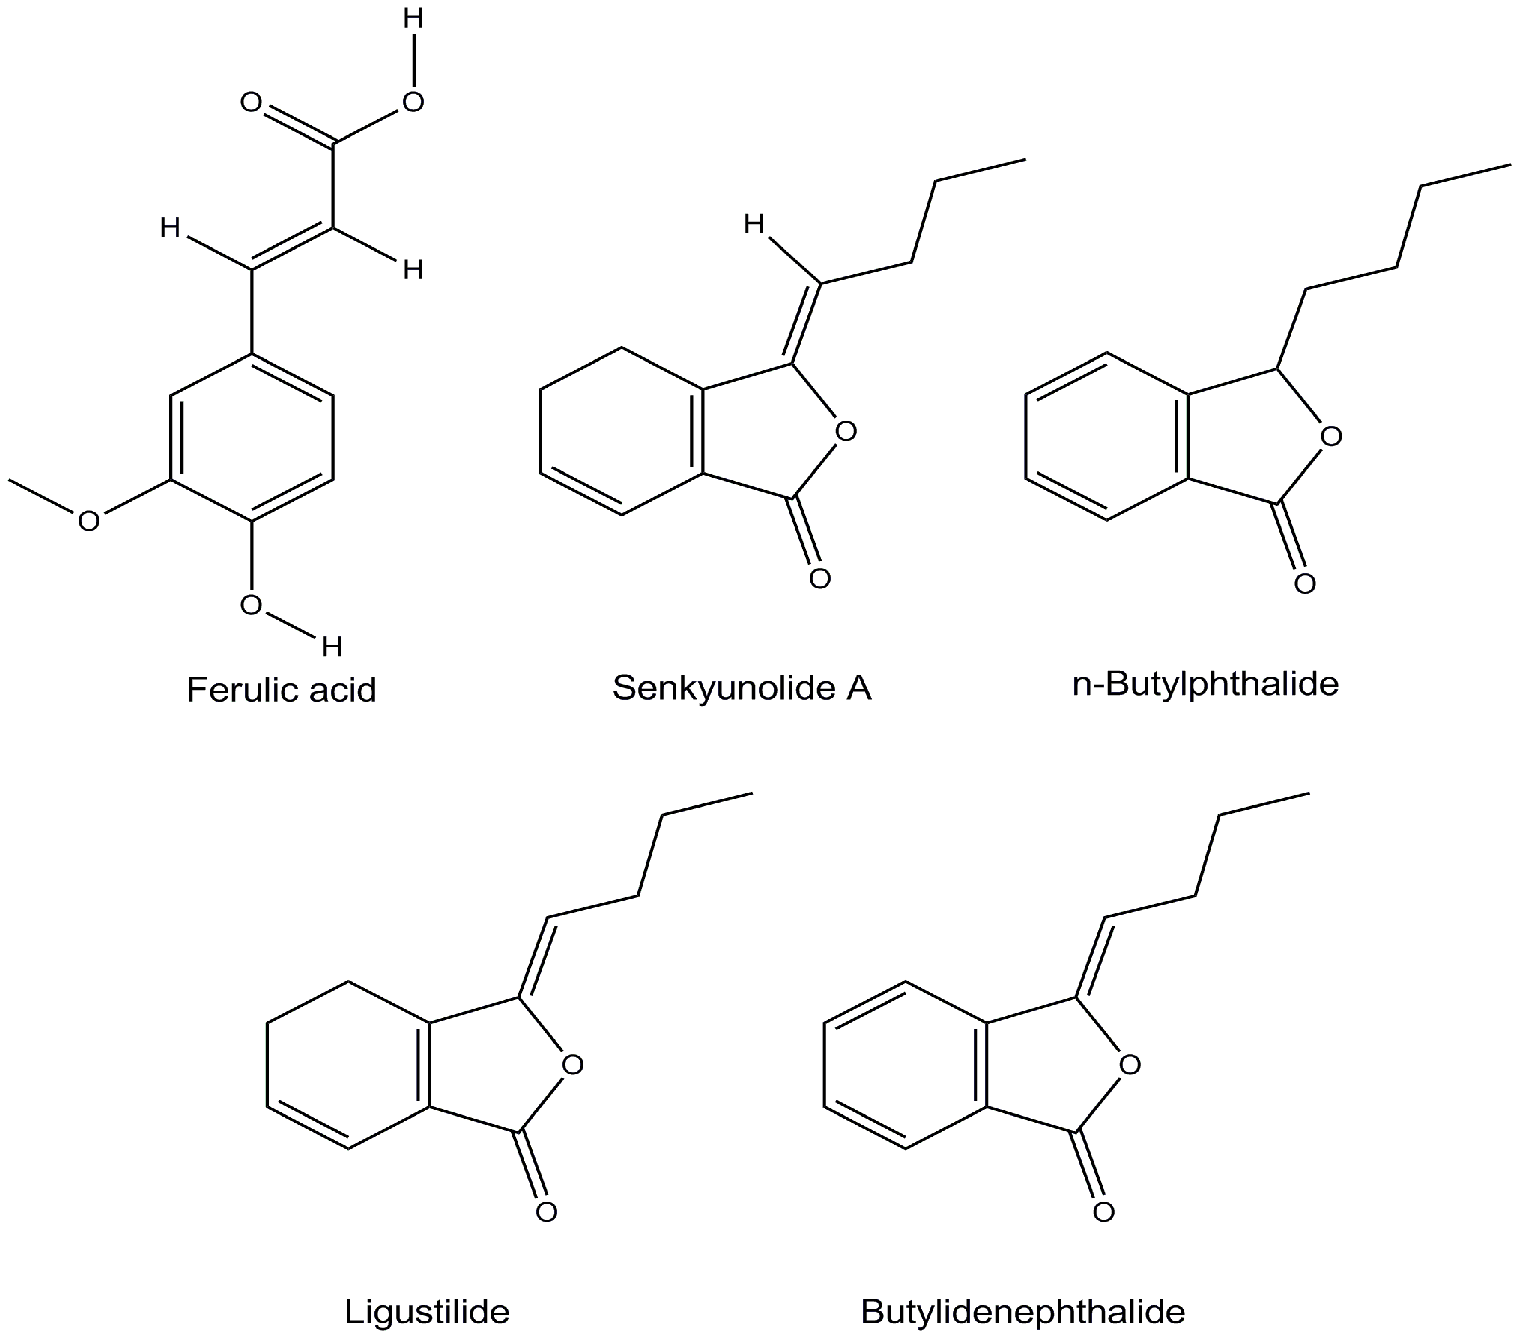
| 1 | 5.26 | Ferulic acid | C10H10O4 | 195.0657 | 195.0659 | 1.0 |
| 2 | 6.17 | Senkyunolide H/I | C12H16O4 | 225.1121 | 225.1127 | −2.7 |
| 3 | 6.54 | Senkyunolide I /H | C12H16O4 | 225.1124 | 225.1127 | −1.3 |
| 4 | 9.51 | Coniferyl ferulate | C20H20O6 | 357.1367 | 357.1338 | 8.1 |
| 5 | 10.01 | Senkyunolide A | C12H16O2 | 193.1259 | 193.1229 | 15.5 |
| 6 | 10.30 | n-Butylphthalide | C12H14O2 | 191.1064 | 191.1072 | −4.2 |
| 7 | 10.46 | Ligustilide | C12H14O2 | 191.1069 | 191.1072 | −4.2 |
| 8 | 10.59 | Butylidenephthalide | C12H12O2 | 189.0909 | 189.0916 | −3.7 |
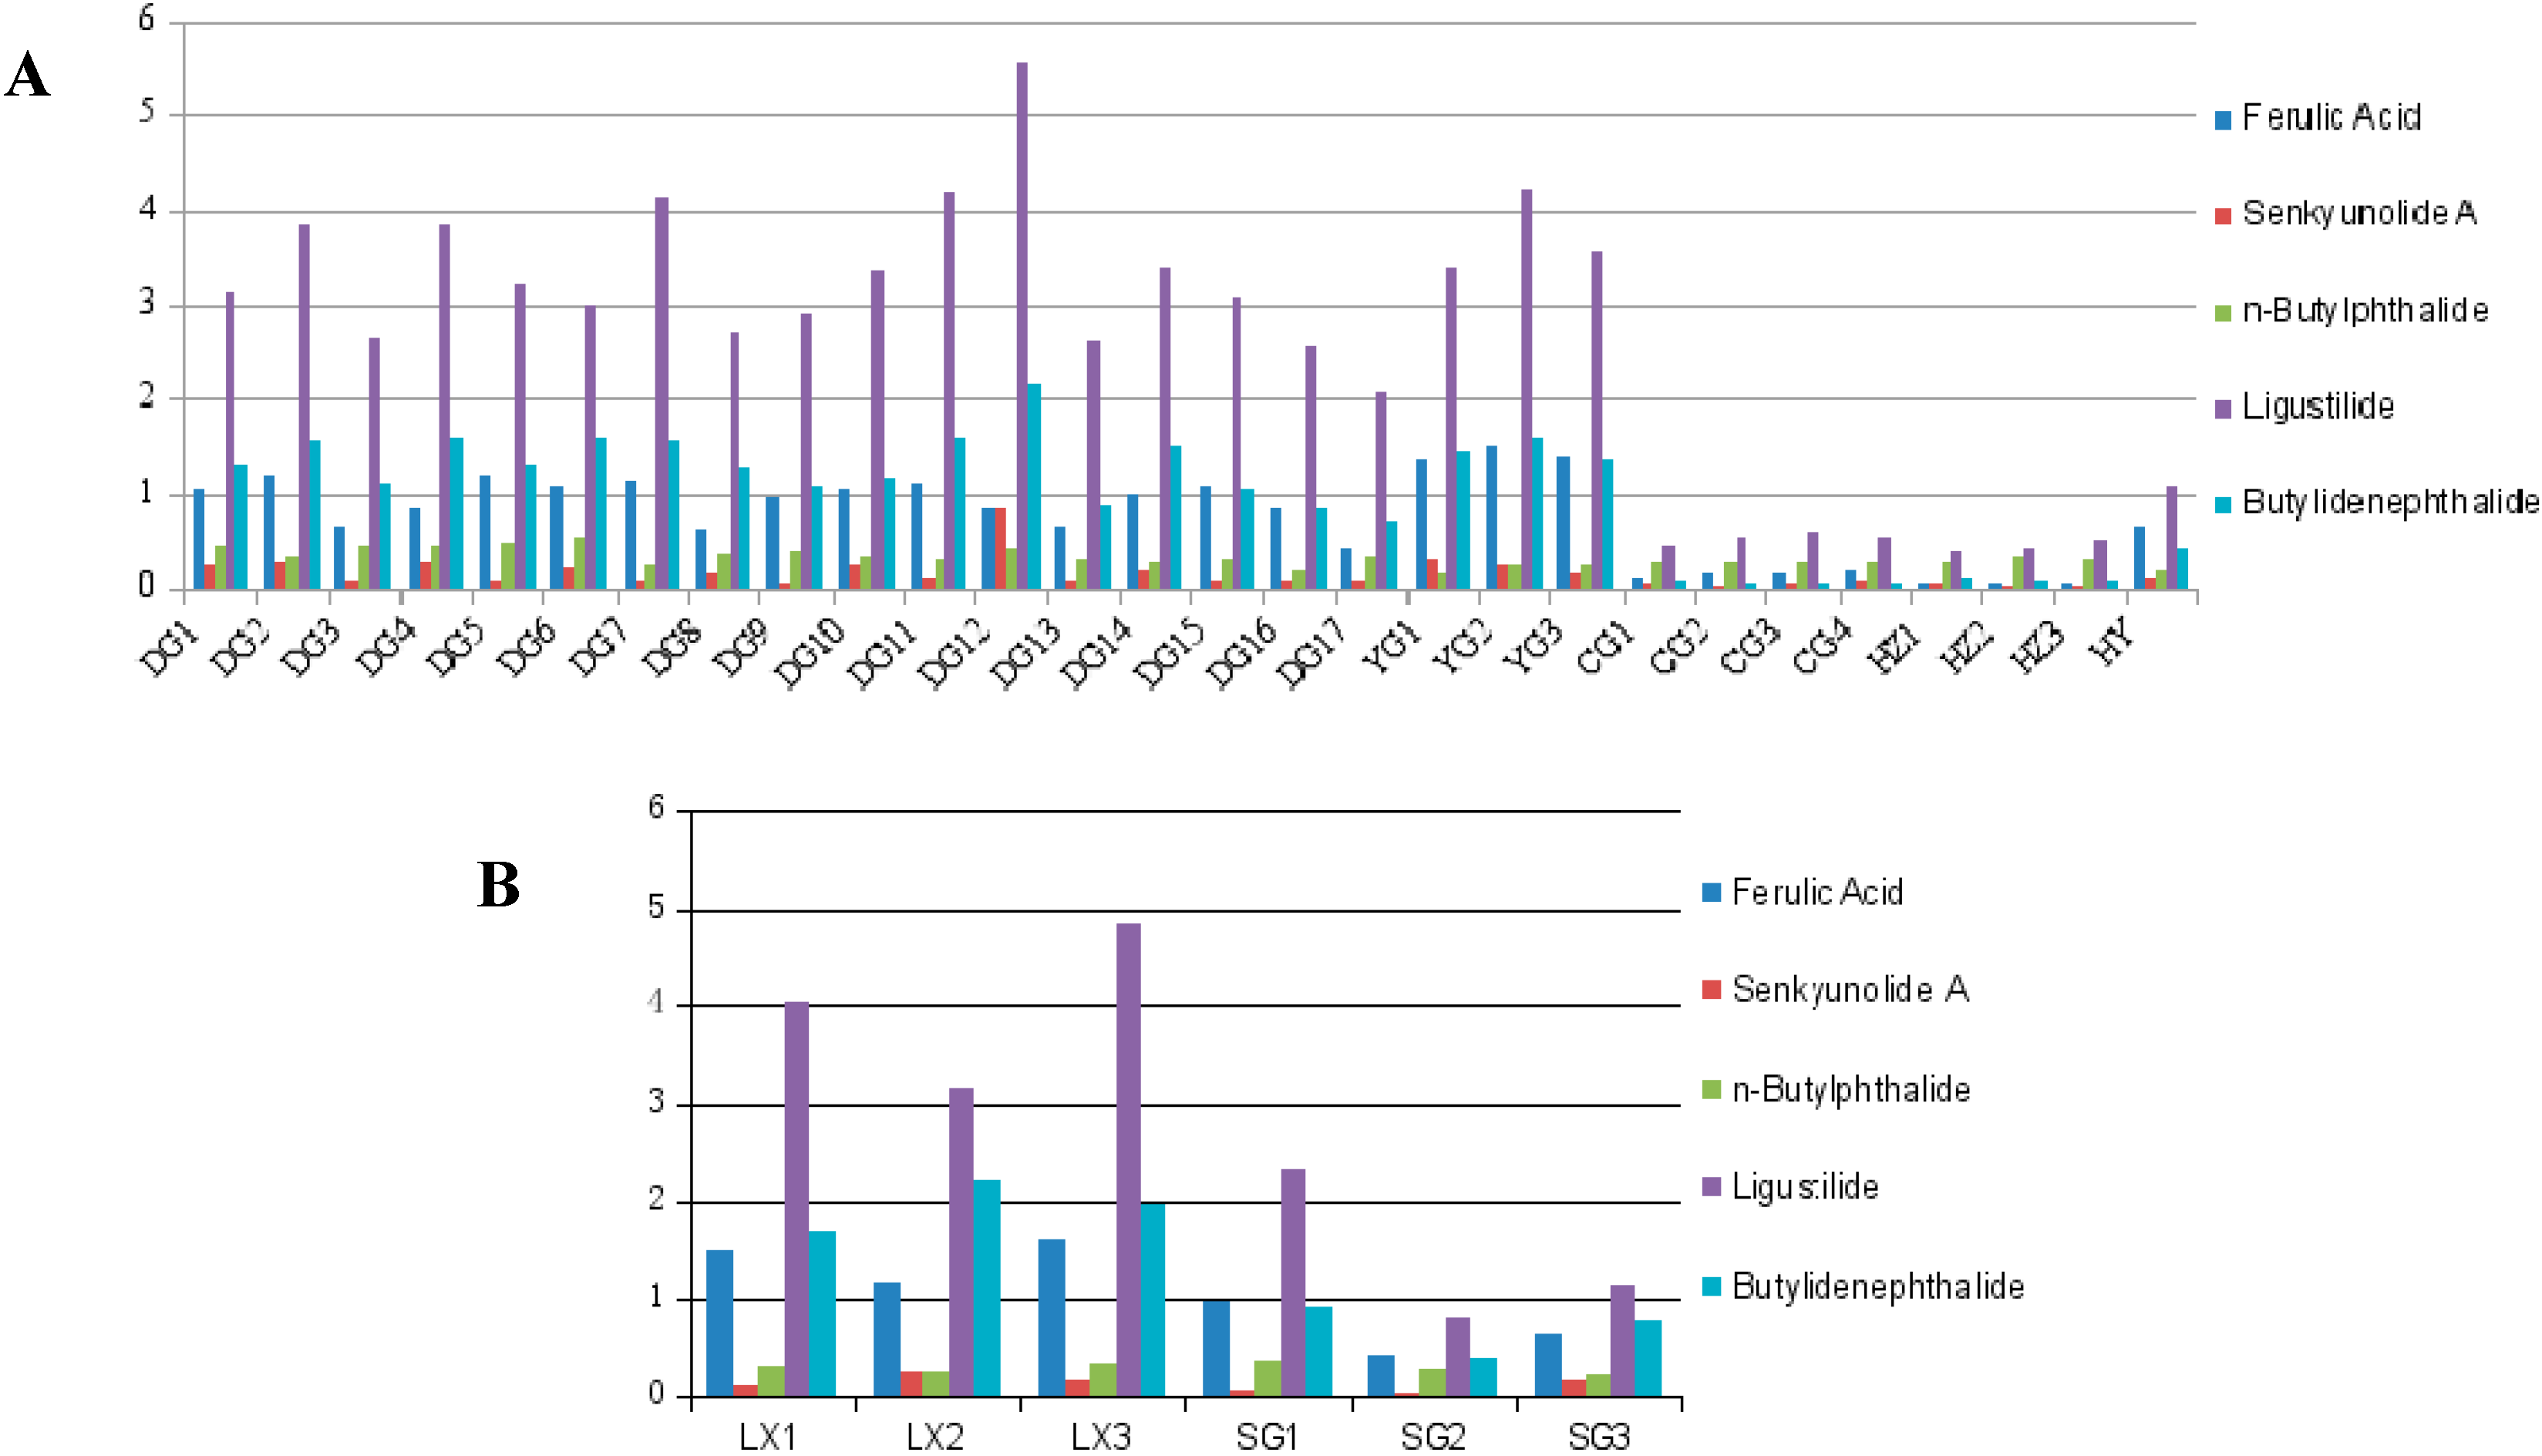
2.4. Quantification of the Five Main Compounds in AS
| Sample | Content (%) | Total Content (%) (mg/g) | ||||
|---|---|---|---|---|---|---|
| Ferulic Acid (mg/g) | Senkyunolide A (mg/g) | n-Butylphthalide (mg/g) | Ligustilide (mg/g) | Butylidenephthalide (mg/g) | ||
| DG1 | 1.061 | 0.226 | 0.442 | 3.121 | 1.306 | 6.156 |
| DG2 | 1.191 | 0.261 | 0.317 | 3.838 | 1.559 | 7.166 |
| DG3 | 0.666 | 0.104 | 0.454 | 2.647 | 1.117 | 4.988 |
| DG4 | 0.839 | 0.282 | 0.445 | 3.831 | 1.597 | 6.994 |
| DG5 | 1.198 | 0.086 | 0.468 | 3.215 | 1.309 | 6.276 |
| DG6 | 1.094 | 0.215 | 0.551 | 3.002 | 1.589 | 6.451 |
| DG7 | 1.128 | 0.098 | 0.226 | 4.128 | 1.559 | 5.118 |
| DG8 | 0.622 | 0.141 | 0.365 | 2.695 | 1.295 | 5.401 |
| DG9 | 0.968 | 0.066 | 0.383 | 2.919 | 1.065 | 6.193 |
| DG10 | 1.056 | 0.252 | 0.338 | 3.373 | 1.174 | 7.318 |
| DG11 | 1.100 | 0.113 | 0.311 | 4.193 | 1.601 | 9.773 |
| DG12 | 0.836 | 0.829 | 0.411 | 5.551 | 2.146 | 6.33 |
| DG13 | 0.653 | 0.090 | 0.311 | 2.596 | 0.865 | 5.606 |
| DG14 | 0.978 | 0.189 | 0.258 | 3.396 | 1.509 | 6.33 |
| DG15 | 1.085 | 0.077 | 0.310 | 3.081 | 1.053 | 5.606 |
| DG16 | 0.842 | 0.099 | 0.194 | 2.540 | 0.847 | 4.522 |
| DG17 | 0.405 | 0.101 | 0.340 | 2.060 | 0.717 | 3.623 |
| YG1 | 1.364 | 0.301 | 0.153 | 3.379 | 1.431 | 6.628 |
| YG2 | 1.496 | 0.235 | 0.244 | 4.243 | 1.603 | 7.821 |
| YG3 | 1.389 | 0.142 | 0.226 | 3.582 | 1.362 | 6.701 |
| CG1 | 0.113 | 0.055 | 0.255 | 0.440 | 0.097 | 0.96 |
| CG2 | 0.144 | 0.039 | 0.255 | 0.537 | 0.047 | 1.022 |
| CG3 | 0.150 | 0.052 | 0.258 | 0.588 | 0.065 | 1.113 |
| CG4 | 0.185 | 0.092 | 0.270 | 0.552 | 0.051 | 1.15 |
| HZ1 | 0.059 | 0.054 | 0.284 | 0.400 | 0.121 | 0.918 |
| HZ2 | 0.056 | 0.020 | 0.343 | 0.431 | 0.103 | 0.953 |
| HZ3 | 0.049 | 0.019 | 0.313 | 0.497 | 0.083 | 0.961 |
| HY | 0.646 | 0.109 | 0.180 | 1.076 | 0.420 | 2.422 |
| LX1 | 1.502 | 0.115 | 0.335 | 4.041 | 1.701 | 7.694 |
| LX2 | 1.186 | 0.26 | 0.255 | 3.155 | 2.202 | 7.058 |
| LX3 | 1.619 | 0.16 | 0.357 | 4.847 | 1.974 | 8.957 |
| SG1 | 0.973 | 0.058 | 0.377 | 2.324 | 0.94 | 4.672 |
| SG2 | 0.433 | 0.025 | 0.299 | 0.821 | 0.411 | 1.989 |
| SG3 | 0.656 | 0.171 | 0.225 | 1.137 | 0.785 | 2.974 |

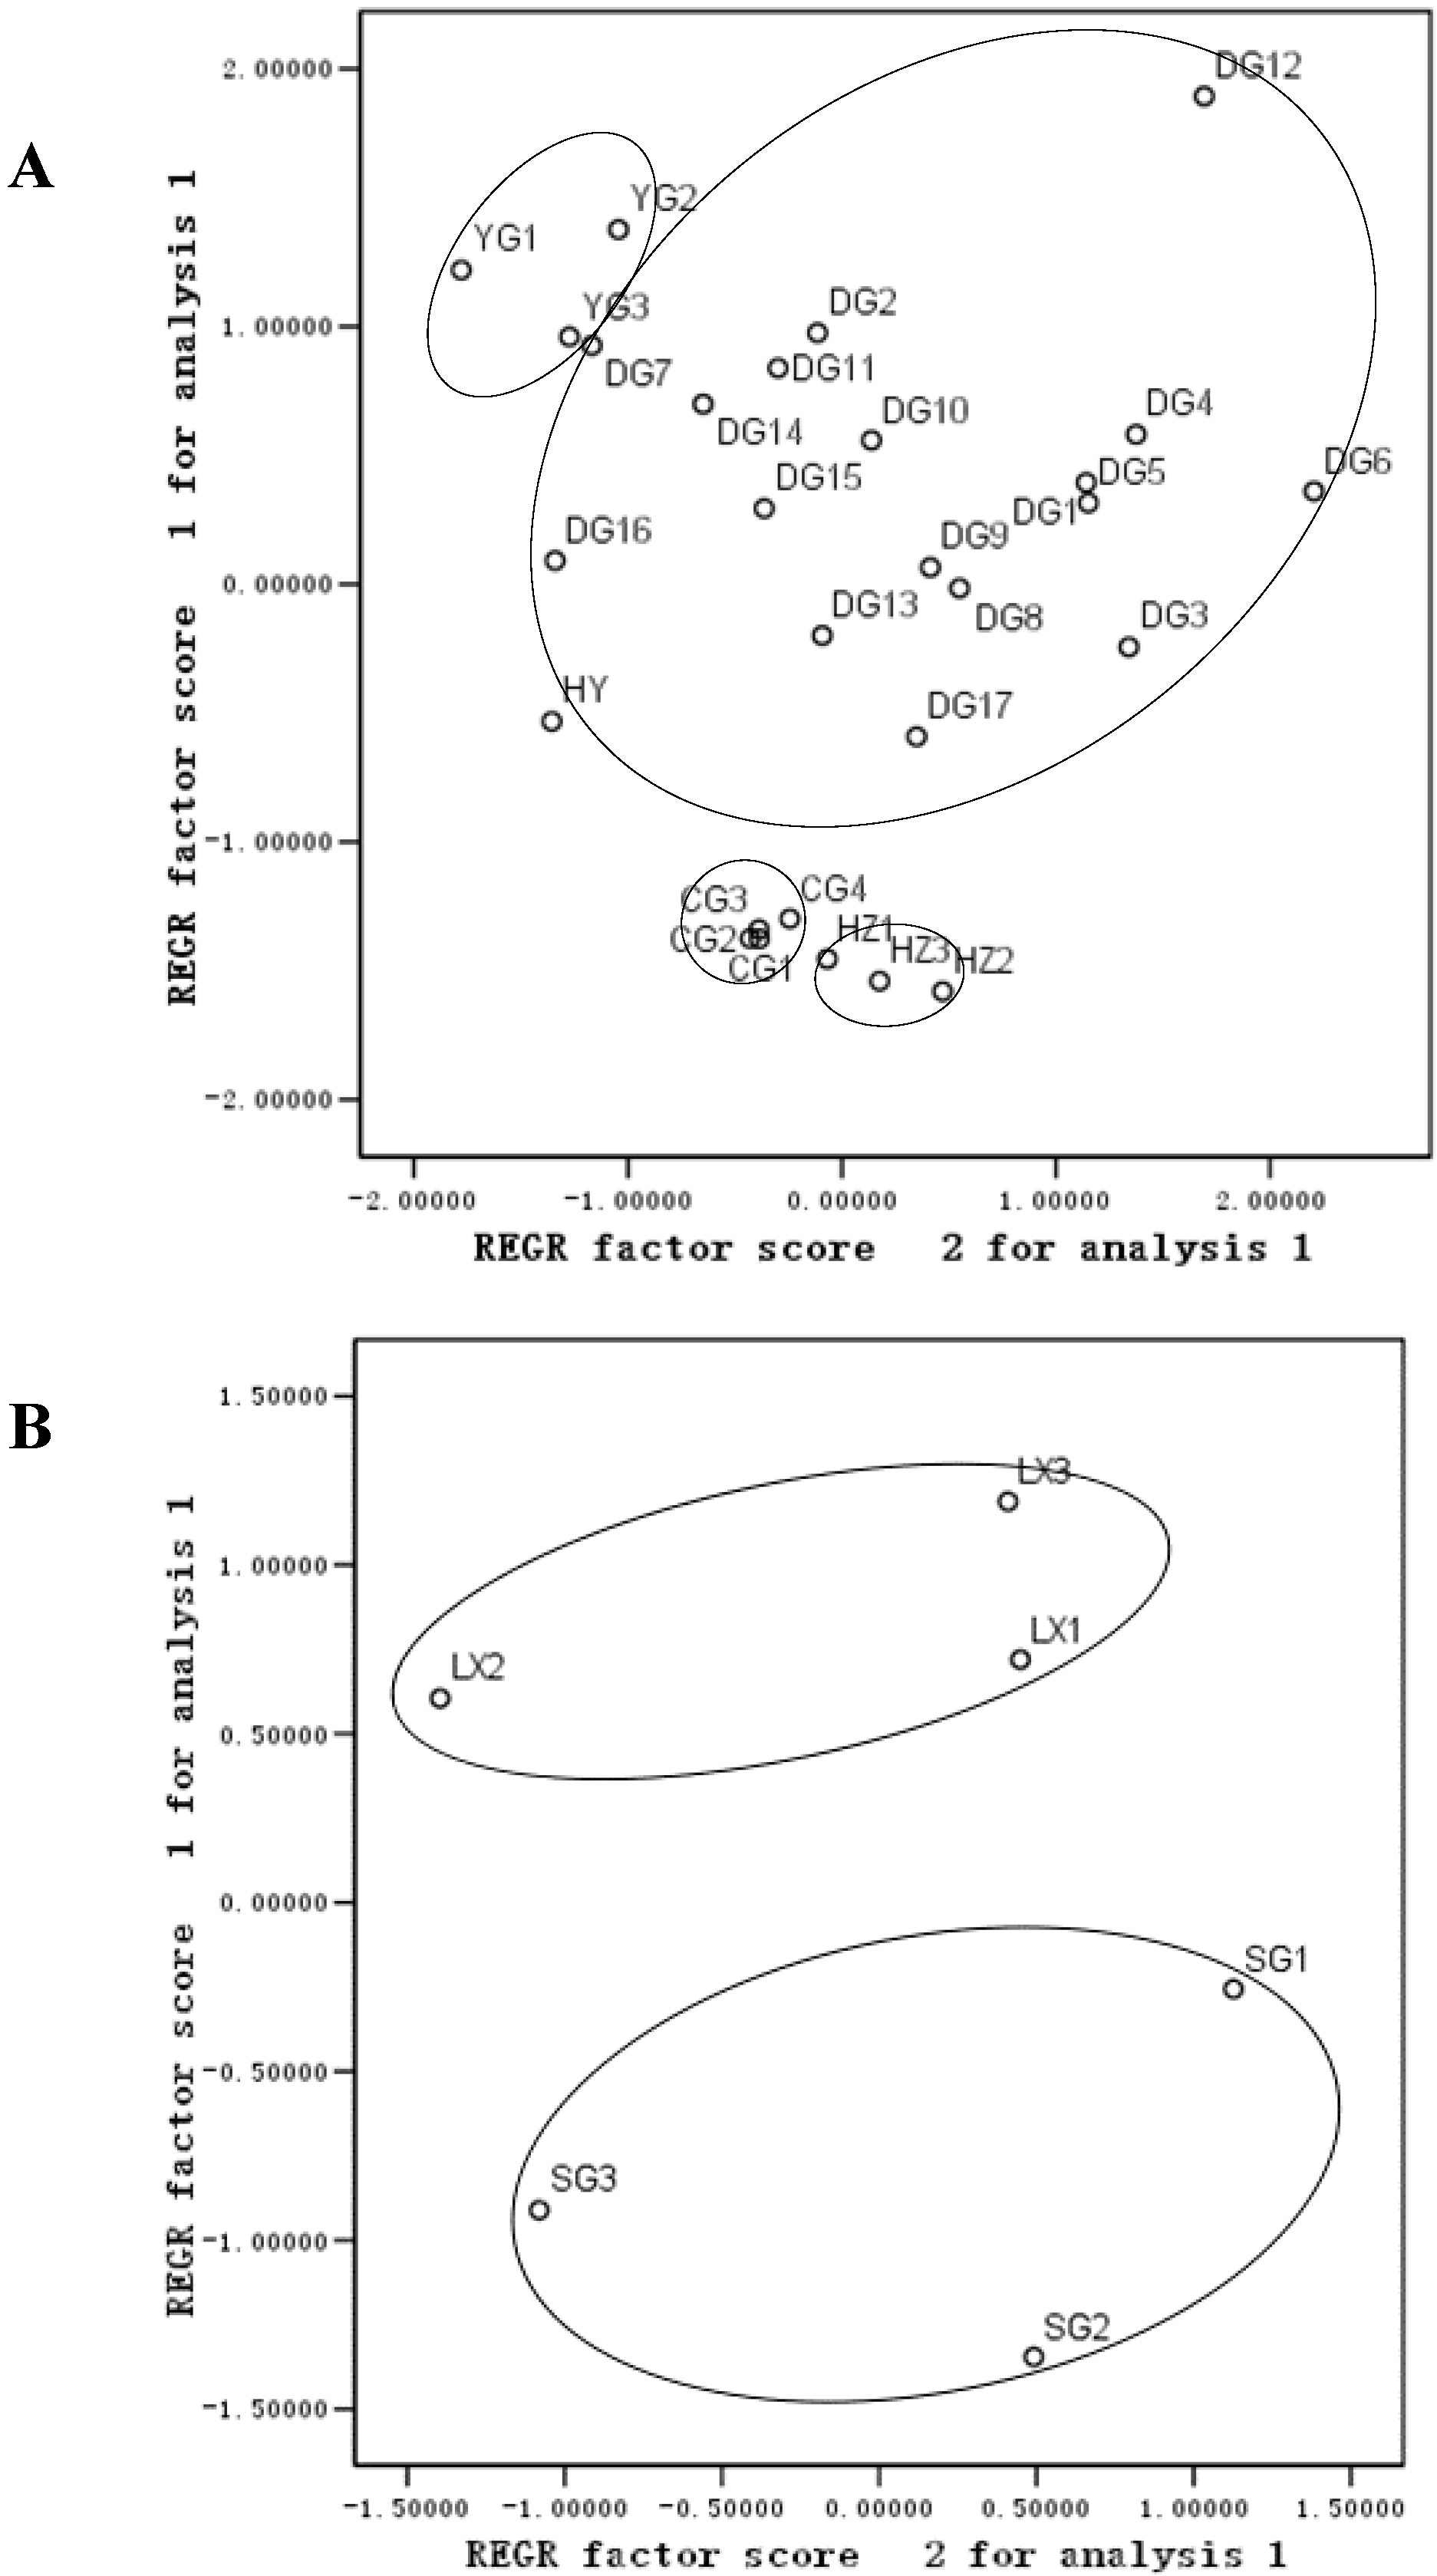
2.5. Principal Component Analysis (PCA)

3. Experimental Section
3.1. Chemicals, Reagents and Materials

3.1.1. UPLC Conditions
| Sample Source | Collection Time | Description | |
|---|---|---|---|
| DG1 | Zhifang Village, Sigou Xiang, Min Xian, Gansu | 21 October 2012 | Biennial |
| DG2 | Zhadi Village, Sigou Xiang, Min Xian, Gansu | 21 October 2012 | Biennial |
| DG3 | Babu Village, Sigou Xiang, Min Xian, Gansu | 22 October 2012 | Biennial |
| DG4 | Lvye Village, Mazichuan Xiang, Min Xian, Gansu | 22 October 2012 | Biennial |
| DG5 | Pashi Village, Awu Xiang, Dangchang Xian, Gansu | 22 October 2012 | Biennial |
| DG6 | Wendou Village, Meichuan Country, Min Xian, Gansu | 23 October 2012 | Biennial |
| DG7 | Wendou Village, Meichuan Country, Min Xian, Gansu | 24 October 2012 | Biennial |
| DG8 | Lizhu Village, Sigou Xiang, Min Xian, Gansu | 24 October 2012 | Biennial |
| DG9 | Qijiazhuang She, Luming Village, Wuzhu Xiang, Weiyuan Xian, Gansu | 24 October 2012 | Biennial |
| DG10 | Shengbutan She, Hadiwo Village, Huichuan, Weiyuan Xian, Gansu | 25 October 2012 | Biennial |
| DG11 | Huichuan Countr, Weiyuan Xian, Gansu | 25 October 2012 | Biennial |
| DG12 | Shitou Zhuang, Wuzhu Xiang, Weiyuan Xian, Gansu | 25 October 2012 | Biennial |
| DG13 | Wuzhu Village, Wuzhu Xiang, Weiyuan Xian, Gansu | 25 October 2012 | Biennial |
| DG14 | Shitou Zhuang, Wuzhu Xiang, Weiyuan Xian, Gansu | 25 October 2012 | Biennial |
| DG15 | Wuzhu Village, Wuzhu Xiang, Weiyuan Xian, Gansu | 25 October 2012 | Biennial |
| DG16 | Huichuan Zhen, Weiyuan Xian, Gansu | 26 October 2012 | Biennial |
| DG17 | Xiadiema Village, Qingshui Xiang, Min Xian, Gansu | 27 October 2012 | Biennial |
| YG1 | Machang Village, Caohai Country, Heqing Xian, Yunnan | 10 November 2012 | Biennial |
| YG2 | Machang Village, Caohai Country, Heqing Xian, Yunnan | 10 November 2012 | Biennial |
| YG3 | Machang Village, Caohai Country, Heqing Xian, Yunnan | 10 November 2012 | Biennial |
| CG1 | Shimeishan Village, Shiquan Xiang, Zhongjiang Xian, Deyang City, Sichuan | 17 November 2012 | Biennial |
| CG2 | Shimeishan Village, Shiquan Xiang, Zhongjiang Xian, Deyang City, Sichuan | 17 November 2012 | Biennial |
| CG3 | Shimeishan Village, Shiquan Xiang, Zhongjiang Xian, Deyang City, Sichuan | 17 November 2012 | Biennial |
| CG4 | Shimeishan Village, Shiquan Xiang, Zhongjiang Xian, Deyang City, Sichuan | 17 November 2012 | Biennial |
| HZ1 | Hongta Xiang, Chengguan Country, Fang Xian, Shiyan City, Hubei | 20 November 2012 | Biennial |
| HZ2 | Hongta Xiang, Chengguan Country, Fang Xian, Shiyan City, Hubei | 20 November 2012 | Biennial |
| HZ3 | Hongta Xiang, Chengguan Country, Fang Xian, Shiyan City, Hubei | 20 November 2012 | Biennial |
| HY | Hongta Xiang, Chengguan Country, Fang Xian, Shiyan City, Hubei | 20 November 2012 | Wild |
| LX1 | Medicine market, Min Xian, Gansu | 27 October 2012 | sulfur-fumigation |
| LX2 | Medicine market, Min Xian, Gansu | 27 October 2012 | sulfur-fumigation |
| LX3 | Medicine market, Min Xian, Gansu | 27 October 2012 | sulfur-fumigation |
| SG1 | Medicine market, Min Xian, Gansu | 27 October 2012 | air-dried |
| SG2 | Medicine market, Min Xian, Gansu | 27 October 2012 | air-dried |
| SG3 | Medicine market, Min Xian, Gansu | 27 October 2012 | air-dried |
3.1.2. MS Conditions
3.1.3. Preparation of the Sample Solutions
3.1.4. Preparation of the Standard Solutions
3.2. Method Validation
4. Conclusions
Acknowledgments
Author Contributions
Conflicts of Interest
References
- Pharmacopoeia of the People’s Republic of China, English ed.; Chemical Industry Press: Beijing, China, 2010; p. 125.
- Mei, Q.B.; Tao, J.Y.; Cui, B. Advances in the pharmacological studies of radix Angelica sinensis (Oliv.) Diels (Chinese Danggui). Chin. Med. J. 1991, 104, 776–781. [Google Scholar] [PubMed]
- Tang, W.; Eisenbrand, G.F. Chinese Drugs of Plant Origin; Springer-Verlag: Berlin, Germany, 1992; p. 118. [Google Scholar]
- Huang, W.H.; Song, C.Q. Research progresses in the chemistry and pharmacology of Angelica sinensis (Oliv.) Diel. Chin. J. Chin. Mater. Med. 2001, 26, 147–151. [Google Scholar]
- Sarker, S.D.; Nahar, L. Natural medicine: The genus Angelica. Curr. Med. Chem. 2004, 11, 1479–1500. [Google Scholar] [CrossRef] [PubMed]
- Zhao, K.J.; Dong, T.T.; Tu, P.F.; Song, Z.H.; Lo, C.K.; Tsim, K.W. Molecular genetic and chemical assessment of radix Angelica (Danggui) in China. J. Agric. Food Chem. 2003, 51, 2576–2583. [Google Scholar] [CrossRef] [PubMed]
- Yin, Z.Z.; Zhang, L.Y.; Xu, L.N. The effect of Dang-Gui (Angelica sinensis) and its ingredient ferulic acid on rat platelet aggregation and release of 5-HT (author’s translation). Acta Pharm. Sin. 1980, 15, 321. [Google Scholar]
- Li, J.M.; Zhao, Y.H.; Zhong, G.C.; Long, Z.J.; Zhou, P.; Yuan, M. Synthesis of ferulic acid derivatives and their inhibitory effect on platelet aggregation. Acta Pharm. Sin. 2011, 46, 305–310. [Google Scholar]
- Hua, Y.; Xue, W.; Zhang, M.; Wei, Y.; Ji, P. Metabonomics study on the hepatoprotective effect of polysaccharides from different preparations of Angelica sinensis. J. Ethnopharmacol. 2014, 151, 1090–1099. [Google Scholar] [CrossRef]
- Lin, L.Z.; He, X.G.; Lian, L.Z.; King, W.; Elliott, J. Liquid chromatographic-electrospray mass spectrometric study of the phthalides of Angelica sinensis and chemical changes of Z-ligustilide. J. Chromatogr. A 1998, 810, 71–79. [Google Scholar] [CrossRef]
- Qian, Y.; Wang, Y.; Sa, R.; Yan, H.; Pan, X.; Yang, Y.; Sun, Y. Metabolic fingerprinting of Angelica sinensis during growth using UPLC-TOFMS and chemometrics data analysis. Chem. Cent. J. 2013, 7, 42. [Google Scholar] [CrossRef] [PubMed]
- Wedge, D.E.; Klun, J.A.; Tabanca, N.; Demirci, B.; Ozek, T.; Baser, K.H.; Liu, Z.; Zhang, S.; Cantrell, C.L.; Zhang, J. Bioactivity-Guided Fractionation and GC/MS Fingerprinting of Angelica sinensis and Angelica archangelica Root Components for Antifungal and Mosquito Deterrent Activity. J. Agric. Food Chem. 2009, 57, 464–470. [Google Scholar] [CrossRef] [PubMed]
- Li, S.L.; Lin, G.; Chung, H.S.; Tam, Y.K. Study on fingerprint of Rhizome Chuanxiong by HPLC-DAD-MS. Acta Pharm. Sin. 2004, 39, 621–626. [Google Scholar]
- Lao, S.C.; Li, S.P.; Kan, K.K.W.; Li, P.; Wan, J.B.; Wang, Y.T.; Dong, T.T.X.; Tsim, K.W.K. Identification and quantification of 13 components in Angelica sinensis (Danggui) by gas chromatography mass spectrometry coupledwith pressurized liquid extraction. Anal. Chim. Acta 2004, 526, 131–137. [Google Scholar] [CrossRef]
- Lu, X.H.; Zhang, J.J.; Liang, H.; Zhao, Y.Y. Chemical constituents of Angelica sinensis. J. Chin. Pharm. Sci. 2004, 13, 1–3. [Google Scholar]
- Yang, F.; Xiao, Y.S.; Zhang, F.F.; Xue, X.Y.; Xu, Q.; Liang, X.M. High performance liquid chromatography-mass spectrometry analysis of radix Angelica sciensis. Acta Pharm. Sin. 2006, 41, 1078–1083. [Google Scholar]
- Tzu, S.; Hsu, Y.C.C.; Hsu, M.C.; Liu, J.F. Angelica Sinensis promotes myotube hypertrophy through the PI3K/Akt/mTOR pathway. BMC Complement. Altern. Med. 2014, 14, 144. [Google Scholar] [CrossRef] [PubMed]
- Qi, H.Y.; Siu, S.O.; Chen, Y.; Rong, J.H. Senkyunolides reduce hydrogen peroxide-induced oxidative damage in human liver HepG2 cells via induction of heme oxygenase-1. Chem.-Biol. Interact. 2010, 183, 380–389. [Google Scholar] [CrossRef] [PubMed]
- Wang, C.; Feng, R.; Li, Y.; Zhang, Y.; Kang, Z.; Zhang, W.; Sun, D.-J. The metabolomic profiling of serum in rats exposed to arsenic using UPLC/Q-TOF MS. Toxicol. Lett. 2014, 229, 474–481. [Google Scholar] [CrossRef] [PubMed]
- Li, W.; Tang, Y.; Qian, Y.; Shang, E.; Wang, L.; Zhang, L.; Su, S.; Duan, J.A. Comparative analysis of main aromatic acids and phthalides in Angelicae Sinensis Radix, Chuanxiong Rhizoma, and Fo-Shou-San by avalidated UHPLC-TQ-MS/MS. J. Pharm. Biomed. Anal. 2014, 99, 45–50. [Google Scholar] [CrossRef] [PubMed]
- Liu, X.N.; Zhang, M.T.; Zhao, J.B.; Song, P.S.; Ding, Y.H. Research on relevance between macroscopic feature individual differences and quality of Gansu cultivated Angelica sinensis. Zhong Yao Cai. 2013, 36, 871–874. [Google Scholar] [PubMed]
- Wang, Z.; Wang, D.; Huang, L. Analysis of the Correlation between Commodity Grade and Quality of Angelica sinensis by Determination of Active Compounds Using Ultraperformance Liquid Chromatography Coupled with Chemometrics. Evid. Based Complement. Altern. Med. 2014, 2014. [Google Scholar] [CrossRef]
- Sample Availability: Samples are available from authors.
© 2015 by the authors. Licensee MDPI, Basel, Switzerland. This article is an open access article distributed under the terms and conditions of the Creative Commons Attribution license ( http://creativecommons.org/licenses/by/4.0/).
Share and Cite
Wei, W.-L.; Huang, L.-F. Simultaneous Determination of Ferulic Acid and Phthalides of Angelica Sinensis Based on UPLC-Q-TOF/MS. Molecules 2015, 20, 4681-4694. https://doi.org/10.3390/molecules20034681
Wei W-L, Huang L-F. Simultaneous Determination of Ferulic Acid and Phthalides of Angelica Sinensis Based on UPLC-Q-TOF/MS. Molecules. 2015; 20(3):4681-4694. https://doi.org/10.3390/molecules20034681
Chicago/Turabian StyleWei, Wen-Long, and Lin-Fang Huang. 2015. "Simultaneous Determination of Ferulic Acid and Phthalides of Angelica Sinensis Based on UPLC-Q-TOF/MS" Molecules 20, no. 3: 4681-4694. https://doi.org/10.3390/molecules20034681
APA StyleWei, W.-L., & Huang, L.-F. (2015). Simultaneous Determination of Ferulic Acid and Phthalides of Angelica Sinensis Based on UPLC-Q-TOF/MS. Molecules, 20(3), 4681-4694. https://doi.org/10.3390/molecules20034681