Review

Analysis of Phenolic and Cyclic Compounds in Plants Using Derivatization Techniques in Combination with GC-MS-Based Metabolite Profiling

Department of Biology, Norwegian University of Science and Technology, Trondheim 7491, Norway
Molecules 2015, 20(2), 3431-3462; https://doi.org/10.3390/molecules20023431
Submission received: 18 December 2014 / Revised: 6 January 2015 / Accepted: 10 February 2015 / Published: 17 February 2015
(This article belongs to the Section Molecular Diversity)

Abstract

:
Metabolite profiling has been established as a modern technology platform for the description of complex chemical matrices and compound identification in biological samples. Gas chromatography coupled with mass spectrometry (GC-MS) in particular is a fast and accurate method widely applied in diagnostics, functional genomics and for screening purposes. Following solvent extraction and derivatization, hundreds of metabolites from different chemical groups can be characterized in one analytical run. Besides sugars, acids, and polyols, diverse phenolic and other cyclic metabolites can be efficiently detected by metabolite profiling. The review describes own results from plant research to exemplify the applicability of GC-MS profiling and concurrent detection and identification of phenolics and other cyclic structures.

1. Introduction

Chromatographic techniques for the detection and identification of metabolites in plant material have undergone major changes in recent years due to improvements of analysis time, detection limit and separation characteristics. Depending on the biological question, one might distinguish between targeted and non-targeted strategies. Gas chromatography (GC) in particular is characterized by sensitivity and reliability of separations and detection of complex sample mixtures. Coupling with mass spectrometry (MS) provides highly robust analysis platforms compared to liquid chromatography (LC-MS) and allows for the identification of compounds based on the use of commercially or publicly available MS libraries and resources (Table 1) in combination with retention time index (RI) data.
Table 1. Selection of commercially and publicly available MS libraries and resources for structure elucidation and compound identification of GC-MS data. Included is also a list of freely software tools for identification, deconvolution and alignment purposes.
ProductSupplier or Institution
Commercial MS Libraries
NIST—NIST/EPA/NIH Mass Spectral LibraryNational Institute of Standards and Technology/Gaithersburg, MD, USA
Wiley—Wiley Registry of Mass Spectral DataJohn Wiley & Sons, Inc./ Hoboken, NJ, USA
FiehnLib—Fiehn GC-MS Metabolomics RTL LibraryAgilent Technologies, Inc./ Santa Clara, CA, USA
Public MS Libraries & Resources
GMD—Golm Metabolome DatabaseMax Planck Institute of Molecular Plant Physiology/Golm, Potsdam, Germany
MassBank—High Quality Mass Spectral DatabaseNational Bioscience Database Center/Tokyo, Japan
MetabolomeExpress—Public MSRI LibrariesPlant Energy Biology, ARC Centre of Excellence/Acton, Canberra, Australia
ReSpect—Riken MSn spectral database (LC/MS)Metabolomics Research Division, RIKEN Plant Science Center,/Tsuruoka, Japan
Metlin—Metabolite and Tandem MS DatabaseScripps Center for Metabolomics/La Jolla, CA, USA
HMDB—Human Metabolome DatabaseGenome Alberta & Genome Canada, University of Alberta/Edmonton, Canada
m/z CLOUD—Advanced Mass Spectral DatabaseHighChem Ltd. / Bratislava, Slovakia
NIST—NIST Chemistry WebBookNational Institute of Standards and Technology/Gaithersburg, MD, USA
Free GC/MS Analysis Software & Tools
AMDIS—Automated Mass Spectral Deconvolution and Identification SystemNational Institute of Standards and Technology/Gaithersburg, MD, USA
Tagfinder—GC-MS analysis software (free upon request)Max Planck Institute of Molecular Plant Physiology/Golm, Potsdam, Germany
MetaboliteDetector—Data deconvolution & analysisTU Braunschweig, Germany
OpenChrom—Software for chromatography and MSDr. Philip Wenig/ Hamburg, Germany
Free GC/MS Alignment Tools
Metalign—Processing of LC-MS and GC-MS dataWageningen UR (University & Research centre)/Wageningen, The Netherlands
MZmine—Processing of LC-MS and GC-MS dataTurku Centre for Biotechnology/ Turku, Finland
MetaboAnalyst—Comprehensive tool suite for metabolomic data analysisThe Metabolomics Innovation Centre (TMIC)/University of Alberta, Canada
SpectConnect—GC-MS data alignment and analysisMassachusetts Institute of Technology (MIT)/Boston, MA, USA
Recent technological advances in high-resolution and high-throughput methods generally termed as metabolomics, allow for large scale GC-MS profiling regarding the high number of measured metabolites and experiments carried out [1]. Gas chromatography time-of-flight mass spectrometry (GC-TOF-MS) provides fast scanning, high sensitivity and mass accuracy compared to common quadrupole (GC-QMS) or ion trap instrumentation (GC-ITMS), and is considered the standard GC platform in many metabolomics labs. Sample processing for GC-MS-based metabolite profiling include solvent extraction, concentration to dryness and consecutive derivatization, often carried out in a two-step procedure. In the first step, methoximation (also called methoxyamination) is achieved by a reaction of sample components with e.g., O-methoxylamine hydrochloride diluted in pyridine to stabilize thermolabile enolic aldehydes and ketones and to convert them into oximes or alkyl oximes. In the second step, extracted metabolites are derivatized with silylating reagents [1,2]. The latter step is crucial for the adequate derivatization of non-volatile compounds, in order to capture a huge variety of metabolites with polar characteristics and high boiling points on a GC-MS system. Detectable compounds comprise sugars (mono-, di- and trisaccharides), sugar alcohols/acids, amino and fatty acids, phosphorylated intermediates and many plant secondary metabolites such as phenolics, terpenoids, steroids and alkaloids.
These efforts have finally led to the development of searchable databases and libraries such as the Golm Metabolome Database (GMD) and the MassBank MS Database, which provide mass spectral information about TMS derivatives (Table 1). In addition to instrument-based GC-MS software (e.g., Agilent ChemStation and Thermo Scientific’s Mass Frontier), a wide range of deconvolution and analysis programmes are freely available, either bundled with MS libraries such as AMDIS (NIST MS library) and Tagfinder (GMD), or stand-alone software such as MetaboliteDetector and OpenChrom. Consecutive alignment of vast numbers of sample files from large-scale experiments is an indispensable procedure generating huge output matrices of thousands or even millions of data points. The processing of single fragment ion information is a common feature of advanced GC-MS alignment tools. It further allows for the identification of conserved compounds and metabolite patterns present in all samples, or unique metabolite markers which can be traced based on characteristic ion fragments. However, the use of reference substances, and if not available, corresponding scientific literature and online tools are often inevitable, in order to receive information about molecular ions (M+) and common fragments for the detection of molecules of interest. The plant kingdom produces a vast number of different chemical structures, which is predicted to exceed 200,000 metabolites [3]. Moreover, MS information of silylated natural products is insufficiently represented in available compound libraries for GC-MS platforms based on electron ionization (EI). More suitable chromatographic profiling platforms such as LC-MS are available for analysis of metabolites with higher polarity and molecular weights up to 2000 Da [4]. In addition, comprehensive mass spectral libraries (MS, MSn data) containing MS information about thousands of secondary structures, are readily accessible for compound identification, e.g., ReSpect for Phytochemicals, Metlin Metabolite and Tandem MS Database, and MassBank. However, GC-MS-based metabolite profiling of derivatized polar extracts is capable of capturing a huge variety of smaller secondary metabolites up to 800 Da as presented in the following sections.

2. GC-MS Profiling of Complex Chemical Matrices

Beside parameters related to proper MS compound identification and use of retention index (RI) data, several aspects related to metabolite extraction and derivatization need to be considered in GC-MS-based metabolite profiling. Depending on the biological question, metabolite targets, and sample matrix, solvents of differing polarity and varying phases have been investigated for compound extraction. For global metabolomics approaches, the use of extraction mixtures covering a wide range from polar to apolar metabolites such as H2O:MeOH:CHCl3 (1:2.5:1) or H2O:MeOH are favoured [2,5]. In other cases, one might need to separate lipids from the polar phase as described by Lisec et al. [1], either for separate chromatographic study of the different fractions [6], or for a more targeted metabolite analysis.

2.1. Extraction Methods and Metabolite Coverage

While sample preparation and processing need to be individually adapted and customized, sample extraction often follows standardized procedures using established protocols for comprehensive metabolite profiling and non-targeted metabolomics approaches as already outlined at the beginning. An important parameter in high-throughput metabolite profiling is the high degree of miniaturization and automation in sample handling, requiring the processing of small or ultrasmall sample sizes as low as a few milligrams. Unless secondary metabolites are highly abundant, their potential recovery under such extraction conditions and GC-MS detection proves insufficient. Moreover, microextraction techniques such as sorbent-based solid-phase microextraction (SPME) [7], stirbar-sorptive extraction (SBSE) [8], and solvent-based methods such as e.g., single-drop microextraction (SDME) and liquid-liquid microextraction (LLME) [9] establish sensitive methods for the characterization of complex profiles of volatile compounds found in plant and food samples. Microextraction might also be successfully combined with derivatization techniques and subsequent gas chromatographic separation for the detection of a wide range of volatiles with different polarity [10,11,12]. In general, metabolomic approaches based on SPME extraction and detection of non-derivatized volatiles, emphasize the technique’s tremendous capacity to cover a broad range of different compound groups [13], also including aromatic structures, as shown for e.g., tomato [14] and peach [15].

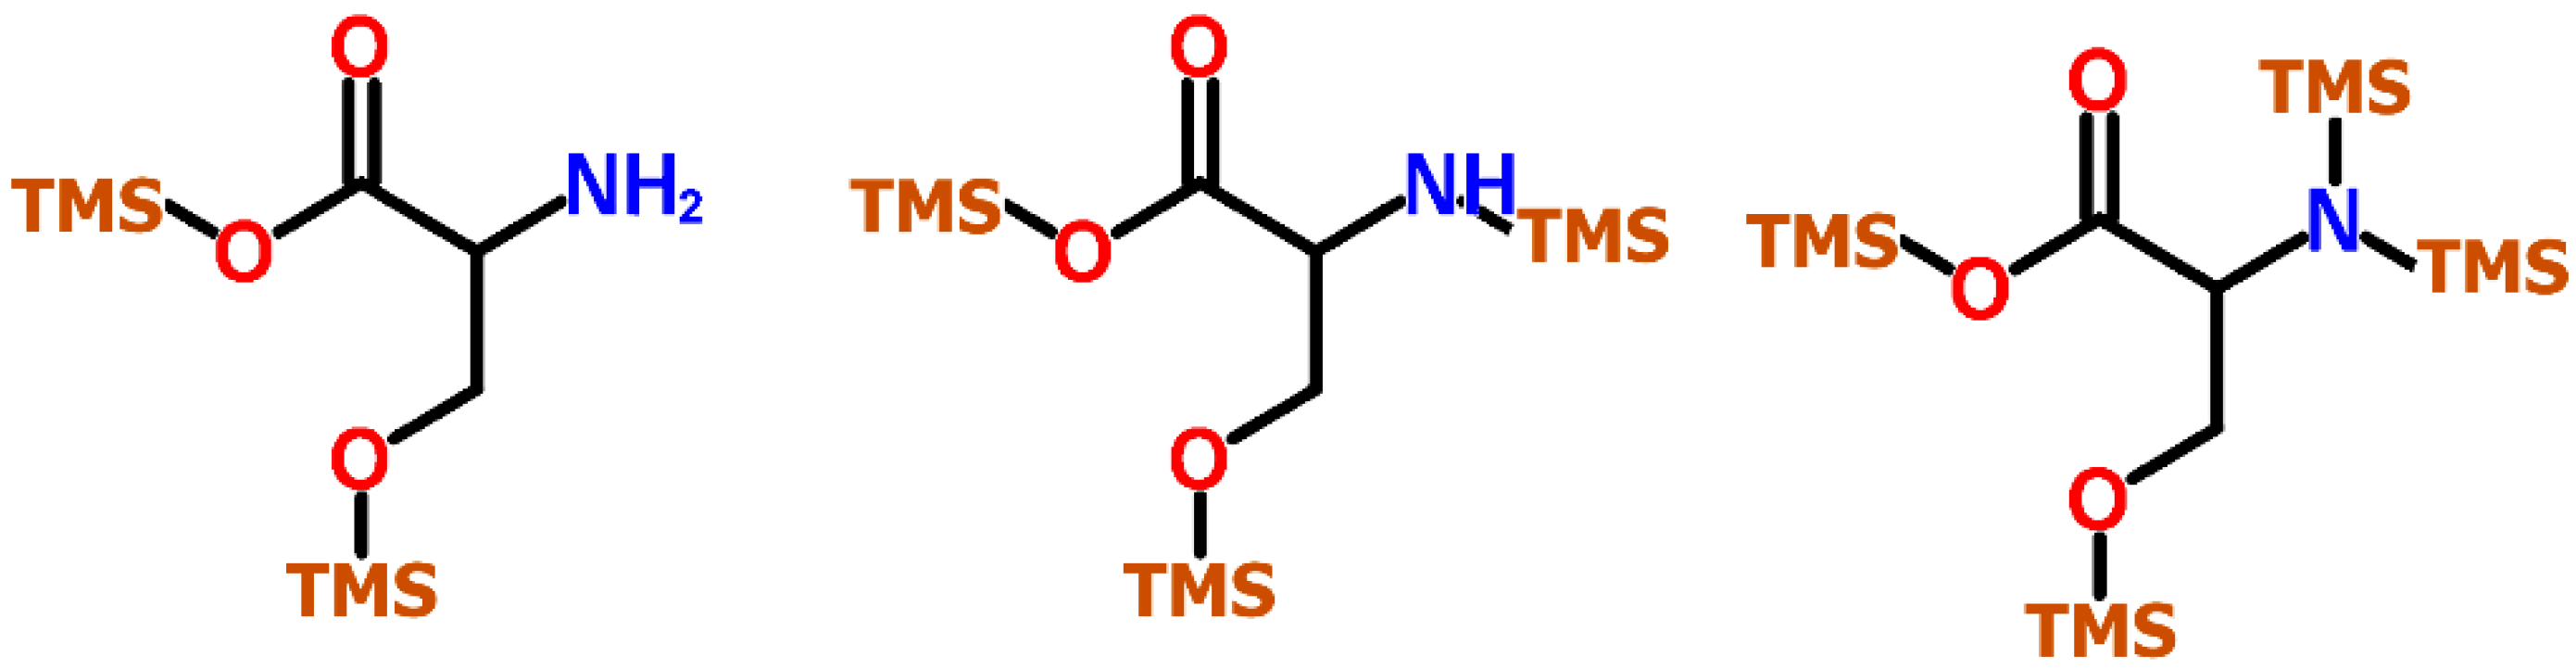
2.2. Derivatization of Metabolites

Derivatization prior to GC-MS is an essential preparatory step, which reduces polarity and increases volatility, and simultaneously, thermal stability of metabolites. Compound derivatization is either based on silylation, alkylation or acylation reactions, and a wide range of reagents with different properties are available. Comprehensive studies have shown the superior properties of silylation agents [16], which substitute protons bound to heteroatoms in functional groups (‑OH, ‑COOH, ‑NH2, -NH, -SH, -OP(=O)(OH)2, etc.) and generate trimethylsilyl (TMS) and tert-butyldimethylsilyl (TBS) derivatives [17]. Though N-[dimethyl-(2-methyl-2-propyl)silyl]-2,2,2-trifluoro-N-methylacetamide (MTBSTFA), N,O-bis(trimethylsilyl)trifluoroacetamide (BSTFA) and N-methyl-N-(trimethylsilyl)trifluoroacetamide (MSTFA) are widely applied in biological analyses, the use of MSTFA as derivatization agent has been favoured by leading metabolomics labs worldwide. In specific cases, the use of other derivatization agents might be advised. Newer studies suggest alkylation with e.g., methyl chloroformate (MCF) instead of, or in combination with compound silylation due to improved analytical performance [18]. MCF derivatization shows improved reproducibility and compound stability compared to silylation, and is suitable for the analysis of microbial-derived samples with matrices mainly composed of amino and non-amino organic acids, amines and nucleotides [18]. However, due to the wide range of compound structures being covered by combined methoximation and TMS derivatization [19], comprising amino acids, fatty acids, lipids, amines, alcohols, sugars, amino-sugars, sugar alcohols, sugar acids, organic phosphates, hydroxyl acids, aromatics, purines, and sterols, major metabolomics attempts towards the development of MS libraries have favoured the coverage of oximated and silylated metabolites.
Despite the feasibility and power of combined oximation/silylation in global metabolite profiling approaches, several factors impair sample analysis and data quality. A major point is that silylation reactions have to be carried out under anhydrous reaction conditions [18], which requires an additional drying step of sample extracts (e.g., SpeedVacTM (Thermo Scientific, Waltham, MA, USA) or lyophilization). Excess derivatization reagents are commonly introduced in the GC injection port, potentially leading to additional peaks in the chromatogram. Moreover, also non-volatile non-derivatized metabolites or even macromolecules such as peptides, proteins or polysaccharides might be injected, depending on preceding sample clean-up conditions (precipitation, centrifugation and/or filtration) and thus, impede separation performance and GC data analysis. Nevertheless, the utilization of packed inlet liners and/or suitable guard columns circumvent these problems and can protect analytical capillary columns from sample impurities.
Another important factor affecting the quality of metabolite data is the occurrence of artefacts of silylated compounds in GC-MS profiling [17]. Unexpected by-products might add to the complexity of peaks in a chromatogram and interfere with the identification process. This includes also conversion reactions of unstable intermediates, e.g., arginine to ornithine when using BSTFA or MSTFA, potentially leading to misinterpretation of metabolic data [4]. But more important, multiple peaks of one and the same metabolite, i.e., with different degree of TMS silylation of the original molecule, might be detected. This is particularly true for those metabolites with several functional groups such as amino acids (-COOH, -NH2, -OH) and monosaccharides which carry a high number of hydroxy groups. The amino acid serine e.g., shows four active hydrogens which might be exchanged by TMS groups (Figure 1).
Figure 1. Trimethylsilylation levels of the amino acid serine commonly found in TMS derivatized samples. In serine (2TMS), the OH- and COOH-group are trimethylsilylated, in serine (3TMS) one OH-group of the amino group is exchanged, while in serine (4TMS) all active hydrogens are exchanged.
Molecules 20 03431 g001
In GC-MS one might deal with both the 2TMS stage, where only the carboxy and hydroxy group are silylated, and the 3TMS and 4TMS stage with one or both H+ of the amino group exchanged. For this reason, MS data of metabolites showing a varying numbers of TMS groups, and both oximate/ TMS metabolite derivatives have been included in MS libraries (e.g., GMD database, NIST, etc.). Such considerations play an important role if metabolites levels shall be quantitatively acquired. Expected that multiple compounds show the same detection response, their individual responses might be summed. Regarding secondary metabolites, it is likely to assume that artifact formation also occurs for these compounds depending on the number of active hydrogens and the given derivatization conditions. However, MS information of such by-products is scarcely, if at all, included in available TMS-MS libraries.

2.3. GC-MS Metabolite Profiling—Applications, Performance and Reliability

The term metabolite profiling has already existed for many years, but first the development of high-capacity and high-throughput chromatographic systems in recent years has established the basis to generate extensive amounts of profiling data, which is comparable in its extent to the output of proteomics and transcriptomic analyses. Moreover, the applicability and significance of particularly GC-MS metabolite profiling in functional genomics was early recognized using the plant model systems Arabidopsis thaliana and potato (Solanum tuberosum) [20,21]. Common for those reports is the low coverage of secondary structures which primarily include major phenolic acids, pyridines, tocopherols and sterols. The concept of metabolomics has been applied also for the study of crop plants in more recent years [22]. Using tomato (Solanum lycopersicum) as an example, breeding goals towards nutritional quality [23] and yield [24], impact of environment such as fertilization [25], and temporal metabolite patterns in molecular crop physiology have been addressed [26]. Also here, GC-MS metabolite profiling had major focus on central metabolism and less on secondary structures. However, phenolic acids commonly found in plant material have been detected in potato [27,28], maize [29], soybean leaves [30] and tobacco [31]. GC-MS profiling of lipophilic compounds including sterols/triterpenes and tocopherols has been described for tomato cuticles [32] and maize grain [29]. One important and necessary concept for the description of genetically modified (GM) crops is the so-called substantial equivalence based on the evaluation whether the chemical composition of a GM crop differs from the non-GM counterpart or not. Metabolite profiling is utilized as an essential tool for screening of GM crops with regard to quality and health requirements in order to investigate potential changes in metabolite profiles in e.g., wheat [33], rice [34], and maize [35].
Global metabolomic approaches based on derivatization techniques following GC-MS for the mapping of biosynthetic pathways and characterization of metabolic perturbations and genotypes appear to be less laborious and more cost-effective compared to metabolite targeting. The use of highly sensitive and fast-scanning GC-TOF-MS instrumentation in particular facilitates proper compound detection and resolution of co-eluting peaks. The latter point is a common feature in comprehensive metabolite matrices, and can successfully be addressed based on the acquired data information, including exact retention time, accurate mass, and characteristic MS fragmentation patterns and ion intensities. In GC-QMS or GC-ITMS, on the other hand, analysis time might be extended in order to improve separation performance and resolution of overlapping peaks. In recent years, more advanced extraction and separation methods have been added to the tool box of automated profiling techniques. Such advances include GC × GC-MS (or so-called 2D GC-MS), where samples are subsequently separated on columns of different polarity, thus increasing separation capacity and performance in the detection of biomolecules [36].
However, even the use of accurate mass, MS spectra and RI values might lead to misidentification of compound structures, not least because mass spectra of different TMS derivatives might be notoriously similar (e.g., sugar alcohols), or totally different metabolites might have the same RI value. Another major problem when analysing complex sample mixtures is the fact that metabolite abundances can vary by many orders of magnitude. The linearity and detector response dynamics of metabolites from different structure groups differ greatly [18], thus impeding quantitation of absolute compound concentrations. For that purpose, levels of distinct metabolites might be determined by comparison with calibration standard curve response ratios of various concentrations of standard substance solutions as described by e.g., Roessner-Tunali et al. [37]. Moreover, variations in sample volume, i.e., when using a sample range with a defined maximal tolerance, only allows for relative quantitative detection of metabolites, in contrast to procedures using the same exact amounts of samples and allowing for absolute quantitation [38]—a fact which needs suitable consideration when working with small sample sizes.

2.4. Secondary Metabolites in GC-MS-Based Metabolomic Approaches

GC-MS-based metabolite profiling of TMS derivatives does not only generate vast chemical information about primary metabolism, but includes also extensive MS data about secondary metabolites and “unknowns”. In order to advance the identification process of less abundant structures in plant samples, comprehensive RI tables for cinnamic acids and other simple phenolic structures, flavonoids, tocopherols and sterols have been generated to provide useful information about the elution order of silylated secondary metabolites on a GC system [27,39]. Furthermore, MS fragmentation patterns have been reported for a wide range of secondary metabolites including phenols and phenolic acids [40,41,42,43], flavonoids [42,44,45], alkylresorcinols [46], phytoestrogens [47], secoiridoids and ligstrosides [41,48], diterpenes and diterpenic acids [49], phenolic diterpenes and pentacyclic triterpenes [50], sterols, stanols, and esters thereof [51,52], lignans [53], stilbenes [54,55], and alkaloids [56]. The utilization of relevant scientific literature reporting GC-MS information about phytochemicals is crucial for the tentative identification of less abundant chemical structures in profiling experiments. Regarding the restricted number of primary and major secondary metabolites, which are commonly included in spectral libraries of TMS analytes, several specific secondary structures are described based on case studies presented in Section 4.

3. Detection of Plant Phenolics and Other Cyclic Structures

The following classification of the quite diverse group of phenolic structures and other plant-derived cyclic compounds follows chemical structure characteristics rather than biosynthetic relationships, which makes it easier to discuss the topic from an analytical point of view. In a wider sense phenolic structures addressed here contain either one (Section 3.1) or several aromatic rings (Section 3.2) as part of the molecule. In order to cope with the tremendous variability of primary but also secondary metabolites detectable by GC-MS, several attempts have been made to facilitate identification through the construction of combined RI and MS databases of derivatized compounds, generally termed as mass spectral tags (MST) [57]. Retention time indices are a prerequisite for tentative metabolite annotation of mass spectra showing high similarity such as pentoses and hexoses. Recent efforts have focused on the need for extended and comprehensive RI information by compiling RI values of TMS analytes of various phytochemicals including phenolic acids and flavonoids [39,45,51,58,59], diterpenes [49], sterols [51] and tocopherols [32].
Moreover, several research groups and consortia have addressed the complexity of compound structures, since commercially available libraries (e.g., NIST or Wiley) contained insufficient MS information about derivatized analytes, which are frequently acquired in metabolomics experiments. The Golm Metabolome Database GMD [60] comprise today online information of about >4600 MS analyte entries including >3500 analytes with valid spectra (TMS derivatives, tributylsilyl (TBS) derivatives, and isotopically-labeled compounds). However more than 1400 spectra have not been annotated underscoring the need for further chemical information in order to approach the metabolome of plants and other organisms. The downloadable and searchable GMD library contains about 3600 analytes and MST information about 1200 single metabolites. In comparison, the Fiehn GC-MS Metabolomics RTL Library [19] is based on 1400 analyte entries relating to 900 metabolites, while the Massbank database [61] contains 963 MSTs of TMS analytes relating to >700 single metabolites. Hopefully, public repositories of GC-MS-based spectral information such as MetabolomeExpress [62] might help to extend accessible MS library information also including secondary metabolites.
Only those phenolic and cyclic structures which are commonly detectable in derivatized (silylated) samples following GC-MS profiling protocols applied by the majority of metabolomics labs worldwide [1,2,63,64], will be discussed in Subsection 3.1, Subsection 3.2, Subsection 3.3, Subsection 3.4, Subsection 3.5 and Subsection 3.6. Information about readily searchable and publicly available MS databases and libraries, providing MS spectra of silylated metabolites, presented and discussed in Section 3 and Section 4, will be included in each figure. The following abbreviations (letters) are used: [G]—Golm Metabolome Database; [H]—Human Metabolome Database; [M]—MassBank; [N]—NIST Chemistry WebBook. For LC-MS-based analysis of phytochemicals in general, the reader is referred to recent studies and initiatives for the development of MS/MS libraries such as the accurate mass-time (AMT) tag approach [65] and the PRIMe platform of RIKEN Plant Science Center [66].

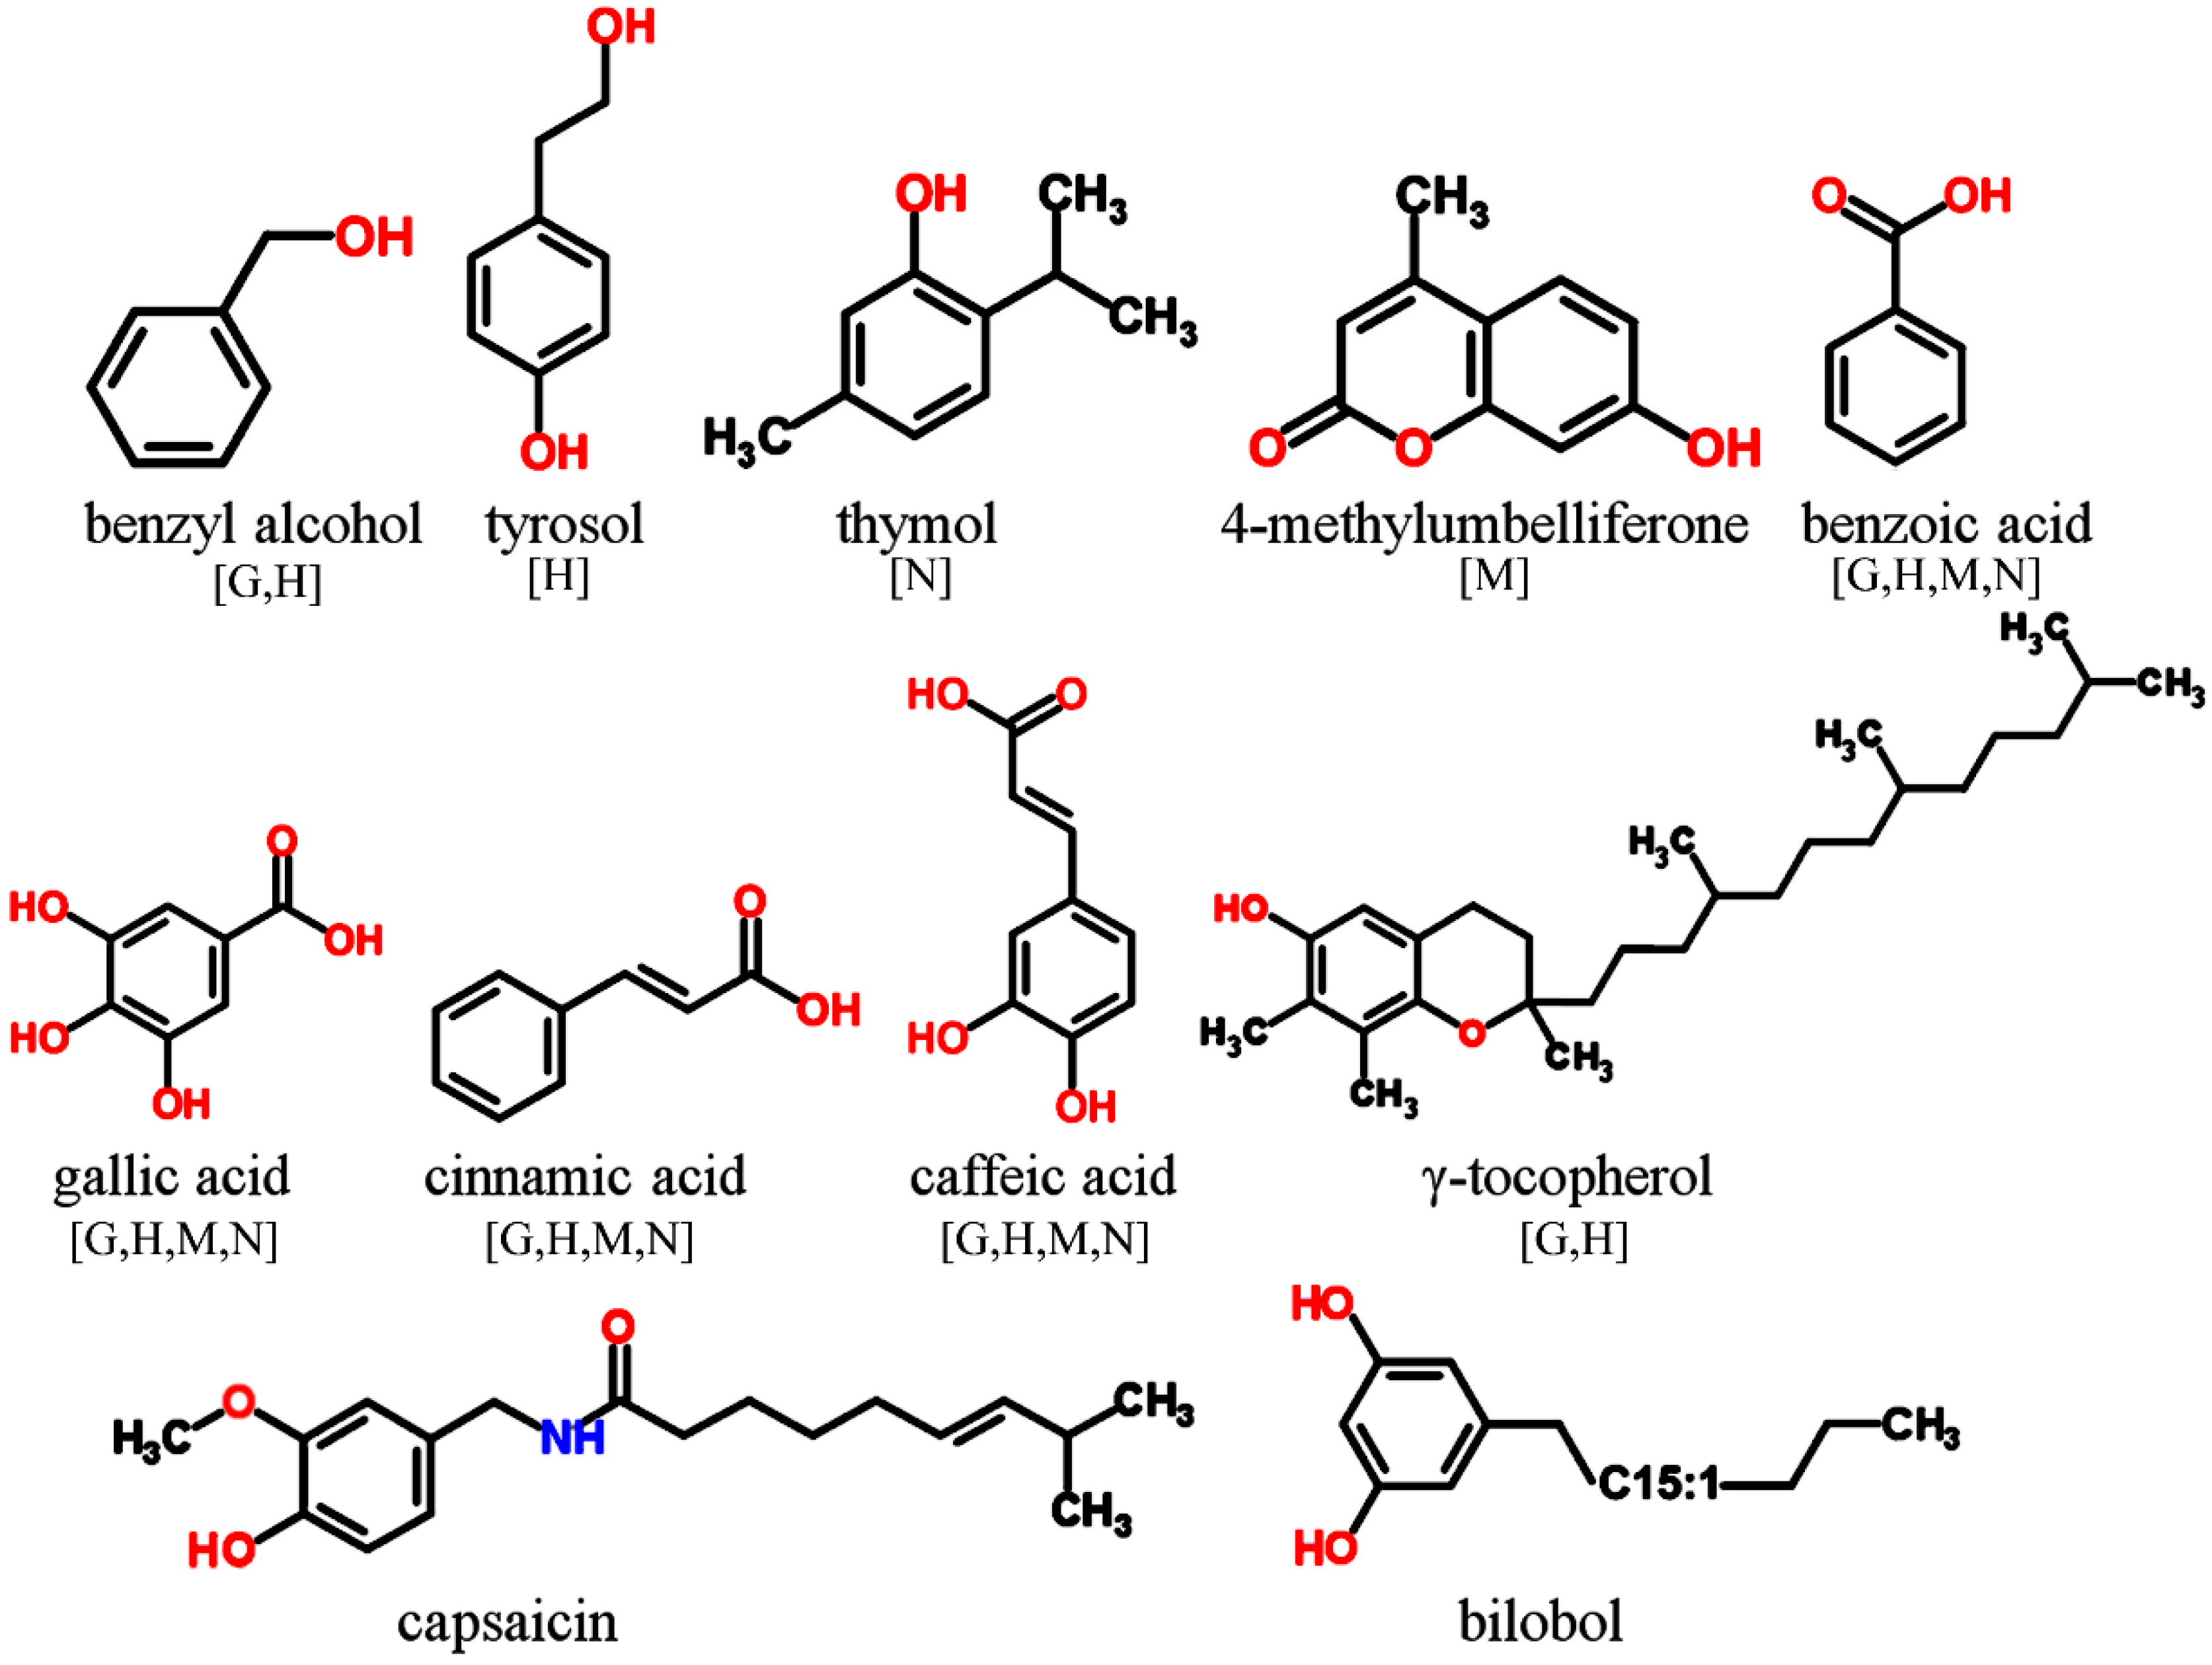
3.1. Simple Phenolics, Aromatic Acids and Related Structures
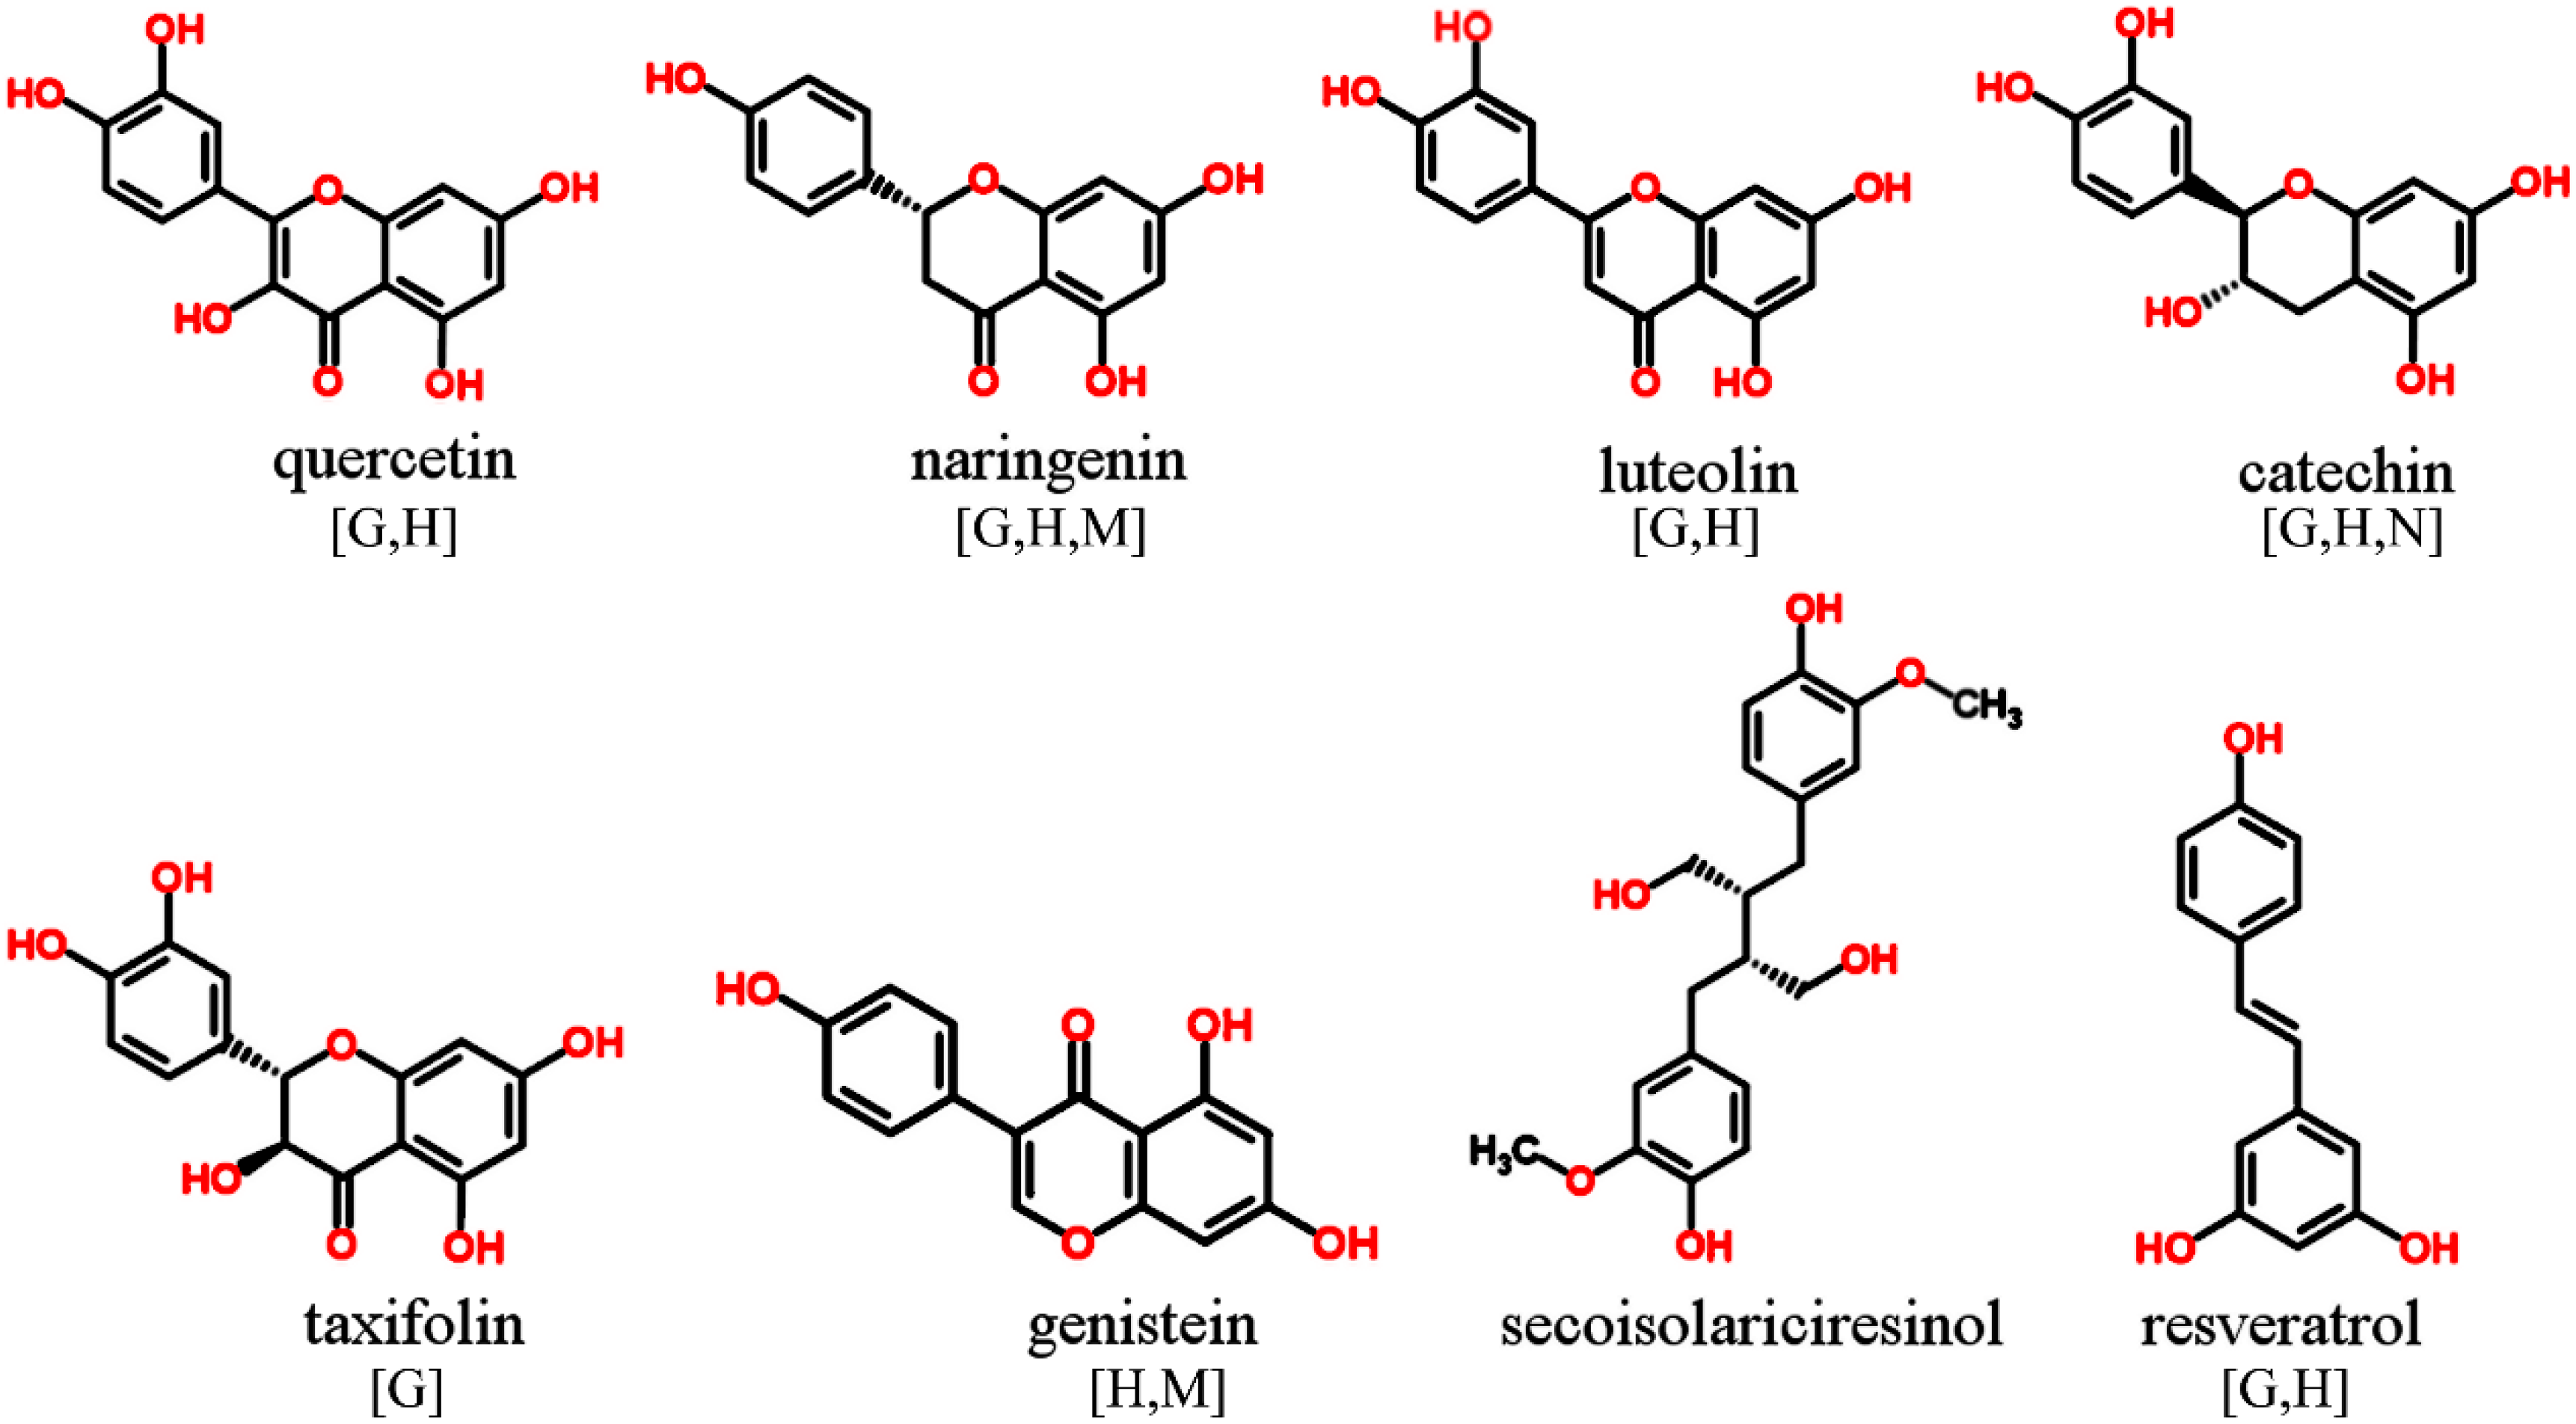
In most cases phenolic structures are derived from aromatic amino acids such as phenylalanine and tyrosine. Detectable phenolic structures comprise monophenols such as thymol (an aromatic monoterpene), benzyl alcohols, phenylethanoids (e.g., tyrosol), and the coumarins (e.g., umbelliferone) (Figure 2). The huge class of aromatic acids include benzoic acid and cinnamic acid derivatives with different degree of hydroxylation and methoxylation. Metabolites with vitamin function such as vitamin E (tocopherols) and vitamin K (phylloquinone and menaquinone) represent minor groups of phenolic structures found in food materials. However, tocopherols like α-, β-, γ- and δ-tocopherol are readily detected in biological samples during profiling experiments. More complexly structured monophenolics comprise phenolic diterpenes (e.g., carnosic acid), phenolic amides including the capsaicinoids with capsaicin as well-known representant, the phenolic lipids, e.g., alkylresorcinols, which are commonly found in cereals (wheat, rye, barley and sorghum), but also in certain tree species and bacteria, and finally benzothiazoles which are mentioned in Subsection 3.6.
Figure 2. Monophenolics and aromatic acids detectable in GC-MS profiling experiments. MS spectra included in publically available databases.
Molecules 20 03431 g002

3.2. Polyphenols

The highly diverse group of plant flavonoids comprise flavonols (e.g., kaempferol and quercetin), flavanones (e.g., naringenin and hesperidin), flavones (e.g., luteolin and apigenin), flavan-3-ols (e.g., catechin and gallocatechin), and flavanonols (e.g., taxifolin) (Figure 3). All these structures, either as aglycon or glycoside, are characterized by a certain number of hydroxy groups which can be silylated. However, due to relatively higher molecular weight of glycosylated polyphenols, the detection and structure elucidation of intact glycosides is preferably achieved on LC platforms, which is also true for hydolyzable tannins. Another closely related group of polyphenols, the phytoestrogens, comprise well-known structures such as isoflavonoids (e.g., genistein and daidzein) commonly found in species of the Fabaceae family, and the lignans (e.g., secoisolariciresinol and pinoresinol) derived from different plant food sources. Also the minor class of stilbenoids, hydroxylated stilbene derivatives such as resveratrol and piceatannol, are readily silylated and detectable if present in appreciable amounts in the sample. In contrast, the important group of anthocyanidins and their glycosylated counterpart, the anthocyanins, show high abundances in fruits and berries but also other plant tissues. These metabolites are normally detected on LC-MS systems not least due to the molecules’ positive charge.
Figure 3. Polyphenols detectable in GC-MS profiling experiments. MS spectra included in publically available databases.
Molecules 20 03431 g003

3.3. Terpenoids and Sterols

The terpenoids including the biosynthetically-derived sterols establish a huge class of secondary metabolites which can be found in diverse organisms (Figure 4). Mono- and sesquiterpenes are volatile and lipophilic metabolites commonly found in high abundances in herbs and spices, conifers and other tree species.
Figure 4. Terpenoids and sterols detectable in GC-MS profiling experiments. MS spectra included in publically available databases.
Molecules 20 03431 g004
The lipophilic phase might preferably be analysed separately prior to GC-MS profiling. However, this step is not always practically feasible, and might result in detection of silylated derivatives of alcoholic mono- and sesquiterpenes, hydroxylated and/or carboxylated di- and triterpenes, and phytosterols including sterols and stanols. Structurally close related is the group of secosteroids including cholecalciferol (vitamin D) and derivatives which are also determined in profiling studies.

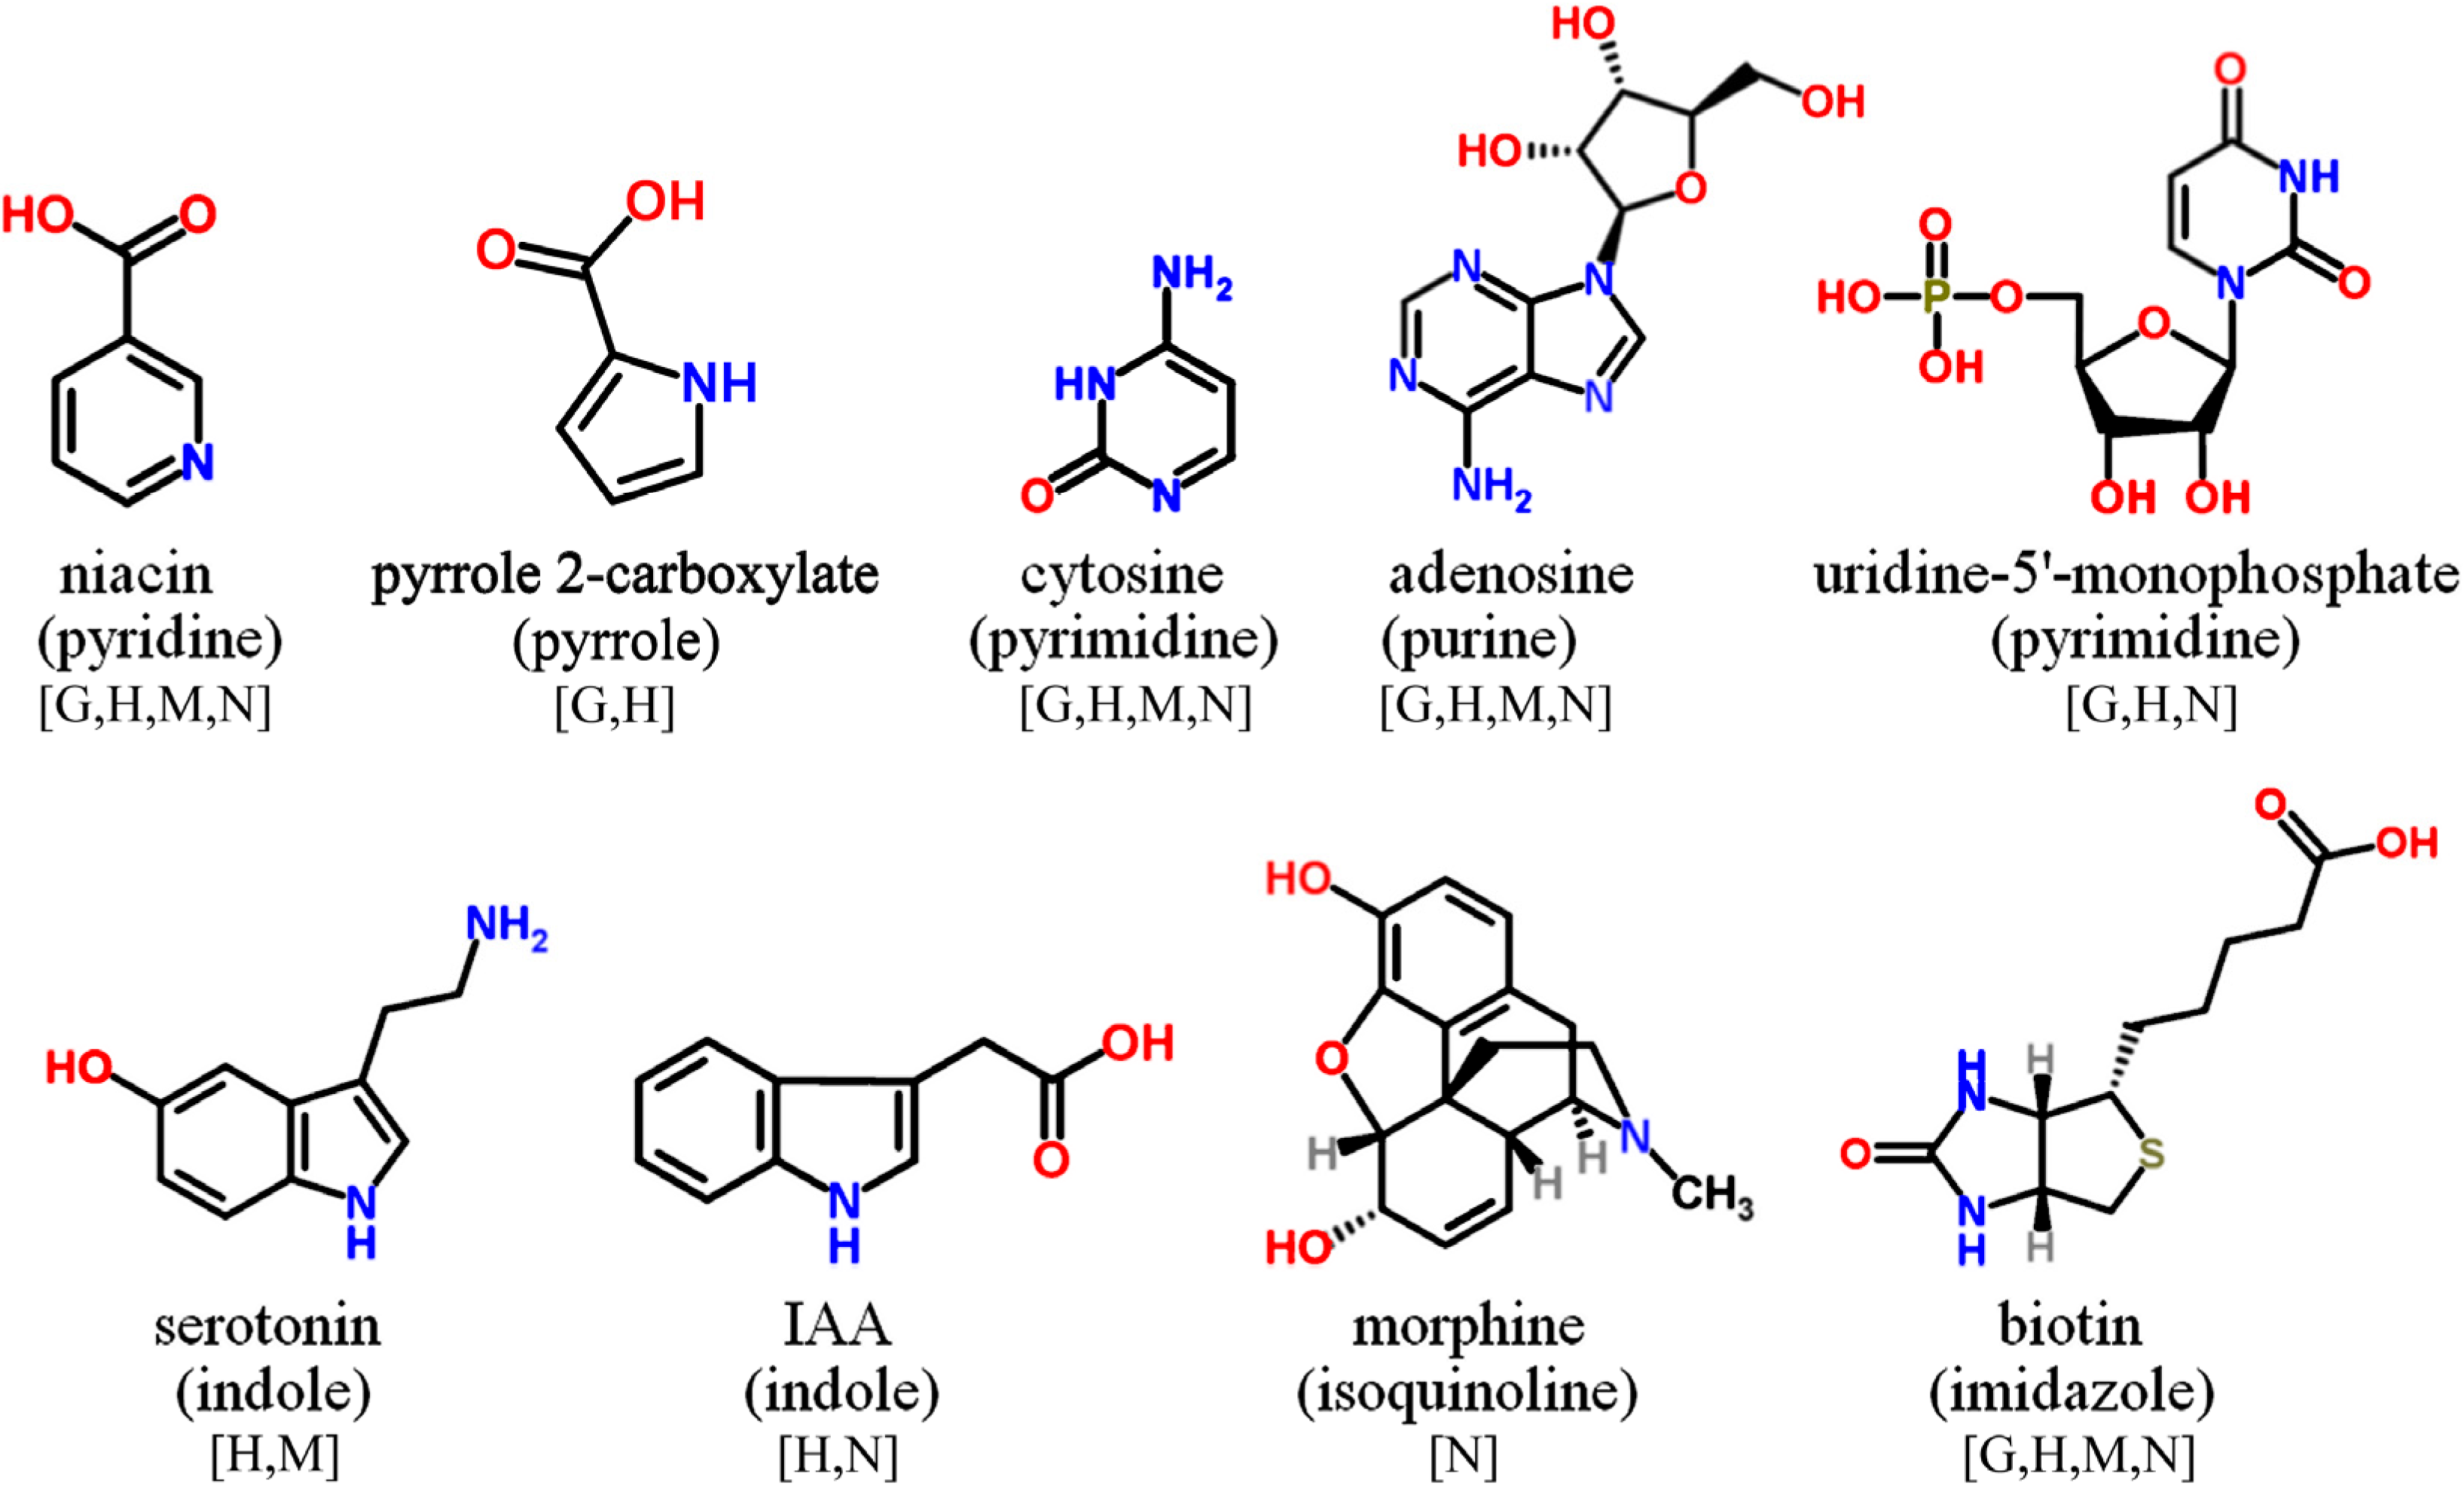
3.4. N-Containing Cyclic Structures

Alkaloids establish a chemically quite diverse group of basic, nitrogenous secondary metabolites, most of which are characterized by heterocyclic structures (Figure 5). Well-known metabolites include stimulant and/or medicinally significant compounds such as nicotine (based on pyrrolidine/pyridine ring structures), caffeine (a purine), morphine (an isoquinoline), serotonin (an indole), and cocaine (a tropane). Apart from alkaloids, tryptophan-derived indoles establish also the basic ring structures of the plant-hormone related auxines (e.g., indole-3-acetic acid) and several amino acids. Also the cytokinins are N-heterocyclic structures with zeatin (a purine) as an important representative compound. Furthermore, most B-vitamins are built up of N-heterocycles comprising detectable structures such as B3 niacin and B6 pyridoxine (both pyridines), B7 biotin (an imidazole), and B9 folic acid (a pteridine). Importantly, nitrogenous bases, their nucleosides and phosphorylated nucleotides, which are essential components of RNA and DNA in all organisms, are readily detected in profiling experiments. Cyclic structures comprise pyrimidines (thymine, uracil and cytosine) and purines (adenine and guanine). The vast diversity of N-containing cyclic metabolites from plants does not allow to present all structural classes here. However, it is noteworthy that only a minor fraction of potentially detectable compounds is included in MS libraries of silylated compounds.
Figure 5. Selected N-containing cyclic compounds detectable in GC-MS profiling experiments. Names of the basic heterocyclic structures are given in brackets. MS spectra included in publically available databases.
Molecules 20 03431 g005

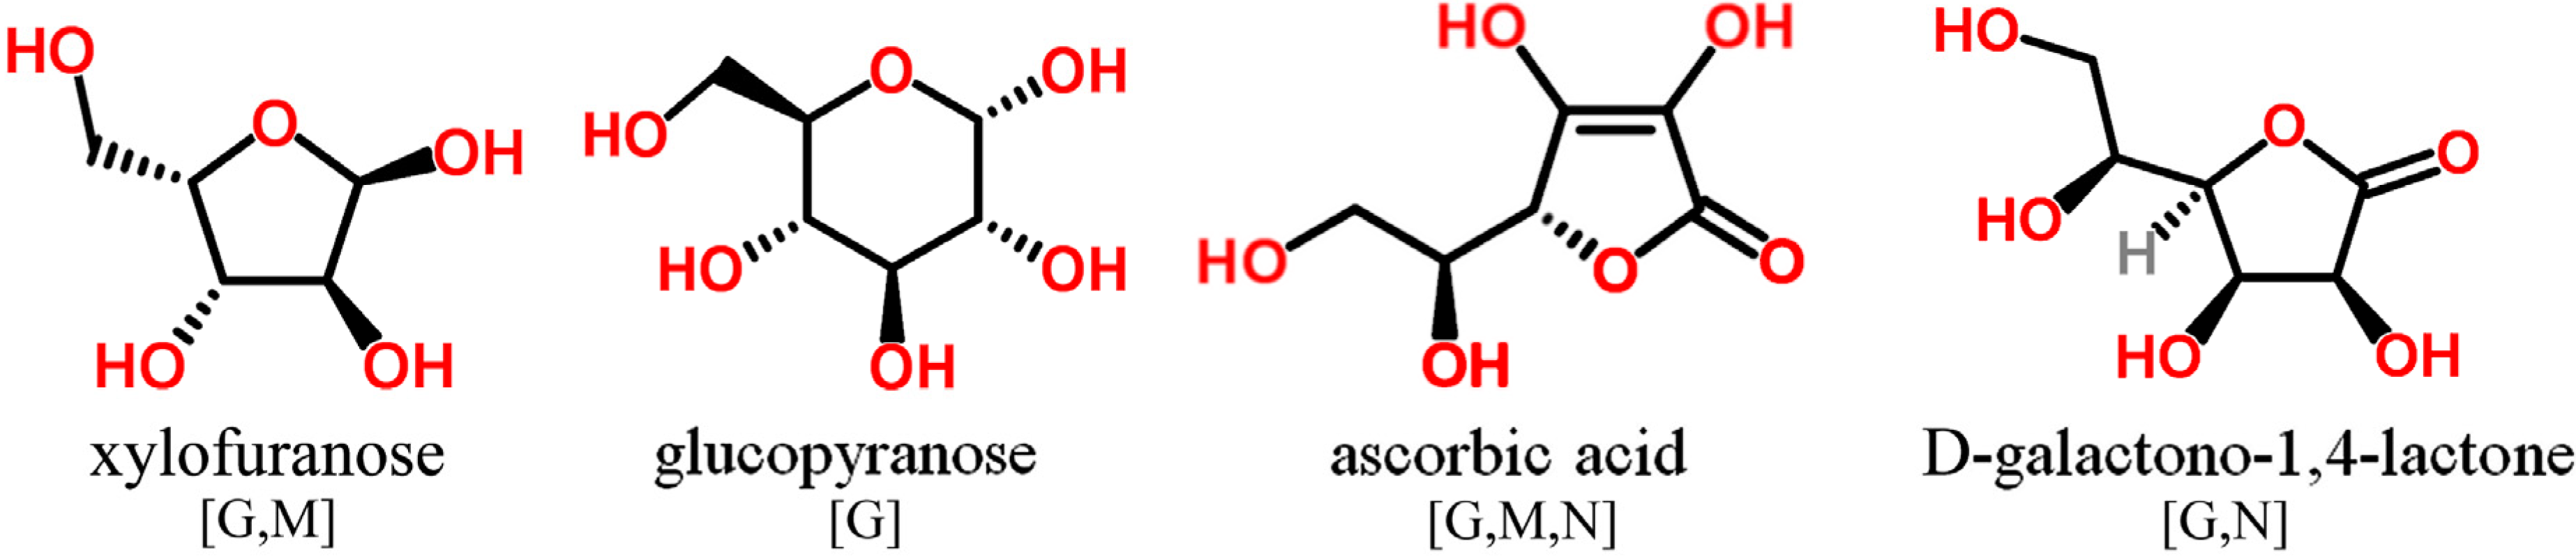
3.5. O-Containing Cyclic Structures

Silylated carbohydrates comprise the largest group of GC-MS detectable oxygen-containing cyclic metabolites. Pentoses and hexoses and oligosaccharides thereof occur in all biological samples showing cyclic structures either as furanoside or pyranoside (Figure 6). Furan structures, in particular lactones derived from sugar acids (e.g., ascorbic acid) but also amino acids are readily determined. This includes the potentially detection of glycosylated compounds such as terpenes, aromatic structures and purines during profiling experiments. Benzopyran structures have already been mentioned in the context of tocopherols (see subsection 3.1).
Figure 6. O-containing cyclic structures detectable in GC-MS profiling experiments. MS spectra included in publically available databases.
Molecules 20 03431 g006

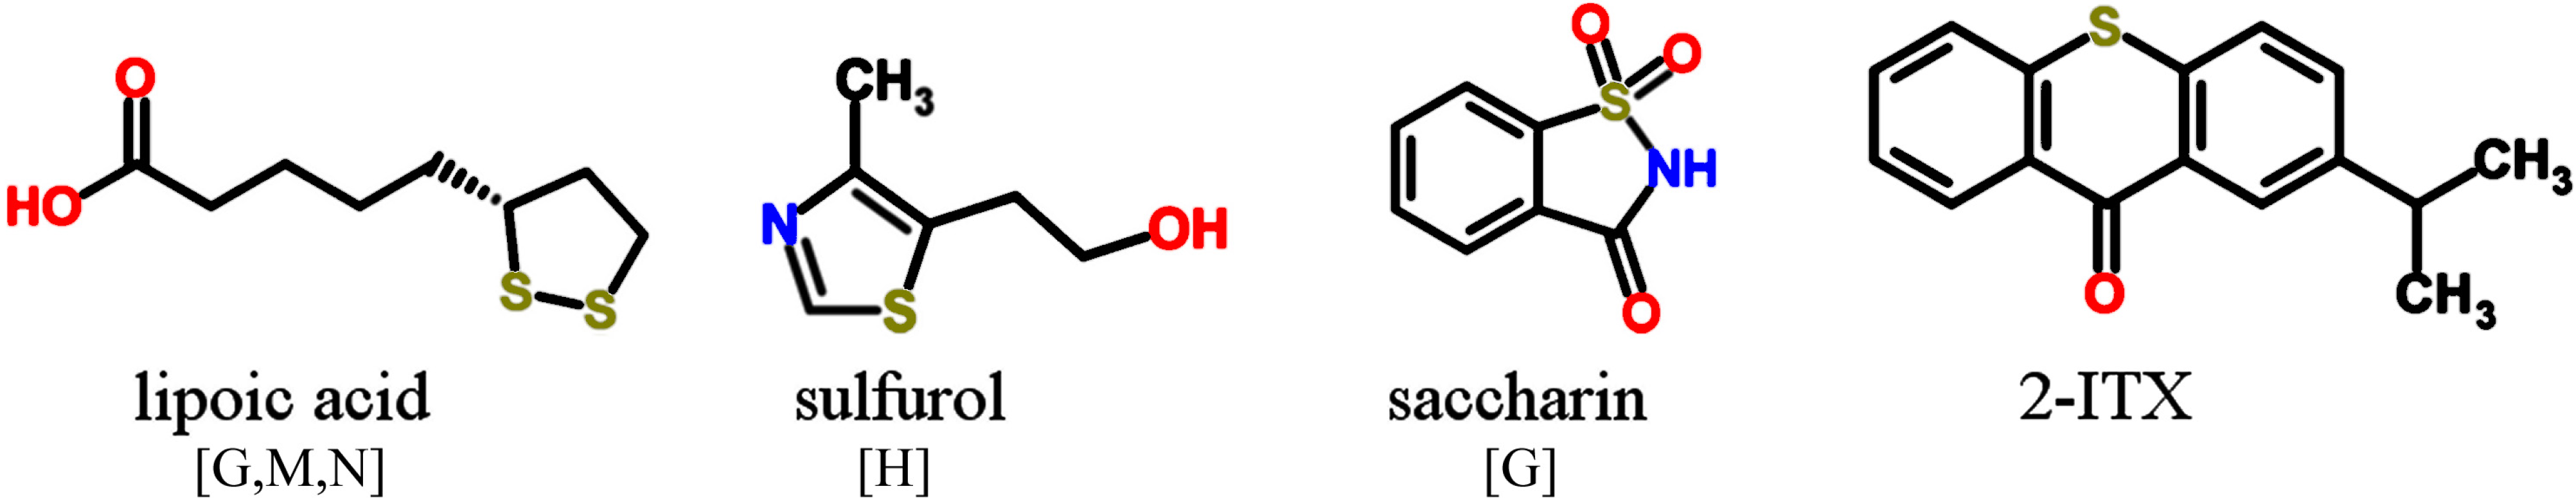
3.6. S-Containing Cyclic Structures

Though nature produces a vast diversity of S-containing metabolites, only few cyclic structures have been included in MS libraries of silylated compounds. Those mentioned here both include natural products but also compounds which are not biosynthesized by organisms (Figure 7). Lipoic acid and its derivatives represent dithiolane structures with characteristic disulfide bonds in a pentacyclic structure. Though normally covalently bound in mitochondrial enzyme complexes, these compounds might potentially be detected in profiling experiments. This is also true for thiazoles, i.e., pentacyclic N- and S-containing structures, heterocyclic compounds such as natural and synthetic benzothiazoles (e.g., the artificial sweetener saccharin), and S-containing polycyclic thioxanthenes used as photoinitiators (e.g., 2-ITX) in paper and packaging materials.
Figure 7. S-containing cyclic structures detectable in GC-MS profiling experiments. MS spectra included in publically available databases.
Molecules 20 03431 g007

4. Case Studies—GC-MS Profiling of Plant Samples

GC-MS is one of the most efficient technology platforms to approach complex mixtures of organic compounds based on a combination of MS database search and the use of calculated RI values. Suitable MS and RI resources have been developed and are well established for the analysis of e.g., essential oil constituents [67,68,69], and investigation of environmental samples using either the comprehensive NIST or Wiley MS libraries or vendor-specific and customized databases. In the case of silylation-based derivatization techniques which cover a broad range of molecular masses and different polarities, the information base regarding phenolic and other cyclic structures, belonging to the complex group of plant secondary metabolites, is rather limited. This is particularly true for higher molecular weight compounds (≥300) as pointed out by Isidorov and Szczepaniak [39]. However, the specificity of molecular structures and thus MS fragmentation patterns in most cases allow for the assignment of distinct compound groups and sub-classes.
In the following Subsection 4.1, Subsection 4.2, Subsection 4.3 and Subsection 4.4, these aspects will be addressed by using examples from the analysis of various plant raw materials and processed plant food to emphasize the applicability of GC-MS profiling for the separation, detection and identification of phenolics and cyclic structures with respect to metabolic phenotyping and quality assessment purposes. Extraction, derivatization and GC-QMS conditions followed procedures for plant samples as described earlier [35,70,71,72].

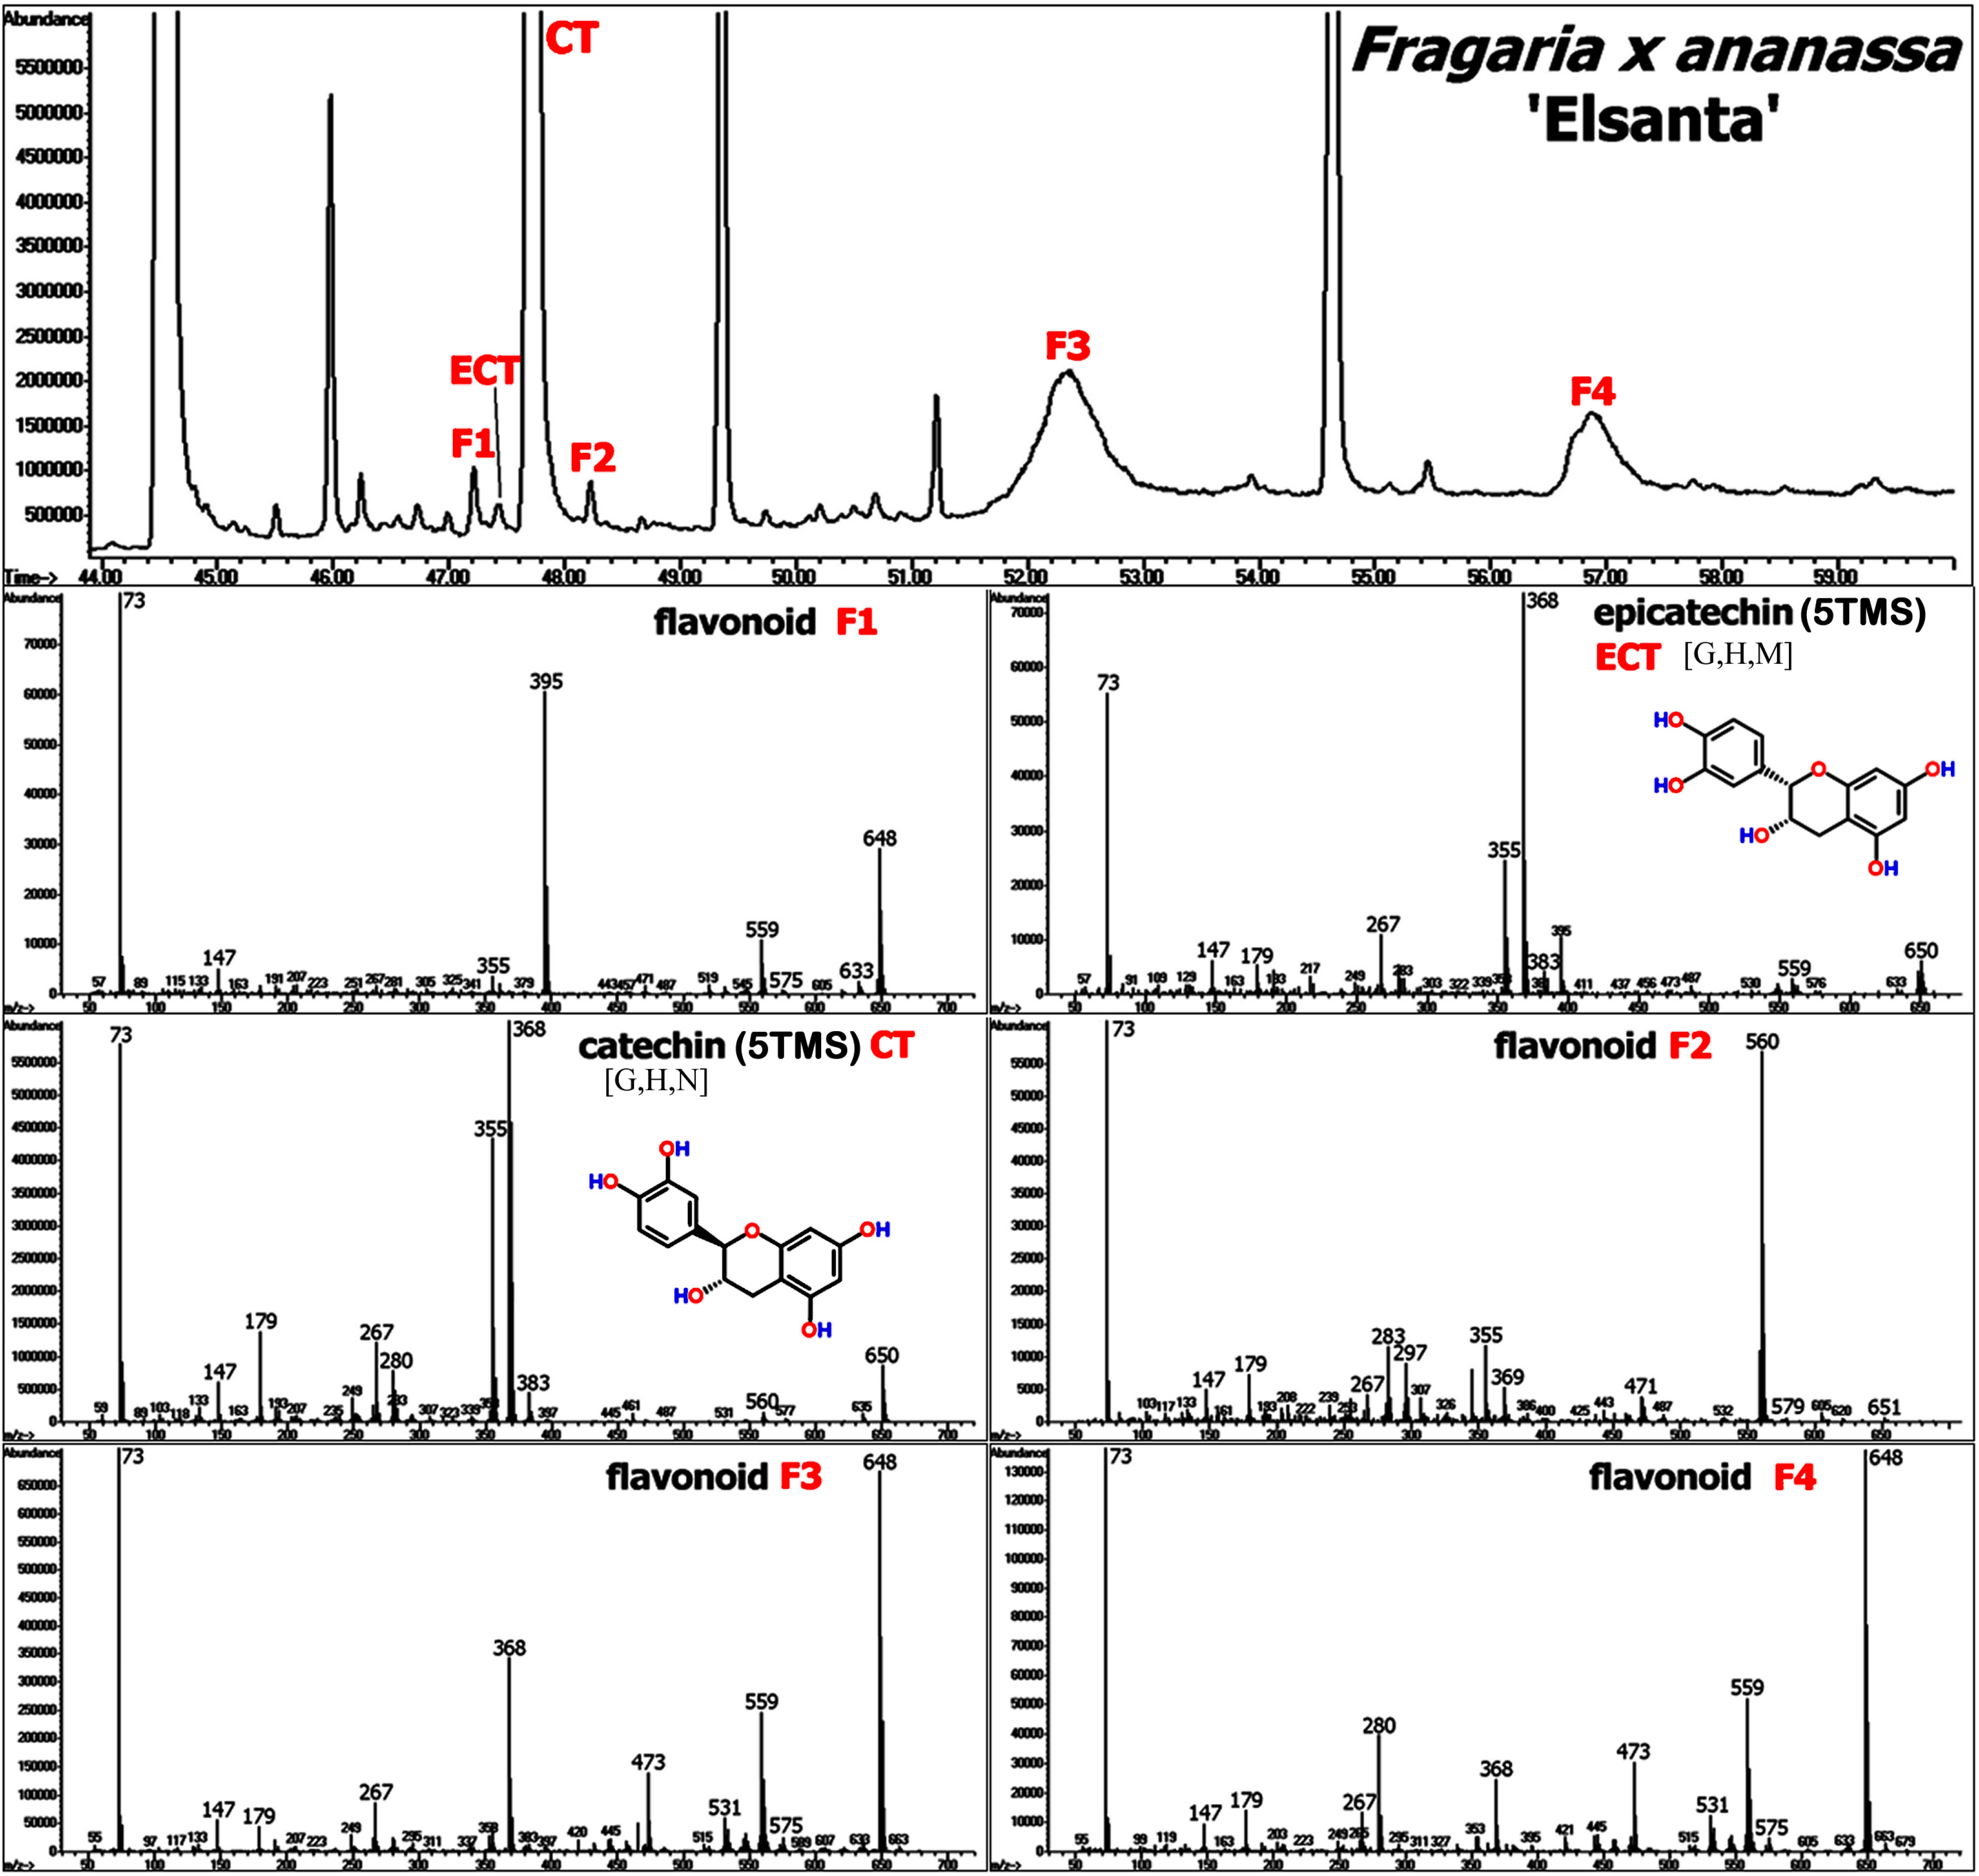
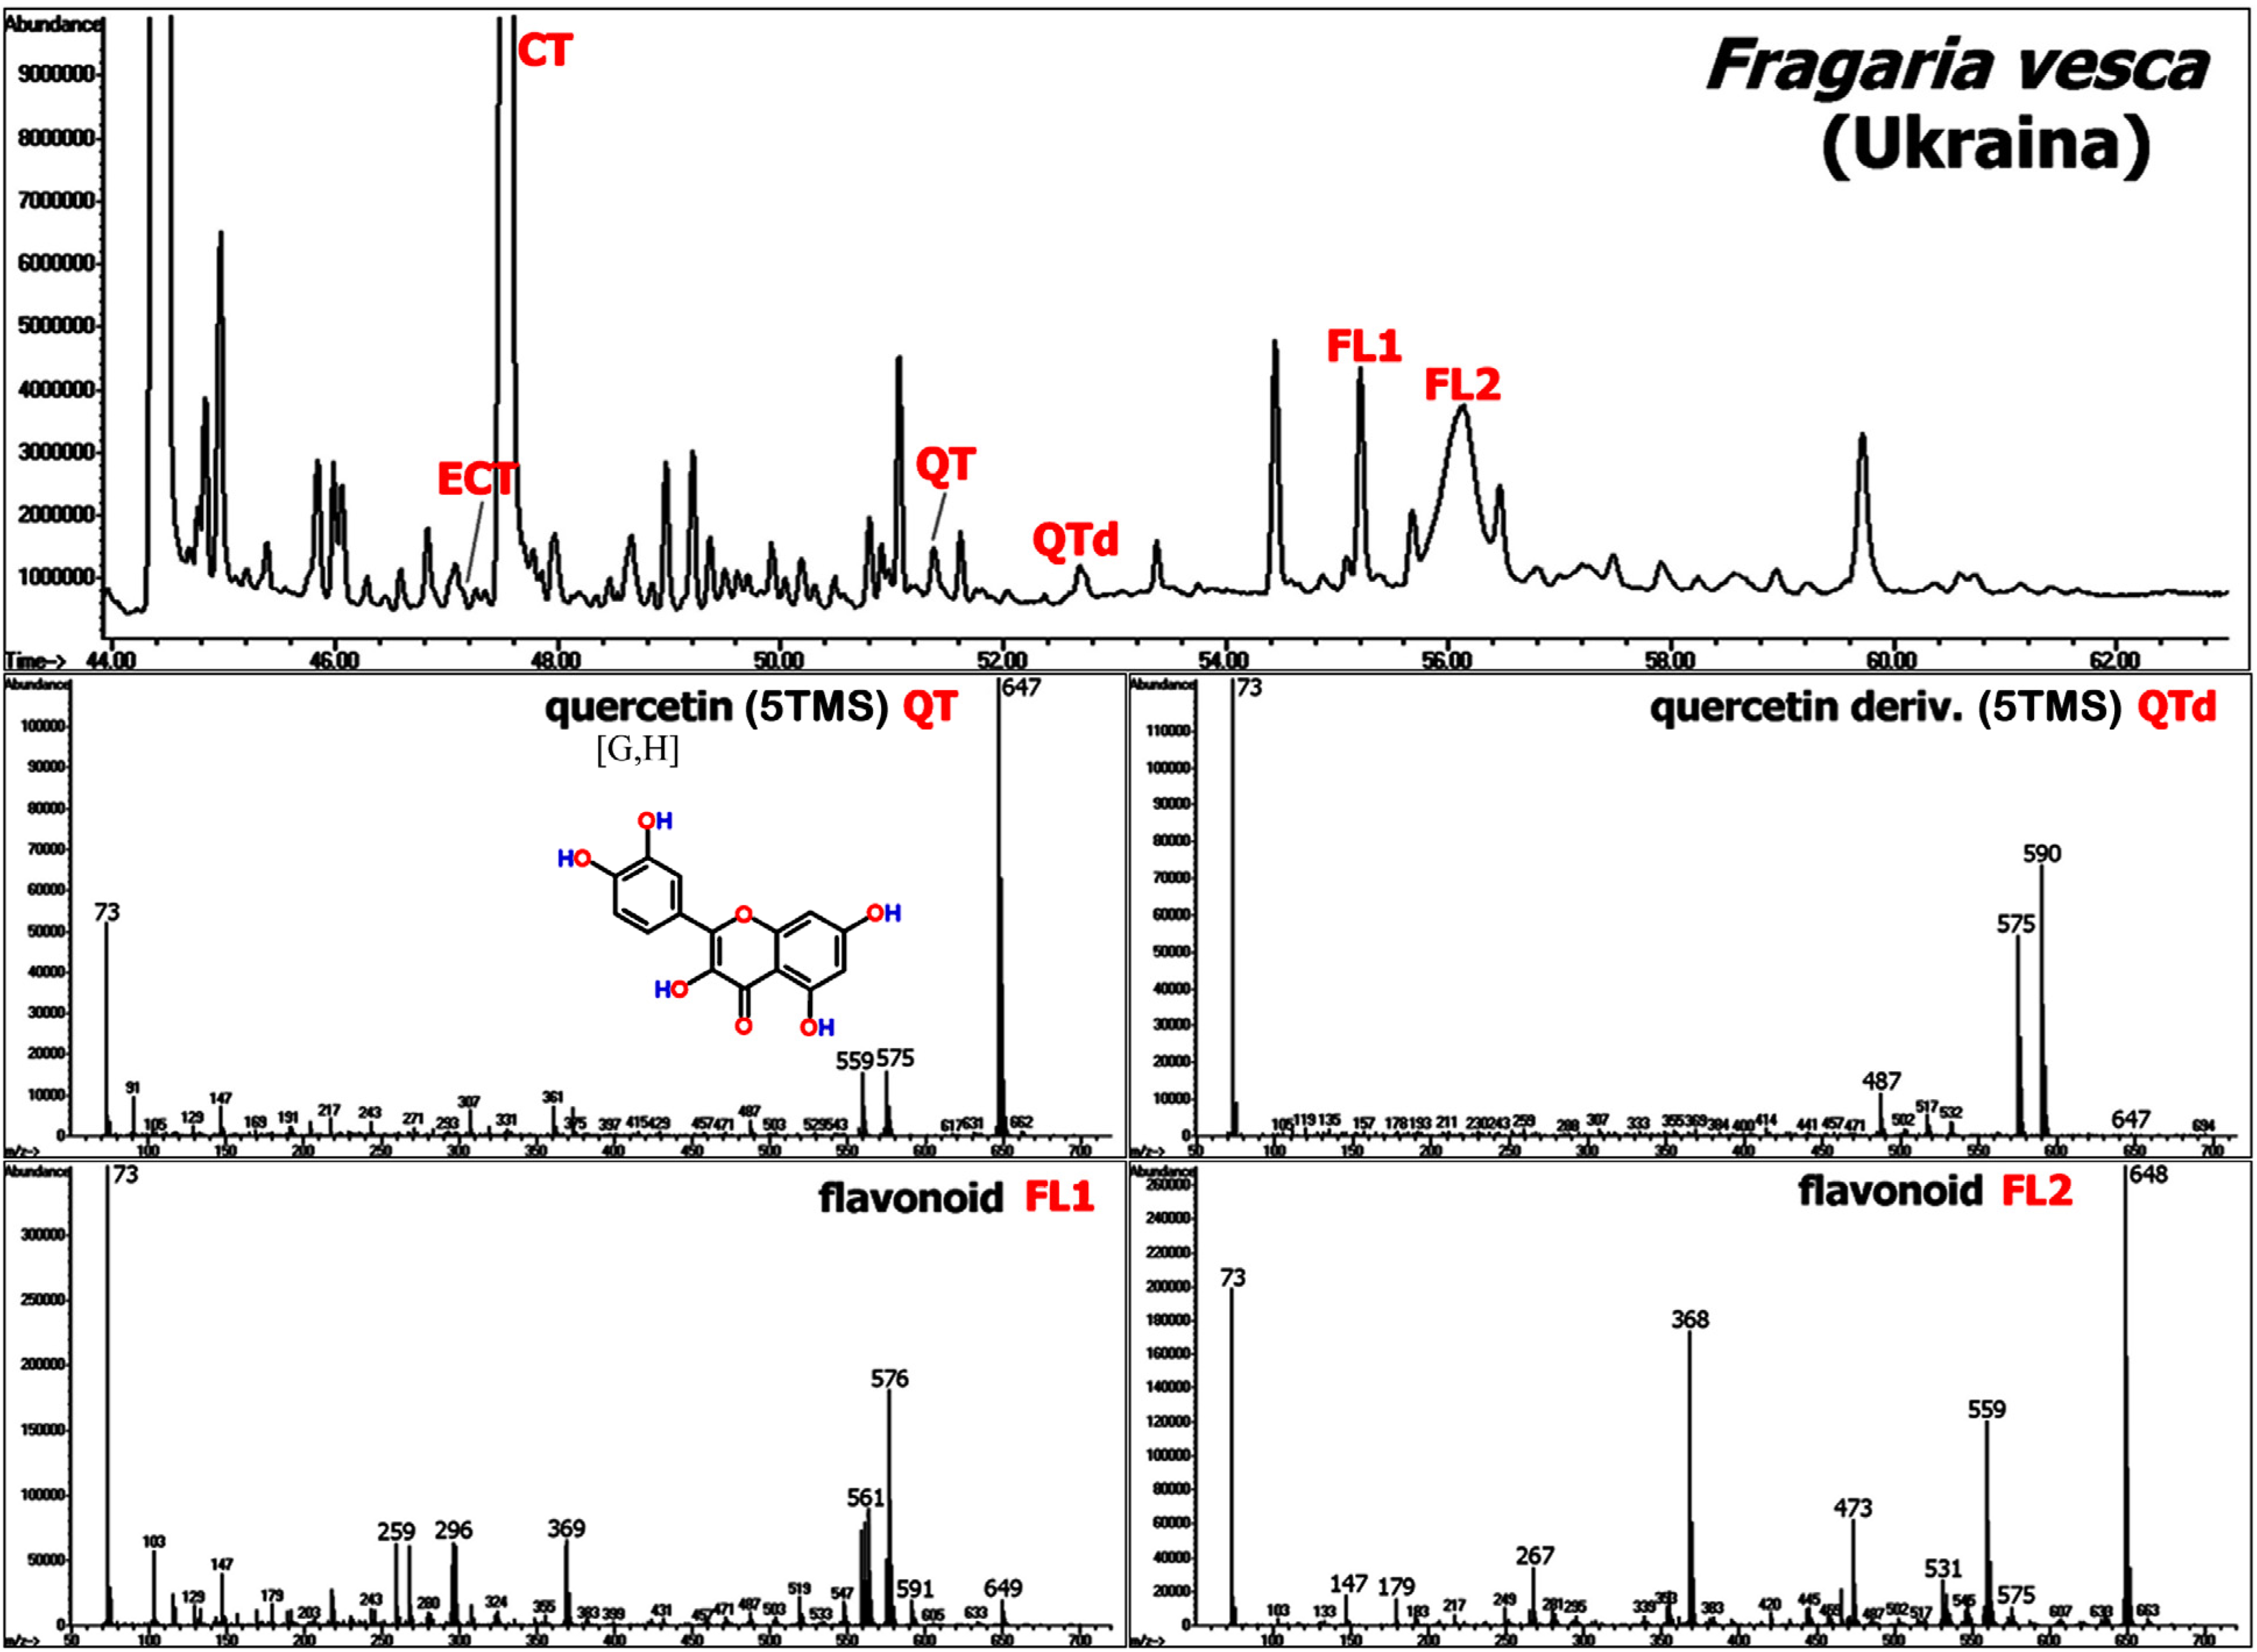
4.1. Fresh Plant Samples: Flavonoids and Derivatives

Flavonoids represent a highly diverse class of polycyclic secondary structures commonly found in the plant kingdom. In addition to their function as pigments for insect attraction, seed dispersal and UV light absorption, flavonoids serve as antioxidants and radical scavengers, in plant signaling and as defense compounds. Chemically, flavonoids are characterized by a C6-C3-C6 flavone skeleton (A-C-B rings) enclosed with oxygen in the 3-carbon bridge (C-ring) between the phenyl groups. The different sub-classes of flavonoid structures include flavones, flavonols, flavanones, flavanols, flavanonols, anthocyanidins, isoflavones, chalcones and neoflavonoids, as reviewed by Tsao and McCallum [73].
Depending on desaturation and oxidation status of the C-ring and moreover, hydroxylation, methoxylation, and/or prenylation patterns of the flavone backbone (for examples refer to Figure 3), EI-based fragmentation is expected to generate quite stable MS fragments with distinct molecular masses, thus providing sufficient identification capability for structure elucidation.
Strawberry (Fragaria × ananassa Duch.) is renown as a marketable fruit due to its pleasant taste and flavour [74], and its high content of health-beneficial polyphenolic compounds [75,76,77]. Also other plant parts of different Fragaria species were shown to contain high levels of phenolic structures as studied in flowers [78], leaves [79,80] and roots [81,82]. Moreover, GC-MS profiling has been recently applied for the characterization of shifts in metabolite pools in leaf and crown tissue of strawberry plants exposed to cold temperatures [70,72,83] in order to identify those compounds uniquely linked to cold acclimation. Published chemical information was related to primary metabolites in the first place, however a large number of secondary structures could be deduced easily based on the available high-resolution MS information from crown [83], and leaf and root samples [72]. Besides cinnamic acid- and benzoic acid-derived structures, vegetative tissue contains reasonable amounts of flavan-3-ols (catechin derivatives) and flavonols as presented in Figure 8 and Figure 9.
Figure 8. The upper figure shows a chromatogram cut from the analysis of a strawberry crown sample (vegetative tissue) of Fragaria x ananassa Duch. cv. “Elsanta”. The MS spectra of commonly found TMS derivatives of polyphenolic structures such as catechin (5TMS) (CT), epicatechin (5TMS) (ECT) and unidentified flavonoid structures (F1 to F4) are depicted in the figures below. MS spectra of CT and ECT can be found in the Golm Metabolome Database [G], Human Metabolome Database [H], MassBank [M], and/or NIST Chemistry WebBook [N].
Molecules 20 03431 g008
Figure 9. The upper figure shows a chromatogram (TIC), cut from the analysis of a strawberry leaf sample (Fragaria vesca L., genotype “Ukraina”). Several MS spectra of TMS derivatives of flavonoids such as quercetin (5TMS) (QT), quercetin derivative (5TMS) (QTd), and other flavonoid structures (FL1 and FL2) are depicted below. CT = catechin (5TMS) and ECT = epicatechin (5TMS). MS spectra of CT, ECT and QT can be found in the Golm Metabolome Database [G], Human Metabolome Database [H], MassBank [M], and/or NIST Chemistry WebBook [N] (see also Figure 8).
Molecules 20 03431 g009

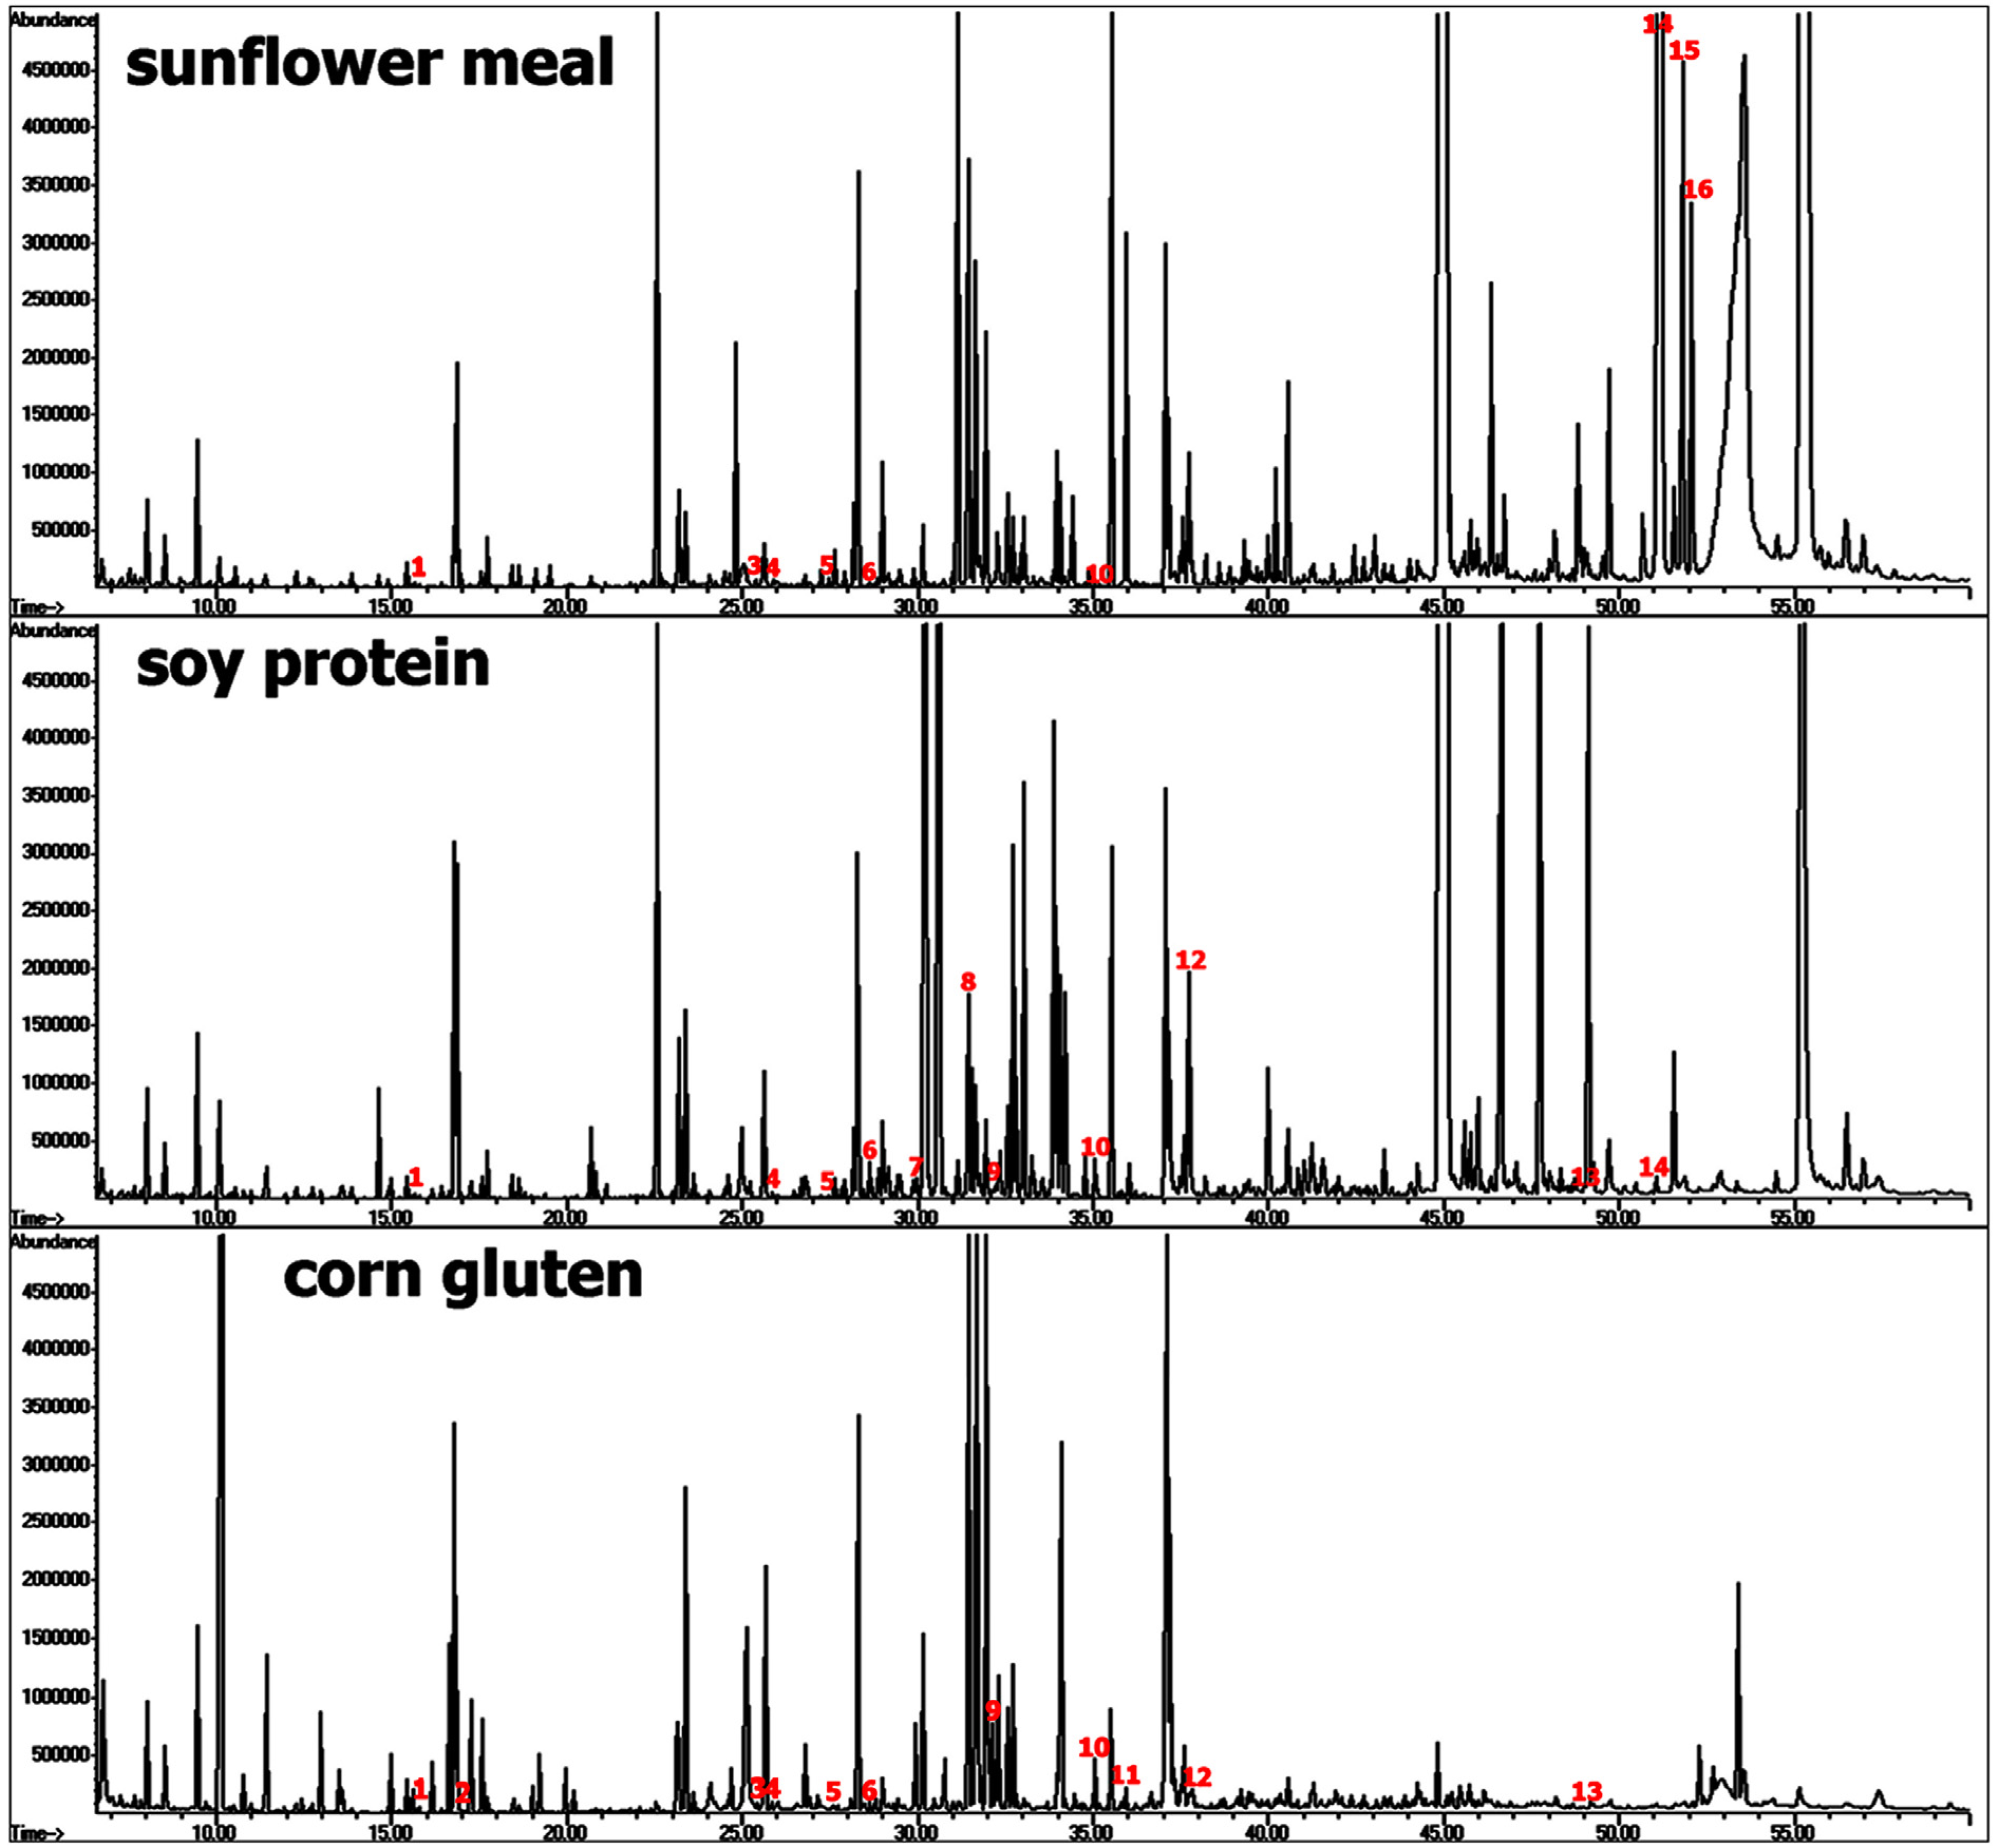
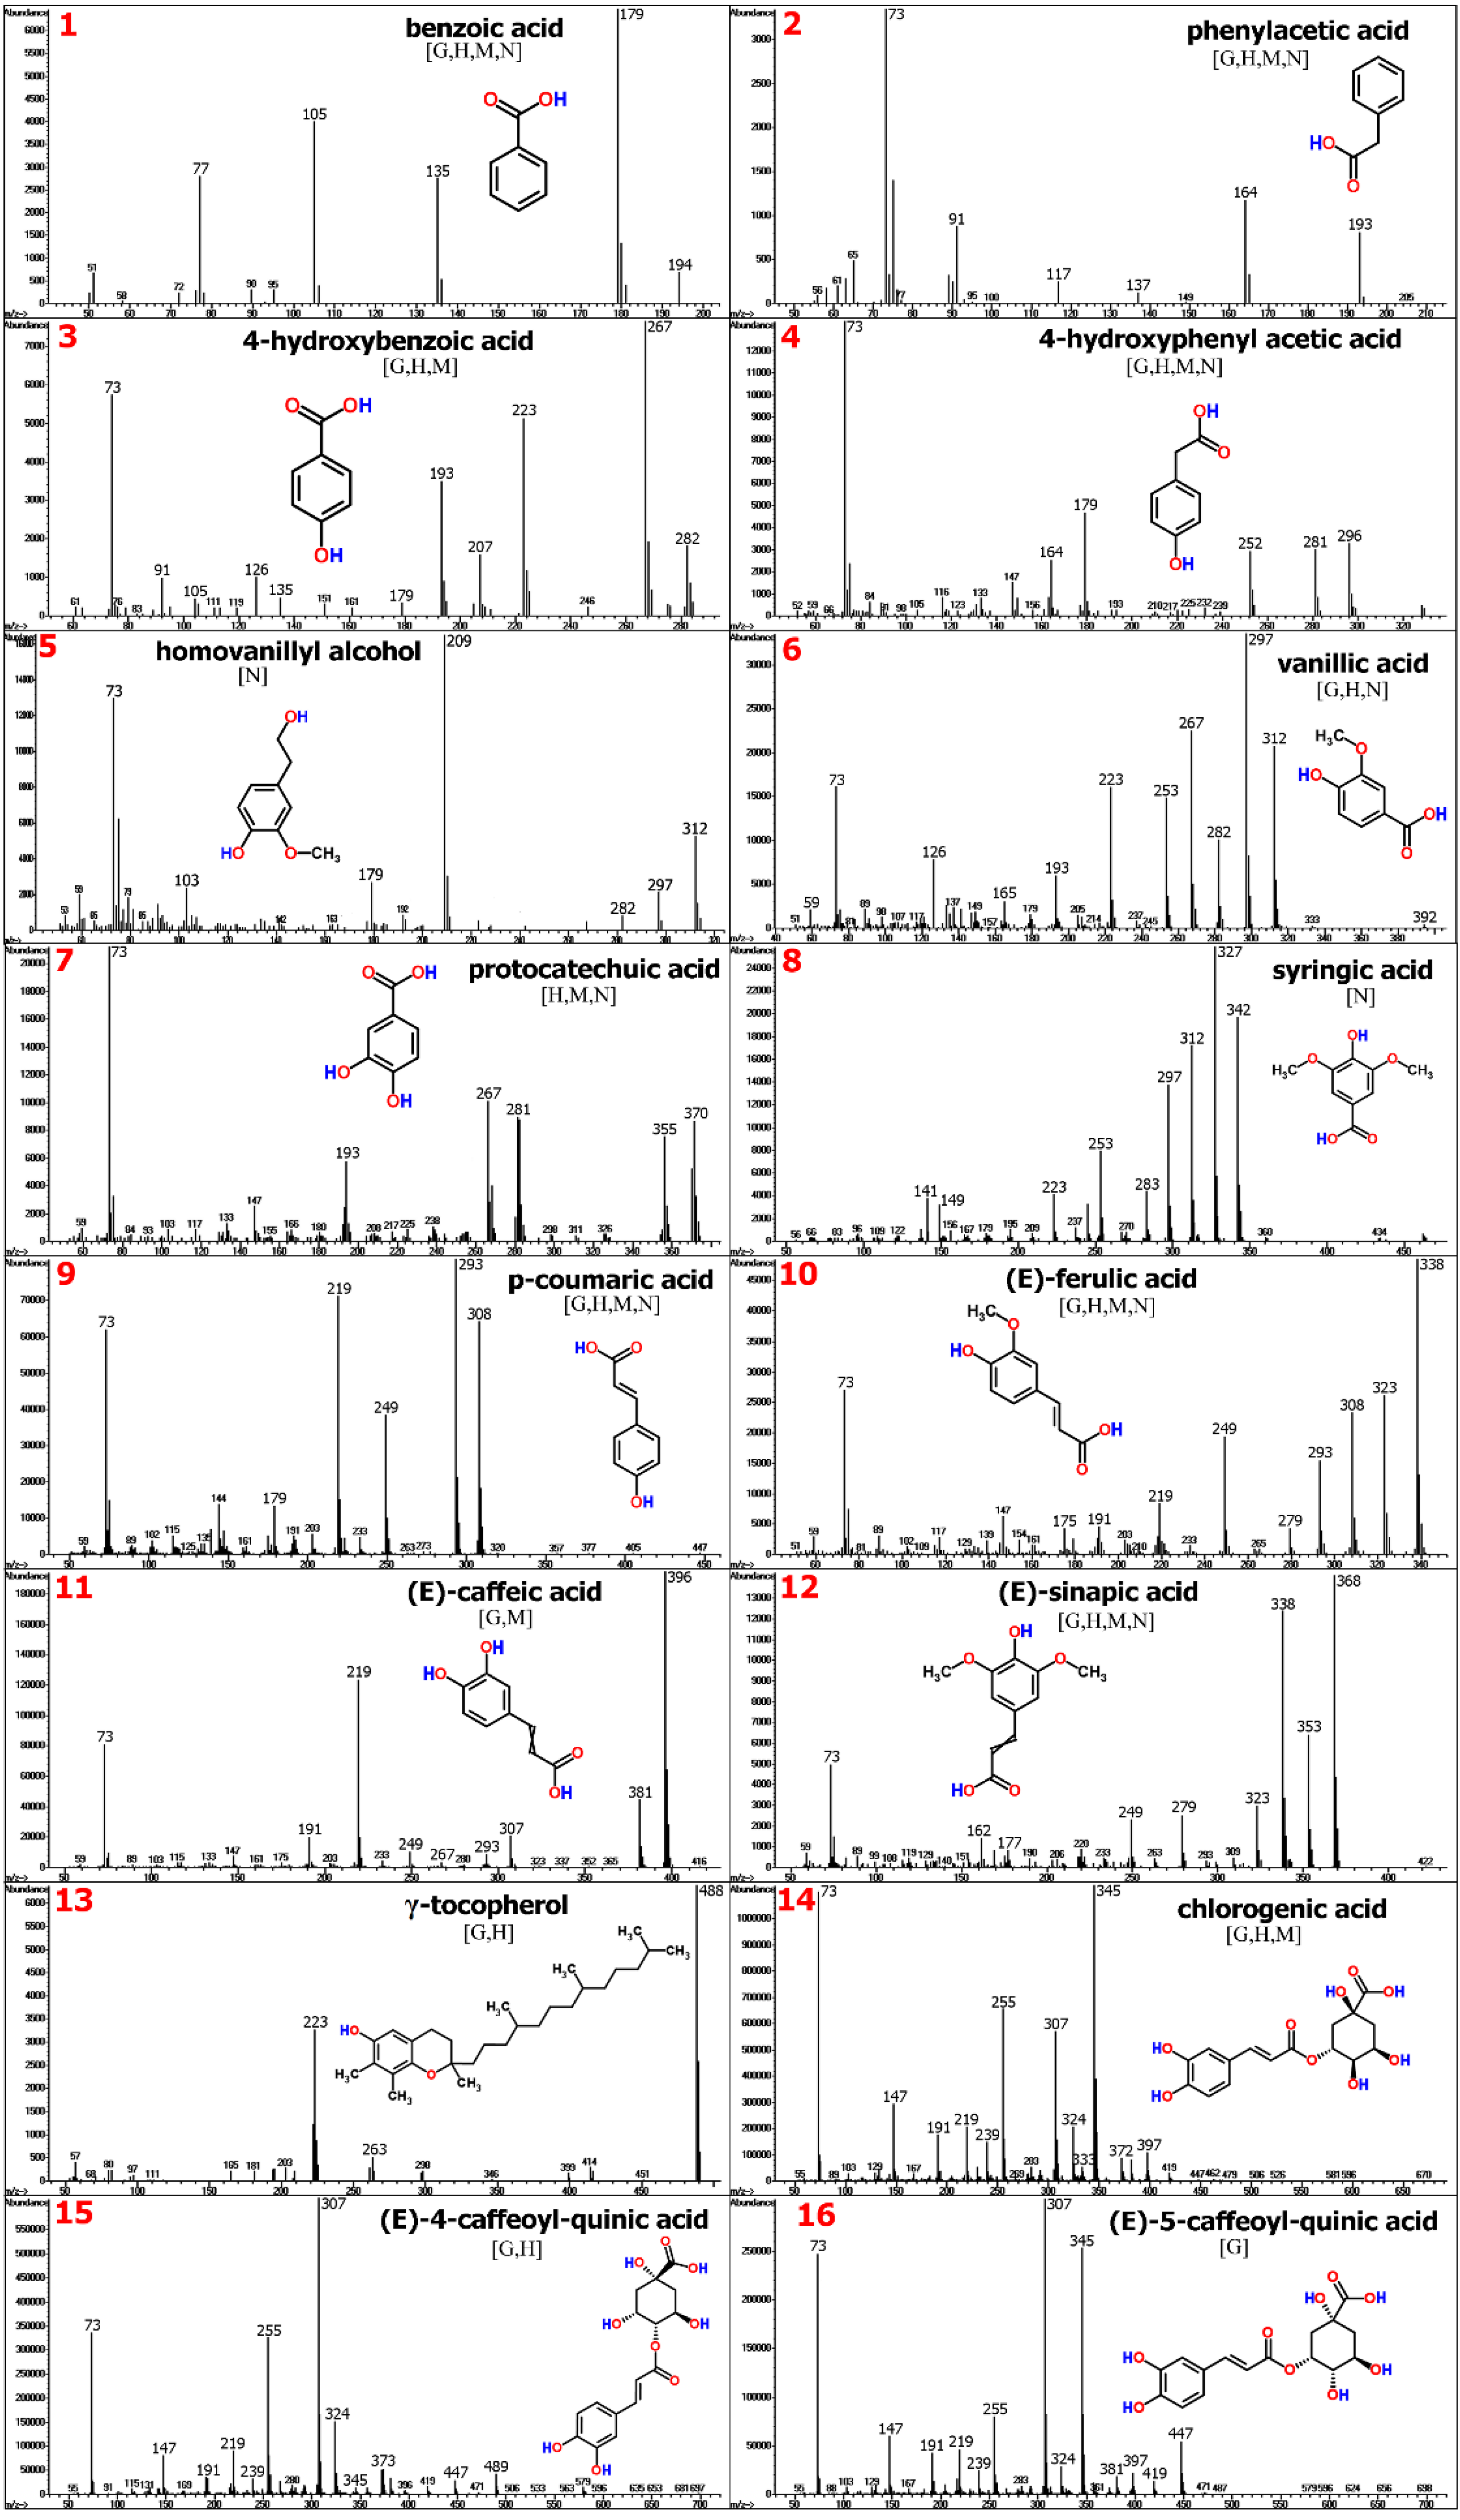
4.2. Plant-Based Aquafeeds: Phenolic Acids

Fish feeds are formulated from marine (fish meal and oil), animal (e.g., blood meal and poultry by- products), and plant (e.g., starchy grains, protein meals, and oils) feedstuffs, and additional amino acid and micronutrient supplements. Due to limited resources of fishmeal and fish oil and the over-exploitation of wild fish stocks, plant feedstuffs derived from seeds are considered more sustainable, cost efficient and highly valuable as protein ingredients in aquafeeds. On the other hand, seeds contain well-characterized and supposedly unknown phytochemicals (secondary metabolites), which might impair appetite, nutrient utilization, physiology, fish health and growth [84], particularly in carnivorous fishes.
Therefore, these substances are also termed as antinutritional factors (ANF) because of their non-nutrient function [85]. In a recent study, GC-MS-based metabolite profiling was applied in order to gain detailed chemical information about plant derived feedstuffs with regard to nutritious small molecules (carbohydrates, lipids, amino acids and amines) and simultaneously potential ANFs [35], comprising compounds from diverse structure groups such as phenolics, alkaloids, terpenes, and glycosides. Protein-rich seeds from the legume plant family (e.g., soybean and pea) or refined plant ingredients derived from industrial processes after vegetable oil or starch extraction (e.g., sunflower, rapeseed and corn) represent good sources of plant proteins (Figure 10).
Figure 10. GC-MS-based metabolite profiling for the detection of phenolics and polycyclic structures in plant-derived aquafeed ingredients (sunflower meal, soy protein and corn gluten).
Molecules 20 03431 g010
Despite industrial refinement and concentration steps, plant ingredients such as sunflower meal, soy protein concentrate and corn gluten might still contain reasonable amounts of free and bound phenolic ANFs due to interactions with polysaccharides and/or proteins [86], showing a broad spectrum of compounds derived from benzoic acid, cinnamic acid and phenyl ethanol (Figure 11). Relatively high levels of vanillic acid (20–100 mg/kg), syringic acid (40–150 mg/kg), (E)-ferulic acid (20–60 mg/kg) and sinapic acid (20–60 mg/kg) were found in soybean meal and thus, underscore the potential ANF content related to non-flavonoid phenolics ranging between 660 to 2000 mg/kg in dehulled beans [87]. In comparison, sunflower seeds are known to contain relatively high levels of mono- and diacylquinic acids [88], which might negatively affect taste and nutrient uptake in humans [89].
Figure 11. The MS spectra of corresponding monocyclic/polycyclic TMS metabolites (see Figure 10) indicated by nos. 1 to 16, are depicted in the figures above. MS spectra can be found in the Golm Metabolome Database [G], Human Metabolome Database [H], MassBank [M], and/or NIST Chemistry WebBook [N].
Molecules 20 03431 g011
Levels of different caffeoylquinic acid structures including chlorogenic acid in sunflower meal (Figure 11) ranged between 600 to 2200 mg/kg and compared well with reported estimates in literature e.g., [90,91].

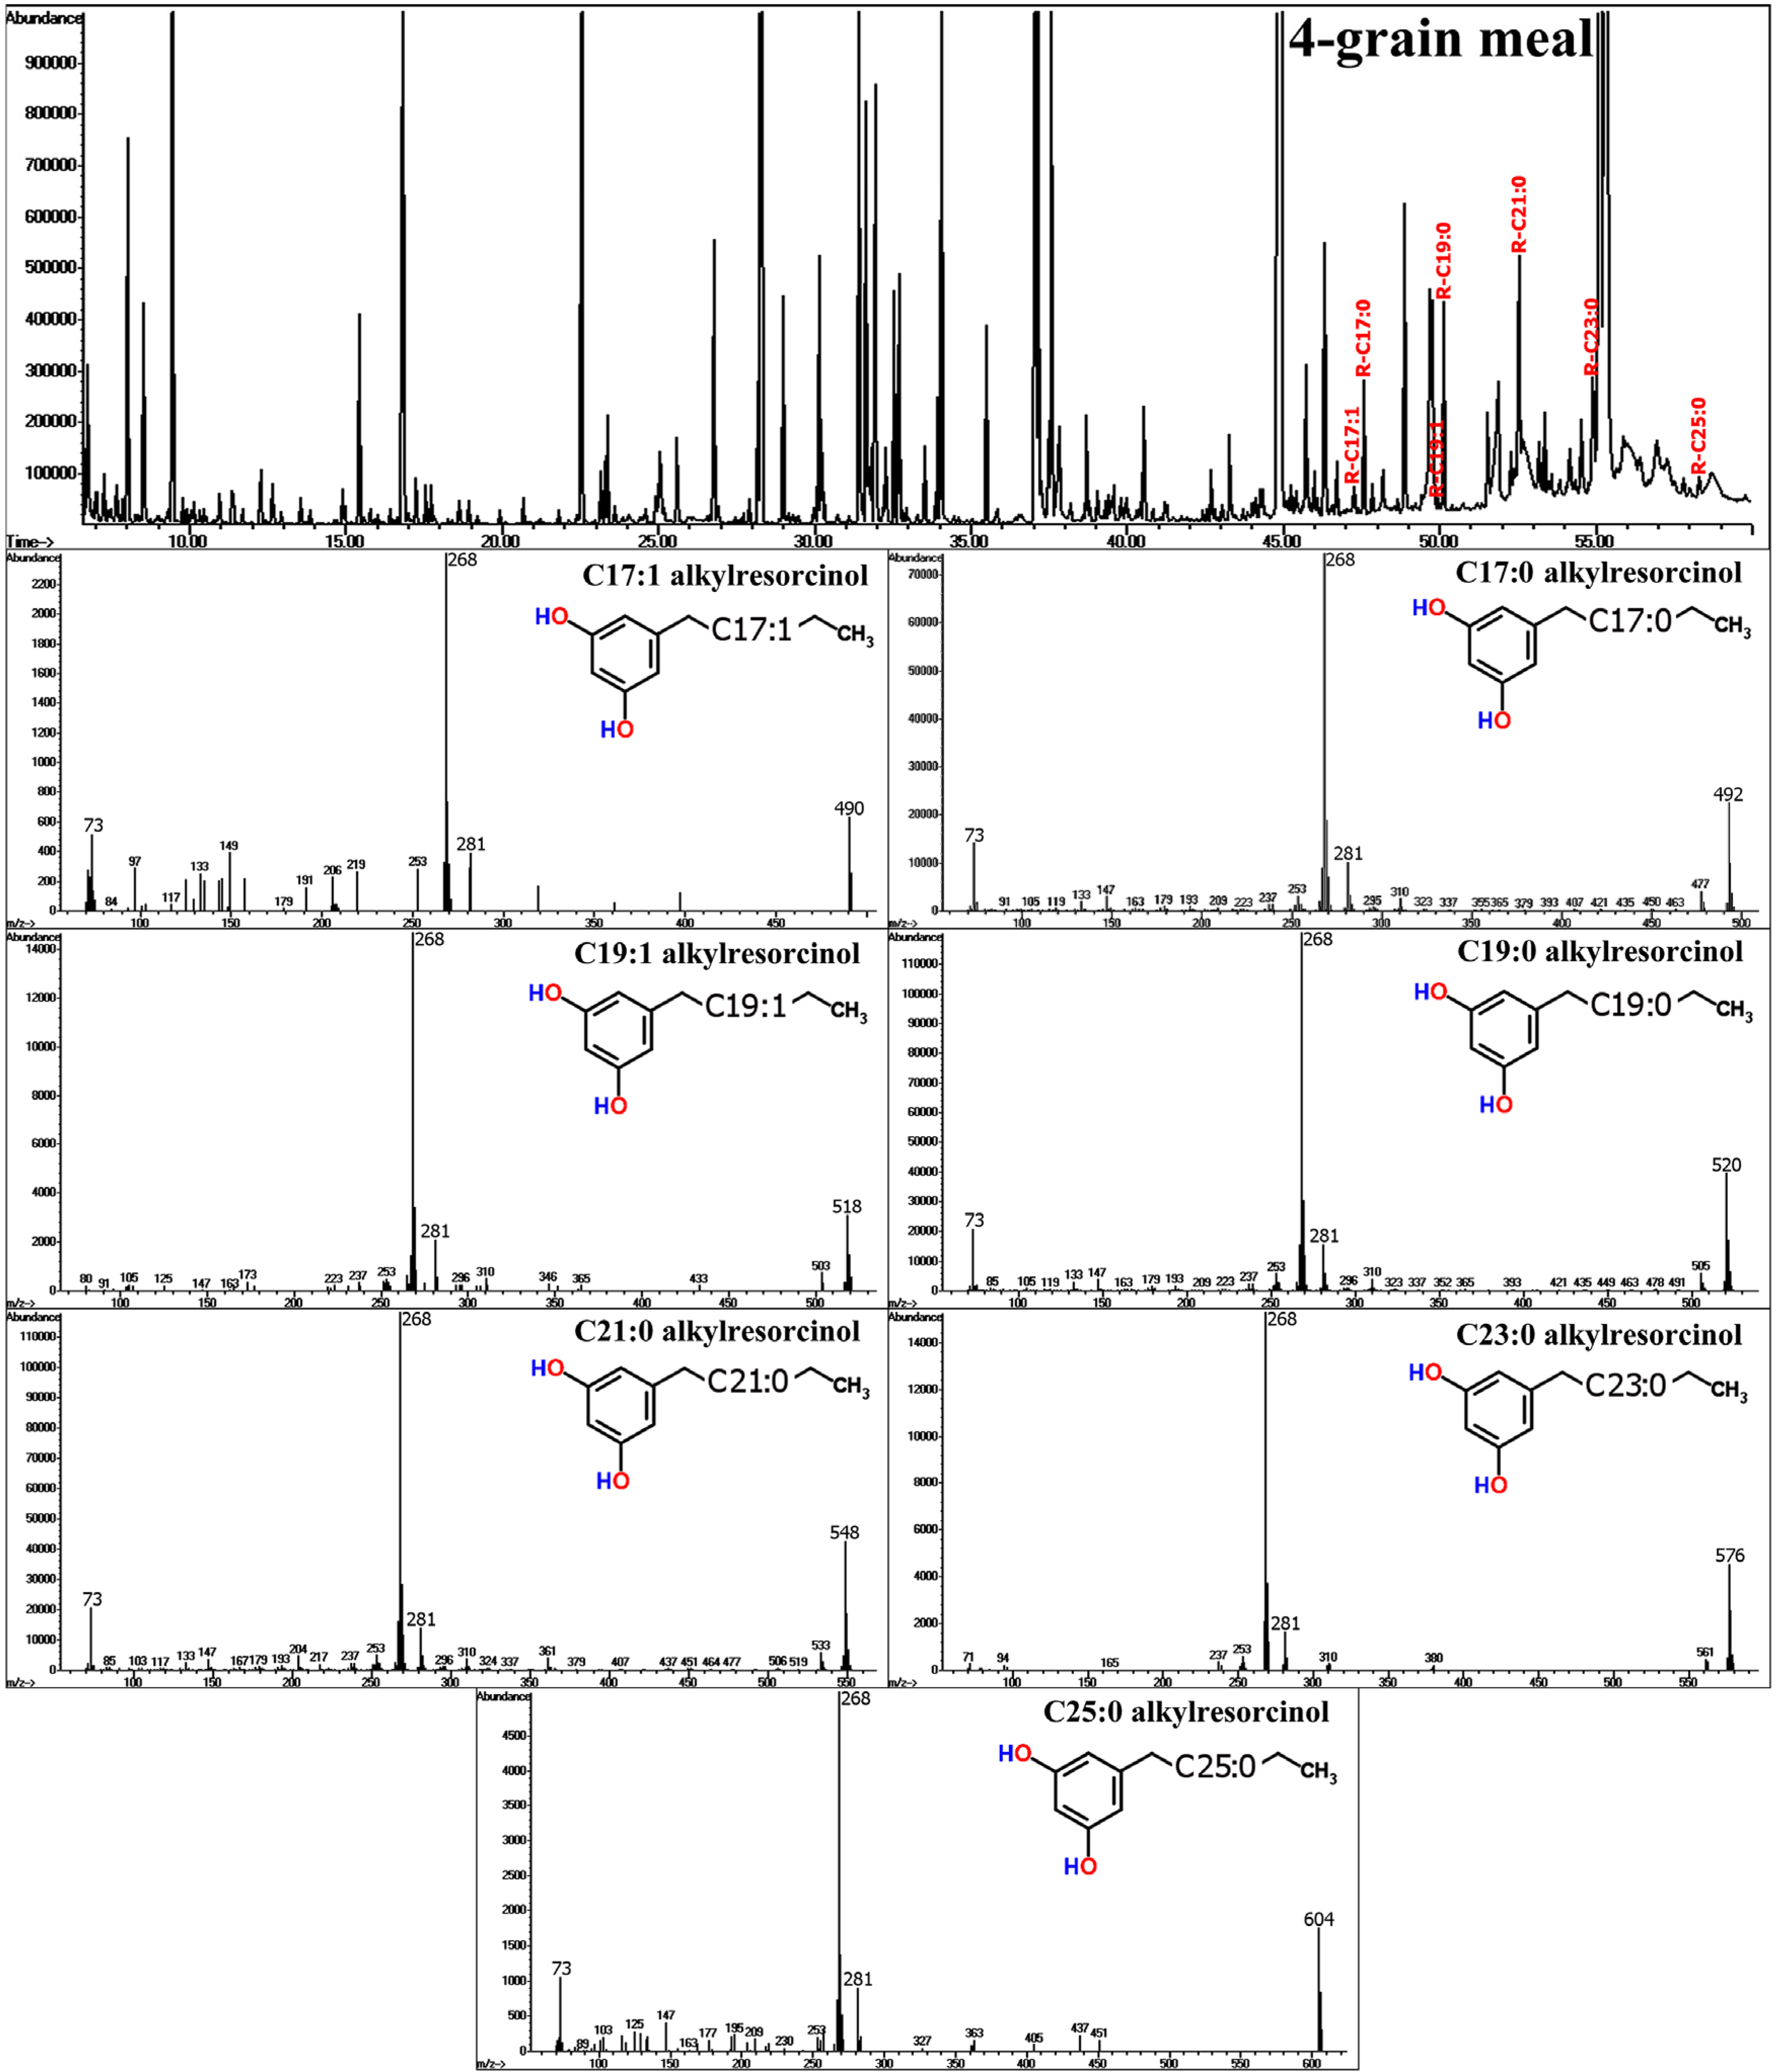
4.3. Cereals: Alkyresorcinols

Cereal grains (wheat, rye, barley and oat) constitute one of the major sources of staple foods for human consumption worldwide due to their nutritious content of carbohydrates, proteins and lipids, also including minerals, vitamins and dietary fibre.
Figure 12. In the GC-MS chromatogram of four-grain meal, commonly occurring alkylresorcinols are indicated. The corresponding MS spectra of C17- to C25- alkylresorcinols are depicted below.
Molecules 20 03431 g012
Moreover, recent epidemiological studies have shown that intake of whole grain products is positively linked to prevention of metabolic syndrome, obesity, cardiovascular disease and type 2 diabetes [92]. Despite relatively high concentrations of phenolic antioxidants in fruits and berries, the impact of levels of phenolic compounds in grain products and cereals on human health is underestimated. In other words, based on Western food traditions the intake of health-beneficial plant phenolics is not necessarily and primarily based on the consumption of fruits and vegetables. Cereal products contain relatively high levels of benzoic acid and cinnamic acid derivatives [93], either free or in bound form esterified with cell wall components. Based on data from the multinational HEALTHGRAIN study, wheat, rye and oat grain show comparable levels of phenolics, while concentration levels in barley are somewhat lower [94].
The so-called alkylresorcinols (AR) establish a characteristic sub-class of phenolic compounds found in cereals. ARs are based on a 1,3-dihydroxy-5-alkylbenzene structure being linked with an odd-numbered alkyl or alkenyl chain (C17:0 to C25:0) [95,96,97], and have been suggested to be used as biomarkers for the estimation of whole grain consumption in humans [98]. Due to their unique chemical structure, ARs show distinct EI-MS fragmentation patterns generating a base peak of m/z = 268 and a molecular ion (M+) peak, depending on the length and degree of saturation of the side chain (Figure 12). These molecular features facilitate the straight-forward detection and identification also in comprehensive GC-MS metabolite profiles. Detected levels of ARs in industrially-processed grain and bakery products were clearly depending on coarseness and declined with the degree of refinement. AR levels in bread ranged from 10 to 300 mg/kg dry weight (DW) and 200 to 300 mg/kg DW in wholemeal bread, while levels in low-processed four-grain meals were estimated at 500 to 650 mg/kg DW, thus corresponding well with results from other studies [46,91,95,96,97].

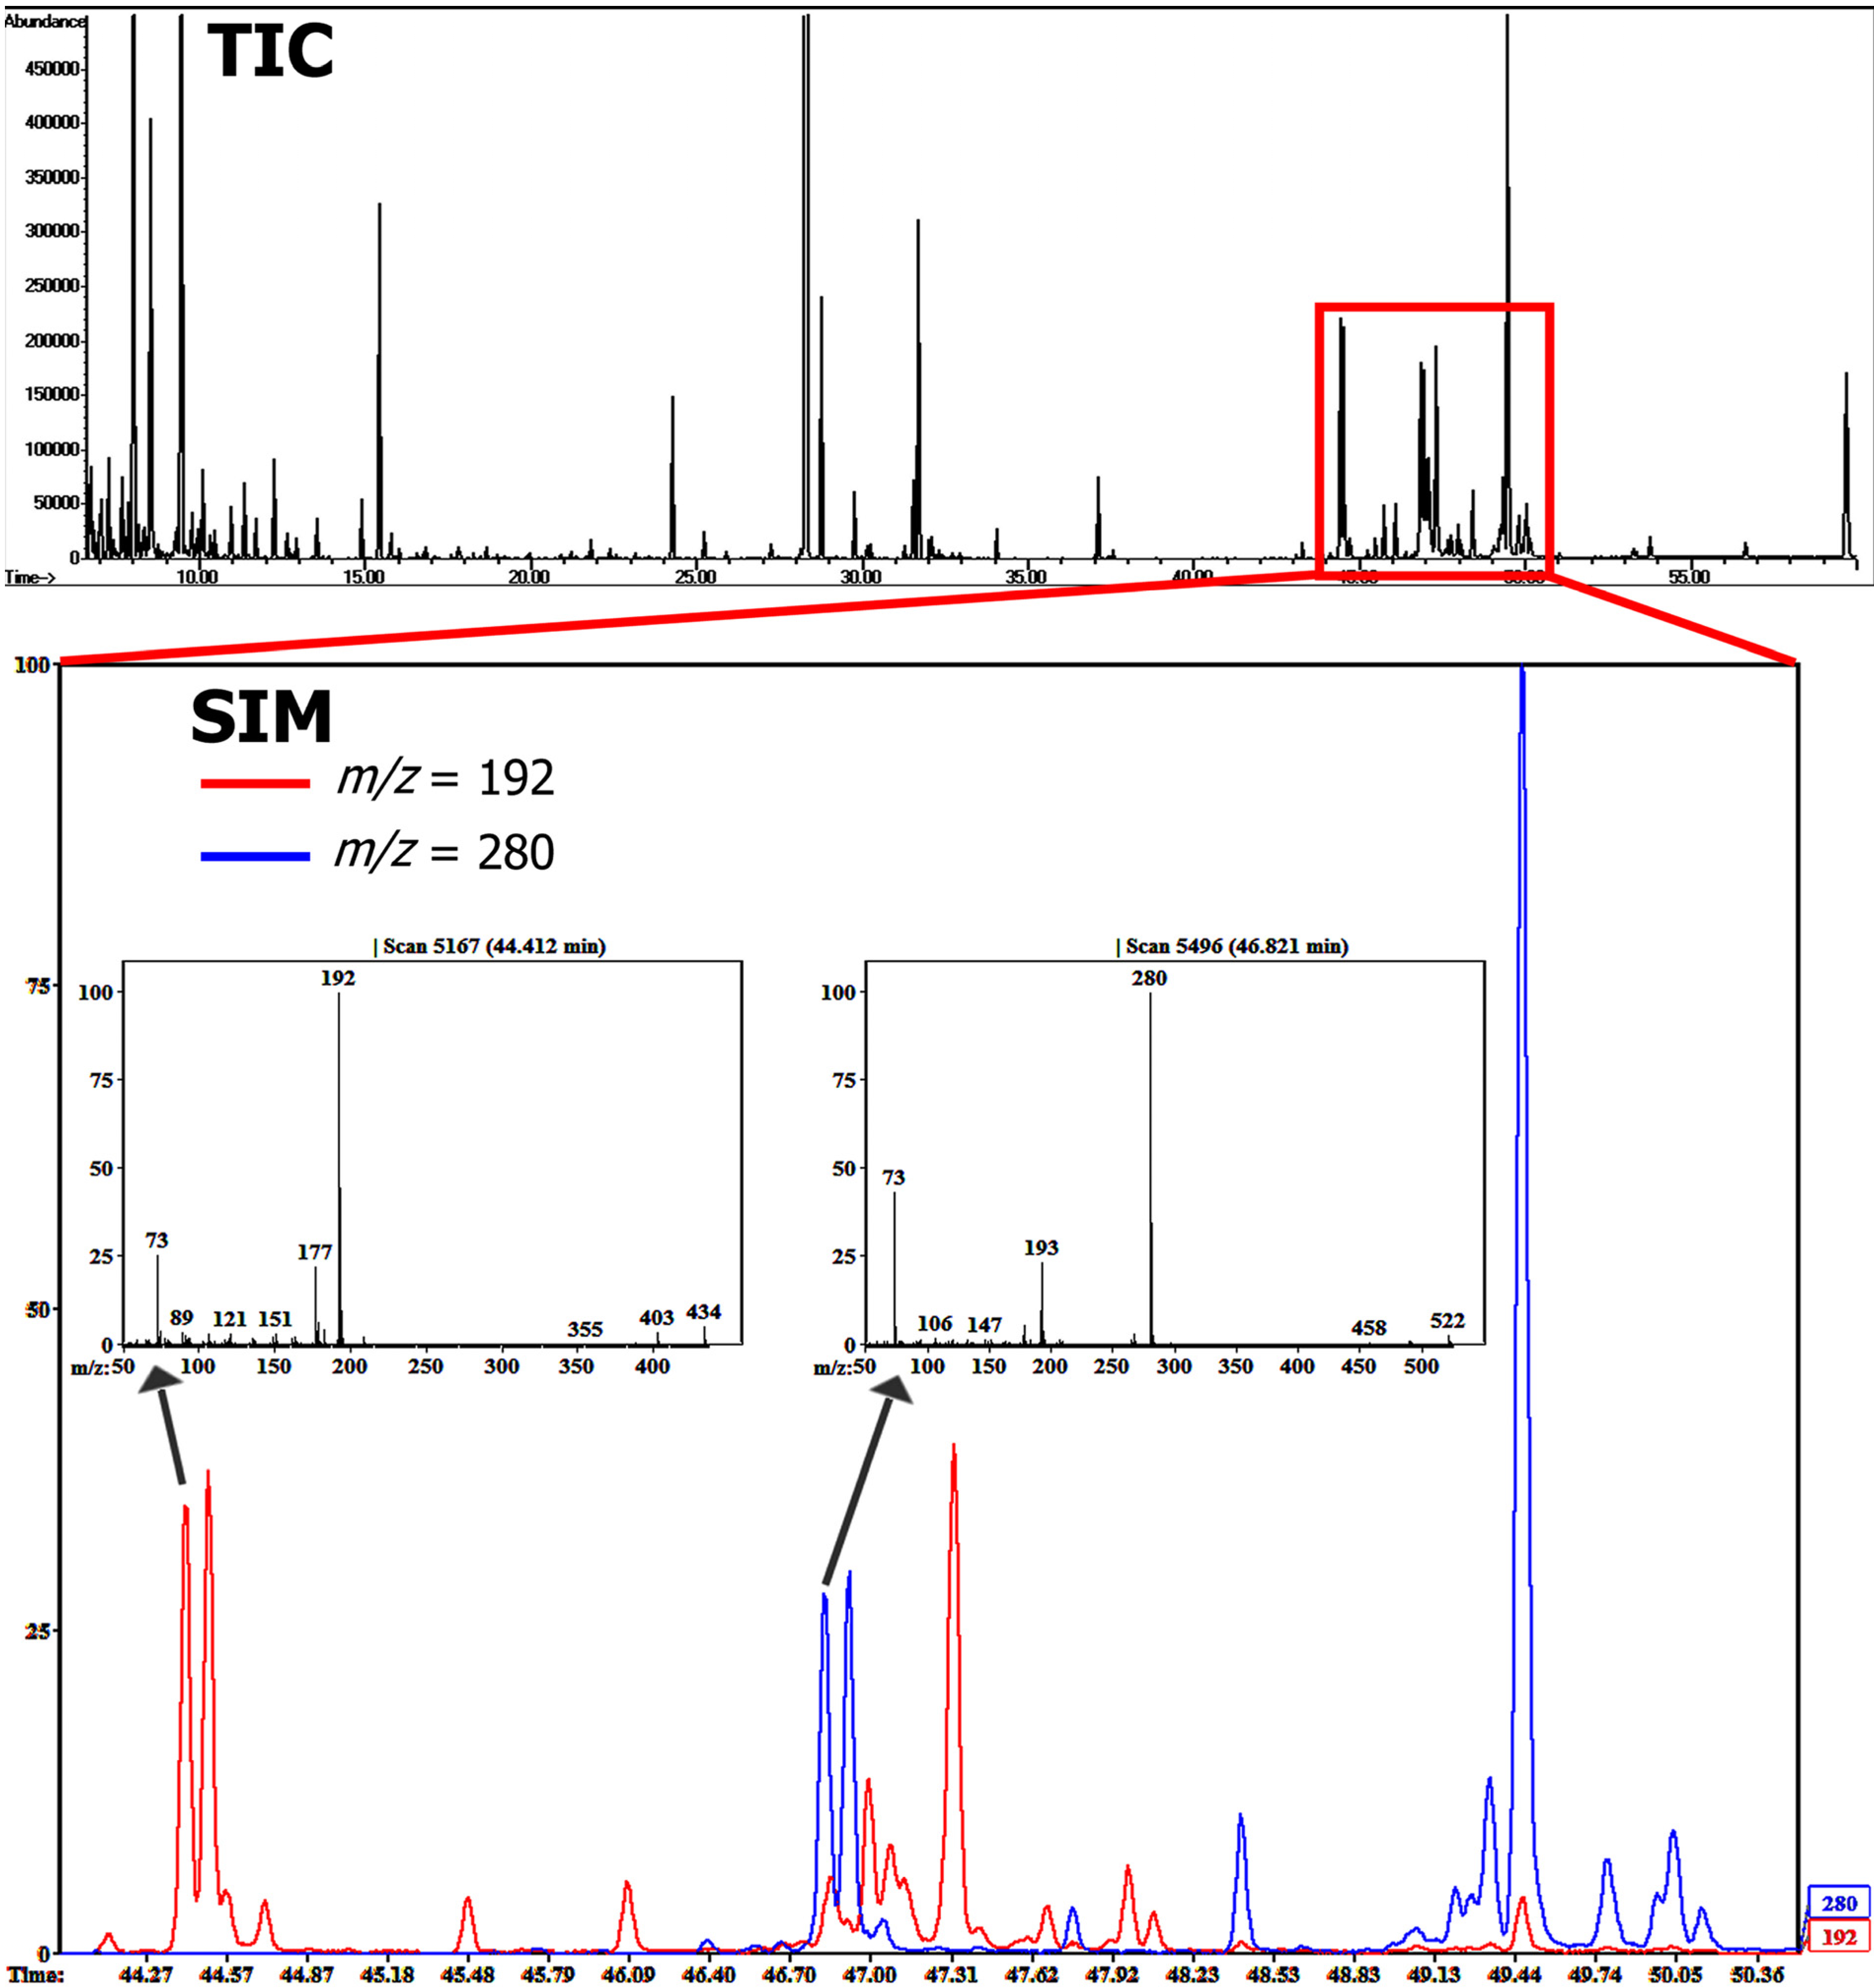
4.4. Olive Oil: Simple Phenolic Structures and Secoiridoids

Olive oil is a vegetable oil produced from fruits of the olive tree (Olea europaea L.) and its subspecies. The olive tree is a traditional wood species in Mediterranean countries, the main production region in the world, but olive oil is also produced in Asia, the Americas and Australia. The oil is commonly used in cooking, cosmetics, pharmaceuticals, soaps and as a fuel for oil lamps. Olive oil is considered as a highly-valuable and healthy oil because of its high content of glyceridic-bound monounsaturated fatty acids, mainly oleic acid (C18:1), linoleic acid (18:2) and α-linolenic acid (C18:3). In addition, olive oil contains sterols, triterpenic compounds, aliphatic alcohols and esters, and reasonable amounts of different phenolic structures. Tyrosol and its derivatives, namely oleuropeins and ligstrosides, represent characteristic phenolic structures found in olive exerting health-beneficial effects as reported by the European Food Safety Authority (EFSA) [99]. Other commonly detected phenolic compounds comprise hydroxybenzoic-, hydroxycinnamic- and hydroxyphenylacetic acids, lignans and flavonoids [91]. Phenolic patterns found in olive oil can be used to study regional and varietal differences [100], and effects of oil production and processing [101]. Different approaches towards extraction and chromatographic separation have been described [102,103], also including derivatization methods following GC-MS for the analysis of olive and other vegetable oils [41,104,105,106].
The quality of olive oils is mainly based on extraction and processing conditions, and distinct quality parameters such as acidity, taste and flavour characteristics. According to the classification system of the International Olive Council, oils can be divided into extra-virgin, virgin and the chemically-treated refined oils which all are originally obtained by pressing, and the solvent-extracted pomace oils. Depending on the physical and chemical extraction and processing steps utilized, the content and composition of phenolics shows a high degree of variation. Extra virgin oils often show two to three times higher levels of phenolic compounds compared to refined oil qualities [91].
Figure 13. GC-MS chromatogram of the polar (phenolic) fraction of an example extra- virgin olive oil. The elution region of secoiridoids is highlighted, zooming in to a SIM chromatogram plot indicating separation patterns of ligstroside (m/z = 192) and oleuropein (m/z = 280) derivatives. MS spectra included in publicly available databases: [G]—Golm Metabolome Database; [H]—Human Metabolome Database; [M]—MassBank; [N]—NIST Chemistry WebBook.
Molecules 20 03431 g013
Table 2. Lowest, highest and mean levels of phenolic and cyclic structures detected in commercial olive oils (mg/kg FW). Retention time (RT) and retention index (RI) are based on an apolar HP-5MS column. The relative intensity (in %) of mass ions is shown in parenthesis. MS spectra included in publicly available databases (DB): [G] Golm Metabolome Database; [H] Human Metabolome Database; [M] MassBank; [N] NIST Chemistry WebBook.
RTRICompoundMassesDBMeanLowHigh
15.051238phenylethyl alcoholM+ 194(1), 73(100), 103(81), 179(68), 105(24)[N]0.190.040.82
15.4012493,5-dimethylphenolM+ 194(39), 179(100), 194(67), 105(16)[N]0.280.031.45
15.641257benzoic acidM+ 194(4), 179(100), 105(79), 135(62), 77(56)[G,H,M,N]0.440.021.32
17.131306phenylacetic acidM+ 208, 73(100), 164(21), 193(9), 137(3)[G,H,M,N]0.260.040.87
17.801329catecholM+ 254(100), 239(30), 151(20), 136(15), 166(13)[G,H,M,N]5.150.4528.52
20.341419hydrocinnamic acidM+ 222(24), 104(100), 207(46), 91(26), 132(4)[G,H,M,N]0.600.013.25
21.621466hydroxybenzoic acidM+ 282(48), 73(100), 267(18), 179(14), 193(10)[G,H,M]0.470.032.36
21.821473(E)-isoeugenolM+ 236(42), 206(100), 73(21), 221(19), 179(11), 103(6)[N]0.810.024.65
22.861513salicylic acidM+ 282, 73(100), 267(92), 135(10), 193(5)[G,H,N]0.170.010.49
23.831551syringaldehydeM+ 254(45), 224(100), 73(79), 209(45), 239(33)[N]0.040.030.07
24.261569p-tyrosolM+ 282(19), 179(100), 267(13), 193(12)[H]7.021.4718.32
25.231608ligstroside deriv.M+ 192(100), 177(67), 179(24), 193(19)4.760.0418.91
25.621624methyl homovanillic acidM+ 268(55), 73(100), 238(75), 209(46), 253(30)0.050.020.14
25.951639vanillinM+ 253(71), 223(100), 73(29), 238(22), 165(12)[N]1.280.036.12
27.451703homovanillyl alcoholM+ 312(33), 73(100), 209(94), 103(22), 179(16)[N]0.610.013.05
28.491749phloretic acidM+ 308(52), 73(100), 219(71), 293(65), 249(53)[N]0.110.040.46
28.631755vanillic acidM+ 312(24), 267(49), 297(44), 282(34), 253(28)[G,H,N]0.430.022.26
28.761761hydroxytyrosolM+ 370(44), 267(100), 193(19), 179(11)1.470.275.35
29.771807oleuropein deriv.M+ 340(13), 73(100), 280(96), 193(40), 179(14)7.190.1735.98
30.751853p-coumaric acidM+ 308(35), 73(100), 293(53), 219(42), 249(23)[G,H,M,N]0.040.020.06
31.441887syringic acidM+ 342(24), 327(100), 73(67), 312(64), 297(58)[N]0.040.010.07
32.111919(Z)-ferulic acidM+ 338(49), 73(100), 308(43), 323(37), 249(33)[G,N]0.080.020.26
32.141921(E)-coniferaldehydeM+ 279(27), 73(100), 248(56), 218(49), 232(14)[G]0.060.040.15
43.862596ligstroside deriv.*192(100), 177(26), 179(8)0.130.050.60
44.122613ligstroside deriv.*192(100), 177(22)0.170.040.49
44.412633ligstroside aglycone (aldehydic form I)M+ 434(5), 192(100), 177(19), 179(7), 403(3)4.420.0725.91
44.572644ligstroside aglycone (aldehydic form II)M+ 434(5), 192(100), 177(23), 179(7), 403(3)0.590.073.15
45.482706ligstroside aglycone deriv.*192(100), 177(15), 179(5)0.340.031.51
46.082749ligstroside aglycone deriv.*192(100), 177(22), 179(5)0.490.041.96
46.392770oleuropein deriv.*280(100), 193(35), 179(14)0.090.020.36
46.662790oleuropein deriv.*280(100), 192(74), 177(16)0.080.020.27
46.922809oleuropein aglycone (aldehydic form)M+ 522(3), 280(100), 193(18), 179(4), 267(3)3.480.0720.45
47.002814ligstroside deriv.M+ 492(3), 192(100), 177(29), 280(13), 209(4), 461(2)0.810.034.66
47.082820ligstroside deriv.M+ 492(2), 192(100), 177(30), 461(21), 209(14), 280(9)0.520.032.91
47.322837ligstroside deriv.M+ 492(1), 192(100), 177(16), 179(5), 209(2), 280(1)2.570.0714.28
47.672863ligstroside deriv.*192(100), 177(18), 355(10), 179(8)0.230.031.15
47.772870oleuropein deriv.*280(100), 193(26), 179(4)0.250.011.22
47.912881ligstroside deriv.*192(100), 177(38), 179(19)0.080.020.26
47.982886ligstroside deriv.*192(100), 177(16), 179(6)0.460.032.27
48.072893ligstroside deriv.*192(100), 177(18), 179(9)0.200.021.01
48.402918oleuropein deriv.*280(100), 193(23), 179(6), 267(4), 519(4)0.730.043.82
48.632935oleuropein deriv.*280(100), 193(44), 192(41)0.050.010.08
49.072968oleuropein deriv.*280(100), 193(28), 179(8), 355(7)0.140.020.66
49.132973oleuropein deriv.*280(100), 193(28), 179(14)0.100.020.37
49.222979oleuropein deriv.M+ 580(2), 280(100), 193(21), 179(5), 267(4)0.330.031.80
49.272984oleuropein deriv.M+ 549(5), 280(100), 193(27), 179(8), 267(4)0.310.031.68
49.352989oleuropein deriv.M+ 551(2), 280(100), 193(21), 179(4), 519(1)0.880.044.94
49.462998oleuropein deriv.M+ 551(2), 280(100), 193(19), 179(4), 519(1)6.320.0836.78
49.793023oleuropein deriv.M+ 551(2), 280(100), 193(18), 179(5), 267(4)0.470.022.62
49.983038oleuropein deriv.*280(100), 355(30), 193(20), 368(4)0.300.021.60
50.043043oleuropein deriv.*280(100), 193(18), 179(5), 355(2)0.640.043.43
50.153051oleuropein deriv.*280(100), 193(17), 179(7), 267(5)0.230.011.16
51.783182luteolinM+ 559(100), 73(54), 487(8), 272(7)[G,H]0.050.010.09
53.263306pinoresinolM+ 502(59), 223(100), 73(75), 209(56), 235(43)0.080.020.16
53.343313β-sitosterolM+ 486(25), 129(100), 357(97), 396(92), 73(63), 381(40)[G,H,N]0.120.030.24
53.763348acetoxipinoresinolM+ 560(18), 276(100), 245(53), 73(37), 209(34), 261(20)1.060.045.40
55.593509uvaolM+ 496(89), 216(100), 73(58), 203(51), 188(25), 161(24)0.320.020.96
56.653607oleanolic acidM+ 585(6), 203(100), 73(53), 320(35), 189(33), 482(24)[G,H]1.360.053.77
Total Phenolics59.964.22286.99
oleuropein structures21.610.72117.21
ligstroside structures15.780.5279.08
tyrosols8.491.7423.67
phenolic acids2.690.3611.56
alcohols7.040.5838.49
aldehydes1.370.106.34
lignans1.130.075.56
flavonoids0.050.030.09
* no molecular peak detected; – no database MS spectrum available
As an effect of oil processing, refined oils generally show higher abundance of simple tyrosol structures due to the degradation of oleuropeins and ligstrosides. On the other hand, oleuropein and ligstroside content is generally much higher in extra-virgin and virgin oils, not uncommonly exceeding levels above 300 mg/kg. Based on a quality screening of different commercially available olive oils and olive extracts, variations in phenolic metabolites could easily be characterized using liquid-liquid extraction techniques and compound derivatization. Due to EI fragmentation patterns, secoiridoid aglyca could be easily traced using selected ion monitoring (SIM) plots depicting the distinct MS base peaks related to ligstroside (m/z = 192) and oleuropein (m/z = 280) structures (Figure 13). A total of 55 phenolic metabolites and three other cyclic structures could be detected, of which 28 compounds were tentatively identified based on a combination of MS database search and retention index values (Table 2).

5. Conclusions

GC-MS is frequently applied to characterize the chemical complexity of analytical samples based on its separation and identification capacity. Recent developments in GC-MS technology have facilitated global metabolomics approaches in order to approach biological functions and perturbations of biological systems, and for diagnostics and quality assessment purposes. However, one should be aware of the limitations of global GC-MS metabolite profiling. Processing, automated sample handling, and analysis conditions need to be strictly defined and controlled in order to minimize data variation and allow for quantitative calculations. When using standard protocols which are adapted to cover a broad range of biochemical structures, single metabolites or groups of compounds might be discriminated due to generalized compound extraction and derivatization conditions and thus, negatively affect compound recovery rates. Moreover, GC-MS analysis of highly complex mixtures of derivatized metabolites might impair separation and detection capacity with regard to the level of confidence in compound identification due to co-eluting peaks and similarity of MS spectra. For determination of absolute metabolite concentrations, the use of standard compounds is required, otherwise targeted methods need to be applied for the proper quantitation of compounds of interest. Despite limitations in GC-MS with respect to the mass range and polarity of metabolites, the utilization of derivatization techniques and automation technology have extended the range of separable and detectable compounds in high-throughput profiling experiments. Beside the qualitative and quantitative analysis of trimethylsilyl derivatives of highly abundant compounds found in plant samples such as sugars, amino acids and polyols, instrument sensitivity and resolution also allows for the successful detection of minor constituents such as plant secondary metabolites. Even though mass spectral information about monophenolic, polyphenolic and other cyclic compounds in MS libraries is limited, structure-specific MS fragmentation patterns enable to trace and identify low-concentration metabolites, often based on and in combination with published MS data from targeted GC-MS analyses. Current limitations in MS-based metabolomics due to the relatively small number of compounds included in MS databases, in particular secondary metabolites, and hurdles in compound identification, might be overcome by on-going and future efforts. These include in silico derivatization, retention indices and mass spectra matching [107], in silico enzymatic synthesis of biochemical compounds for non-targeted metabolomics [108], and endeavours such as web-based and shared collections of experimental metabolomics datasets, MS spectra and RI values for the processing and interpretation of GC-MS data [62]. Based on experimental data from own research, the present review has emphasized the capabilities of GC-MS to deduce chemical information on phenolics and cyclic compounds found in complex mixtures of plant metabolites.

Acknowledgments

The author greatly acknowledges financial support through grants by The Research Council of Norway (RCN): No. 207761—“Eco-values as product quality attributes in manufacturing of agricultural food ingredients” (2011–2015); No. 217485—“Biological-active components in raw materials and effects in fish: How to produce aquafeeds without fish meal” (2012–2015); and No. 199554—“Improving winter survival and quality of Norwegian cultivated strawberry” (2010–2014).

Conflicts of Interest

The author declares no conflict of interest.

References

  1. Lisec, J.; Schauer, N.; Kopka, J.; Willmitzer, L.; Fernie, A.R. Gas chromatography mass spectrometry-based metabolite profiling in plants. Nat. Protoc. 2006, 1, 387–396. [Google Scholar]
  2. Fiehn, O. Validated high quality automated metabolome analysis of Arabidopsis thaliana leaf disks. In Concepts in Plant Metabolomics; Nikolau, B.J., Wurtele, E.S., Eds.; Springer: Dordrecht, The Netherlands, 2007; pp. 1–18. [Google Scholar]
  3. Hall, R.; Beale, M.; Fiehn, O.; Hardy, N.; Sumner, L.; Bino, R. Plant metabolomics: The missing link in functional genomics strategies. Plant Cell 2002, 14, 1437–1440. [Google Scholar] [CrossRef] [PubMed]
  4. Halket, J.M.; Waterman, D.; Przyborowska, A.M.; Patel, R.K.; Fraser, P.D.; Bramley, P.M. Chemical derivatization and mass spectral libraries in metabolic profiling by GC/MS and LC/MS/MS. J. Exp. Bot. 2005, 56, 219–243. [Google Scholar] [CrossRef] [PubMed]
  5. Mushtaq, M.Y.; Choi, Y.H.; Verpoorte, R.; Wilson, E.G. Extraction for metabolomics: Access to the metabolome. Phytochem. Anal. PCA 2014, 25, 291–306. [Google Scholar] [CrossRef]
  6. Frenzel, T.; Miller, A.; Engel, K.H. Metabolite profiling—A Fractionation method for analysis of major and minor compounds in rice grains. Cereal Chem. 2002, 79, 215–221. [Google Scholar] [CrossRef]
  7. Rohloff, J. Cultivation of herbs and medicinal plants in Norway—Essential oil production and quality control. PhD thesis, Norwegian University of Science and Technology (NTNU), Trondheim, Norway, April 2003. [Google Scholar]
  8. Weldegergis, B.T.; Crouch, A.M. Analysis of volatiles in Pinotage wines by stir bar sorptive extraction and chemometric profiling. J. Agric. Food Chem. 2008, 56, 10225–10236. [Google Scholar] [CrossRef] [PubMed]
  9. Yang, C.; Wang, J.; Li, D. Microextraction techniques for the determination of volatile and semivolatile organic compounds from plants: A review. Anal. Chim. Acta 2013, 799, 8–22. [Google Scholar] [CrossRef] [PubMed]
  10. Cevallos-Cevallos, J.M.; Garcia-Torres, R.; Etxeberria, E.; Reyes-De-Corcuera, J.I. GC-MS Analysis of Headspace and Liquid Extracts for Metabolomic Differentiation of Citrus Huanglongbing and Zinc Deficiency in Leaves of “Valencia” Sweet Orange from Commercial Groves. Phytochem. Anal. 2011, 22, 236–246. [Google Scholar] [CrossRef] [PubMed]
  11. Kawaguchi, M.; Ito, R.; Nakazawa, H.; Takatsu, A. Applications of stir-bar sorptive extraction to food analysis. TrAC Trends Anal. Chem. 2013, 45, 280–293. [Google Scholar] [CrossRef]
  12. Farajzadeh, M.A.; Nouri, N.; Khorram, P. Derivatization and microextraction methods for determination of organic compounds by gas chromatography. Trac Trends Anal. Chem. 2014, 55, 14–23. [Google Scholar] [CrossRef]
  13. Bojko, B.; Reyes-Garces, N.; Bessonneau, V.; Gorynski, K.; Mousavi, F.; Silva, E.A.S.; Pawliszyn, J. Solid-phase microextraction in metabolomics. Trac-Trend Anal. Chem. 2014, 61, 168–180. [Google Scholar] [CrossRef]
  14. Tikunov, Y.; Lommen, A.; de Vos, C.H.; Verhoeven, H.A.; Bino, R.J.; Hall, R.D.; Bovy, A.G. A novel approach for nontargeted data analysis for metabolomics. Large-scale profiling of tomato fruit volatiles. Plant Physiol. 2005, 139, 1125–1137. [Google Scholar] [CrossRef] [PubMed]
  15. Sanchez, G.; Besada, C.; Badenes, M.L.; Monforte, A.J.; Granell, A. A non-targeted approach unravels the volatile network in peach fruit. PLoS One 2012, 7, e38992. [Google Scholar] [CrossRef] [PubMed] [Green Version]
  16. Birkemeyer, C.; Kolasa, A.; Kopka, J. Comprehensive chemical derivatization for gas chromatography-mass spectrometry-based multi-targeted profiling of the major phytohormones. J. Chromatogr. A 2003, 993, 89–102. [Google Scholar] [CrossRef] [PubMed]
  17. Little, J.L. Artifacts in trimethylsilyl derivatization reactions and ways to avoid them. J. Chromatogr. A 1999, 844, 1–22. [Google Scholar] [CrossRef] [PubMed]
  18. Villas-Boas, S.G.; Smart, K.F.; Sivakumaran, S.; Lane, G.A. Alkylation or silylation for analysis of amino and non-amino organic acids by GC-MS? Metabolites 2011, 1, 3–20. [Google Scholar] [CrossRef] [PubMed]
  19. Kind, T.; Wohlgemuth, G.; Lee do, Y.; Lu, Y.; Palazoglu, M.; Shahbaz, S.; Fiehn, O. FiehnLib: Mass spectral and retention index libraries for metabolomics based on quadrupole and time-of-flight gas chromatography/mass spectrometry. Anal. Chem. 2009, 81, 10038–10048. [Google Scholar] [CrossRef] [PubMed]
  20. Fiehn, O.; Kopka, J.; Dormann, P.; Altmann, T.; Trethewey, R.N.; Willmitzer, L. Metabolite profiling for plant functional genomics. Nat. Biotechnol. 2000, 18, 1157–1161. [Google Scholar] [CrossRef] [PubMed]
  21. Roessner, U.; Wagner, C.; Kopka, J.; Trethewey, R.N.; Willmitzer, L. Technical advance: Simultaneous analysis of metabolites in potato tuber by gas chromatography-mass spectrometry. Plant J. 2000, 23, 131–142. [Google Scholar] [CrossRef] [PubMed]
  22. Dixon, R.A.; Gang, D.R.; Charlton, A.J.; Fiehn, O.; Kuiper, H.A.; Reynolds, T.L.; Tjeerdema, R.S.; Jeffery, E.H.; German, J.B.; Ridley, W.P.; et al. Applications of metabolomics in agriculture. J. Agric. Food Chem. 2006, 54, 8984–8994. [Google Scholar] [CrossRef] [PubMed]
  23. Schauer, N.; Zamir, D.; Fernie, A.R. Metabolic profiling of leaves and fruit of wild species tomato: A survey of the Solanum lycopersicum complex. J. Exp. Bot. 2005, 56, 297–307. [Google Scholar] [CrossRef] [PubMed]
  24. Schauer, N.; Semel, Y.; Roessner, U.; Gur, A.; Balbo, I.; Carrari, F.; Pleban, T.; Perez-Melis, A.; Bruedigam, C.; Kopka, J.; et al. Comprehensive metabolic profiling and phenotyping of interspecific introgression lines for tomato improvement. Nat. Biotechnol. 2006, 24, 447–454. [Google Scholar] [CrossRef] [PubMed]
  25. Urbanczyk-Wochniak, E.; Fernie, A.R. Metabolic profiling reveals altered nitrogen nutrient regimes have diverse effects on the metabolism of hydroponically-grown tomato (Solanum lycopersicum) plants. J. Exp. Bot. 2005, 56, 309–321. [Google Scholar] [CrossRef] [PubMed]
  26. Carrari, F.; Baxter, C.; Usadel, B.; Urbanczyk-Wochniak, E.; Zanor, M.I.; Nunes-Nesi, A.; Nikiforova, V.; Centero, D.; Ratzka, A.; Pauly, M.; et al. Integrated analysis of metabolite and transcript levels reveals the metabolic shifts that underlie tomato fruit development and highlight regulatory aspects of metabolic network behavior. Plant Physiol. 2006, 142, 1380–1396. [Google Scholar] [CrossRef] [PubMed]
  27. Wagner, C.; Sefkow, M.; Kopka, J. Construction and application of a mass spectral and retention time index database generated from plant GC/EI-TOF-MS metabolite profiles. Phytochemistry 2003, 62, 887–900. [Google Scholar] [CrossRef] [PubMed]
  28. Yang, W.L.; Bernards, M.A. Metabolite profiling of potato (Solanum tuberosum L.) tubers during wound-induced suberization. Metabolomics 2007, 3, 147–159. [Google Scholar] [CrossRef]
  29. Röhlig, R.M.; Eder, J.; Engel, K.H. Metabolite profiling of maize grain: Differentiation due to genetics and environment. Metabolomics 2009, 5, 459–477. [Google Scholar] [CrossRef]
  30. Benkeblia, N.; Shinano, T.; Osaki, M. Metabolite profiling and assessment of metabolome compartmentation of soybean leaves using non-aqueous fractionation and GC-MS analysis. Metabolomics 2007, 3, 297–305. [Google Scholar] [CrossRef]
  31. Dauwe, R.; Morreel, K.; Goeminne, G.; Gielen, B.; Rohde, A.; van Beeumen, J.; Ralph, J.; Boudet, A.M.; Kopka, J.; Rochange, S.F.; et al. Molecular phenotyping of lignin-modified tobacco reveals associated changes in cell-wall metabolism, primary metabolism, stress metabolism and photorespiration. Plant J. 2007, 52, 263–285. [Google Scholar] [CrossRef] [PubMed]
  32. Lytovchenko, A.; Beleggia, R.; Schauer, N.; Isaacson, T.; Leuendorf, J.E.; Hellmann, H.; Rose, J.K.; Fernie, A.R. Application of GC-MS for the detection of lipophilic compounds in diverse plant tissues. Plant Methods 2009, 5. [Google Scholar] [CrossRef] [PubMed]
  33. Stamova, B.S.; Roessner, U.; Suren, S.; Laudencia-Chingcuanco, D.; Bacic, A.; Beckles, D.M. Metabolic profiling of transgenic wheat over-expressing the high-molecular-weight Dx5 glutenin subunit. Metabolomics 2009, 5, 239–252. [Google Scholar] [CrossRef]
  34. Zhou, J.; Ma, C.F.; Xu, H.L.; Yuan, K.L.; Lu, X.; Zhu, Z.; Wu, Y.N.; Xu, G.W. Metabolic profiling of transgenic rice with cryIAc and sck genes: An evaluation of unintended effects at metabolic level by using GC-FID and GC-MS. J. Chromatogr. B 2009, 877, 725–732. [Google Scholar] [CrossRef]
  35. Sissener, N.H.; Hemre, G.-I.; Lall, S.P.; Sagstad, A.; Petersen, K.; Williams, J.; Rohloff, J.; Sanden, M. Are apparent negative effects of feeding genetically modified MON810 maize to Atlantic salmon, Salmo salar caused by confounding factors? Br. J. Nutr. 2011, 106, 42–56. [Google Scholar] [CrossRef] [PubMed]
  36. Koek, M.M.; van der Kloet, F.M.; Kleemann, R.; Kooistra, T.; Verheij, E.R.; Hankemeier, T. Semi-automated non-target processing in GC × GC-MS metabolomics analysis: Applicability for biomedical studies. Metabolomics 2011, 7, 1–14. [Google Scholar] [CrossRef] [PubMed]
  37. Roessner-Tunali, U.; Hegemann, B.; Lytovchenko, A.; Carrari, F.; Bruedigam, C.; Granot, D.; Fernie, A.R. Metabolic profiling of transgenic tomato plants overexpressing hexokinase reveals that the influence of hexose phosphorylation diminishes during fruit development. Plant Physiol. 2003, 133, 84–99. [Google Scholar] [CrossRef] [PubMed]
  38. Dethloff, F.; Erban, A.; Orf, I.; Alpers, J.; Fehrle, I.; Beine-Golovchuk, O.; Schmidt, S.; Schwachtje, J.; Kopka, J. Profiling Methods to Identify Cold-Regulated Primary Metabolites Using Gas Chromatography Coupled to Mass Spectrometry. In Plant Cold Acclimation: Methods and Protocols; Hincha, D.K., Zuther, E., Eds.; Humana Press: New York, NY, USA, 2014; Volume 1166, pp. 171–197. [Google Scholar]
  39. Isidorov, V.A.; Szczepaniak, L. Gas chromatographic retention indices of biologically and environmentally important organic compounds on capillary columns with low-polar stationary phases. J. Chromatogr. A 2009, 1216, 8998–9007. [Google Scholar] [CrossRef] [PubMed]
  40. Robbins, R.J. Phenolic acids in foods: An overview of analytical methodology. J. Agric. Food Chem. 2003, 51, 2866–2887. [Google Scholar] [CrossRef] [PubMed]
  41. Saitta, M.; Salvo, F.; di Bella, G.; Dugo, G.; la Torre, G.L. Minor compounds in the phenolic fraction of virgin olive oils. Food Chem. 2009, 112, 525–532. [Google Scholar] [CrossRef]
  42. Zhang, K.; Zuo, Y. GC-MS determination of flavonoids and phenolic and benzoic acids in human plasma after consumption of cranberry juice. J. Agric. Food Chem. 2004, 52, 222–227. [Google Scholar] [CrossRef] [PubMed]
  43. Zuo, Y.; Wang, C.; Zhan, J. Separation, characterization, and quantitation of benzoic and phenolic antioxidants in American cranberry fruit by GC-MS. J. Agric. Food Chem. 2002, 50, 3789–3794. [Google Scholar] [CrossRef] [PubMed]
  44. Füzfai, Z.; Molnár-Perl, I. Gas chromatographic-mass spectrometric fragmentation study of flavonoids as their trimethylsilyl derivatives: Analysis of flavonoids, sugars, carboxylic and amino acids in model systems and in citrus fruits. J. Chromatogr. A 2007, 1149, 88–101. [Google Scholar] [CrossRef] [PubMed]
  45. Gao, X.; Williams, S.J.; Woodman, O.L.; Marriott, P.J. Comprehensive two-dimensional gas chromatography, retention indices and time-of-flight mass spectra of flavonoids and chalcones. J. Chromatogr. A 2010, 1217, 8317–8326. [Google Scholar] [CrossRef] [PubMed]
  46. Zarnowski, R.; Suzuki, Y.; Yamaguchi, I.; Pietr, S.J. Alkylresorcinols in barley (Hordeum vulgare L. distichon) grains. Z. Naturforsch. C 2002, 57, 57–62. [Google Scholar] [CrossRef] [PubMed]
  47. Lee, S.H.; Jung, B.H.; Kim, S.Y.; Chung, B.C. Determination of phytoestrogens in traditional medicinal herbs using gas chromatography-mass spectrometry. J. Nutr. Biochem. 2004, 15, 452–460. [Google Scholar] [CrossRef] [PubMed]
  48. Rios, J.J.; Gil, M.J.; Gutierrez-Rosales, F. Solid-phase extraction gas chromatography-ion trap-mass spectrometry qualitative method for evaluation of phenolic compounds in virgin olive oil and structural confirmation of oleuropein and ligstroside aglycons and their oxidation products. J. Chromatogr. A 2005, 1093, 167–176. [Google Scholar] [CrossRef] [PubMed]
  49. Popova, M.P.; Graikou, K.; Chinou, I.; Bankova, V.S. GC-MS profiling of diterpene compounds in Mediterranean propolis from Greece. J. Agric. Food Chem. 2010, 58, 3167–3176. [Google Scholar] [CrossRef] [PubMed]
  50. Razborsek, M.I.; Voncina, D.B.; Dolecek, V.; Voncina, E. Determination of major phenolic acids, phenolic diterpenes and triterpenes in rosemary (Rosmarinus officinalis L.) by gas chromatography and mass spectrometry. Acta Chim. Slov. 2007, 54, 60–67. [Google Scholar]
  51. Esche, R.; Barnsteiner, A.; Scholz, B.; Engel, K.H. Simultaneous analysis of free phytosterols/phytostanols and intact phytosteryl/phytostanyl fatty acid and phenolic acid esters in cereals. J. Agric. Food Chem. 2012, 60, 5330–5339. [Google Scholar] [CrossRef] [PubMed]
  52. Shin, E.C.; Pegg, R.B.; Phillips, R.D.; Eitenmiller, R.R. Commercial peanut (Arachis hypogaea L.) cultivars in the United States: Phytosterol composition. J. Agric. Food Chem. 2010, 58, 9137–9146. [Google Scholar] [CrossRef] [PubMed]
  53. Meagher, L.P.; Beecher, G.R.; Flanagan, V.P.; Li, B.W. Isolation and characterization of the lignans, isolariciresinol and pinoresinol, in flaxseed meal. J. Agric. Food Chem. 1999, 47, 3173–3180. [Google Scholar] [CrossRef] [PubMed]
  54. Lamikanra, O.; Grimm, C.C.; Rodin, J.B.; Inyang, I.D. Hydroxylated stilbenes in selected American wines. J. Agric. Food Chem. 1996, 44, 1111–1115. [Google Scholar] [CrossRef]
  55. Rimando, A.M.; Kalt, W.; Magee, J.B.; Dewey, J.; Ballington, J.R. Resveratrol, pterostilbene, and piceatannol in vaccinium berries. J. Agric. Food Chem. 2004, 52, 4713–4719. [Google Scholar] [CrossRef] [PubMed]
  56. Torras-Claveria, L.; Berkov, S.; Jauregui, O.; Caujape, J.; Viladomat, F.; Codina, C.; Bastida, J. Metabolic profiling of bioactive Pancratium canariense extracts by GC-MS. Phytochem. Anal. PCA 2010, 21, 80–88. [Google Scholar] [CrossRef]
  57. Kopka, J. Current challenges and developments in GC-MS based metabolite profiling technology. J. Biotechnol. 2006, 124, 312–322. [Google Scholar] [CrossRef] [PubMed]
  58. Isidorov, V.A.; Kotowska, U.; Vinogorova, V.T. GC identification of organic compounds based on partition coefficients of their TMS derivatives in a hexane-acetonitrile sytem and retention indices. Anal. Sci. 2005, 21, 1483–1489. [Google Scholar] [CrossRef] [PubMed]
  59. Isidorov, V.A.; Vinogorova, V.T. GC-MS analysis of compounds extracted from buds of Populus balsamifera and Populus nigra. Z. Fur Naturforschung C J. Biosci. 2003, 58, 355–360. [Google Scholar]
  60. Schauer, N.; Steinhauser, D.; Strelkov, S.; Schomburg, D.; Allison, G.; Moritz, T.; Lundgren, K.; Roessner-Tunali, U.; Forbes, M.G.; Willmitzer, L.; et al. GC-MS libraries for the rapid identification of metabolites in complex biological samples. FEBS Lett. 2005, 579, 1332–1337. [Google Scholar] [CrossRef] [PubMed]
  61. Horai, H.; Arita, M.; Kanaya, S.; Nihei, Y.; Ikeda, T.; Suwa, K.; Ojima, Y.; Tanaka, K.; Tanaka, S.; Aoshima, K.; et al. MassBank: A public repository for sharing mass spectral data for life sciences. J. Mass Spectrom. JMS 2010, 45, 703–714. [Google Scholar] [CrossRef]
  62. Carroll, A.J.; Badger, M.R.; Harvey Millar, A. The MetabolomeExpress Project: Enabling web-based processing, analysis and transparent dissemination of GC/MS metabolomics datasets. BMC Bioinform. 2010, 11. [Google Scholar] [CrossRef]
  63. Kamthan, A.; Kamthan, M.; Chakraborty, N.; Chakraborty, S.; Datta, A. A simple protocol for extraction, derivatization, and analysis of tomato leaf and fruit lipophilic metabolites using GC-MS. Protocol. Exch. 2012. [Google Scholar] [CrossRef]
  64. Shuman, J.L.; Cortes, D.F.; Armenta, J.M.; Pokrzywa, R.M.; Mendes, P.; Shulaev, V. Plant metabolomics by GC-MS and differential analysis. In Plant Reverse Genetics: Methods and Protocols; Pereira, A., Ed.; Springer: New York, NY, USA, 2010; Volume 678, pp. 229–246. [Google Scholar]
  65. Cuthbertson, D.J.; Johnson, S.R.; Piljac-Zegarac, J.; Kappel, J.; Schafer, S.; Wust, M.; Ketchum, R.E.; Croteau, R.B.; Marques, J.V.; Davin, L.B.; et al. Accurate mass-time tag library for LC/MS-based metabolite profiling of medicinal plants. Phytochemistry 2013, 91, 187–197. [Google Scholar] [CrossRef] [PubMed]
  66. Sakurai, T.; Yamada, Y.; Sawada, Y.; Matsuda, F.; Akiyama, K.; Shinozaki, K.; Hirai, M.Y.; Saito, K. PRIMe Update: Innovative content for plant metabolomics and integration of gene expression and metabolite accumulation. Plant Cell Physiol. 2013, 54. [Google Scholar] [CrossRef] [PubMed]
  67. Adams, R.P. Identification of Essential Oil Components by Gas Chromatography/Mass Spectrometry, 4th ed.; Allured: Carol Stream, IL, USA, 2007; p. 804. [Google Scholar]
  68. Hochmuth, D. Terpenoids Library: Terpenoids and related constituents of essential oils. Available online: http://massfinder.com/wiki/Terpenoids_Library (accessed on 4 December 2014).
  69. Skogerson, K.; Wohlgemuth, G.; Barupal, D.K.; Fiehn, O. The volatile compound BinBase mass spectral database. BMC Bioinform. 2011, 12. [Google Scholar] [CrossRef]
  70. Davik, J.; Koehler, G.; From, B.; Torp, T.; Rohloff, J.; Eidem, P.; Wilson, R.C.; Sonsteby, A.; Randall, S.K.; Alsheikh, M. Dehydrin, alcohol dehydrogenase, and central metabolite levels are associated with cold tolerance in diploid strawberry (Fragaria spp.). Planta 2013, 237, 265–277. [Google Scholar] [CrossRef] [PubMed]
  71. Dhuli, P.; Rohloff, J.; Strimbeck, G.R. Metabolite changes in conifer buds and needles during forced bud break in Norway spruce (Picea abies) and European silverfir (Abies alba). Front. Plant Sci. 2014, 5. [Google Scholar] [CrossRef] [PubMed] [Green Version]
  72. Rohloff, J.; Kopka, J.; Erban, A.; Winge, P.; Wilson, R.C.; Bones, A.M.; Davik, J.; Randall, S.K.; Alsheikh, M.K. Metabolite profiling reveals novel multi-level cold responses in the diploid model Fragaria vesca (woodland strawberry). Phytochemistry 2012, 77, 99–109. [Google Scholar] [CrossRef] [PubMed]
  73. Tsao, R.; McCallum, J. Chemistry of flavonoids. In Fruit and Vegetable Phytochemicals: Chemistry, Nutritional Value, and Stability; De la Rosa, L.A., Alvarez-Parrilla, E., González-Aguilar, G.A., Eds.; Wiley-Blackwell: Ames, IA, USA, 2010. [Google Scholar]
  74. Rohloff, J. Impact of agricultural and environmental factors on strawberry (Fragaria x ananassa Duch.) aroma—A review. Eur. J. Plant Sci. Biotechnol. 2011, 5, 17–34. [Google Scholar]
  75. Ellis, C.L.; Edirisinghe, I.; Kappagoda, T.; Burton-Freeman, B. Attenuation of meal-induced inflammatory and thrombotic responses in overweight men and women after 6-week daily strawberry (Fragaria) intake. A randomized placebo-controlled trial. J. Atheroscler. Thromb. 2011, 18, 318–327. [Google Scholar] [CrossRef] [PubMed]
  76. Zunino, S.J.; Parelman, M.A.; Freytag, T.L.; Stephensen, C.B.; Kelley, D.S.; Mackey, B.E.; Woodhouse, L.R.; Bonnel, E.L. Effects of dietary strawberry powder on blood lipids and inflammatory markers in obese human subjects. Br. J. Nutr. 2012, 108, 900–909. [Google Scholar] [CrossRef] [PubMed]
  77. Pawlaczyk, I.; Lewik-Tsirigotis, M.; Capek, P.; Matulova, M.; Sasinkova, V.; Dabrowski, P.; Witkiewicz, W.; Gancarz, R. Effects of extraction condition on structural features and anticoagulant activity of F. vesca L. conjugates. Carbohydr. polym. 2013, 92, 741–750. [Google Scholar] [CrossRef] [PubMed]
  78. Hanhineva, K.; Rogachev, I.; Kokko, H.; Mintz-Oron, S.; Venger, I.; Karenlampi, S.; Aharoni, A. Non-targeted analysis of spatial metabolite composition in strawberry (Fragariaxananassa) flowers. Phytochemistry 2008, 69, 2463–2481. [Google Scholar] [CrossRef] [PubMed]
  79. Oszmianski, J.; Wojdylo, A.; Gorzelany, J.; Kapusta, I. Identification and characterization of low molecular weight polyphenols in berry leaf extracts by HPLC-DAD and LC-ESI/MS. J. Agric. Food Chem. 2011, 59, 12830–12835. [Google Scholar] [CrossRef] [PubMed]
  80. Hanhineva, K.; Soininen, P.; Anttonen, M.J.; Kokko, H.; Rogachev, I.; Aharoni, A.; Laatikainen, R.; Karenlampi, S. NMR and UPLC-qTOF-MS/MS characterisation of novel phenylethanol derivatives of phenylpropanoid glucosides from the leaves of strawberry (Fragaria x ananassa cv. Jonsok). Phytochem. Anal. PCA 2009, 20, 353–364. [Google Scholar] [CrossRef]
  81. Simirgiotis, M.J.; Schmeda-Hirschmann, G. Determination of phenolic composition and antioxidant activity in fruits, rhizomes and leaves of the white strawberry (Fragaria chiloensis spp. chiloensis form chiloensis) using HPLC-DAD-ESI-MS and free radical quenching techniques. J. Food Compos. Anal. 2010, 23, 545–553. [Google Scholar]
  82. Hoffmann, T.; Friedlhuber, R.; Steinhauser, C.; Tittel, I.; Skowranek, K.; Schwab, W.; Fischer, T.C. Histochemical screening, metabolite profiling and expression analysis reveal Rosaceae roots as the site of flavan-3-ol biosynthesis. Plant Biol. 2012, 14, 33–40. [Google Scholar] [PubMed]
  83. Rohloff, J.; Eidem, P.; Davik, J.; Alsheikh, M. Metabolic cold acclimation of ‘Polka’ and ‘Honeoye’ strawberries under natural field conditions. Acta Hortic. 2014, 1049, 463–466. [Google Scholar]
  84. Chikwati, E.M.; Venold, F.F.; Penn, M.H.; Rohloff, J.; Refstie, S.; Guttvik, A.; Hillestad, M.; Krogdahl, A. Interaction of soyasaponins with plant ingredients in diets for Atlantic salmon, Salmo salar L. Br. J. Nutr. 2012, 107, 1570–1590. [Google Scholar] [CrossRef] [PubMed]
  85. Francis, G.; Makkar, H.P.S.; Becker, K. Antinutritional factors present in plant-derived alternate fish feed ingredients and their effects in fish. Aquaculture 2001, 199, 197–227. [Google Scholar] [CrossRef]
  86. Alu’datt, M.H.; Rababah, T.; Ereifej, K.; Brewer, S.; Alli, I. Phenolic-protein interactions in oilseed protein isolates. Food Res. Int. 2013, 52, 178–184. [Google Scholar] [CrossRef]
  87. Zilic, S.; Akillioglu, H.G.; Serpen, A.; Peric, V.; Gokmen, V. Comparisons of phenolic compounds, isoflavones, antioxidant capacity and oxidative enzymes in yellow and black soybeans seed coat and dehulled bean. Eur. Food Res. Technol. 2013, 237, 409–418. [Google Scholar] [CrossRef]
  88. Karamac, M.; Kosinska, A.; Estrella, I.; Hernandez, T.; Duenas, M. Antioxidant activity of phenolic compounds identified in sunflower seeds. Eur. Food Res. Technol. 2012, 235, 221–230. [Google Scholar] [CrossRef]
  89. Shchekoldina, T.; Aider, M. Production of low chlorogenic and caffeic acid containing sunflower meal protein isolate and its use in functional wheat bread making. J. Food Sci. Technol. 2014, 51, 2331–2343. [Google Scholar] [CrossRef] [PubMed]
  90. Žilić, S.; Maksimović Dragišić, J.; Maksimović, V.; Maksimović, M.; Basić, Z.; Crevar, M.; Stanković, G. The content of antioxidants in sunflower seed and kernel. Helia 2010, 33, 75–84. [Google Scholar] [CrossRef]
  91. Rothwell, J.A.; Perez-Jimenez, J.; Neveu, V.; Medina-Remon, A.; M’Hiri, N.; Garcia-Lobato, P.; Manach, C.; Knox, C.; Eisner, R.; Wishart, D.S.; et al. Phenol-Explorer 3.0: A major update of the Phenol-Explorer database to incorporate data on the effects of food processing on polyphenol content. Database 2013, 2013. [Google Scholar] [CrossRef] [PubMed]
  92. Bjorck, I.; Ostman, E.; Kristensen, M.; Anson, N.M.; Price, R.K.; Haenen, G.R.M.M.; Havenaar, R.; Knudsen, K.E.B.; Frid, A.; Mykkanen, H.; et al. Cereal grains for nutrition and health benefits: Overview of results from in vitro, animal and human studies in the HEALTHGRAIN project. Trends Food Sci. Technol. 2012, 25, 87–100. [Google Scholar] [CrossRef]
  93. Dykes, L.; Rooney, L.W. Phenolic compounds in cereal grains and their health benefits. Cereal Food World 2007, 52, 105–111. [Google Scholar]
  94. Ward, J.L.; Poutanen, K.; Gebruers, K.; Piironen, V.; Lampi, A.M.; Nystrom, L.; Andersson, A.A.; Aman, P.; Boros, D.; Rakszegi, M.; et al. The HEALTHGRAIN Cereal Diversity Screen: Concept, results, and prospects. J. Agric. Food Chem. 2008, 56, 9699–9709. [Google Scholar] [CrossRef] [PubMed]
  95. Mattila, P.; Pihlava, J.M.; Hellstrom, J. Contents of phenolic acids, alkyl- and alkenylresorcinols, and avenanthramides in commercial grain products. J. Agric. Food Chem. 2005, 53, 8290–8295. [Google Scholar] [CrossRef] [PubMed]
  96. Menzel, C.; Kamal-Eldin, A.; Marklund, M.; Andersson, A.; Aman, P.; Landberg, R. Alkylresorcinols in Swedish cereal food products. J. Food Compos. Anal. 2012, 28, 119–125. [Google Scholar] [CrossRef]
  97. Ross, A.B.; Shepherd, M.J.; Schupphaus, M.; Sinclair, V.; Alfaro, B.; Kamal-Eldin, A.; Aman, P. Alkylresorcinols in cereals and cereal products. J. Agric. Food Chem. 2003, 51, 4111–4118. [Google Scholar] [CrossRef] [PubMed]
  98. Landberg, R.; Kamal-Eldin, A.; Andersson, A.; Vessby, B.; Aman, P. Alkylresorcinols as biomarkers of whole-grain wheat and rye intake: Plasma concentration and intake estimated from dietary records. Am. J. Clin. Nutr. 2008, 87, 832–838. [Google Scholar] [PubMed]
  99. EFSA. Scientific Opinion on the substantiation of health claims related to polyphenols in olive and protection of LDL particles from oxidative damage (ID 1333, 1638, 1639, 1696, 2865), maintenance of normal blood HDL-cholesterol concentrations (ID 1639), maintenance of normal blood pressure (ID 3781), “anti-inflammatory properties” (ID 1882), “contributes to the upper respiratory tract health” (ID 3468), “can help to maintain a normal function of gastrointestinal tract” (3779), and “contributes to body defences against external agents” (ID 3467) pursuant to Article 13(1) of Regulation (EC) No 1924/2006. EFSA J. 2011, 9, 2033. [Google Scholar] [CrossRef]
  100. Baiano, A.; Gambacorta, G.; Terracone, C.; Previtali, M.A.; Lamacchia, C.; la Notte, E. Changes in phenolic content and antioxidant activity of Italian extra-virgin olive oils during storage. J. Food Sci. 2009, 74, C177–C183. [Google Scholar] [CrossRef] [PubMed]
  101. Cicerale, S.; Conlan, X.A.; Sinclair, A.J.; Keast, R.S. Chemistry and health of olive oil phenolics. Crit. Rev. Food Sci. Nutr. 2009, 49, 218–236. [Google Scholar] [CrossRef] [PubMed]
  102. Carrasco-Pancorbo, A.; Cerretani, L.; Bendini, A.; Segura-Carretero, A.; Gallina-Toschi, T.; Fernandez-Gutierrez, A. Analytical determination of polyphenols in olive oils. J. Sep. Sci. 2005, 28, 837–858. [Google Scholar] [CrossRef] [PubMed]
  103. Bendini, A.; Cerretani, L.; Carrasco-Pancorbo, A.; Gomez-Caravaca, A.M.; Segura-Carretero, A.; Fernandez-Gutierrez, A.; Lercker, G. Phenolic molecules in virgin olive oils: A survey of their sensory properties, health effects, antioxidant activity and analytical methods. An overview of the last decade. Molecules 2007, 12, 1679–1719. [Google Scholar] [CrossRef] [PubMed]
  104. Tasioula-Margari, M.; Okogeri, O. Isolation and characterization of virgin olive oil phenolic compounds by HPLC/UV and GC-MS. J. Food Sci. 2001, 66, 530–534. [Google Scholar] [CrossRef]
  105. Rojas, L.B.; Quideau, S.; Pardon, P.; Charrouf, Z. Colorimetric evaluation of phenolic content and GC-MS characterization of phenolic composition of alimentary and cosmetic argan oil and press cake. J. Agric. Food Chem. 2005, 53, 9122–9127. [Google Scholar] [CrossRef] [PubMed]
  106. Saitta, M.; lo Curto, S.; Salvo, F.; di Bella, G.; Dugo, G. Gas chromatographic-tandem mass spectrometric identification of phenolic compounds in Sicilian olive oils. Anal. Chim. Acta 2002, 466, 335–344. [Google Scholar] [CrossRef]
  107. Kumari, S.; Stevens, D.; Kind, T.; Denkert, C.; Fiehn, O. Applying in-silico retention index and mass spectra matching for identification of unknown metabolites in accurate mass GC-TOF mass spectrometry. Anal. Chem. 2011, 83, 5895–5902. [Google Scholar] [CrossRef] [PubMed]
  108. Menikarachchi, L.C.; Hill, D.W.; Hamdalla, M.A.; Mandoiu, II; Grant, D.F. In silico enzymatic synthesis of a 400,000 compound biochemical database for nontargeted metabolomics. J. Chem. Inf. Model. 2013, 53, 2483–2492. [Google Scholar]

