Article

Genetic Variability and Population Structure of the Potential Bioenergy Crop Miscanthus sinensis (Poaceae) in Southwest China Based on SRAP Markers

1
Grassland Science Department, Sichuan Agricultural University, Ya'an 625014, China
2
Agronomy Department, University of Florida, Gainesville, FL 32610, USA
3
Grassland Institute, China Agricultural University, Beijing 100193, China
*
Author to whom correspondence should be addressed.
Molecules 2014, 19(8), 12881-12897; https://doi.org/10.3390/molecules190812881
Submission received: 28 June 2014 / Revised: 12 August 2014 / Accepted: 13 August 2014 / Published: 21 August 2014
(This article belongs to the Section Molecular Diversity)

Abstract

:
The genus Miscanthus has great potential as a biofuel feedstock because of its high biomass, good burning quality, environmental tolerance, and good adaptability to marginal land. In this study, the genetic diversity and the relationship of 24 different natural Miscanthus sinensis populations collected from Southwestern China were analyzed by using 33 pairs of Sequence Related Amplified Polymorphism (SRAP) primers. A total of 688 bands were detected with 646 polymorphic bands, an average of 19.58 polymorphic bands per primer pair. The average percentage of polymorphic loci (P), gene diversity (H), and Shannon’s diversity index (I) among the 24 populations are 70.59%, 0.2589, and 0.3836, respectively. The mean value of total gene diversity (HT) was 0.3373 ± 0.0221, while the allelic diversity within populations (HS) was 0.2589 ± 0.0136 and the allelic diversity among populations (DST) was 0.0784. The mean genetic differentiation coefficient (Gst = 0.2326) estimated from the detected 688 loci indicated that there was 76.74% genetic differentiation within the populations, which is consistent with the results from Analysis of Molecular Variance (AMOVA) analysis. Based upon population structure and phylogenetic analysis, five groups were formed and a special population with mixed ancestry was inferred indicating that human-mediated dispersal may have had a significant effect on population structure of M. sinensis. Evaluating the genetic structure and genetic diversity at morphological and molecular levels of the wild M. sinensis in Southwest China is critical to further utilize the wild M. sinensis germplasm in the breeding program. The results in this study will facilitate the biofuel feedstock breeding program and germplasm conservation.

Graphical Abstract

1. Introduction

The genus Miscanthus is comprised of C4 perennial rhizomatous grasses, originated from Eastern Asia. Owing to high biomass productivity [1], low-nutrient input [2,3], and high water-use efficiencies [4], Miscanthus have attracted considerable attention as one of the most promising non-food bioenergy crops. There are about 10-15 Miscanthus species distributed worldwide, of which seven are native to China [5,6,7,8]. Since the 1970s, this genus, specifically M. × giganteus, has been intensively studied in Europe as a biomass feedstock [7,9,10]. However, M. × giganteus is propagated by plant rhizomes or tissue culture and does not produce fertile flowers or seeds, and its production is heavily limited by its natural sterility and a narrow genetic base [11]. As a progenitor of M. × giganteus, M. sinensis is propagated by seeds which is a favorable trait for crop adoption and provides a comparable yield in some places and could be a valuable genetic resource for biofuel crop domestication and improvement [6,12]. Based on the previous tests of drought and cold tolerance of M. sinensis in Europe, a much broader range of adaptation than M. × giganteus was found in this diploid species [1,11]. So with M. sinensis it is considered possible to breed varieties with similar or better yield but higher tolerance for frost and drought than M. × giganteus. Besides, it can be used in crosses to create new cultivars of M. × giganteus.
Molecular markers are essential tools for germplasm evaluation, genetic analysis, and marker-assisted breeding for crop improvement. Employing molecular markers, such as Sequence Related Amplified Polymorphism (SRAP), Amplified Fragment Length Polymorphism (AFLP), Inter-Simple Sequence Repeats (ISSR) and Simple Sequence Repeats (SSR) [13,14,15,16,17,18,19] to estimate genetic variation within species could assist the breeding program for parental and breeding line selection and desirable traits. SRAP is recognized as a new and useful molecular marker system because of its high reproducibility, low cost, and no requirement of prior knowledge of target sequences [20]. Up to now, SRAP markers have been successfully used for evaluation of genetic diversity for Carthamus tinctorius, Cucurbita pepo, buchloe dactyloides, and Solanum lycopersicon [21,22,23,24] and genetic map construction for Gossypium hirsutum and Triticum aestivum [25,26].
In recent years, many reports on Miscanthus were published showing the abundant resources distributed in China [12,27,28,29]. Zhao et al. and Clark et al. revealed the population structure of M. sinensis native to China using SSR and SNP makers respectively. Xu et al. used 20 pairs of EST-SSR makers of sorghum to analyze 26 populations of M. sinensis from Southwest China, indicating a high genetic diversity and the existence of a gene flow in M. sinensis populations in this area. However, the SSR markers used in that study were mainly derived from the non-coding regions, which may not be able to provide sufficient evidence to reveal the diversity and differentiation of M. sinensis in Southwest China; therefore, SRAP markers, derived from the coding region, were used in this study. Southwest China, as one of the 34 biodiversity hot spots around the World, has abundant wildlife resources [30]. It is crucial to evaluate the genetic structure and genetic diversity of the wild M. sinensis germplasm, which is widely distributed in Southwest China and to eventually utilize this valuable germplasm for crop improvement. However, there are no thorough studies on the genetic diversity and population structure of the germplasm distributed in Southwest China. Therefore, in this study, we evaluated the genetic diversity and population structure of 24 M. sinensis natural populations collected in Southwest China using SRAP markers to facilitate the conservation of the Miscanthus germplasm and breeding in the near future.

2. Results and Discussion

2.1. Polymorphism of SRAP Markers

Six accessions of M. sinensis, which have significant differences among the morphological characterization and geographic location, were selected to screen 100 pairs of SRAP primers. In total, 33 of them generated robust discernible bands (Table 1). These 33 SRAP primer pairs were then used to genotype the whole collection of 260 individuals. In total, 688 bands were generated and 646 (93.90%) were polymorphic. The number of bands per primer pairs ranged from 13 to 30, with an average of 20.58 bands, of which 19.58 in average were polymorphic. Primer pairs Me6 + em10 amplified the most number of polymorphic bands (30) while Me7 + em1 amplified the least number of polymorphic bands (9). The polymorphic information content (PIC) values ranged from 0.23 (Me3 + em5) to 0.41 (Me4 + em10) with a mean of 0.34, demonstrating a good discriminatory capacity (Table 1).

2.2. Genetic Diversity and AMOVA Analysis

The 24 wild distribution populations were comprised of 260 individuals which had a varied genetic diversity reflected by the three main genetic diversity parameters including percentage of polymorphic bands (P), Nei’s [31] gene diversity (H), and Shannon’s Information Index of Diversity (I). Among the 24 populations, the P value ranged from 21.22% (Pop12) to 84.30% (Pop15), with an average of 70.59%. The H value ranged from 0.0787 (Pop12) to 0.3052 (Pop15), with an average of 0.2589 at the population level. The variation trend of the I value was similar to the other two parameters, with an average of 0.3836 (Table 2). The total numbers of P, H and I were 93.90%, 0.3377 and 0.5032 within species, respectively. The genetic data exhibited a high level of genetic diversity within M. sinensis species from southwest China.
Table 1. Primer sequences amplification information of the SRAP markers.
Pirmer PairsSequence 5'→3'Total Number of BandsNumber of Polymorphic BandsPercentage of Polymorphic Bands (%)Polymorphic Information Content (PIC)
Me1 + em3TGAGTCCAAACCGGATA
GACTGCGTACGAATTGAC
1515100.000.33
Me1 + em8TGAGTCCAAACCGGATA
GACTGCGTACGAATTCTG
161381.250.34
Me1 + em10TGAGTCCAAACCGGATA
GACTGCGTACGAATTCAG
2121100.000.38
Me2 + em1GACTGCGTACGAATTTGC
GACTGCGTACGAATTAAT
2121100.000.39
Me2 + em9GACTGCGTACGAATTTGC
GACTGCGTACGAATTCGA
171482.350.28
Me2 + em10GACTGCGTACGAATTTGC
GACTGCGTACGAATTCAG
292896.550.40
Me3 + em5TGAGTCCAAACCGGAAT
GACTGCGTACGAATTACC
181583.330.23
Me3 + em9TGAGTCCAAACCGGAAT
GACTGCGTACGAATTCGA
181794.440.31
Me3 + em10TGAGTCCAAACCGGAAT
GACTGCGTACGAATTCAG
2424100.000.34
Me4 + em1TGAGTCCAAACCGGACC
GACTGCGTACGAATTAAT
1616100.000.28
Me4 + em7TGAGTCCAAACCGGACC
GACTGCGTACGAATTCAA
222195.450.35
Me4 + em9TGAGTCCAAACCGGACC
GACTGCGTACGAATTCGA
201890.000.29
Me4 + em10TGAGTCCAAACCGGACC
GACTGCGTACGAATTCAG
201995.000.41
Me5 + em2TGAGTCCAAACCGGAAG
GACTGCGTACGAATTTGC
211990.480.30
Me5 + em4TGAGTCCAAACCGGAAG
GACTGCGTACGAATTTGA
191789.470.31
Me5 + em8TGAGTCCAAACCGGAAG
GACTGCGTACGAATTCTG
2525100.000.38
Me5 + em10TGAGTCCAAACCGGAAG
GACTGCGTACGAATTCAG
2323100.000.33
Me6 + em7TGAGTCCAAACCGGTAA
GACTGCGTACGAATTCAA
181794.440.34
Me6 + em8TGAGTCCAAACCGGTAA
GACTGCGTACGAATTCTG
272385.190.25
Me6 + em10TGAGTCCAAACCGGTAA
GACTGCGTACGAATTCAG
3030100.000.38
Me7 + em1TGAGTCCAAACCGGTCC
GACTGCGTACGAATTAAT
13969.230.28
Me7 + em5TGAGTCCAAACCGGTCC
GACTGCGTACGAATTACC
242291.670.33
Me7 + em8TGAGTCCAAACCGGTCC
GACTGCGTACGAATTCTG
161593.750.33
Me7 + em10TGAGTCCAAACCGGTCC
GACTGCGTACGAATTCAG
242395.830.39
Me8 + em5TGAGTCCAAACCGGTGC
GACTGCGTACGAATTACC
2222100.000.37
Me8 + em7TGAGTCCAAACCGGTGC
GACTGCGTACGAATTCAA
191894.740.40
Me8 + em9TGAGTCCAAACCGGTGC
GACTGCGTACGAATTCGA
2323100.000.32
Me9 + em1TGAGTCCAAACCGGTAG
GACTGCGTACGAATTAAT
252496.000.33
Me9 + em5TGAGTCCAAACCGGTAG
GACTGCGTACGAATTACC
181688.890.36
Me9 + em8TGAGTCCAAACCGGTAG
GACTGCGTACGAATTCTG
171588.240.34
Me9 + em9TGAGTCCAAACCGGTAG
GACTGCGTACGAATTCGA
211990.480.36
Me10 + em1TGAGTCCAAACCGGTTG
GACTGCGTACGAATTAAT
222195.450.38
Me10 + em2TGAGTCCAAACCGGTTG
GACTGCGTACGAATTTGC
242395.830.38
Total 688646
Mean 20.8519.5893.270.34
Table 2. Genetic diversity of M. sinensis wild populations.
Population IdentitySample SizeHIP
Pop1150.27120.406277.91%
Pop2130.29390.435179.80%
Pop3120.28770.426177.76%
Pop4130.28520.423778.78%
Pop5110.27270.404273.98%
Pop680.25990.383068.46%
Pop7110.28490.420676.60%
Pop8100.27920.412774.71%
Pop980.27340.403573.11%
Pop10120.27990.413075.00%
Pop1190.25800.381970.06%
Pop1250.07870.116221.22%
Pop13150.27730.412277.91%
Pop1450.24800.362462.79%
Pop15180.30520.454084.30%
Pop16140.28280.420979.22%
Pop17160.25910.391077.91%
Pop18110.27160.405276.45%
Pop1980.26790.393069.04%
Pop20150.27310.409078.49%
Pop21120.27080.402475.00%
Pop2260.23600.348462.65%
Pop2360.21140.311655.81%
Pop2470.18470.270047.24%
Mean 0.25890.383670.59%
Within Species2600.33770.503293.90%
Note: H, Nei’s gene diversity; P, Percentage of Polymorphic Bands; I, Shannon’s Information Index of Diversity.
The total gene diversity (HT) was 0.3373 ± 0.0221, while the gene diversity within populations (HS) was 0.2589 ± 0.0136 and the gene diversity among populations (DST) were 0.0784. The mean genetic differentiation coefficient (GST = 0.2326) estimated from the 688 bands indicated that there were 76.74% genetic variation within populations. These results demonstrated that the accessions had a higher level of genetic variation within populations than among them. The AMOVA analysis (Table 3) of the M. sinensis wild populations showed similar results that both the genetic variations within (86.0%) and among (14.0) populations were significant. In addition, there was a high frequency of gene flow (Nm = 1.6493) between populations, indicating there were more than one effective immigrants from one population into another at each generation.
Table 3. AMOVA analysis of variance distribution with and amoung M. sinensis wild populations.
SourceDegree of FreedomSum of SquaresSummary of MatchesPercentage of Variation
Among Pops236468.464281.23814%
Within Pops23624162.059102.38286%
Total25930630.523100%
Miscanthus is widely distributed around the world, although its main distribution area or diversity center is in China [18,32]. Knowing the relationship and population structure of M. sinensis is important for their conservation and utilization [15]. In this study, the high level of genetic diversity of M. sinensis from southwest China was revealed by SRAP markers, which are similar to the previous results with EST-SSR, SSR and AFLP markers [9,12,18]. Meanwhile, SRAP analysis indicated higher genetic variation (76.74%) existed within populations than among populations, which is in agreement with the results in other grass species assessed by allozymes, ISSR, RAPD, SSR, and EST-SSR [12,33,34,35,36,37,38] and in M. sinensis of China assessed by SNP and SSR makers [18,32]. The main factors determining the plant population genetic structure include the mating and reproduction system, selection pressure, adaptation, and geographic locations [39]. The genetic recombination promotes genetic diversity within populations [40]. In plants, gene flow events can be initiated through pollen or seed. M. sinensis is an out-crossing species that can lead to a strong gene flow (Nm = 1.6493) and introgression among populations, so it is reasonable that the genetic variation within populations is greater than that among populations [41,42].

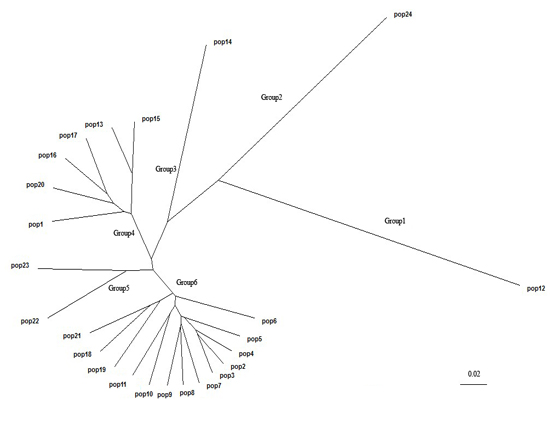
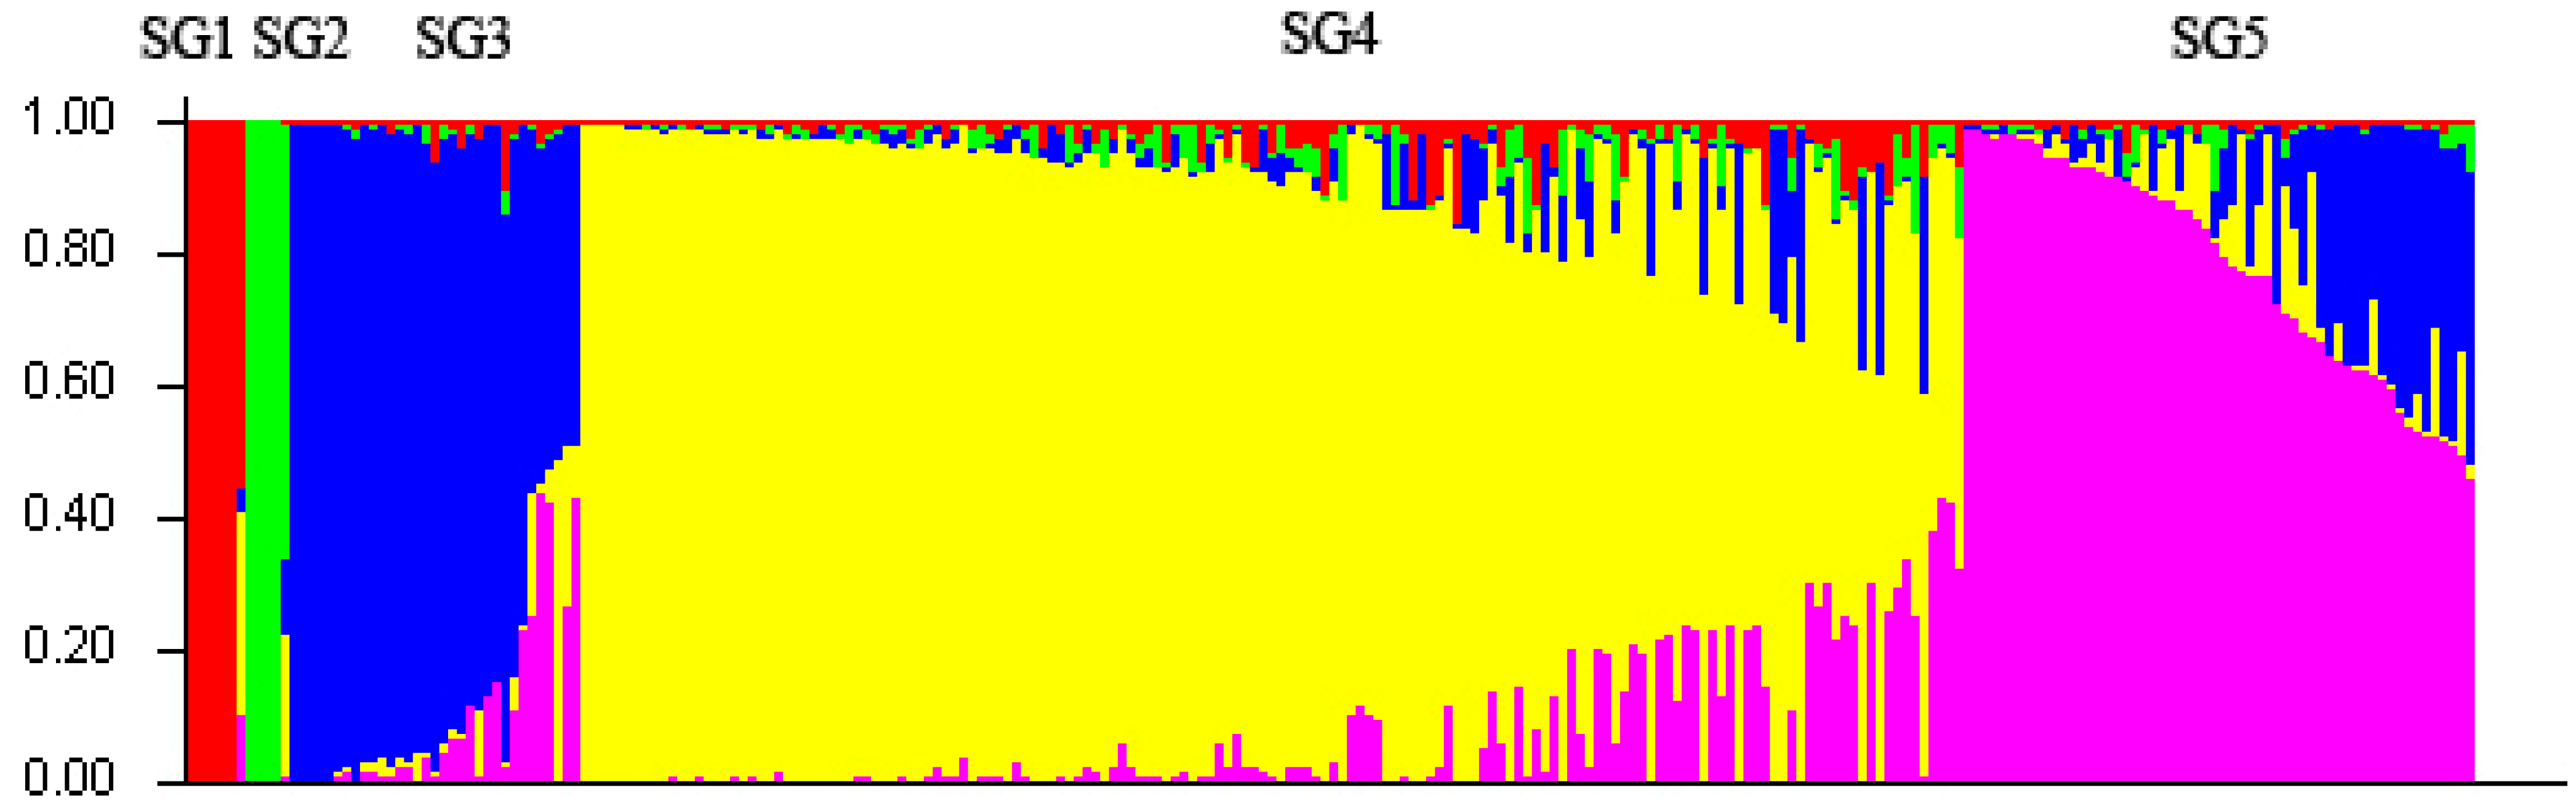
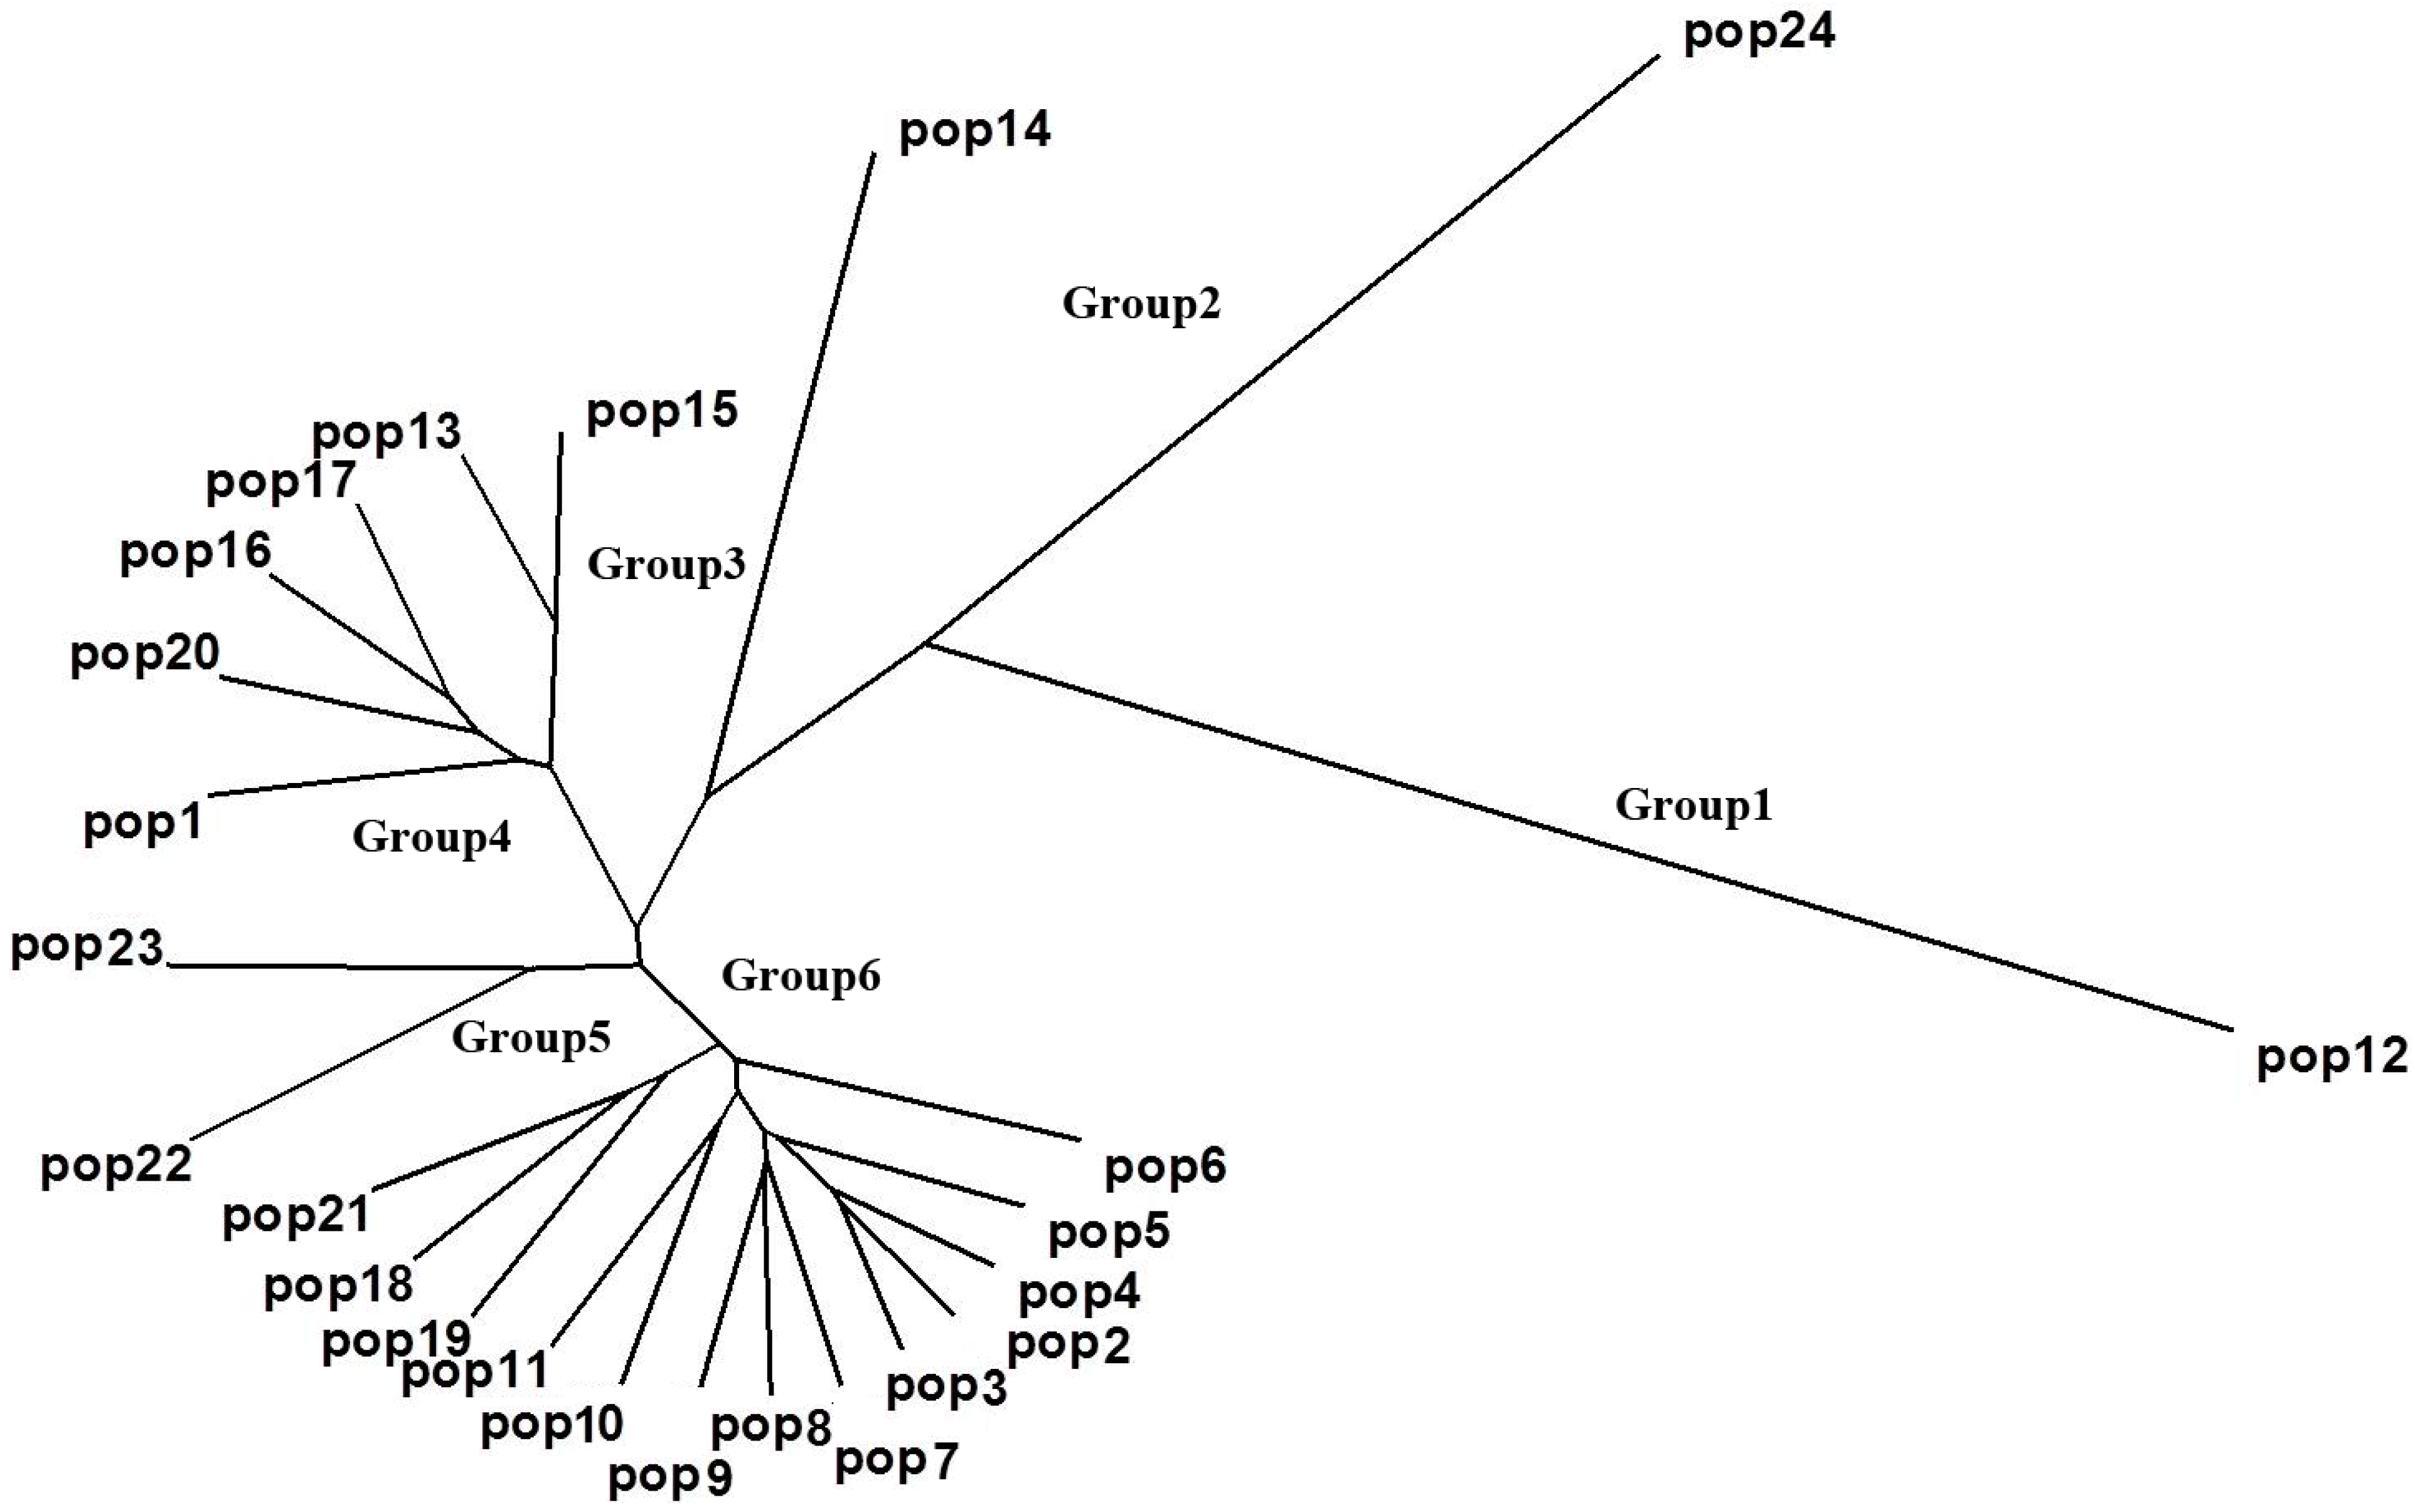
2.3. Population Structure and Cluster Analysis

The population structure of the 260 individuals was estimated under the Hardy-Weinberg Equilibrium by using STRUCTURE V2.3.3 software. Based on maximum likelihood and delta K (∆K) values, the number of optimum subgroups was five (Figure 1). By using a membership probability threshold (Q) of 0.60, majority of the individuals were clearly assigned to specific groups. Among them, 6 individuals were assigned to subgroup (SG) 1 with the accessions mainly collected from Pop24; 5 individuals to SG2 with the accessions mainly collected from Pop12; 27 individuals to SG3 with the accessions mainly collected from Pop13 and Pop15; 150 individuals to SG4 with the accessions mainly collected from Pop2, Pop3, Pop4, Pop5, Pop6, Pop7, Pop8, Pop9, Pop10, Pop11, Pop14, Pop18, Pop19, Pop21, Pop22, Pop23; 48 individuals to SG5 with the accessions mainly collected from Pop1, Pop16, Pop17 and Pop20; 24 individuals were retained in the admixed group (Table S1).
Figure 1. Five subgroups of 260 M. sinensis accessions inferred from STRUCTURE analysis. The vertical coordinate of each subgroup indicates the membership coefficients for each individual. Red zone: SG1; Green zone: SG2; Blue zone: SG3; Yellow zone: SG4; Pink zone: SG5.
Molecules 19 12881 g001
The genetic similarities (GS) of 260 individuals ranged from 0.565 to 0.972 with an average of 0.659 which showed a high level of genetic variation range among the accessions. The Un-weighted Pair-group Method with Arithmetic mean (UPGMA) dendrogram based on GS data obviously revealed that when at the genetic similarity coefficient value of 0.659, five major clusters were formed and group 1 accessions were mainly collected from the Yuxi area of Yunnan. The genotypes of group 2 were primarily collected from Zigong and Jian’ge in Sichuan. Group 3 contained mostly accessions from Jiangyou and Guangyuan. Group 4 accessions were mainly collected from Yaan, Daying, Banan and Zunyi (Figure S1). The rest of the accessions assigned to group 5. The results from the cluster analysis were similar with those from the structure analysis.
The genetic distances (GD) among the 24 populations were estimated by Nei’s [43] unbiased measure, which could obviously reveal the genetic relationship. The GD between Pop2 from Bifengxia and Pop3 from Baoxing was the lowest (0.028), and the distance between Pop12 from Zigong and Pop24 from Yuxi was the highest (0.292) with the mean of 0.097 (Table S2). The UPGMA dendrogram based on GD data clearly showed the relationships among the 24 populations (Figure 2), which was nearly congruent with the previous cluster analysis of 260 individuals. However, in this result, we found that a new group (Group 5) including Pop22 and Pop23 collected from Guizhou. Throughout the results of the two methods at different levels, we found that combining the analysis is the best strategy to reveal the genetic structure of M. sinensis in Southwestern China.
Figure 2. Dendrogram of 24 M. sinensis populations based on GD data by UPGMA cluster analysis.
Molecules 19 12881 g002
Apparently, Pop12 and Pop24 were differentiated from the other populations in both Structure and UPGMA analysis. The main reason could be the distinct geographic isolation between this two and the rest populations. In addition, Pop12 has the lowest genetic diversity parameters which are P (21.22%), H (0.0787), and I (0.1162), and a low gene flow exists between Pop12 and other populations. Furthermore, Pop12 has a narrow distribution range in this area and almost no other M. sinensis plants were found within a range of 5 km around it. Therefore, a habitat fragmentation was formed as influenced by founder effect.
Through the structure analysis, 14 out of 260 individuals with mixed ancestry were all from Pop16. In principle, all of the genetic material of the sampled individuals comes from one or more of K unobserved populations with each population characterized by a set of allele frequencies at each locus. When individuals have mixed ancestry, this means that each genotyped allele comes from one or more populations. We synthesized geographic information to analysis the accessions from Pop16 and found that they all collected along with the G42 highway in China which is the only entrance to the Dead Sea of China located in Da Ying County. The Dead Sea of China is a famous scenic spot where the total number of tourists is approximately 3 million per year. The huge traffic flow and the complex environment could help the seed spread widely. Hence a high gene flow occurred in this area and the plants there had a mixed ancestry. Although some researchers think these man-made factors contribute to the long term survival of populations, this is controversial [44], as several studies [45,46,47,48] indicate that they should not be neglected because those factors accelerate the loss of genetic variability through random genetic drift [49].
The previous clustering result of M. sinensis from southwest China assessed using SSR makers [12] was different from the dendrogram that resulted from SRAP makers. These differences could be due to the different DNA segment targets of SSR and SRAP makers. The SSR have a random distribution within the genome, while the target locus of SRAP is mainly in open reading frame regions [20,50]. SSRs mostly exists in non-genic regions, could be in genic regions as well, but with low frequency [50,51]. In different plant individuals, the number of repeat units varies, but the flanking sequence is conserved around the SSR. The numbers of loci studied and their coverage of the genome wide are important in obtaining reliable estimates of genetic relationships between populations and within population [52]. Although, both SRAP and SSR distinguished intraspecific taxa with similar great discriminating power, the average numbers of bands generated by each primer pair of SSR (14.80) [12] were much lower than that of SRAP (20.85). Therefore, we considered that SRAP was more efficient than SSR for assessing the genetic diversity of large numbers of M. sinensis accessions. In total, as widely used PCR-based markers, SRAP has advantages over SSR markers, since no prior knowledge of target sequences is required which make it to be widely utilized.

3. Experimental Section

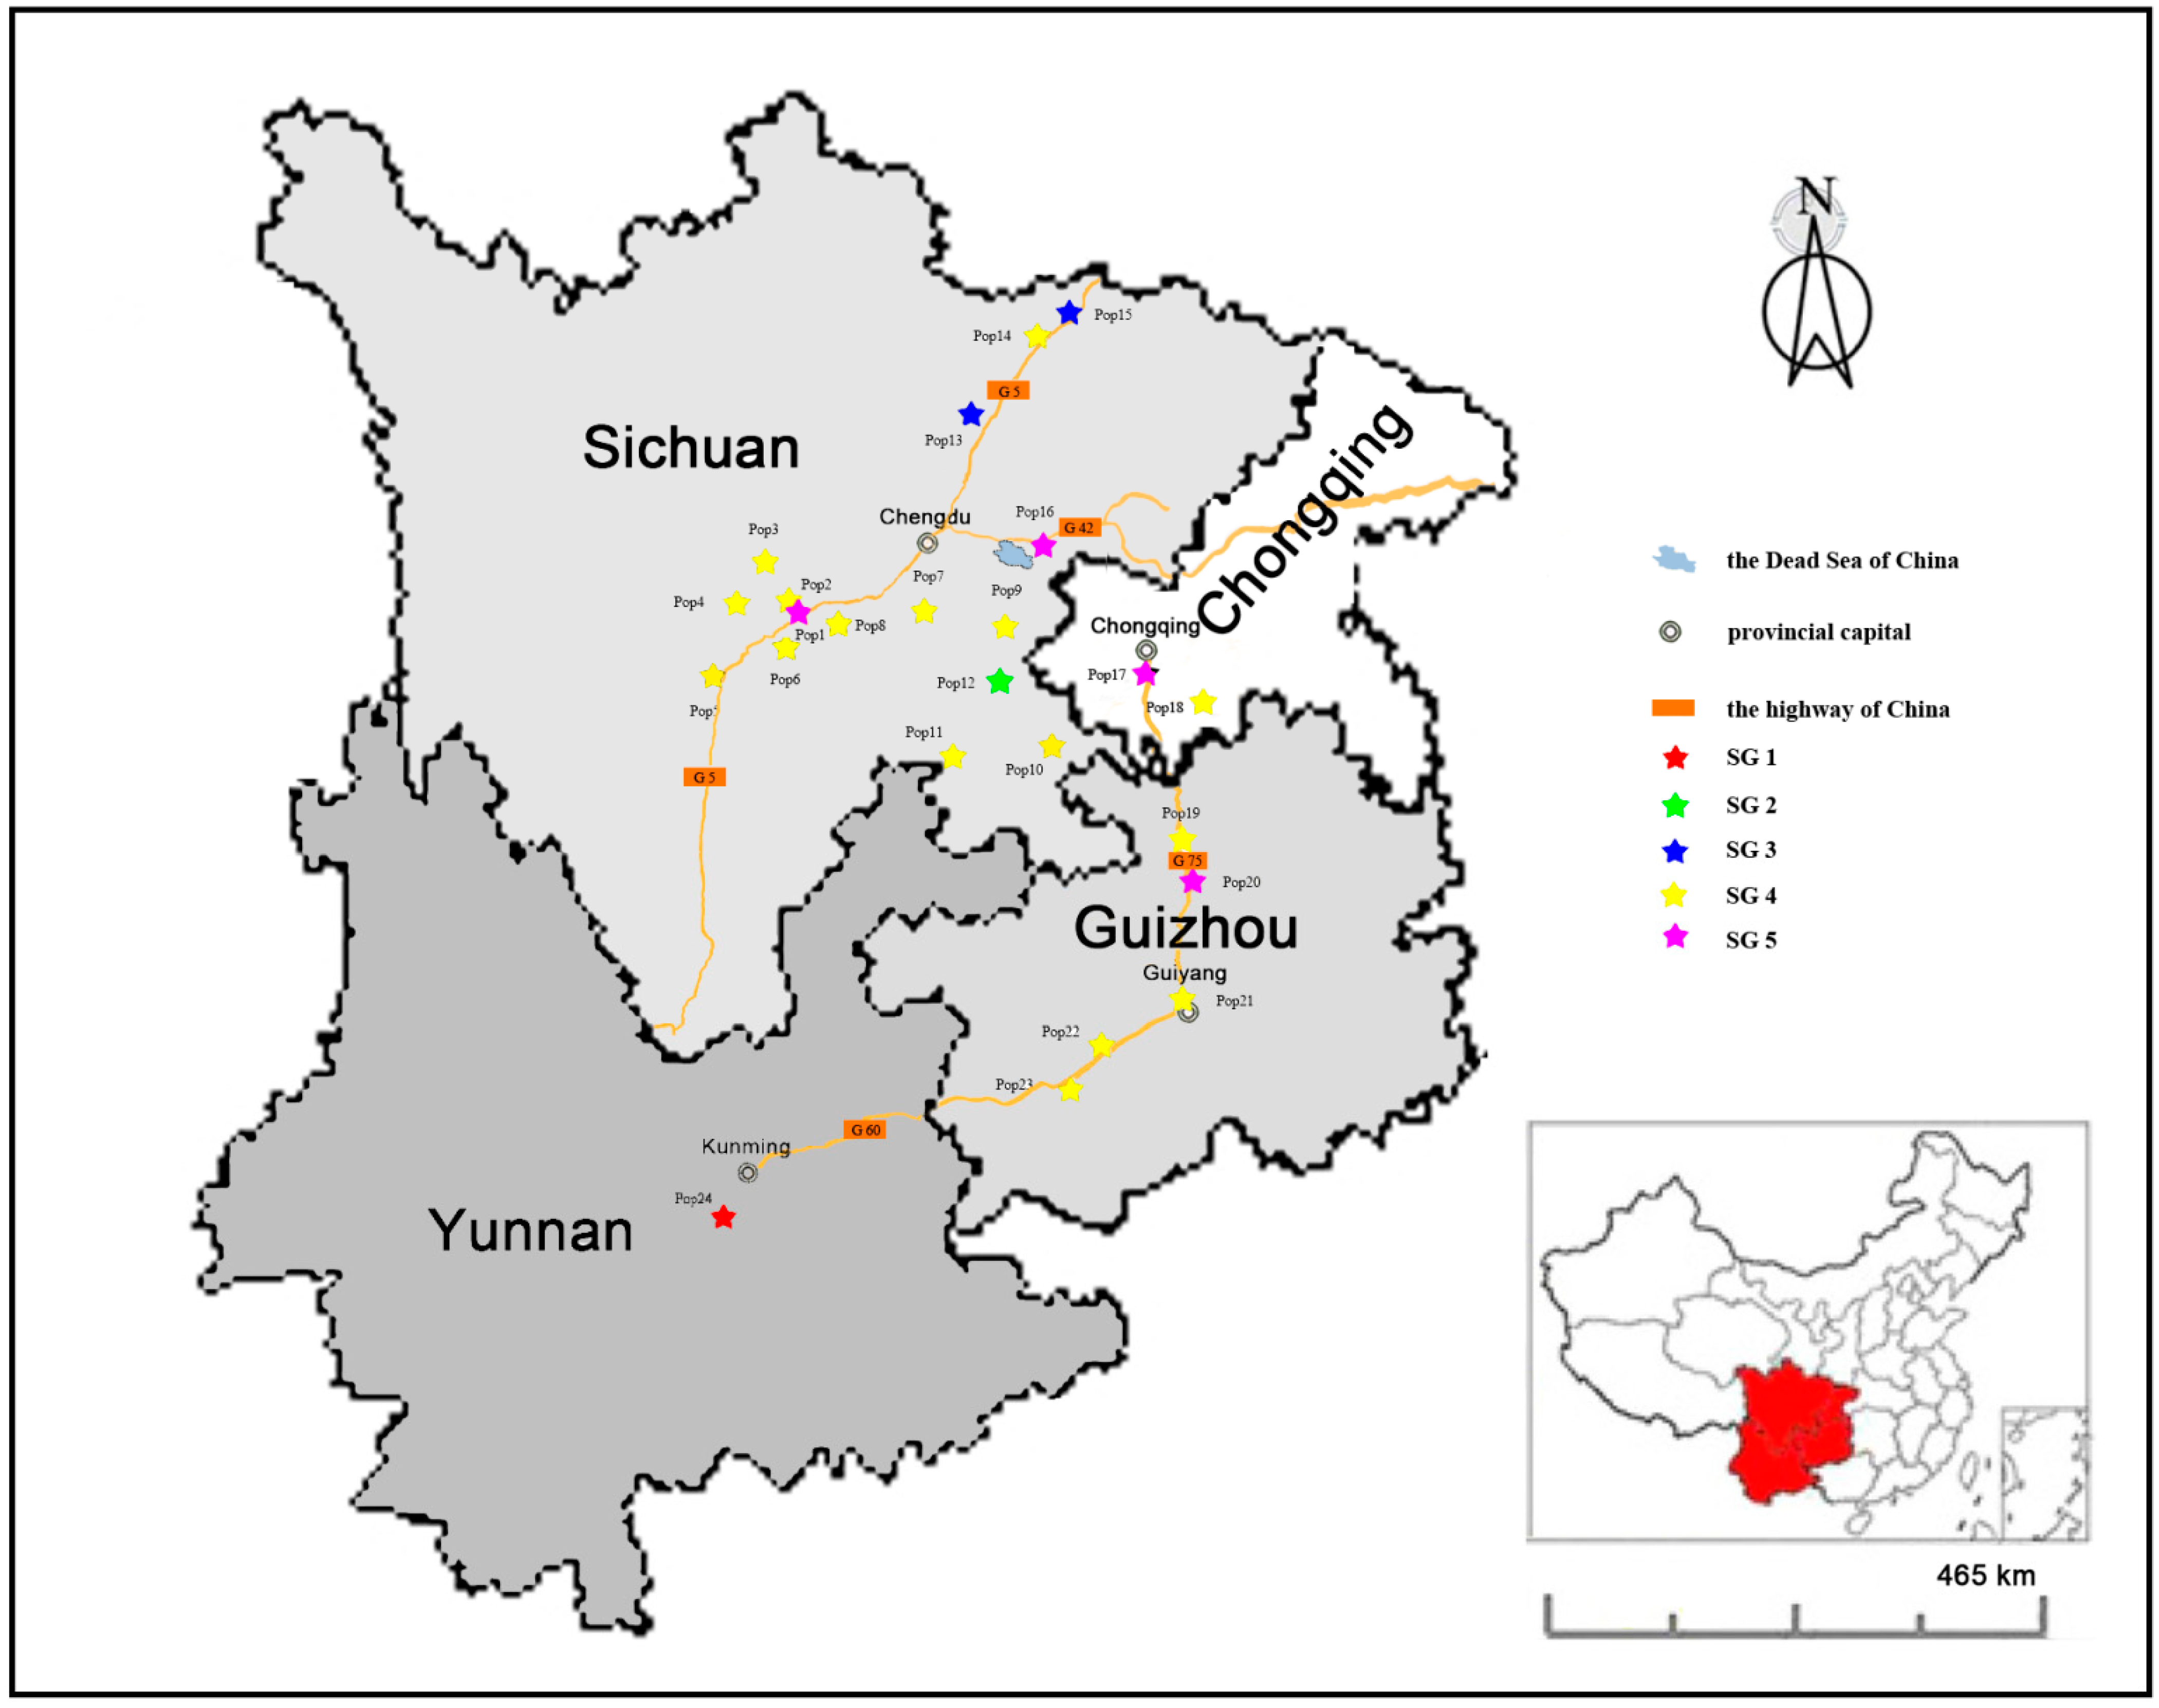
3.1. Plant Material Collection

The experimental materials consisted of 260 individuals of M. sinensis collected from 24 natural populations in Sichuan, Chongqing, Guizhou, and Yunnan provinces in 2010 (Table 4).
The sampling locations were selected according to M. sinensis habitats based on geographic location and topography. All of approaches used in collecting samples are based on Xu’s method [12] (Figure 3). Within each population, the numbers of appropriate representative individuals were selected based on the size of each population.
Table 4. Geographic information of the 24 populations of M. sinensis.
Population IdentitySample SizeRegionAltitude (m)Latitude (N)Longitude (E)Habital
Pop115Ya’an67729°58'39.3''102°59'24.5''Glade at hillside
Pop213Bi Feng Xia98930°07'25.5''102°59'48.6''Highway side
Pop312Bao Xing125330°16'05.7''102°49'19.5''River beach
Pop413Erlang Mountain209129°51'19.8''102°18'58.3''Glade at hillside
Pop511Tuowu Mountain163028°59'52.9''102°18'12.9''Glade at hillside
Pop68Niba Mountain163629°39'46.1''102°36'25.0''Glade at hillside
Pop711Renshou47130°01'05.9''103°58'21.8''Hillside
Pop810Hongya49329°51'22.6''103°14'03.5''Dam
Pop98Zizhong35029°48'50.4''104°42'28.6''Glade in orangery
Pop1012Luzhou24128°51'01.9''105°18'19.9''Rice field ridge
Pop119Yibin31728°45'15.4''104°36'48.5''Shrub at riverside
Pop125Zigong35329°24'21.9''104°49'01.4''Grassland
Pop1315Jiangyou68731°58'06.8''105°04'38.4''Highway slope
Pop145Jian’ge61132°13'25.0''105°35'17.9''Shrub at hillside
Pop1518Guangyuan66832°39'56.5''105°56'21.4''Shrub at hillside
Pop1614Daying32730°36'32.3''105°13'59.6''Shrub
Pop1716Banan47629°25'20.6''106°34'37.5''Forest edge at hillside
Pop1811Nanchuan57929°10'09.3''107°06'44.1''Shrub at hillside
Pop198Dabai45528°32'51.8''106°51'09.6''Highway slope
Pop2015Zunyi91427°59'11.5''106°52'25.1''Coniferous edge
Pop2112Guiyang126826°28'57.2''106°27'35.8''Bare rock
Pop226Zhenning128426°04'49.9''105°46'55.9''Glade
Pop236Huangguoshu94625°58'43.6''105°39'47.1''Forest edge
Pop247Yuxi172124°11'53.2''102°28'29.9''Hillside
Total number of individuals260

3.2. DNA Extraction

Fresh young leaves from each sampled individual were collected and dried by desiccant (silicagel self indicator). Genomic DNA was extracted from the dried leaves using the Plant Genomic DNA kit (Tiangen®, Beijing, China) according to the manufacturer’s protocol. The quality and concentration of the DNA were determined by comparing the sample with known standards of lambda DNA on 0.8% (w/v) agarose gels. The isolated genomic DNA was diluted to 20 ng/μL and stored at −20 °C for PCR amplification.

3.3. Primer Selection and PCR-SRAP Amplification

SRAP primer sequences (Li and Qurios) [20] used in this study were synthesized by Shanghai Sangon Biological Engineering Technology & Service (Shanghai, China). For PCR amplification, the total volume of each PCR reaction was 20 μL, which contains 3 μL template DNA (20 ng/μL), 10 μL of Mix (10× reaction buffer, 2.0 mM Mg2+, 0.6 mM of each dNTPs, Tiangen), 0.8 μL primers (10 pmol/μL), 0.4 μL Golden DNA Polymerase (2.5 U/μL, Tiangen®) and 5 μL of ddH2O. Amplification was performed on a Peltier Thermal Cycler (DNA Engine®, Bio-Rad, Hercules, CA, USA) under the following conditions: 5 min at 94 °C, followed by 5 cycles at 94 °C for 1 min, 35 °C for 1 min, and 72 °C for 1 min, and then 35 cycles at 94 °C for 1 min, 50 °C for 1 min, and 72 °C for 1 min, extended at 72 °C for 10 min, then stored at 4 °C. The SRAP fragments were separated on 6% denatured polyacrylamide gels (acrylamide: bis-acrylamide 19:1, 1× TBE) and electrophoresis, later the gel were stained by AgNO3 solution and photographed by the Gel Doc XR system (Bio-Rad).
Figure 3. The geographical distribution of 24 populations of M. sinensis used in this study. The accessions were mainly sampled from four provinces, Sichuan, Chongqing, Guizhou and Yunnan in China. The different colors pentagram represents the five subgroups generated by STRUCTURE V2.3.3 software.
Molecules 19 12881 g003

3.4. Data Analysis

For the statistical analysis, the SRAP banding patterns which could be unambiguously scored across all the sampled populations were recorded manually for band presence (1) or absence (0), each of them was treated as an independent character regardless of its intensity. The discriminatory power of different SRAP primers was evaluated by means of polymorphic information content (PIC) [53]. The resulting present/absent data matrix was analyzed using POPGENE32 v.1.31 [54]. Assuming Hardy-Weinberg equilibrium, the genetic diversity was evaluated with three parameters: the percentage of polymorphic loci (P), Nei’s [31] gene diversity (H) and Shannon’s Information Index of Diversity (I). The total gene diversity was given as (HT) which was divided into gene diversity within populations (HS) and the gene diversity among populations (DST). These parameters were related according to the equation HT = HS + DST. The genetic differentiation coefficient (GST) was calculated as a ratio of DST/HT, which was used to measure the population differentiation. The genetic distance (GD) among 24 populations were also computed using the same program [43]. Gene flow was calculated as Nm = 0.5(1 − GST)/GST to estimate the level of gene drift among the populations [55]. Population structure of the 260 M. sinensis individuals was performed using STRUCTRE v2.3.4 software [56] with the ‘‘admixture model’’, burn-in period of 10,000 iterations and a run of 100,000 replications of Markov Chain Monte Carlo (MCMC) after burn in. For each run, 10 independent runs of STRUCTURE were performed with the number of clusters (K) varying from 1 to 11. Maximum likelihood and delta K (△K) values were used to determine the optimum number of subgroups [56,57]. For clustering analysis, the similarity coefficients were used to construct UPGMA (unweighted pair group method with arithmetic means) dendogram using SAHN (Sequential Agglomerative Hierarchical and Nested Clustering) module in the NTSYS-pc version2.10 software [58]. Genetic relationships among different M. sinensis populations were estimated using the Unweighted Pair-group Method with Arithmetic mean (UPGMA) cluster analysis based on the GD matrix. Analysis of molecular variance (AMOVA) was used to calculate variation among and within population using GenAlEx ver.6.41 [59].

4. Conclusions

SRAP markers were proved as useful tools in genetic diversity detection and population structure analysis. The 33 SRAP markers generated 688 bands with 646 as polymorphic bands. The average percentage of polymorphic bands (P), gene diversity (H), and Shannon’s diversity index (I) are 93.90%, 0.3377 and 0.5032 at species level respectively, indicating high level of genetic diversity. The mean genetic differentiation coefficient (Gst = 0.2326) estimated from 688 bands indicated that the larger genetic variation was found within populations which is consistent with the results calculated by the AMOVA analysis. In addition, there was a high frequency of gene flow (Nm = 1.6493) between populations, indicating there were more than one effective immigrant from one population into another at each generation. The population structure and phylogenetic analysis revealed five groups. Southwest China is located in one of the biodiversity hotspots of the world and the climate is variable. Additionally, M. sinensis is a cross-pollination plant, having complex genetic background and high heterozygosities. Hence, the genetic diversity and population structure analysis in the work reported here will facilitate genetic improvement and cultivar development with desired traits in further M. sinensis breeding programs.

Supplementary Materials

Supplementary materials can be accessed at: https://www.mdpi.com/1420-3049/19/8/12881/s1.

Supplementary File

Supplementary File 1

Acknowledgments

This work was supported by the National High-Technology Research and Development Program (863 Program) of China (No. 2012AA101801-02), the Earmarked Fund for the Modern Agro-Industry Technology Research System (#CARS-35-05) and the spring plan of Ministry of Education.

Author Contributions

Xin-Quan Zhang, Lin-Kai Huang, Xiao Ma and Yun-Wei Zhang conceived the project and designed the experiments. Gang Nie, Wen-Zhi Xu and Yan-Hong Yan performed the experiment. Gang Nie, Jian-Ping Wang and Hai-Dong Yan wrote the paper. All authors discussed the results and commented on the manuscript.

Conflicts of Interest

The authors declare no conflict of interest.

References

  1. John, C.C.B.; Lewandowski, I.; Andersson, B.; Basch, G.; Christian, D.G.; Kjeldsen, J.B.; Jorgensen, U.; Mortensen, J.V.; Riche, A.B.; Sshwarz, K.U.; et al. Performance of 15 Miscanthus genotypes at five sites in Europe. Agron. J. 2001, 93, 1013–1019. [Google Scholar] [CrossRef]
  2. Lewandowski, I.; John, C.C.B.; Scurlock, J.M.O.; Huisman, W. Miscanthus: European experience with a novel energy crop. Biomass Bioenergy 2000, 19, 209–277. [Google Scholar] [CrossRef]
  3. Heaton, E.A.; Long, S.P.; Voigt, T.B.; Jones, M.B.; John, C.B. Miscanthus for renewable energy generation: European Union experience and projections for Illinois. Mitig. Adapt. Strateg. Glob. Chang. 2004, 9, 433–451. [Google Scholar] [CrossRef]
  4. John, C.C.B.; Lewandowski, I.; Bangerth, F.; Jones, M.B. Comparative responses to water stress in stay-green, rapid and slow senescing genotypes of the biomass crop, Miscanthu. New Phytol. 2002, 154, 335–345. [Google Scholar] [CrossRef]
  5. Chen, S.L.; Renvoize, S.A. Miscanthus. In Flora of China; Science Press: Beijing, China, 2006; pp. 581–583. [Google Scholar]
  6. Jiang, J.X.; Wang, Z.H.; Tang, B.R. Development of novel chloroplast microsatellite markers for Miscanthus species (Poaceae). Am. J. Bot. 2012, 99, e230–e233. [Google Scholar] [CrossRef]
  7. Hodkinson, T.R.; Chase, M.W.; Lledó, M.D.; Salamin, N.; Renvoize, S.A. Phylogenetics of Miscanthus, Saccharum and related genera (Saccharinae, Andropogoneae, Poaceae) based on DNA sequences fromITS nuclear ribosomal DNA and plastid trnL intron and trnL-F intergenic spacers. J. Plant Res. 2002, 115, 381–392. [Google Scholar] [CrossRef]
  8. Swaminathan, K.; Alabady, M.S.; Varala, K.; Paoli, D.E.; Ho, I.; Rokhsar, D.S.; Arumuganathan, A.K.; Ming, R.; Green, P.J.; Meyers, B.C.; et al. Genomic and small RNA sequencing of Miscanthus × giganteus shows the utility ofsorghum as a reference genome sequence forAndropogoneae grasses. Genome Biol. 2010, 11, R12. [Google Scholar]
  9. Greef, J.M.; Deuter, M.; Jung, C. Genetic diversity of European Miscanthus species revealed by AFLP fingerprinting. Genet. Resour. Crop Evol. 1997, 44, 185–195. [Google Scholar] [CrossRef]
  10. Hodkinson, T.R.; Chase, M.W.; Takahashi, C.; Leitch, I.J.; Bennett, M.D.; Renvoize, S.A. The use of DNA sequencing (ITS and trnL-F), AFLP and fluorescent in situ hybridisation to study allopolyploid Miscanthus (Poaceae). Am. J. Bot. 2002, 89, 279–286. [Google Scholar] [CrossRef]
  11. Lewandowski, I.; Scurtock, J.M.O.; Lindvall, E.; Christou, M. The development and current status of perennial rhizomatous grasses as energy crops in the US and Europe. Biomass Bioenergy 2003, 25, 335–361. [Google Scholar] [CrossRef]
  12. Xu, W.Z.; Zhang, X.Q.; Huang, L.K.; Nie, G.; Wang, J.P. Higher genetic diversity and gene flow in wild populations of Miscanthus sinensis in southwest China. Biochem. Syst. Ecol. 2013, 48, 174–181. [Google Scholar] [CrossRef]
  13. Huang, L.K.; Bughrara, S.S.; Zhang, X.Q. Genetic diversity of switchgrass and its relative species in Panicum genus using molecular markers. Biochem. Syst. Ecol. 2011, 39, 685–693. [Google Scholar] [CrossRef]
  14. Huang, L.K.; Zhang, X.Q.; Xie, W.G. Molecular diversity and population structure of the forage grass Hemarthria compressa (Poaceae) in south China based on SRAP markers. Genet. Mol. Res. 2012, 11, 2441–2450. [Google Scholar] [CrossRef]
  15. Cai, Q.; Fan, Y.H.; Aitken, K.; Piperidis, G.; McIntyre, C.L.; Jackson, P. Assessment of the phylogentic relationships within the Saccharum complex using AFLP markers. Acta Agron. Sin. 2005, 31, 551–559. [Google Scholar]
  16. Hiroyoshi, I.; Takashi, K.; Yoshihiko, T. Genetic structure of Miscanthus sinensis ssp. condensates (Poaceae) on Mmiyake Island: Implications for revegetation of volcanically devastated sites. Ecol. Res. 2005, 20, 233–238. [Google Scholar] [CrossRef]
  17. Hodkinson, R.T.; Chase, W.M.; Renvoize, A.S. Characterization of a genetic resource collection for Miscanthus (Saccharinae, Andropogoneae, Poaceae) using AFLP and ISSR PCR. Ann. Bot. 2002, 89, 627–636. [Google Scholar] [CrossRef]
  18. Zhao, H.; Wang, B.; He, J.; Yang, J.; Pan, L.; Sun, D.F.; Peng, J.H. Genetic diversity and population structure of Miscanthus sinensis germplasm in China. PLoS One 2013, 8, e75672. [Google Scholar] [CrossRef]
  19. Huang, Y.; Li, F.; Chen, K.S. Analysis of diversity and relationships among Chinese orchid cultivars using EST-SSR markers. Biochem. Syst. Ecol. 2010, 38, 93–102. [Google Scholar] [CrossRef]
  20. Li, G.; Quiros, C.F. Sequence related amplified polymorphism (SRAP), a new marker system based on a simple PCR reaction: Its application to mapping and gene tagging in Brassica. Theor. Appl. Genet. 2011, 103, 455–461. [Google Scholar]
  21. Peng, S.; Feng, N.; Guo, M.; Chen, Y.; Guo, Q. Genetic variation of Carthamus tinctorius L. and related species revealed by SRAP analysis. Biochem. Syst. Ecol. 2008, 36, 531–538. [Google Scholar] [CrossRef]
  22. Ferriol, M.; Pico, B.; Nuez, F. Genetic diversity of a germplasm collection of Cucurbita pepo using SRAP and AFLP markers. Theor. Appl. Genet. 2003, 107, 271–282. [Google Scholar] [CrossRef]
  23. Budak, H.; Shearman, R.C.; Parmaksiz, I.; Dweikat, I. Comparative analysis of seeded and vegetative biotype buffalograsses based on phylogenetic relationship using ISSRs, SSRs, RAPDs and SRAPs. Theor. Appl. Genet. 2004, 109, 280–288. [Google Scholar]
  24. Comlekcioglu, N.; Simsek, O.; Boncuk, M.; Aka-Kacar, Y. Genetic characterization of heat tolerant tomato (Solanum lycopersicon) genotypes by SRAP and RAPD markers. Genet. Mol. Res. 2010, 9, 2263–2274. [Google Scholar] [CrossRef]
  25. Lin, Z.X.; Zhang, X.L.; Nie, Y.C. Construction of a genetic linkage map for cotton based on SRAP. Chin. Sci. Bull. 2003, 48, 2063–2068. [Google Scholar] [CrossRef]
  26. Suenaga, K.; Khairallah, M.; William, H.M.; Hoisington, D.A. A new intervarietal linkage map and its application for quantitative trait locus analysis of “gigas” features in bread wheat. Genome 2005, 48, 65–75. [Google Scholar]
  27. Zhong, Z.L.; Jiang, J.X.; Yang, L.; Yi, Z.L. Genetic diversity analysis of Miscanthus species by maize SSR primers. Prog. Mod. Biomed. 2009, 9, 2076–2079. [Google Scholar]
  28. Yang, C.D.; Zhang, X.; An, Y.H.; Yuan, L.Y. Preliminary survey on distribution characteristics and population density of Miscanthus sacchariflorus community in Hubei province. Soil Land Water Conserv. China 2009, 11, 19–20. [Google Scholar]
  29. Zhao, H.; Yu, J.Y.; Frank, M.Y.; Luo, M.C.; Peng, J.H. Transferability of microsatellite markers from Brachypodium distachyon to Miscanthus sinensis. J. Integr. Plant Biol. 2011, 53, 232–245. [Google Scholar] [CrossRef]
  30. Mittermeier, R.A.; Myers, N.; Mittermeier, C.G. Hotspots: Earth’s Biologically Richest and Most Endangered Terrestrial Ecoregions; Conservation International: Washington, DC, USA, 2000; pp. 1–432. [Google Scholar]
  31. Nei, M. Analysis of gene diversity in subdivided population. Proc. Natl. Acad. Sci. USA 1988, 70, 3321–3323. [Google Scholar] [CrossRef]
  32. Clark, L.V.; Brummer, J.E.; Hall, M.; Long, S.; Peng, J.H.; Yamada, T.; Yoo, J.H.; Yu, C.Y.; Zhao, H.; Sacks, E.J. A footprint of past climate change on the diversity and population structure of Miscanthus sinensis. Ann. Bot. 2014, 114, 97–107. [Google Scholar] [CrossRef]
  33. Liu, Z.L.; Li, S.; Yan, G.Q.; Song, Y.; Zhao, G.F. Genetic structure and intraspecific genetic polymorphisms in natural populations of Psathyrostachys huashanica. Acta Genet. Sin. 2001, 28, 769–777. [Google Scholar]
  34. Zhao, L.F.; Li, S.; Pan, Y.; Yang, G.Q.; Zhao, G.F. Population differentiation of Psathyrostachys huashanica along an altitudinal gradient detected by random amplified polymorphic DNA. Acta Bot. Boreali-Occidentalia Sin. 2001, 21, 391–400. [Google Scholar]
  35. Hang, Y.; Jin, Y.; Lu, B.R. Genetic diversity of the endangered species Psathyrostachys huashanica in China and its strategic conservation. J. Fudan Univ. (Nat. Sci.) 2004, 43, 260–266. [Google Scholar]
  36. Wang, L.; Yang, J.; Guo, J.; Zhao, G.F. Genetic structure and differentiation of Psathyrostachys huashanica populations detected with RAPD markers. Front. Biol. China 2005, 25, 719–726. [Google Scholar]
  37. Wang, L.; Guo, J.; Zhao, G.F. Genetic diversity of the endangered and endemic species Psathyrostachys huashanica natural populations using simple sequence repeats (SSRs) markers. Biochem. Syst. Ecol. 2006, 34, 310–318. [Google Scholar] [CrossRef]
  38. Ma, X.; Chen, S.Y.; Zhang, X.Q.; Bai, S.Q.; Zhang, C.B. Assessment of worldwide genetic diversity of Siberian wildrye (Elymus sibiricus L.) germplasm based on gliadin analysis. Molecules 2012, 17, 4424–4434. [Google Scholar] [CrossRef]
  39. Hamrick, J.L.; Godt, M.J.W. Allozyme diversity in plant species. In Plant Population Genetics, Breeding and Genetic Resources; Browm, A.H.D., Clegg, M.T., Kaher, A.L., Weir, B.S., Eds.; Sinauer Associates Inc.: Sunderland, MA, USA, 1989; pp. 43–63. [Google Scholar]
  40. Liu, W.X.; Liu, W.H.; Wu, J. Analysis of genetic diversity in natural populations of Psathyrostachys huashanica keng using microsatellite (SSR) markers. Agric. Sci. China 2010, 9, 463–471. [Google Scholar] [CrossRef]
  41. Wang, Z.R. Plant Allozyme Analysis; Science Press: Beijing, China, 1998. [Google Scholar]
  42. Arnold, M.L. Anderson’s paradigm: Louisiana Irises and the study of evolutionary phenomena. Mol. Ecol. 2000, 9, 1687–1698. [Google Scholar] [CrossRef]
  43. Nei, M. Estimation of average heterozygosity and genetic distance from a small number of individuals. Genetics 1978, 89, 583–590. [Google Scholar]
  44. Lande, R. Genetics and demography in biological conservation. Science 1988, 241, 1455–1460. [Google Scholar]
  45. Mills, L.S.; Smouse, P.E. Demographic consequences of inbreeding in remnant populations. Am. Nat. 1994, 144, 412–431. [Google Scholar]
  46. Frankham, R. Relationship of genetic variation to population size in wildlife. Conserv. Biol. 1996, 10, 1500–1508. [Google Scholar]
  47. Newman, D.; Pilson, D. Increased probability of extinction due to decreased genetic effective population size: Experimental populations of Clarkia pulchella. Evolution 1997, 51, 354–362. [Google Scholar] [CrossRef]
  48. Saccheri, I.; Kuussaari, M.; Kankare, M.; Vikman, P.; Fortelius, W.; Hanski, I. Inbreeding and extinction in a butterfly metapopulation. Nature 1998, 392, 491–494. [Google Scholar] [CrossRef]
  49. Hedrick, P.W. Genetics of Populations, 2nd ed.; Jones and Bartlett: Sudbury, MA, USA, 2000. [Google Scholar]
  50. Zietkiewicz, E.; Rafalski, A.; Labuda, D. Genome fingerprinting by simple sequence repeat (SSR) anchored polymerase chain reaction amplification. Genomics 1994, 20, 176–183. [Google Scholar] [CrossRef]
  51. Huang, L.K.; Zhang, X.Q.; Ma, X. Genetic differentiation among Hemarthria compressa populations in south China and its genetic relationship with H. japonica. Hereditas 2008, 145, 84–91. [Google Scholar] [CrossRef]
  52. Loarce, Y.; Gallego, R.; Ferrer, E. A comparative analysis of genetic relationships between rye cultivars using RFLP and RAPD markers. Euphytic 1993, 88, 107–115. [Google Scholar] [CrossRef]
  53. Roldán-Ruiz, I.; Dendauw, J.; van Bockstaele, E.; Depicker, A.; de Loose, M. AFLP markers reveal high polymorphic rates in ryegrasses (Lolium spp.). Mol. Breed. 2000, 6, 125–134. [Google Scholar] [CrossRef]
  54. Yeh, F.C.; Yang, R.C.; Boyle, T. POPGENE VERSION 1.31. Microsoft Windows-based Freeware for Population Genetic Analysis. Quick User Guide. Available online: http://www.ualberta.ca/~fyeh/popgene.pdf (accessed on 4 March 2014).
  55. Slatkin, M.; Barton, N.H. A comparison of three indirect methods for estimating average levels of gene flow. Evolution 1989, 43, 1349–1368. [Google Scholar] [CrossRef]
  56. Pritchard, J.K.; Stephens, M.; Donnelly, P. Inference of population structure from multilocus genotype data. Genetics 2000, 155, 945–959. [Google Scholar]
  57. Evanno, G.; Regnaut, S.; Goudet, J. Detecting the number of clusters of individuals using the software STRUCTURE: A simulation study. Mol. Ecol. 2005, 14, 2611–2620. [Google Scholar] [CrossRef]
  58. Rohlf, F.J. “NTSYS-pc 2.1”. Numerical Taxonomy and Multivariate Analysis System; Applied Biostatistics Inc.: New York, NY, USA, 1997. [Google Scholar]
  59. Peakall, R.; Smouse, P.E. GENALEX 6: Genetic analysis in Excel. Population genetic software for teaching and research. Mol. Ecol. Notes 2006, 6, 288–295. [Google Scholar] [CrossRef]
  • Sample Availability: Samples of the compounds are available from the authors.

