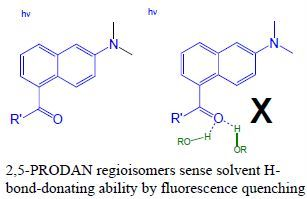
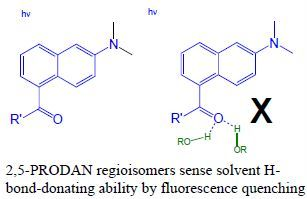
2,5-PRODAN Derivatives as Highly Sensitive Sensors of Low Solvent Acidity


Abstract
:
1. Introduction

2. Results and Discussion
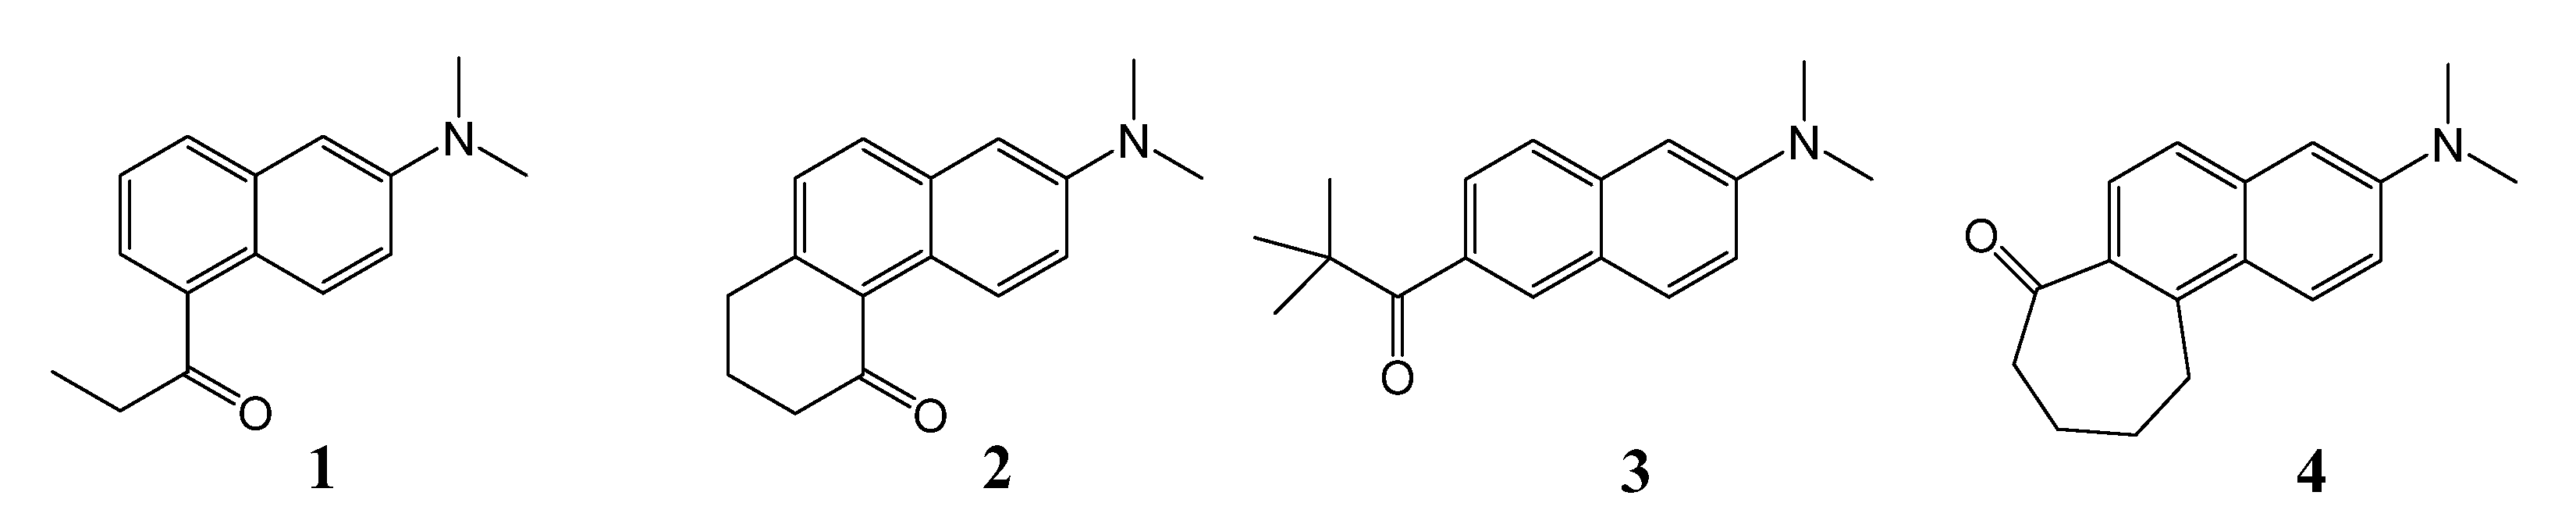
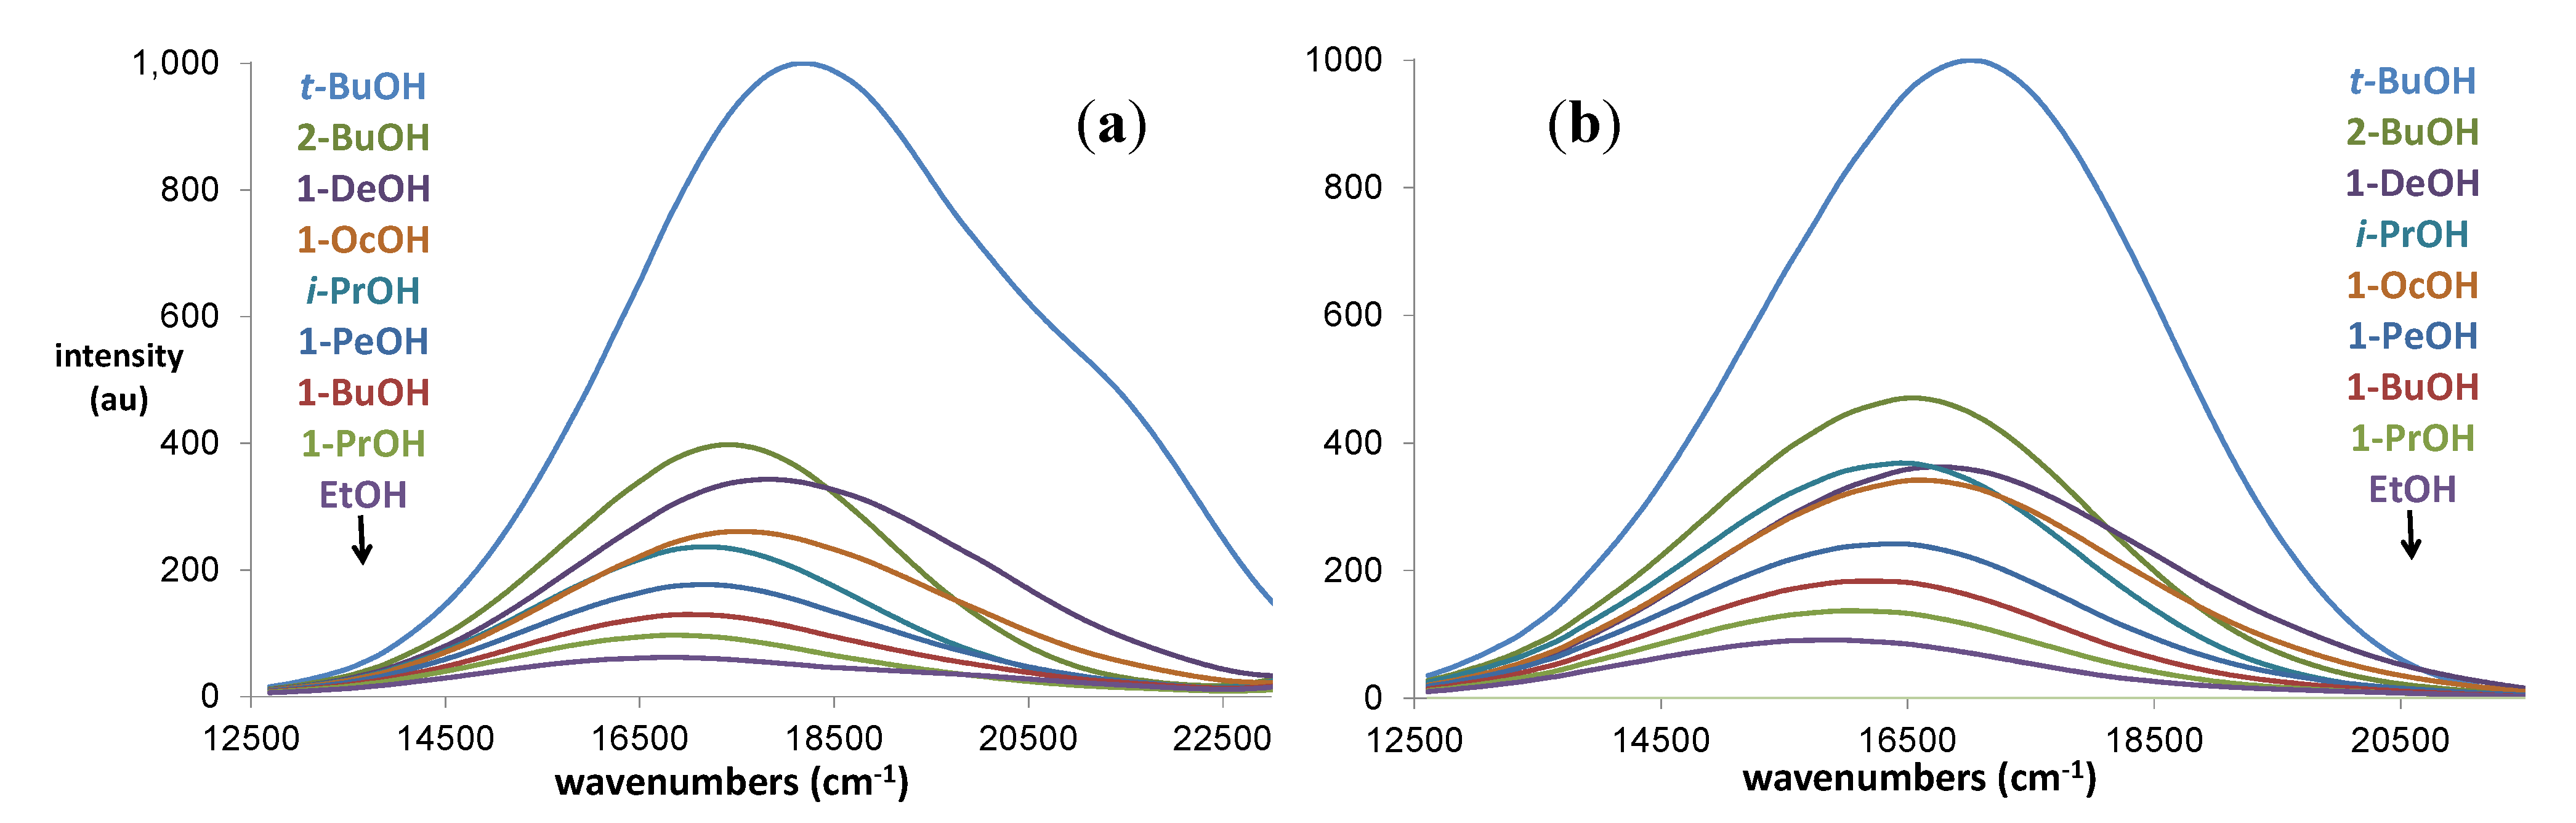
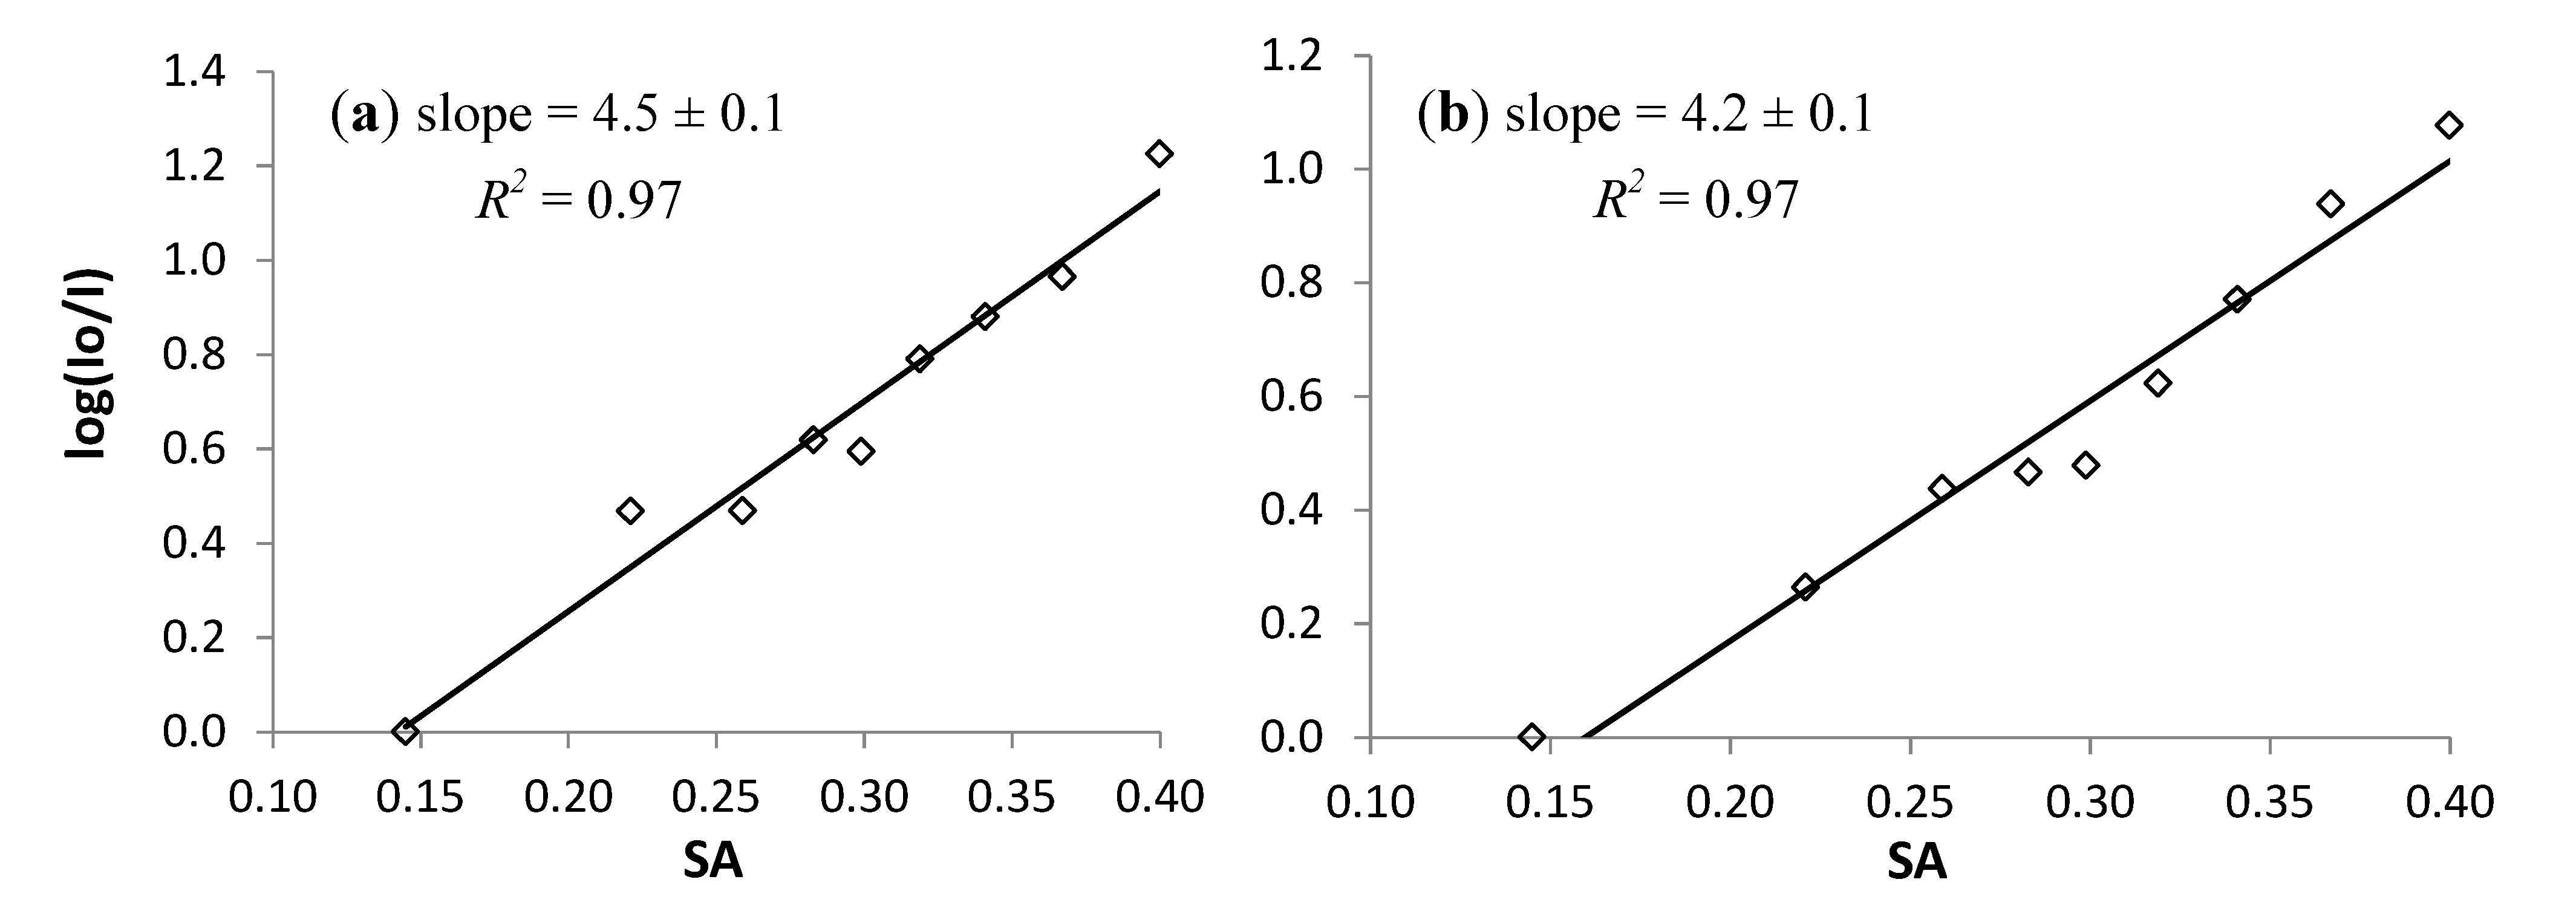
2.1. Fluorescence Quenching in Alcohols


| t-BuOH | 2-BuOH | 1-DeOH | 1-OcOH | i-PrOH | 1-PeOH | 1-BuOH | 1-PrOH | EtOH | |
|---|---|---|---|---|---|---|---|---|---|
| SP | 0.632 | 0.656 | 0.722 | 0.633 | 0.713 | 0.687 | 0.674 | 0.658 | 0.633 |
| SdP | 0.732 | 0.706 | 0.383 | 0.808 | 0.454 | 0.587 | 0.655 | 0.748 | 0.783 |
| SA | 0.145 | 0.221 | 0.259 | 0.283 | 0.299 | 0.319 | 0.341 | 0.367 | 0.400 |
| SB | 0.928 | 0.888 | 0.912 | 0.830 | 0.923 | 0.860 | 0.809 | 0.782 | 0.658 |

2.2. Preferential Solvation Studies
| 1 | 2 | ||||||||
|---|---|---|---|---|---|---|---|---|---|
| SP | SdP | SA | SB | F-value | SP | SdP | SA | SB | F-value |
| 2.4 × 10⁻⁶ | 193 | 2.0 × 10⁻⁶ | 204 | ||||||
| 1.1 × 10⁻⁴ | 0.05 | 170 | 9.2 × 10⁻⁵ | 0.05 | 175 | ||||
| 0.13 | 3.9 × 10⁻⁶ | 127 | 0.25 | 1.9 × 10⁻⁴ | 0.10 | 132 | |||
| 0.13 | 4.5 × 10⁻⁶ | 126 | 0.15 | 3.9 × 10⁻⁶ | 128 | ||||
| 0.14 | 0.15 | 0.21 | 0.07 | 105 | 0.15 | 4.2 × 10⁻⁶ | 128 | ||
| 0.78 | 8.8 × 10⁻³ | 0.24 | 96 | 0.84 | 3.0 × 10⁻³ | 0.23 | 98 | ||
| 0.97 | 2.0 × 10⁻³ | 0.25 | 94 | 0.24 | 0.37 | 0.02 | 0.12 | 87 | |
| 0.84 | 0.93 | 1.2 × 10⁻⁴ | 71 | 0.74 | 0.47 | 4.7 × 10⁻⁵ | 73 | ||
| 0.01 | 1.4 × 10⁻⁴ | 37 | 4.7 × 10⁻³ | 7.2 × 10⁻⁵ | 46 | ||||
| 2.6 × 10⁻³ | 21 | 0.03 | 5.2 × 10⁻⁴ | 24 | |||||
| 0.07 | 1.0 × 10⁻³ | 19 | 2.7 × 10⁻³ | 21 | |||||
| 0.08 | 0.07 | 2 | 0.29 | 0.25 | 1 | ||||
| 0.57 | 0.4 | 0.64 | 0.2 | ||||||
| 0.90 | 0.02 | 0.94 | 0.006 | ||||||
| CH3CN/EtOH | PhCH3/EtOH | |||||||
|---|---|---|---|---|---|---|---|---|
| mol% | 1 | 2 | 1 | 2 | ||||
| rel ε | λmax | rel ε | λmax | rel ε | λmax | rel ε | λmax | |
| 0 | 1.00 | 374.8 | 1.00 | 398.1 | 1.00 | 378.1 | 1.00 | 398.6 |
| 10 | 0.97 | 374.8 | 0.97 | 398.1 | 0.97 | 378.1 | 0.97 | 400.0 |
| 20 | 0.97 | 374.8 | 0.96 | 398.1 | 0.96 | 378.1 | 0.94 | 400.5 |
| 40 | 0.96 | 374.8 | 0.95 | 399.1 | 0.93 | 378.1 | 0.90 | 401.9 |
| 60 | 0.95 | 375.3 | 0.95 | 399.5 | 0.91 | 378.1 | 0.88 | 402.3 |
| 80 | 0.95 | 375.3 | 0.93 | 400.0 | 0.89 | 377.6 | 0.86 | 401.9 |
| 90 | 0.94 | 375.3 | 0.94 | 400.0 | 0.88 | 376.7 | 0.84 | 401.4 |
| 100 | 0.94 | 375.3 | 0.94 | 400.5 | 0.88 | 375.8 | 0.84 | 400.5 |
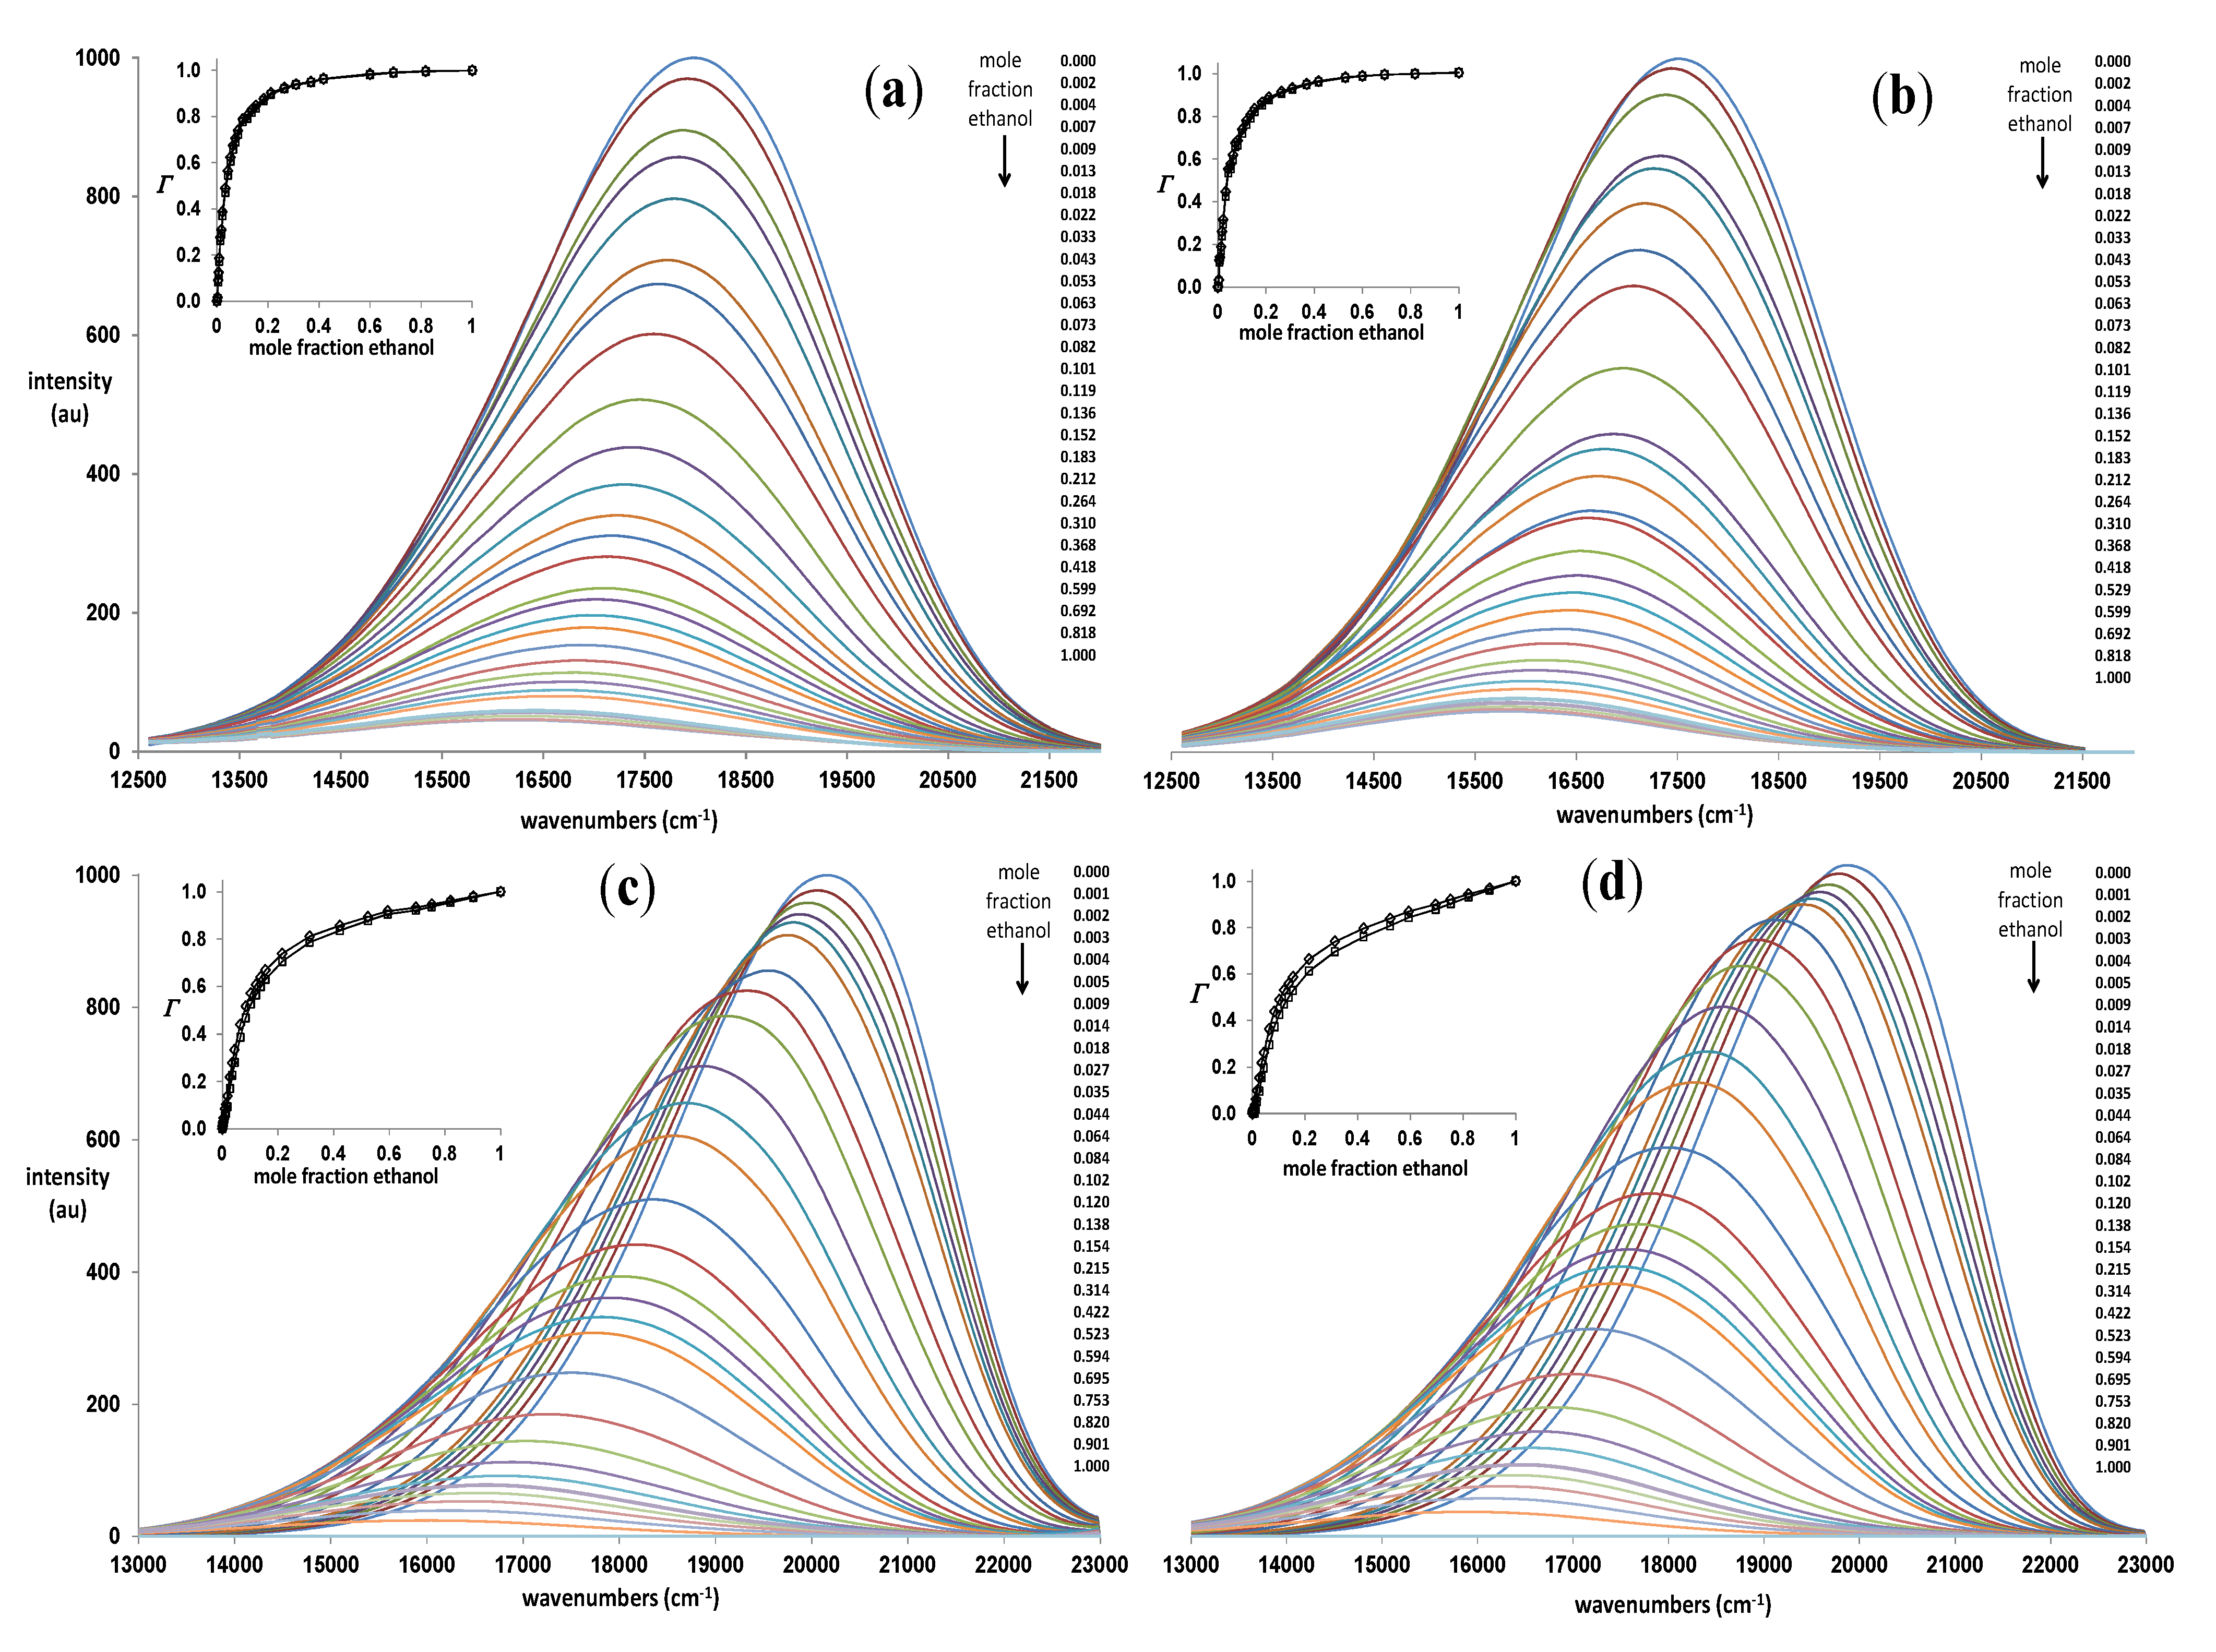
| mixture | f12/1 | f2/1 | Q12 b | Q2 | rQ c | rCM d | Δṽ e | |
|---|---|---|---|---|---|---|---|---|
| 1 | A | 41 | 550 | 0.44 | 0.07 | 0.59 | 0.64 | 2400 |
| (4) | (20) | (0.03) | (0.03) | (0.02) | (0.02) | (800) | ||
| 2 | A | 32 | 270 | 0.36 | 0.08 | 0.69 | 0.74 | 1900 |
| (4) | (110) | (0.12) | (0.01) | (0.12) | (0.12) | (100) | ||
| 1 | B | 44 | 460 | 0.90 | 0.05 | 0.11 | 0.21 | 4400 |
| (1) | (100) | (0.02) | (0.01) | (0.02) | (0.02) | (100) | ||
| 2 | B | 50 | 250 | 0.84 | 0.08 | 0.17 | 0.26 | 4500 |
| (9) | (50) | (0.07) | (0.01) | (0.07) | (0.06) | (200) |
3. Experimental
3.1. General Methods
3.2. Solvent Acidity Studies
3.2.1. Absorption Data
3.2.2. Fluorescence Data
3.3. Preferential Solvation Studies
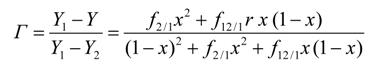
3.3.1. Determination of Spectral Values (Y) and Fractional Changes (Γ)
3.3.2. Determination of preferential solvation parameters
4. Conclusions
Acknowledgments
Author Contributions
Conflicts of Interest
References
- De Silva, A.P.; Gunaratne, H.Q.N.; Gunnlaugsson, T.; Huxley, A.J.M.; McCoy, C.P.; Rademacher, J.T.; Rice, T.E. Signaling recognition events with fluorescent sensors and switches. Chem. Rev. 1997, 97, 1515–1566. [Google Scholar] [CrossRef]
- Weber, G.; Farris, F.J. Synthesis and spectral properties of a hydrophobic fluorescent probe: 6-propionyl-2-(dimethylamino) naphthalene. Biochemistry 1979, 18, 3075–3078. [Google Scholar] [CrossRef]
- Homocianu, M.; Airinei, A.; Dorohoi, D.O. Solvent effects on the electronic absorption and fluorescence spectra. J. Adv. Res. Phys. 2011, 2, 011105. [Google Scholar]
- Kamlet, M.J.; Abboud, J.L.M.; Abraham, M.H.; Taft, R.W. Linear solvation energy relationships. 23. A comprehensive collection of the solvatochromic parameters, π*, α, and β, and some methods for simplifying the generalized solvatochromic equation. J. Org. Chem. 1983, 48, 2877–2887. [Google Scholar] [CrossRef]
- Catalán, J. Toward a generalized treatment of the solvent effect based on four empirical scales: Dipolarity (SdP, a new scale), polarizability (SP), acidity (SA), and basicity (SB) of the medium. J. Phys. Chem. B 2009, 113, 5951–5960. [Google Scholar] [CrossRef]
- Catalán, J.; Perez, P.; Laynez, J.; Blanco, F.G. Analysis of the solvent effect on the photophysics properties of 6-propionyl-2-(dimethylamino) naphthalene (PRODAN). J. Fluoresc. 1991, 1, 215–223. [Google Scholar] [CrossRef]
- Cerezo, F.M.; Rocafort, S.C.; Sierra, P.S.; García-Blanco, F.; Oliva, C.D.; Sierra, J.C. Photophysical study of the probes acrylodan (1-[6-(dimethylamino) naphthalen-2-yl] prop-2-en-1-one), ANS (8-anilinonaphthalene-1-sulfonate) and prodan (1-[6-(dimethylamino) naphthalen-2-yl] propan-1-one) in aqueous mixtures of various alcohols. Helv. Chim. Acta 2001, 84, 3306–3312. [Google Scholar] [CrossRef]
- Marini, A.; Muñoz-Losa, A.; Biancardi, A.; Mennucci, B. What is solvatochromism? J. Phys. Chem. B 2010, 114, 17128–17135. [Google Scholar] [CrossRef]
- Adhikary, R.; Barnes, C.A.; Petrich, J.W. Solvation dynamics of the fluorescent probe PRODAN in heterogeneous environments: Contributions from the locally excited and charge-transferred states. J. Phys. Chem. B 2009, 113, 11999–12004. [Google Scholar] [CrossRef]
- Green, A.M.; Naughton, H.R.; Nealy, Z.B.; Pike, R.D.; Abelt, C.J. Carbonyl-twisted 6-acyl-2-dialkylaminonaphthalenes as solvent acidity sensors. J. Org. Chem. 2013, 78, 1784–1789. [Google Scholar] [CrossRef]
- Naughton, H.R.; Abelt, C.J. Local solvent acidities in β-cyclodextrin complexes with PRODAN derivatives. J. Phys. Chem. B 2013, 117, 3323–3327. [Google Scholar] [CrossRef]
- Shynkar, V.V.; Klymchenko, A.S.; Piemont, E.; Demchenko, A.P.; Mely, Y. Dynamics of intermolecular hydrogen bonds in the excited states of 4-dialkylamino-3-hydroxyflavones. on the pathway to an ideal fluorescent hydrogen bonding sensor. J. Phys. Chem. A 2004, 108, 8151–8159. [Google Scholar] [CrossRef]
- Abelt, C.J.; Sun, T.; Everett, R.K. 2,5-PRODAN: Synthesis and properties. Photochem. Photobiol. Sci. 2011, 10, 618–622. [Google Scholar] [CrossRef]
- Lakowicz, J. Principles of Fluorescence Spectroscopy; Kluwer Academic/Plenum Publishers: New York, NY, USA, 1999. [Google Scholar]
- Artukhov, V.Y.; Zharkova, O.M.; Morozova, J.P. Features of Absorption and Fluorescence Spectra of Prodan. Spectrochim. Acta A 2007, 68, 36–42. [Google Scholar] [CrossRef]
- Rosés, M.; Ràfols, C.; Ortega, J.; Bosch, E. Solute–solvent and solvent–solvent interactions in binary solvent mixtures. Part 1. A comparison of several preferential solvation models for describing ET (30) polarity of bipolar hydrogen bond acceptor-cosolvent mixtures. J. Chem. Soc. Perkin Trans. 2 1996, 8, 1607–1615. [Google Scholar]
- Bosch, E.; Rosés, M.; Herodes, K.; Koppel, I.; Leito, I.; Koppel, I.; Taal, V. Solute‒solvent and solvent‒solvent interactions in binary solvent mixtures. 2. Effect of temperature on the ET (30) polarity parameter of dipolar hydrogen bond acceptor‒hydrogen bond donor mixtures. J. Phys. Org. Chem. 1996, 9, 403–410. [Google Scholar] [CrossRef]
- Ortega, J.; Ràfols, C.; Bosch, E.; Rosés, M. Solute–solvent and solvent–solvent interactions in binary solvent mixtures. Part 3. the ET (30) polarity of binary mixtures of hydroxylic solvents. J. Chem. Soc. Perkin Trans. 2 1996, 1497–1503. [Google Scholar]
- Bosch, E.; Rived, F.; Rosés, M. Solute–solvent and solvent–solvent interactions in binary solvent mixtures. Part 4. Preferential solvation of solvatochromic indicators in mixtures of 2-methylpropan-2-ol with hexane, benzene, propan-2-ol, ethanol and methanol. J. Chem. Soc. Perkin Trans. 2 1996, 2177–2184. [Google Scholar] [CrossRef]
- Ràfols, C.; Rosés, M.; Bosch, E. Solute–solvent and solvent–solvent interactions in binary solvent mixtures. Part 5. Preferential solvation of solvatochromic indicators in mixtures of propan-2-ol with hexane, benzene, ethanol and methanol. J. Chem. Soc. Perkin Trans. 2 1997, 243–248. [Google Scholar] [CrossRef]
- Rosés, M.; Buhvestov, U.; Ràfols, C.; Rived, F.; Bosch, E. Solute–solvent and solvent–solvent interactions in binary solvent mixtures. Part 6. A quantitative measurement of the enhancement of the water structure in 2-methylpropan-2-ol–water and propan-2-ol–water mixtures by solvatochromic indicators. J. Chem. Soc. Perkin Trans. 2 1997, 1341–1348. [Google Scholar]
- Buhvestov, U.; Rived, F.; Ràfols, C.; Bosch, E.; Rosés, M. Solute–solvent and solvent–solvent interactions in binary solvent mixtures. Part 7. Comparison of the enhancement of the water structure in alcohol–water mixtures measured by solvatochromic indicators. J. Phys. Org. Chem. 1998, 11, 185–192. [Google Scholar] [CrossRef]
- Herodes, K.; Leito, I.; Koppel, I.; Rosés, M. Solute–solvent and solvent–solvent interactions in binary solvent mixtures. Part 8. the ET (30) polarity of binary mixtures of formamides with hydroxylic Solvents. J. Phys. Org. Chem. 1999, 12, 109–115. [Google Scholar] [CrossRef]
- Zurawsky, W.P.; Scarlata, S.F. Preferential solvation of 6-propionyl (N,N-dimethylamino) naphthalene in binary, polar solvent mixtures. J. Phys. Chem. 1992, 96, 6012–6016. [Google Scholar] [CrossRef]
- Nikitina, Y.Y.; Iqbal, E.S.; Yoon, H.J.; Abelt, C.J. Preferential solvation in carbonyl-twisted PRODAN derivatives. J. Phys. Chem. A 2013, 117, 9189–9195. [Google Scholar] [CrossRef]
- Yatsuhashi, T.; Inoue, H. Molecular mechanism of radiationless deactivation of aminoanthraquinones through intermolecular hydrogen-bonding interaction with alcohols and hydroperoxides. J. Phys. Chem. A 1997, 101, 8166–8173. [Google Scholar] [CrossRef]
- Yatsuhashi, T.; Nakajima, Y.; Shimada, T.; Tachibana, H.; Inoue, H. Molecular mechanism for the radiationless deactivation of the intramolecular charge-transfer excited singlet state of aminofluorenones through hydrogen bonds with alcohols. J. Phys. Chem. A 1998, 102, 8657–8663. [Google Scholar] [CrossRef]
- Morimoto, A.; Yatsuhashi, T.; Shimada, T.; Kumazaki, S.; Yoshihara, K.; Inoue, H. Molecular mechanism of the intermolecular hydrogen bond between 2-piperidinoanthraquinone and alcohol in the excited state: Direct observation of the out-of-plane mode interaction with alcohol by transient absorption studies. J. Phys. Chem. A 2001, 105, 8840–8849. [Google Scholar] [CrossRef]
- Bhattacharyya, K.; Chowdhury, M. Environmental and magnetic field effects on exciplex and twisted charge transfer emission. Chem. Rev. 1993, 93, 507–535. [Google Scholar] [CrossRef]
- Grabowski, Z.R.; Rotkiewicz, K.; Rettig, W. Structural changes accompanying intramolecular electron transfer: Focus on twisted intramolecular charge-transfer states and structures. Chem. Rev. 2003, 103, 3899–4031. [Google Scholar] [CrossRef]
- Zhao, G.; Han, K. Role of intramolecular and intermolecular hydrogen bonding in both singlet and triplet excited states of aminofluorenones on internal conversion, intersystem crossing, and twisted intramolecular charge transfer. J. Phys. Chem. A 2009, 113, 14329–14335. [Google Scholar] [CrossRef]
- Zhao, G.; Han, K. Hydrogen bonding in the electronic excited state. Acc. Chem. Res. 2011, 45, 404–413. [Google Scholar] [CrossRef]
- Everett, R.K.; Nguyen, H.A.A.; Abelt, C.J. Does PRODAN possess an O-TICT excited state? Synthesis and properties of two constrained derivatives. J. Phys. Chem. A 2010, 114, 4946–4950. [Google Scholar] [CrossRef]
- Atik, Z. Experimental and predicted volumetric and refractive index properties of ternary mixtures of iodoethane with toluene and alcohols at temperature 298.15 K and pressure 101kPa. J. Chem. Thermodyn. 2006, 38, 201–208. [Google Scholar] [CrossRef]
- Herráez, J.V.; Belda, R. Refractive indices, densities and excess molar volumes of monoalcohols in water. J. Solution Chem. 2006, 35, 1315–1328. [Google Scholar] [CrossRef]
- Nikam, P.S.; Shirsat, L.N.; Hasan, M. Density and viscosity studies of binary mixtures of acetonitrile with methanol, ethanol, propan-1-ol, propan-2-ol, butan-1-ol, 2-methylpropan-1-ol, and 2-methylpropan-2-ol at (298.15, 303.15, 308.15, and 313.15) K. J. Chem. Eng. Data 1998, 43, 732–737. [Google Scholar] [CrossRef]
- Sample Availability: Samples of the compounds 1 and 2 are available from the authors.
© 2014 by the authors. Licensee MDPI, Basel, Switzerland. This article is an open access article distributed under the terms and conditions of the Creative Commons Attribution license ( http://creativecommons.org/licenses/by/3.0/).
Share and Cite
Yoon, A.H.; Whitworth, L.C.; Wagner, J.D.; Abelt, C.J. 2,5-PRODAN Derivatives as Highly Sensitive Sensors of Low Solvent Acidity. Molecules 2014, 19, 6415-6427. https://doi.org/10.3390/molecules19056415
Yoon AH, Whitworth LC, Wagner JD, Abelt CJ. 2,5-PRODAN Derivatives as Highly Sensitive Sensors of Low Solvent Acidity. Molecules. 2014; 19(5):6415-6427. https://doi.org/10.3390/molecules19056415
Chicago/Turabian StyleYoon, Alexandra H., Laura C. Whitworth, Joel D. Wagner, and Christopher J. Abelt. 2014. "2,5-PRODAN Derivatives as Highly Sensitive Sensors of Low Solvent Acidity" Molecules 19, no. 5: 6415-6427. https://doi.org/10.3390/molecules19056415
APA StyleYoon, A. H., Whitworth, L. C., Wagner, J. D., & Abelt, C. J. (2014). 2,5-PRODAN Derivatives as Highly Sensitive Sensors of Low Solvent Acidity. Molecules, 19(5), 6415-6427. https://doi.org/10.3390/molecules19056415