Volatile Profiling of Aromatic Traditional Medicinal Plant, Polygonum minus in Different Tissues and Its Biological Activities

Abstract
:1. Introduction
2. Results and Discussion
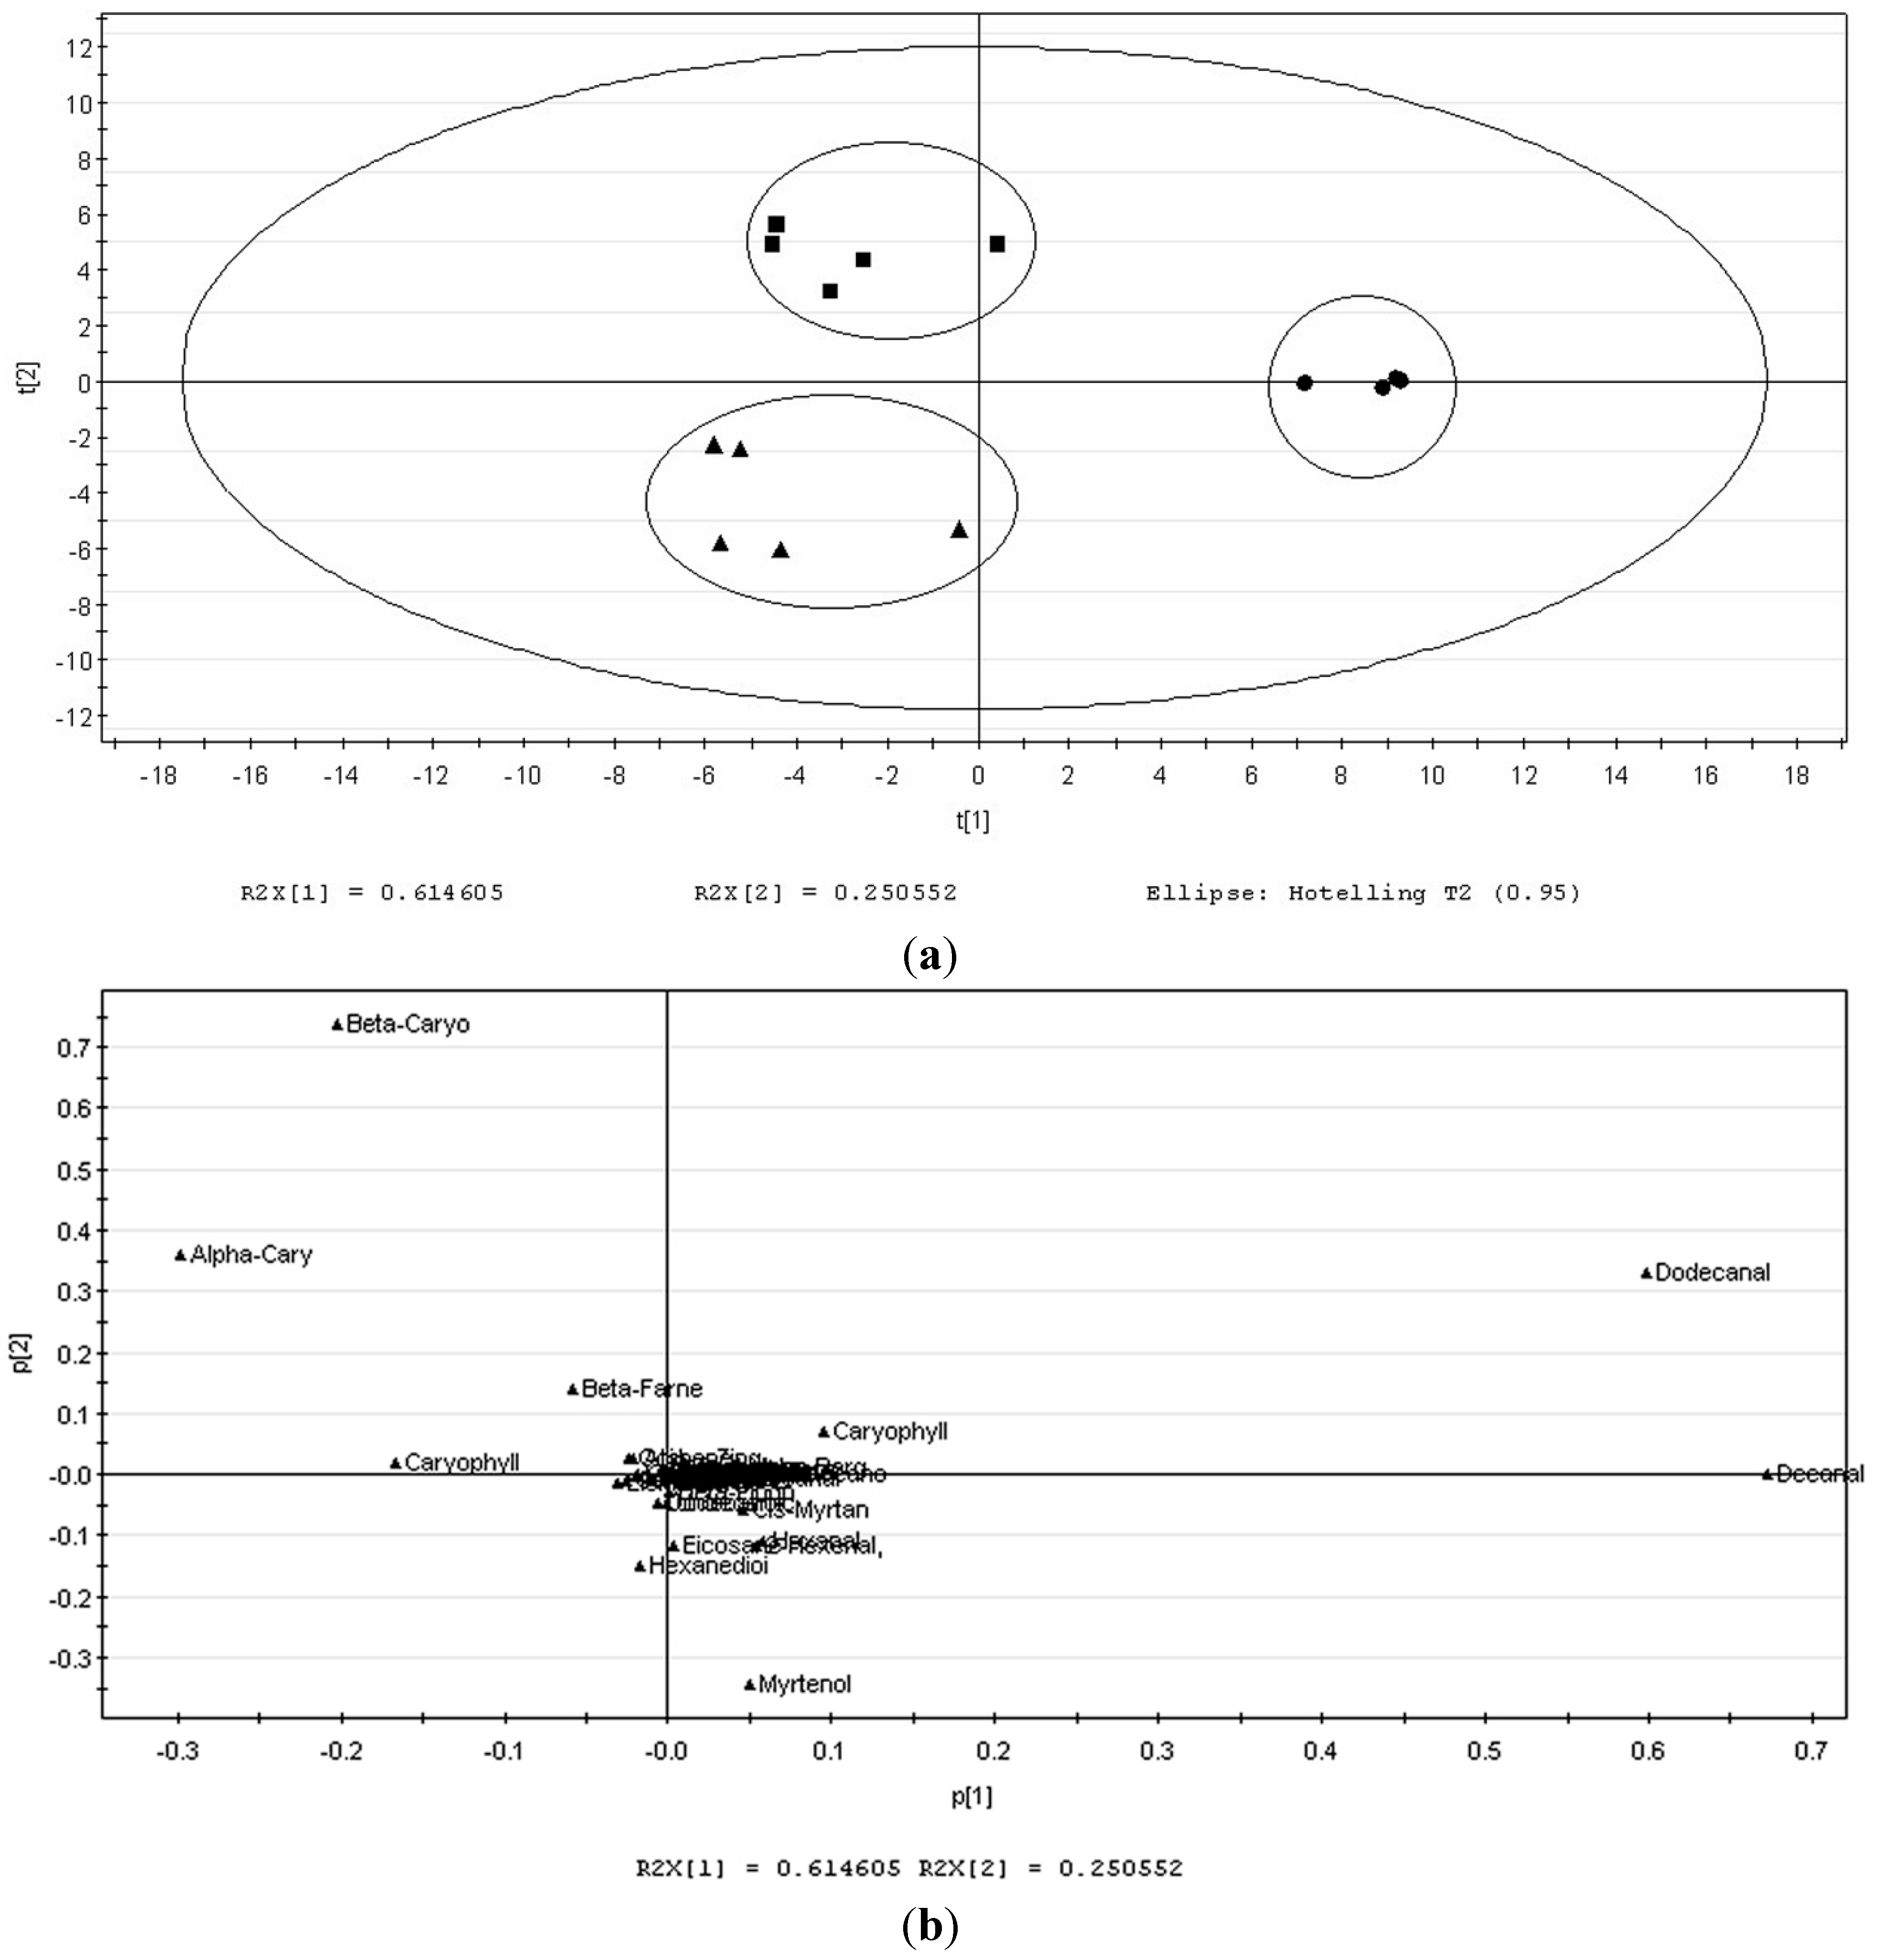
2.1. Volatile Profiles of Different Tissues from SPME Extraction


| No | Compound a | Retention Indices e | SPME Technique | Essential Oil | ||||
|---|---|---|---|---|---|---|---|---|
| Percentage b | ||||||||
| Leaves | Stems | Roots | Leaves | Stems | Roots | |||
| Terpenes(Monoterpenes) | ||||||||
| 1 | α-Pinene | 939 | 0.52 c | 0.25 | -d | 0.256 | 0.152 | 2.122 |
| 2 | α-Thujene | 938 | 0.011 | - | - | - | - | - |
| 3 | Limonene | 1030 | 0.022 | 0.084 | - | - | - | - |
| 4 | β-Ocimene | 1038 | 0.022 | 0.388 | - | - | - | - |
| 5 | Myrtenal | 1233 | - | 0.216 | 0.496 | - | - | - |
| 6 | -(Z)-Myrtanol | 1288 | - | - | 0.602 | - | - | - |
| 7 | Borneol | 1162 | 0.081 | 0.095 | - | - | - | - |
| 8 | (E)-Geranyl acetone | 1448 | - | - | 0.313 | - | - | - |
| Terpenes (sesquiterpenes) | ||||||||
| 9 | Germacrene D | 1484 | 0.093 | - | - | - | - | - |
| 10 | Isocaryophyllene | 1438 | 0.012 | - | - | 0.296 | - | |
| 11 | Copaene | 1377 | - | 0.359 | - | - | - | - |
| 12 | α-Zingiberene | 1494 | 0.144 | 0.186 | - | 0.046 | - | - |
| 13 | δ-Elemene | 1335 | - | 1.234 | - | - | - | - |
| 14 | Aromadendrene | 1475 | 0.159 | - | - | 0.3816 | - | - |
| 15 | (E)-α-Bergamotene | 1431 | 1.383 | - | 1.855 | 0.984 | 1.339 | 0.666 |
| 16 | β-Guaiene | 1483 | - | - | - | 0.068 | - | - |
| 17 | 4,11-selinadiene | 1474 | 0.024 | - | - | 0.181 | 0.055 | 0 |
| 18 | β-Caryophyllene | 1467 | 6.063 | 34.71 | 22.99 | 12.888 | 19.564 | 8.851 |
| 19 | Eremophilene | 1503 | 0.353 | - | - | - | - | - |
| 20 | β-farnesene | 1445 | 0.527 | 5.002 | 0.803 | 0.1539 | - | - |
| 21 | Sesquiphellandrene | 1560 | 0.102 | 0.13 | - | 0.053 | 0.19 | - |
| 22 | Alloaromadendrene | 1496 | 0.029 | - | - | - | - | - |
| 23 | α-Bisabolene | 1506 | 0.131 | - | - | - | - | - |
| 24 | α-Panasinsen | 1381 | 0.366 | - | - | 0.475 | 1.807 | 0.455 |
| 25 | α-Cedrene | 1410 | 0.79 | - | - | - | - | - |
| 26 | Valencene | 1490 | - | 2.114 | - | - | 1.005 | - |
| 27 | Nerolidol | 1539 | 0.084 | - | - | 0.246 | 0.336 | - |
| 28 | α-Himachalene | 1449 | - | 1.276 | - | 0.513 | 0.249 | - |
| 29 | Cadinene | 1543 | - | 0.329 | - | - | 0.301 | - |
| 30 | Gurjunene | 1412 | - | 2.067 | - | - | - | - |
| 31 | Caryophyllene oxide | 1573 | 0.194 | 4.883 | 0.992 | 0.683 | 4.107 | - |
| 32 | Humulene epoxide | 1642 | - | 2.023 | - | - | 3.225 | - |
| 33 | Seychellene | 1444 | - | - | - | 0.481 | 1.429 | - |
| 34 | α-Curcumene | 1553 | - | - | - | 0.185 | 0.084 | - |
| Terpenes (sesquiterpenes) | ||||||||
| 35 | Cubenol | 1645 | - | - | - | - | 0.653 | - |
| 36 | Thujopsene | 1429 | - | - | - | 0.13 | - | - |
| 37 | Longipinocarvone | 1398 | - | - | - d | 0.492 c | 0.7824 | - |
| 38 | Aristolene | 1449 | - | - | - | 0.109 | - | - |
| 39 | Cyclolongifolene oxide, dehydro- | 1657 | - | - | - | 1.71 | - | - |
| 40 | α-Cadinol | 1676 | - | - | - | - | 0.75 | - |
| 41 | β-Bisobolol | 1666 | - | - | - | 0.373 | 2.449 | - |
| 42 | α-Eudesmol | 1896 | - | - | - | - | 5.416 | - |
| 43 | Drimenol | 1766 | - | - | - | 2.219 | 0.286 | - |
| 44 | Isolongifolol | 1716 | - | - | - | 3.323 | - | - |
| 45 | Drimenin | 1941 | - | - | - | 0.287 | - | - |
| Aliphatic compounds | ||||||||
| 46 | Undecane | 1101 | 0.194 | 0.209 | - | - | - | - |
| 47 | Decanal | 1209 | 41.563 | 4.915 | 1.181 | 11.629 | 10.308 | 10.48 |
| 48 | Decane, 4-methyl | 1059 | 0.039 | - | - | - | - | - |
| 49 | Decanol | 1274 | - | 0.548 | - | - | 0.463 | - |
| 50 | Undecanal | 1308 | 0.424 | 0.163 | - | 0.151 | 0.078 | - |
| 51 | Cyclohexane, 1-ethenyl-1-methyl-2,4-bis(1-methylethene) | 1392 | 0.134 | - | 0.577 | - | - | - |
| 52 | Dodecanal | 1413 | 45.927 | 37.45 | 10.92 | 59.457 | 42.121 | 24.501 |
| 53 | Pentadecane | 1500 | 0.445 | - | - | - | - | |
| 54 | 1-Dodecanol | 1469 | - | 0.228 | - | - | - | - |
| 55 | Pentadecanal | 1711 | 0.559 | - | - | 1.687 | - | - |
| 56 | Heptadecane | 1700 | - | 0.093 | - | - | - | - |
| 57 | Octadecane | 1800 | - | 0.165 | 1.572 | - | - | - |
| 58 | 1-Hexadecanol | 1870 | - | 0.188 | 0.59 | - | - | - |
| 59 | Eicosane | 2000 | - | 0.165 | 1.572 | - | - | 10.568 |
| 60 | Tetracosane | 2400 | - | - | 0.59 | - | - | 2.271 |
| 61 | Bicyclo[5.3.0]decane, 2-methylene-5-(1-methylvinyl)-8-methyl- | 1456 | - | - | - | 0.017 | - | - |
| 62 | Bicyclo[5.2.0]nonane, 2-methylene-4,8,8-trimethyl-4-vinyl- | 1458 | - | - | - | 0.096 | - | - |
| 63 | Naphthalene, 1,2,3,4,4a,5,6,8a-octahydro-4a,8-dimethyl-2-(1-methylethenyl)-, | 1498 | - | - | - | - | 0.286 | - |
| 64 | Phytane | 1809 | - | - | - | - | 0 | 2.158 |
| Aliphatic compounds | ||||||||
| 65 | Perhydrofarnesyl acetone | 1913 | - | - | - | - | 0 | 0.953 |
| 66 | 3,7,11,15-Tetramethyl-2-hexadecen-1-ol | 1942 | - | - | - | - | 0.404 | - |
| 67 | Phytol | 2128 | - | - | - d | 0.365 c | 0.143 | - |
| Organic acids | ||||||||
| 68 | Dodecanoic acid | 1564 | - | 0.193 | 1.277 | - | - | 4.568 |
| 69 | Myristoleic acid | 1719 | - | - | 0.924 | - | - | - |
| 70 | Tetradecanoic acid | 1720 | - | - | 8.926 | - | - | - |
| 71 | Pentadecanoic acid | 1851 | - | - | 5.17 | - | - | 1.485 |
| 72 | Hexadecanoic acid | 1959 | - | - | 18.15 | - | - | 23.471 |
| 73 | Oleic acid | 2141 | - | - | 2.388 | - | - | - |
| 74 | Octadecanoic acid | 2124 | - | - | 1.42 | - | - | - |
| 75 | Hexanedoic acid | 1871 | - | 0.337 | 16.692 | - | - | - |
| 76 | 2-Propenoic acid | 1380 | - | - | - | - | - | 2.023 |
| 77 | 1,2-Benzenedicarboxylic acid | 1915 | - | - | - | - | - | 2.902 |
| Chemical Class of Compound | SPME Technique | Essential Oil | ||||
|---|---|---|---|---|---|---|
| % Relative Area | % Relative Area | |||||
| Leaves | Stems | Roots | Leaves | Stems | Roots | |
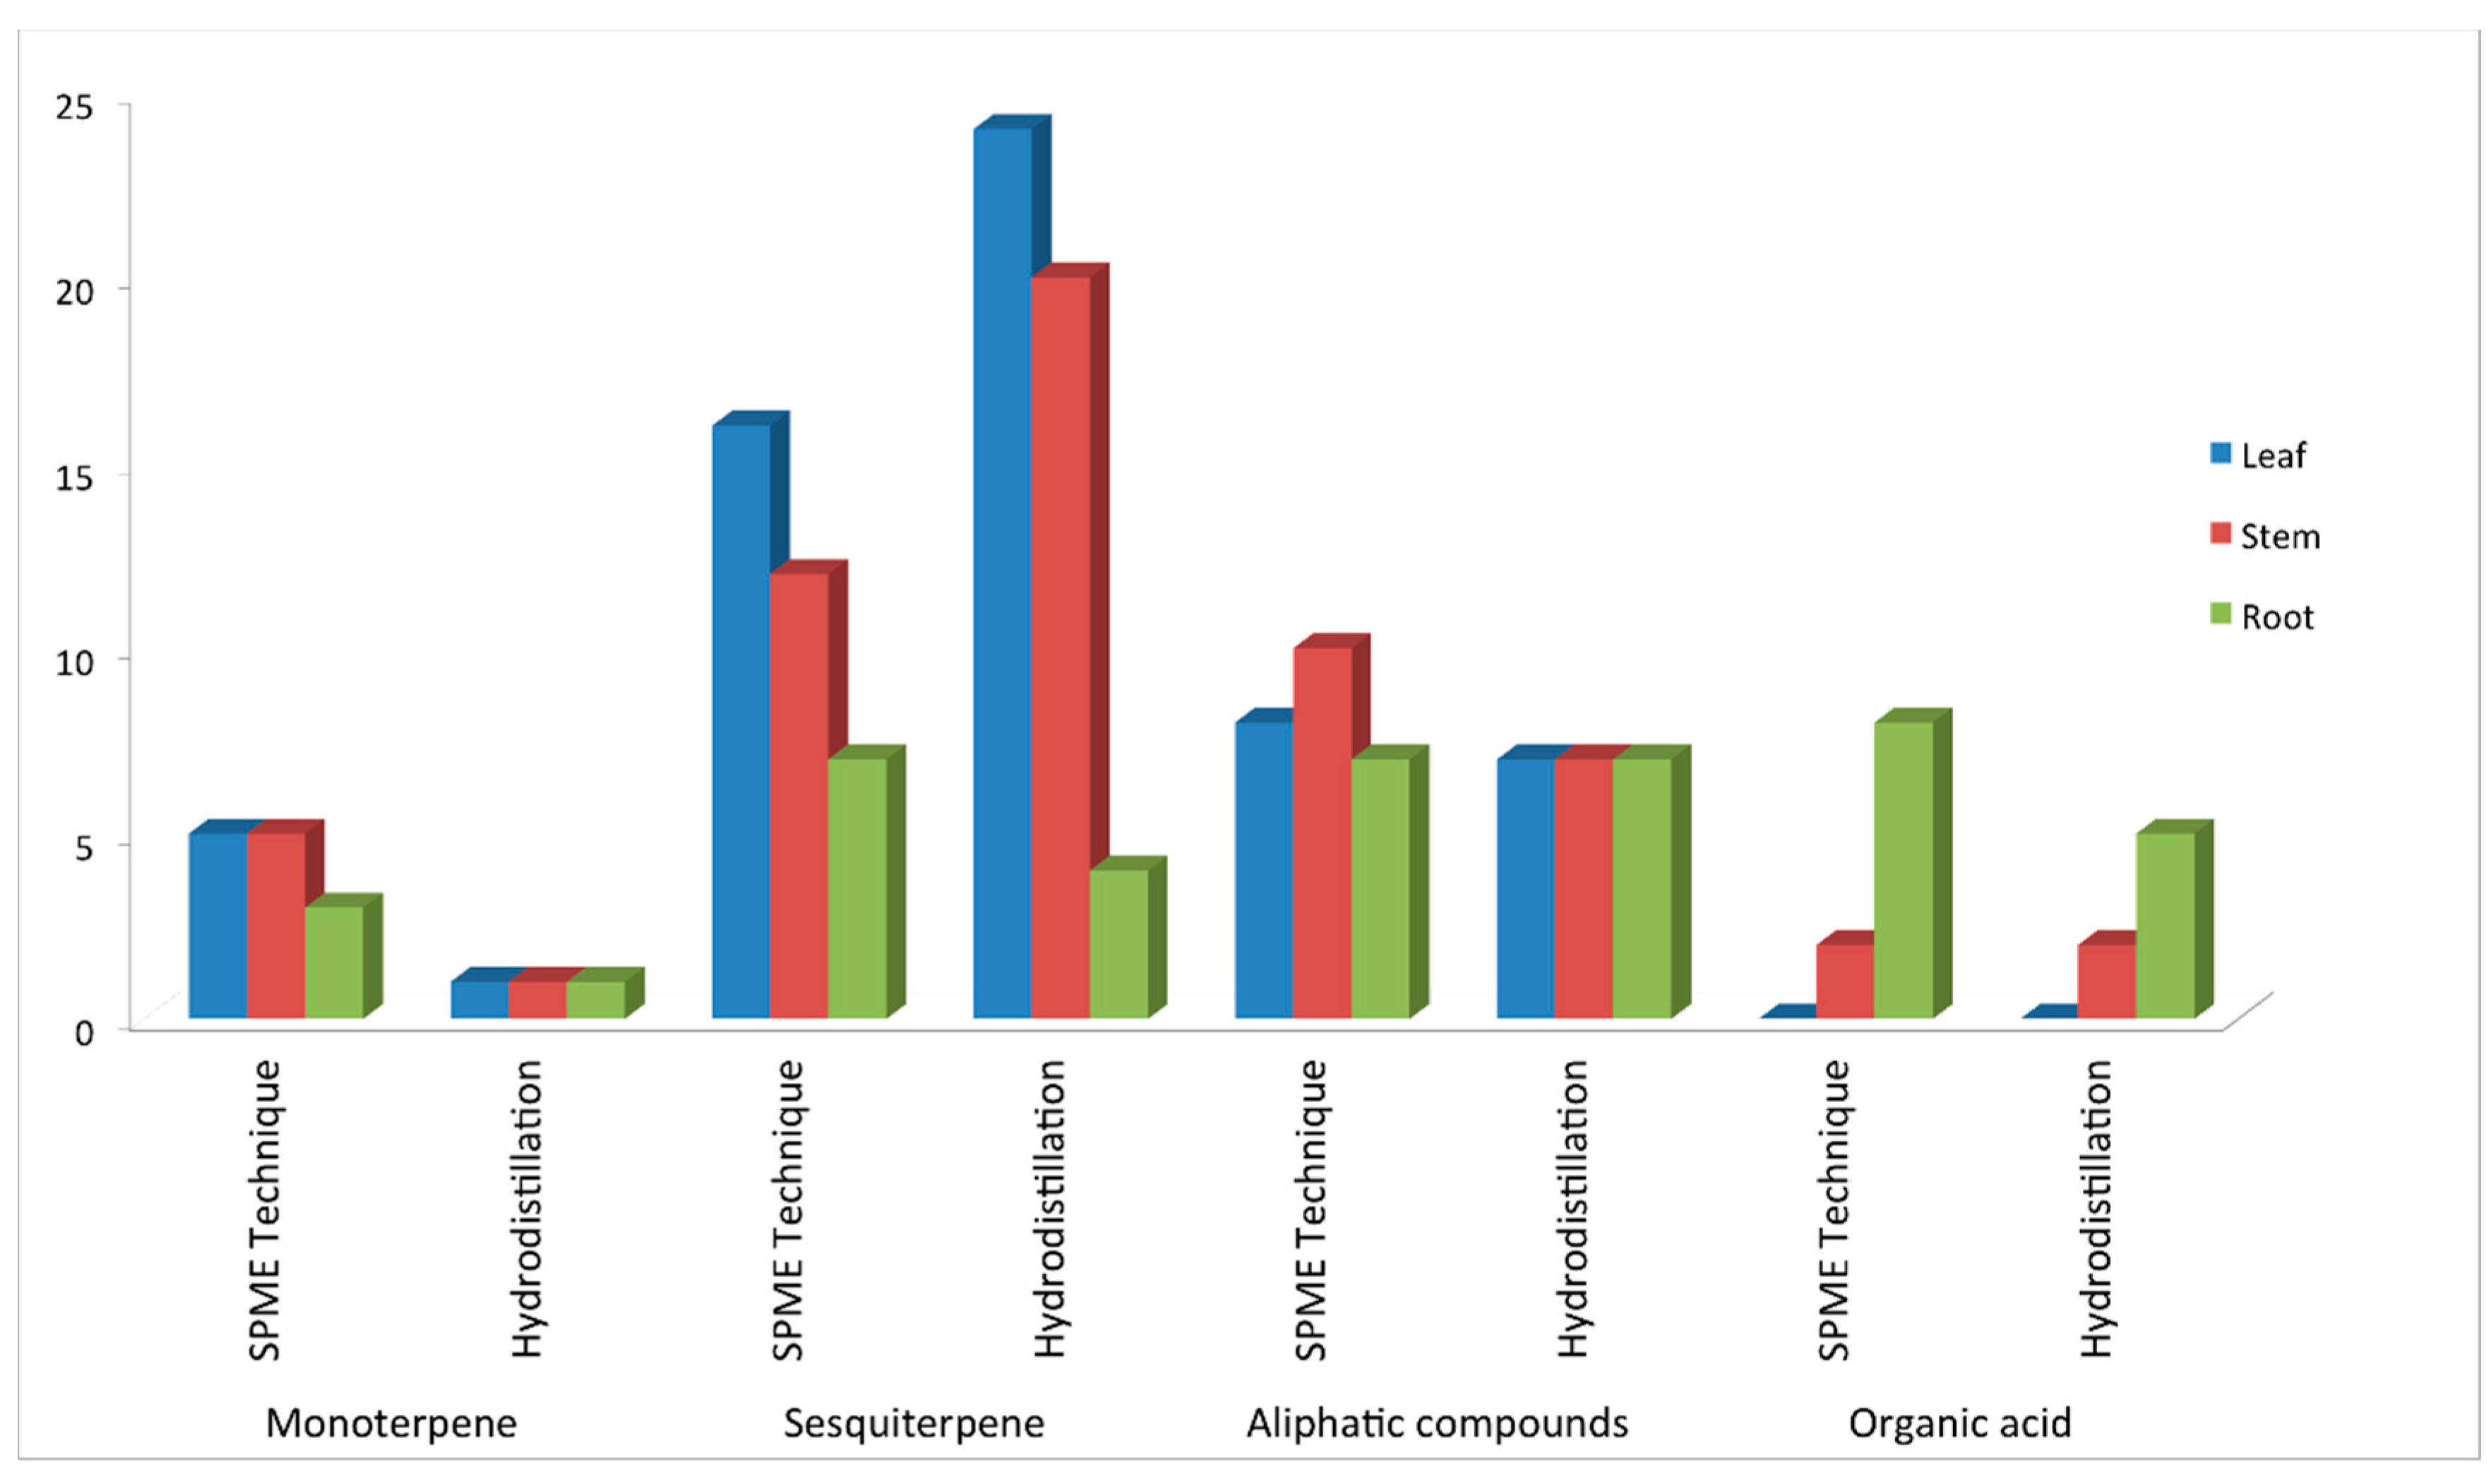
| Terpenes | ||||||
| Monoterpenes | 0.136 | 1.033 | 1.41 | 0.256 | 0.152 | 2.122 |
| Sesquiterpenes | 10.926 | 54.314 | 26.637 | 26.279 | 44.027 | 9.973 |
| Total Terpenes | 10.59 | 55.347 | 28.051 | 26.535 | 44.179 | 12.094 |
| Aliphatic compounds | 88.069 | 44.121 | 17.007 | 73.402 | 53.803 | 50.931 |
| Organic acids | 0 | 0.530821 | 54.95 | 0 | 0 | 34.449 |
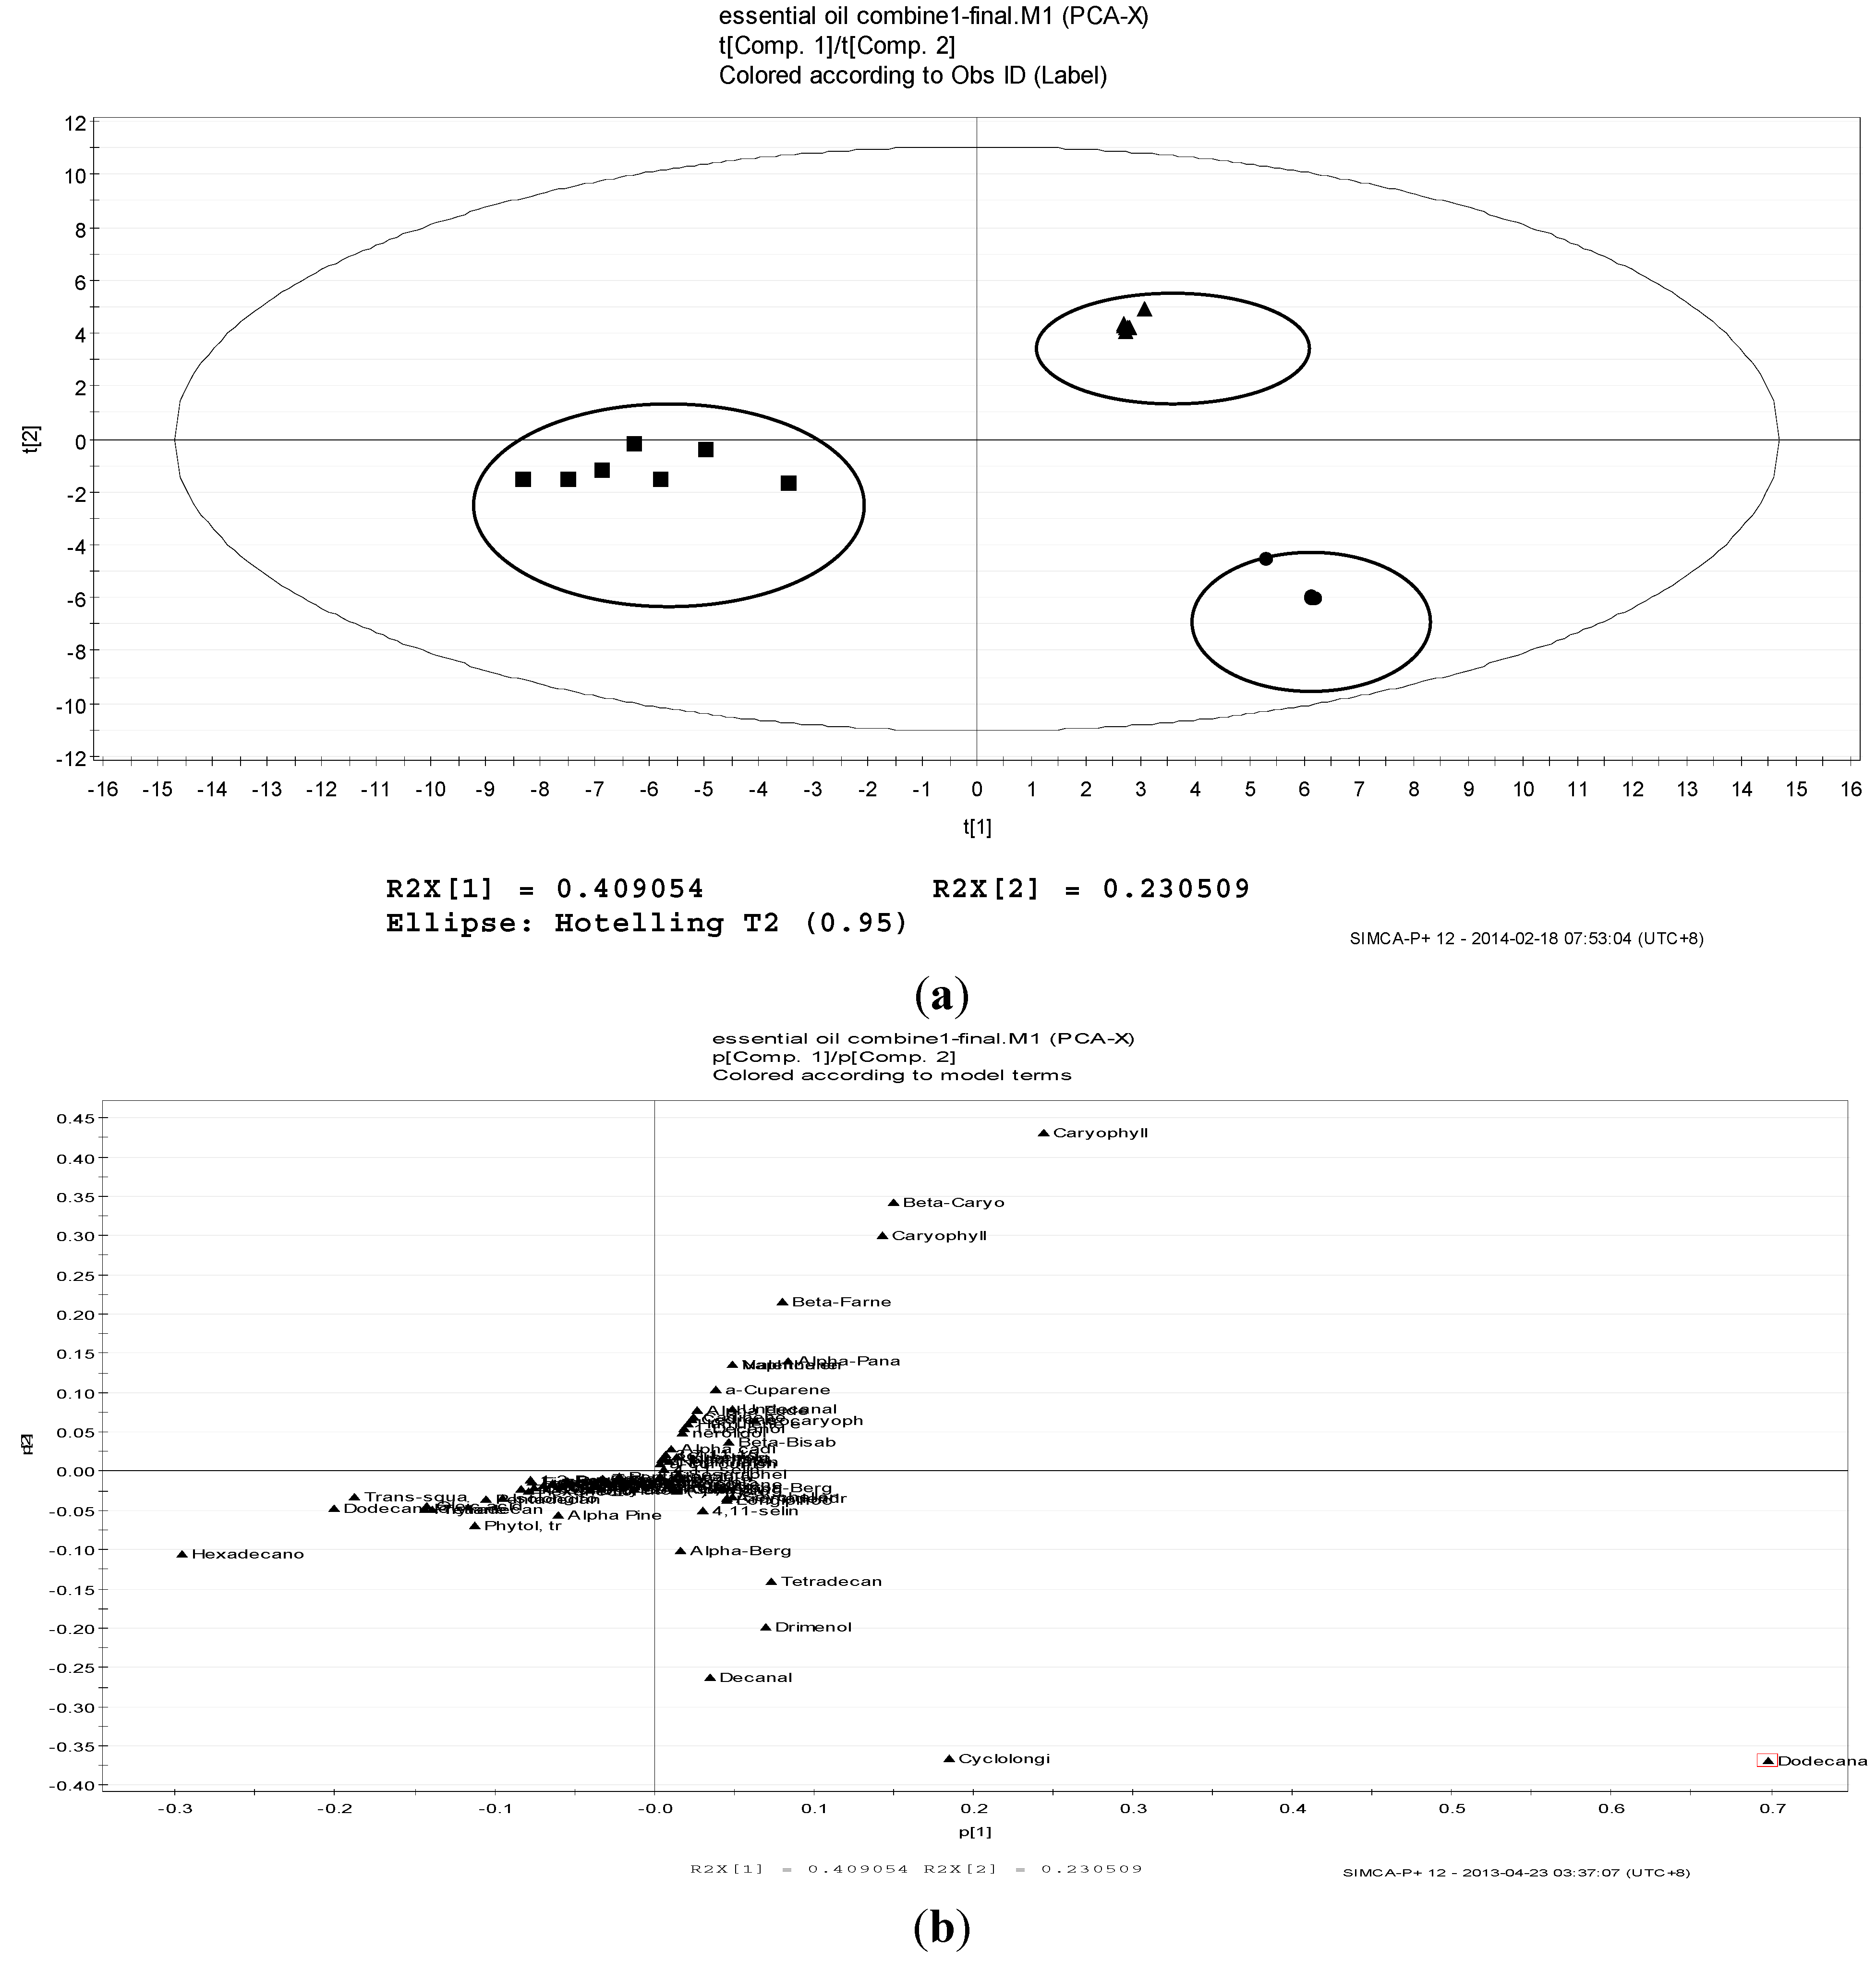
2.2. Volatile Profiles of Different Tissues from Essential Oils

2.3. Antioxidant Activity, Total Phenolic Content and FRAP
| Solvent or Standard | Plant Tissue | DPPH (µg/mL) (IC 50) | Total Phenolic Content (mg GA/g of Extract) | FRAP Value (µmol Fe (II)/g Extract) |
|---|---|---|---|---|
| Methanol | Leaf | 38.309 ± 1.2450 * g | 241.19 | 77.40 |
| Stem | 37.154 ± 1.0628 g | 239.48 | 50.87 | |
| root | 93.325 ± 1.0407 de | 66.21 | 21.28 | |
| Ethanol | Leaf | 31.864 ± 1.0340 f | 131.11 | 92.19 |
| Stem | 30.430 ± 1.0281 g | 115.26 | 52.91 | |
| root | 63.577 ± 1.0281 g | 100.03 | 65.66 | |
| Aqueous | Leaf | 74.131 ± 1.0471 ef | 154.65 | 55.97 |
| Stem | 99.243 ± 1.0281 d | 112.82 | 33.01 | |
| root | - | 11.5 | 1.89 | |
| Dichloromethane | Leaf | - | n.d | n.d |
| Stem | - | |||
| Root | - | |||
| n-hexane | Leaf | - | n.d | n.d |
| Stem | - | |||
| Root | - | |||
| Essential Oil | Leaf | 3388 ± 1.085 k | n.d | n.d |
| Stem | 4570 ± 0.089 l | |||
| Root | n.d | |||
| Gallic Acid | 3.3627 ± 1.034 i | n.d | n.d | |
| Ascorbic Acid | 22.73526 ± 1.114 h | n.d | n.d |
2.4. Acetylcholinesterase Activity (AchE)
| Solvent or Standard | Plant Tissue | Anticholinesterase Activities (IC50) |
|---|---|---|
| Methanol | Leaf | 342.768 ± 1.0568 *a |
| Stem | 809.096 ± 1.1003 b | |
| Root | 1005.77 ± 1.776 bi (IC 25) | |
| Ethanol | Leaf | 910 ± 0.0123 c |
| Stem | 930 ± 0.0071 c | |
| Root | - | |
| Aqueous | Leaf | 234 ± 0.0087 d |
| Stem | 581 ± 0.036 ce | |
| Root | - | |
| Dichloromethane | Leaf | 770 ± 0.0187 f |
| Stem | 478 ± 0.0174 cg | |
| Root | 1800 ± 0.081 hi (IC 25) | |
| n-hexane | Leaf | - |
| Stem | - | |
| Root | n.d | |
| Essential Oil | Leaf | - |
| Stem | - | |
| Root | - | |
| Tacrine | 2.59 ± 0.012 j |
2.5. Antibacterial Activity
| Sample | Diameter of Inhibition Zone (mm) | |||
|---|---|---|---|---|
| MRSA | B. cereus | E. faecalis | S. entiriditis | |
| Ampicillin (+control) | 17.0 | 17.5 | 36.5 | 37.5 |
| DMSO (−control) | 0 | 0 | 0 | 0 |
| Hexane | 15.5 a | 14.5 a | 14.0 a | 7.5 ab |
| DCM | 0 | 13.5 a | 0 | 5.0 abc |
| Methanol | 10.0 ab | 12.5 a | 11.5 b | 0 |
| Sample | Concentration (mg·mL−1) | ||
|---|---|---|---|
| MRSA | B. cereus | E. faecalis | |
| Ampicilin | 1.0 | 0.1 | 0.1 |
| Hexane | 5 | 1.25 | 5 |
| DCM | n.d | n.d | n.d |
| Methanol | 2.5 | 2.5 | 1.25 |
3. Experimental Section
3.1. Chemicals
3.2. Plant Materials
3.3. Sample Preparation for SPME Technique
3.4. Solid Phase Microextraction (SPME) Conditions
3.5. Isolation of the Essential Oil by Hydrodistillation Technique
3.6. Gas Chromatography-Mass Spectrometry Analysis of the Volatile Compounds
3.7. GC-FID Analysis and n-Alkane Standard Solutions
3.8. Data Processing of GC-MS
3.9. Principal Component Analysis (PCA)
3.10. Phytochemical Analysis of Plant Extracts
3.10.1. Preparation of Plant Extracts for Biological Activities
3.10.2. Determination of Antioxidant Activity
3.10.2.1. Determination of Total Phenolic Content
3.10.2.2. DPPH Radicals Scavenging Capacity Assay
3.10.2.3. Ferric Reducing Power Assay (FRAP)
3.10.3. Acetylcholinesterase Inhibitory Activity
3.10.3.1. Buffers
3.10.3.2. Enzyme
3.10.3.3. Acetylcholinesterase Activity Assay
3.10.4. Determination of Antimicrobial Activity
3.10.5. Determination of Minimal Inhibitory Concentration and Minimal Bactericidal Concentration
3.10.6. Statistical Analysis
4. Conclusions
Acknowledgments
Author Contributions
Conflicts of Interest
References
- Hassan, W.W. Healing Herbs of Malaysia; Federal Land Development Authority (FELDA): Kuala Lumpur, Malaysia, 2007. [Google Scholar]
- Hunter, M. Australian kesom oil—A new essential oil for the flavour and fragrance industry. Agro Food Ind. Hi Tech 1996, 7, 26–28. [Google Scholar]
- Zakaria, M.; Mohad, M.A. Traditional Malay Medicinal Plants; ITNM: Kuala Lumpur, Malaysia, 2010. [Google Scholar]
- George, A.; Chinnappan, S.; Chintamaneni, M.; Kotak, C.V.; Choudhary, Y.; Kueper, T.; Radhakrishnan, A. Anti-inflammatory effects of Polygonum minus (Huds) extract (LineminusTM) in in vitro enzyme assays and carrageenan induced paw edema. BMC Complement. Altern. Med. 2014, 14, 355. [Google Scholar] [CrossRef] [PubMed]
- Haris, H.H.; Ming, Y.K.; Perin, F.; Blanche, C.; Jinapong, N. Split-face placebo controlled evaluation of the in vivo anti-ageing efficacy of lineminus™ cream (Polygonum minus extract) in healthy asian skin type female subjects. Asian J. Pharm. Clin. Res. 2014, 7, 7–13. [Google Scholar]
- George, A.; Chinnappan, S.; Choudhary, Y.; Bommu, P.; Sridhar, M. Immunomodulatory activity of an aqueous extract of Polygonum minus Huds on Swiss albino mice using carbon clearance assay. Asian Pac. J. Trop. Dis. 2014, 4, 398–400. [Google Scholar] [CrossRef]
- Sharma, R. Medicinal Plants of India-An Encyclopedia; Daya Publishing House: Delhi, India, 2003; pp. 46–47. [Google Scholar]
- Chan, Y.C.; Wang, M.F.; Chen, Y.C.; Yang, D.Y.; Lee, M.S.; Cheng, F.C. Long-term administration of Polygonum multiflorum Thunb. reduces cerebral ischemia-induced infarct volume in gerbils. Am. J. Chin. Med. 2003, 31, 71–77. [Google Scholar] [CrossRef] [PubMed]
- Chen, L.; Wang, Y.; Wei, L.; Shi, M.; Chan, Y. Chinese herbs and herbal extracts for neuroprotection of dopaminergic neurons and potential therapeutic treatment of parkinsons disease. CNS Neurol. Disord. Drug Targets 2007, 6, 273–281. [Google Scholar] [CrossRef] [PubMed]
- Li, X.; Matsumoto, K.; Murakami, Y.; Tezuka, Y.; Wu, Y.; Kadota, S. Neuroprotective effects of Polygonum multiflorum on nigrostriatal dopaminergic degeneration induced by paraquat and maneb in mice. Pharmacol. Biochem. Behav. 2005, 82, 345–352. [Google Scholar] [CrossRef] [PubMed]
- Khairudin, K.; Sukiran, N.; Goh, H.-H.; Baharum, S.; Noor, N. Direct discrimination of different plant populations and study on temperature effects by Fourier transform infrared spectroscopy. Metabolomics 2014, 10, 203–211. [Google Scholar] [CrossRef]
- Sukiran, N.A.; Baharum, S.N. Metabolite fingerprinting of Polygonum minus; Environmental factors affecting secondary metabolite production. In Proceedings of the 2010 Asian Regional Conference on Systems Biology, Kuala Lumpur, Malaysia, 29 November–1 December 2010; p. 81.
- Baharum, S.N.; Bunawan, H.; Ghani, M.A.; Mustapha, W.A.; Noor, N.M. Analysis of the chemical composition of the essential oil of polygonum minus huds. Using two-dimensional gas chromatography-time-of-flight mass spectrometry (GC-TOF MS). Molecules 2010, 15, 7006–7015. [Google Scholar] [CrossRef] [PubMed]
- Yaacob, K.B. Kesom oil- a natural source of aliphatic aldehyde. Perfum. Flavorist 1987, 12, 27–30. [Google Scholar]
- Yazaki, K. Root-specific production of secondary metabolites: Regulation of shikonin biosynthesis by light in Lithospermum erythrorhizon. Nat. Med. 2001, 55, 49–54. [Google Scholar]
- Matsuda, H.; Shimoda, H.; Morikawa, T.; Yoshikawa, M. Phytoestrogens from the roots of Polygonum cuspidatum (polygonaceae): Structure-Requirement of hydroxyanthraquinones for estrogenic activity. Bioorg. Med. Chem. Lett. 2001, 11, 1839–1842. [Google Scholar] [CrossRef] [PubMed]
- Yu, R.-M.; Ma, N.; Yan, C.-Y.; Zhao, Y. Effects of Exogenous Phytohormones on Hairy Root Growth of Polygonum multiflorum and Biosynthesis of Anthraquinones in Its Hairy Root Cultures. Chin. J. Biotechnol. 2006, 22, 619–623. [Google Scholar] [CrossRef]
- Young-Am, C.; Yu, H.-S.; Song, J.-S.; Chun, H.-K.; Park, S.-U. Indigo production in hairy root cultures of Polygonum tinctorium Lour. Biotechnol. Lett. 2000, 22, 1527–1530. [Google Scholar] [CrossRef]
- Romeo, V.; Ziino, M.; Giuffrida, D.; Condurso, C.; Verzera, A. Flavour profile of capers (Capparis spinosa L.) from the Eolian Archipelago by HS-SPME/GC–MS. Food Chem. 2007, 101, 1272–1278. [Google Scholar] [CrossRef]
- Siquera, E.P.; Alves, T.M.A.; Zani, C.L. Fingerprint of volatiles from plant extracts based on SPME GC-MS. Braz. J. Pharmacogn. 2007, 17, 565–571. [Google Scholar] [CrossRef]
- Jiang, J. Volatile composition of the laksa plant (Polygonum hydropiper L.), a potential source of green note aroma compounds. Flavour Fragr. J. 2005, 20, 455–459. [Google Scholar] [CrossRef]
- Aharoni, A.; Giri, A.P.; Deuerlein, S.; Griepink, F.; de Kogel, W.-J.; Verstappen, F.W.A.; Verhoeven, H.A.; Jongsma, M.A.; Schwab, W.; Bouwmeester, H.J. Terpenoid Metabolism in Wild-Type and Transgenic Arabidopsis Plants. Plant Cell Online 2003, 15, 2866–2884. [Google Scholar] [CrossRef]
- Opitz, S.; Kunert, G.; Gershenzon, J. Increased Terpenoid Accumulation in Cotton (Gossypium hirsutum) Foliage is a General Wound Response. J. Chem. Ecol. 2008, 34, 508–522. [Google Scholar] [CrossRef] [PubMed]
- Tingey, D.T.; Turner, D.P.; Weber, J.A. Factors Controlling the Emission of Monoterpenes and other Volatiles Organic Compounds; Academic Press: San Diego, CA, USA, 1991. [Google Scholar]
- Loreto, F.; Förster, A.; Dürr, M.; Csiky, O.; Seufert, G. On the monoterpene emission under heat stress and on the increased thermotolerance of leaves of Quercus ilex L. fumigated with selected monoterpenes. Plant Cell Environ. 1998, 21, 101–107. [Google Scholar] [CrossRef]
- Peñuelas, J.; Llusià, J. Linking photorespiration, monoterpenes and thermotolerance in Quercus. New Phytol. 2002, 155, 227–237. [Google Scholar] [CrossRef]
- Steinmüller, D.; Tevini, M. Action of ultraviolet radiation (UV-B) upon cuticular waxes in some crop plants. Planta 1985, 164, 557–564. [Google Scholar] [CrossRef] [PubMed]
- Velikova, V.B. Isoprene as a tool for plant protection against abiotic stresses. J. Plant Interact. 2008, 3, 1–15. [Google Scholar] [CrossRef]
- Johnson, C.B.; Kirby, J.; Naxakis, G.; Pearson, S. Substantial UV-B-mediated induction of essential oils in sweet basil (Ocimum basilicum L.). Phytochemistry 1999, 51, 507–510. [Google Scholar] [CrossRef]
- Zhang, W.J.; Bjorn, L.O. The effect of ultraviolet radiation on the accumulation of medicinal compounds in plants. Fitoterapia 2009, 80, 207–218. [Google Scholar] [CrossRef] [PubMed]
- López-Bucio, J.; Nieto-Jacobo, M.F.; Ramı́rez-Rodrı́guez, V.; Herrera-Estrella, L. Organic acid metabolism in plants: From adaptive physiology to transgenic varieties for cultivation in extreme soils. Plant Sci. 2000, 160, 1–13. [Google Scholar] [CrossRef] [PubMed]
- Herrera-Estrella, L.; Guevara-Garci’a, A.; Lo’pez-Bucio, J. Heavy Metal Adaptation; Macmillan Publishers: London, UK, 1999. [Google Scholar]
- Katsube, T.; Tabata, H.; Ohta, Y.; Yamasaki, Y.; Anuurad, E.; Shiwaku, K.; Yamane, Y. Screening for Antioxidant Activity in Edible Plant Products: Comparison of Low-Density Lipoprotein Oxidation Assay, DPPH Radical Scavenging Assay, and Folin-Ciocalteu Assay. J. Agric. Food Chem. 2004, 52, 2391–2396. [Google Scholar] [CrossRef] [PubMed]
- Hassim, N.; Markom, M.; Anuar, N.; Baharum, S.N. Solvent Selection in Extraction of Essential Oil and Bioactive Compounds from Polygonum minus. J. Appl. Sci. 2013, 14, 1–4. [Google Scholar]
- Di Vaio, C.; Graziani, G.; Gaspari, A.; Scaglione, G.; Nocerino, S.; Ritieni, A. Essential oils content and antioxidant properties of peel ethanol extract in 18 lemon cultivars. Sci. Hortic. 2010, 126, 50–55. [Google Scholar]
- Lee, S.H.; Sancheti, S.A.; Bafna, M.R.; Sancheti, S.S.; Seo, S.Y. Acetylcholineterase inhibitory and antioxidant properties of rhododendron yedoense var. Poukhanense bark. J. Med. Plants Res. 2011, 5, 248–254. [Google Scholar]
- Giacobini, E. Cholinesterase inhibitors: New roles and therapeutic alternatives. Pharmacol. Res. 2004, 50, 433–440. [Google Scholar] [CrossRef] [PubMed]
- Qader, S.W.; Abdulla, M.A.; Chua, L.S.; Najim, N.; Zain, M.M.; Hamdan, S. Antioxidant, total phenolic content and cytotoxicity evaluation of selected Malaysian plants. Molecules 2011, 16, 3433–3443. [Google Scholar] [CrossRef] [PubMed]
- Resende, R.; Moreira, P.I.; Proença, T.; Deshpande, A.; Busciglio, J.; Pereira, C.; Oliveira, C.R. Brain oxidative stress in a triple-transgenic mouse model of Alzheimer disease. Free Radic. Biol. Med. 2008, 44, 2051–2057. [Google Scholar] [CrossRef] [PubMed]
- Savelev, S.U.; Okello, E.J.; Perry, E.K. Butyryl- and acetyl-cholinesterase inhibitory activities in essential oils of Salvia species and their constituents. Phytother. Res. 2004, 18, 315–324. [Google Scholar] [CrossRef] [PubMed]
- Ayaz, M.; Junaid, M.; Ahmed, J.; Ullah, F.; Sadiq, A.; Ahmad, S.; Imran, M. Phenolic contents, antioxidant and anticholinesterase potentials of crude extract, subsequent fractions and crude saponins from Polygonum hydropiper L. BMC Complement. Altern. Med. 2014, 14, 145. [Google Scholar] [CrossRef] [PubMed]
- Bunawan, H.; Choong, C.; Md-Zain, B.; Baharum, S.; Noor, N. Molecular systematics of Polygonum minus Huds. based on ITS sequences. Int. J. Mol. Sci. 2011, 12, 7626–7634. [Google Scholar] [CrossRef] [PubMed]
- Huang, B.; Lei, Y.; Tang, Y.; Zhang, J.; Qin, L.; Liu, J. Comparison of HS-SPME with hydrodistillation and SFE for the analysis of the volatile compounds of Zisu and Baisu, two varietal species of Perilla frutescens of Chinese origin. Food Chem. 2011, 125, 268–275. [Google Scholar] [CrossRef]
- Vas, G.; Vekey, K. Solid-phase microextraction: A powerful sample preparation tool prior to mass spectrometric analysis. J. Mass Spectrom. 2004, 39, 233–254. [Google Scholar] [CrossRef] [PubMed]
- Ma, D.-M.; Gandra, S.V.S.; Sharma, N.; Xie, D.-Y. Integration of GC-MS Based Non-Targeted Metabolic Profiling with Headspace Solid Phase Microextraction Enhances the Understanding of Volatile Differentiation in Tobacco Leaves from North Carolina, India and Brazil. Am. J. Plant Sci. 2012, 3, 1759–1769. [Google Scholar] [CrossRef]
- Rodrigues, C.I.I.; Hanson, C.M.; Nogueira, J.M.F. Coffees and Industrial Blends Aroma Profile Discrimination According to the Chromatic Value. Coffee Sci. 2012, 7, 167–176. [Google Scholar]
- Azizan, K.A.; Baharum, S.N.; Ressom, H.W.; Noor, N.M. GC-MS Analysis and PLS-DA Validation of the Trimethyl Silyl-Derivatization Techniques. Am. J. Appl. Sci. 2012, 9, 1124–1136. [Google Scholar] [CrossRef]
- Wootton-Beard, P.C.; Moran, A.; Ryan, L. Stability of the total antioxidant capacity and total polyphenol content of 23 commercially available vegetable juices before and after in vitro digestion measured by FRAP, DPPH, ABTS and Folin–Ciocalteu methods. Food Res. Int. 2011, 44, 217–224. [Google Scholar] [CrossRef]
- Akowuah, G.A.; Ismail, Z.; Norhayati, I.; Sadikun, A. The effects of different extraction solvents of varying polarities on polyphenols of Orthosiphon stamineus and evaluation of the free radical-scavenging activity. Food Chem. 2005, 93, 311–317. [Google Scholar] [CrossRef]
- Oyaizu, M. Studies on products of browning reaction prepared from glucoseamine. Jpn. J. Nutr. 1986, 44, 307–315. [Google Scholar] [CrossRef]
- Ak, T.; Gülçin, İ. Antioxidant and radical scavenging properties of curcumin. Chem. Biol. Interact. 2008, 174, 27–37. [Google Scholar] [CrossRef] [PubMed]
- Buyukokuroglu, M.E.; Gulcin, I.; Oktay, M.; Kufrevioglu, O.I. In vitro antioxidant properties of dantrolene sodium. Pharmacol. Res. 2001, 44, 491–495. [Google Scholar] [CrossRef] [PubMed]
- CLSI. Performance Standards for Antimicrobial Susceptibility Testing: 19th Informational Supplement. M100-S19; CLSI: Wayne, PA, USA, 2009. [Google Scholar]
- Sample Availability: Samples of the compounds are not available from the authors.
© 2014 by the authors. Licensee MDPI, Basel, Switzerland. This article is an open access article distributed under the terms and conditions of the Creative Commons Attribution license ( http://creativecommons.org/licenses/by/4.0/).
Share and Cite
Ahmad, R.; Baharum, S.N.; Bunawan, H.; Lee, M.; Mohd Noor, N.; Rohani, E.R.; Ilias, N.; Zin, N.M. Volatile Profiling of Aromatic Traditional Medicinal Plant, Polygonum minus in Different Tissues and Its Biological Activities. Molecules 2014, 19, 19220-19242. https://doi.org/10.3390/molecules191119220
Ahmad R, Baharum SN, Bunawan H, Lee M, Mohd Noor N, Rohani ER, Ilias N, Zin NM. Volatile Profiling of Aromatic Traditional Medicinal Plant, Polygonum minus in Different Tissues and Its Biological Activities. Molecules. 2014; 19(11):19220-19242. https://doi.org/10.3390/molecules191119220
Chicago/Turabian StyleAhmad, Rafidah, Syarul Nataqain Baharum, Hamidun Bunawan, Minki Lee, Normah Mohd Noor, Emelda Roseleena Rohani, Norashikin Ilias, and Noraziah Mohamad Zin. 2014. "Volatile Profiling of Aromatic Traditional Medicinal Plant, Polygonum minus in Different Tissues and Its Biological Activities" Molecules 19, no. 11: 19220-19242. https://doi.org/10.3390/molecules191119220
APA StyleAhmad, R., Baharum, S. N., Bunawan, H., Lee, M., Mohd Noor, N., Rohani, E. R., Ilias, N., & Zin, N. M. (2014). Volatile Profiling of Aromatic Traditional Medicinal Plant, Polygonum minus in Different Tissues and Its Biological Activities. Molecules, 19(11), 19220-19242. https://doi.org/10.3390/molecules191119220