Article

A New Isoflavonoid from Seeds of Lepidium sativum L. and Its Protective Effect on Hepatotoxicity Induced by Paracetamol in Male Rats

1
Department of Chemistry, Faculty of Science, Tanta University, Tanta 31527, Egypt
2
Department of Chemistry and Biochemistry, Faculty of Science, Tabuk University, Tabuk P.O. Box 699, Tabuk 71491, Saudi Arabia
3
Faculty of Specific Education, Zagazig University, Zagazig 44519, Egypt
4
Department of Basic and Clinical Medical Science, Faculty of Dentistry, P. Qaseem University, Qaseem 51411, Saudi Arabia
5
Department of Home Economics, Faculty of Specific Education, Kafr ElSheikh University, Kafr ElSheikh 33516, Egypt
*
Author to whom correspondence should be addressed.
Molecules 2014, 19(10), 15440-15451; https://doi.org/10.3390/molecules191015440
Submission received: 2 July 2014 / Revised: 30 July 2014 / Accepted: 26 August 2014 / Published: 26 September 2014
(This article belongs to the Section Medicinal Chemistry)

Abstract

:
A new isoflavonoid, 5,6-dimethoxy-2',3'-methylenedioxy-7-C-β-d-gluco-pyranosyl isoflavone was isolated from the seeds of Lepidium sativum L. along with two known isoflavonoids, 7-hydroxy-4',5,6-trimethoxyisoflavone and 7-hydroxy-5,6-dimethoxy-2',3'-methylenedioxyisoflavone. The structures of all compounds were elucidated with NMR spectrometry. Compounds 1, 2 and the new isoflavonoid 3 were evaluated for their ability to reduce the hepatotoxicity induced by paracetamol in male rats by reducing the damage and toxicity effects on liver cells with a significant improvement of total antioxidant capacity, normalizing the levels of liver enzymes GSH, SOD, GPX, CAT and GST compared to control group.

1. Introduction

L. sativum (family Cruciferae) grows in Egypt by three species: L. latifolium, L. sativum and L. aucheri, of which the most common one is L. sativum [1]. It was assumed that its seeds can be a functional food. Eaten plants and the seed oils are used in treating dysentery, diarrhea [2] and migraine [3]. L. sativum is popular medical treatments used in the Kingdom of Saudi Arabia, Sudan and some other Arab countries and mediator well for healing broken bones in the human skeleton. He noted a number of recent studies of the traditional uses of L. sativum seed extract in control of many of the clinical problems. It was found that oral administration of aqueous extract of L. sativum caused a significant drop in blood pressure [4]. Some of these activities are responsible for the ability of L. sativum to protect DNA from damage caused by free radical and protect liver cells against various toxins [5]. There are some reports in the in vitro and in vivo experiments Antimutagenic activities, anti-cancer and anticholestatic using L. sativum [5]. The chemical analyses showed the identification of 6'-β-rhamnopyranosil-oleoside, 6'-β-glucopyranosil-oleoside, Luteolin and of organic polymeric component, known as polymerin [6]. In this paper, we report the isolation of a new one and two of the known compounds and in vivo study of the effects of the new complex liver 3 and two other compounds 1 and 2 against liver damage caused by paracetamol.

2. Results and Discussion
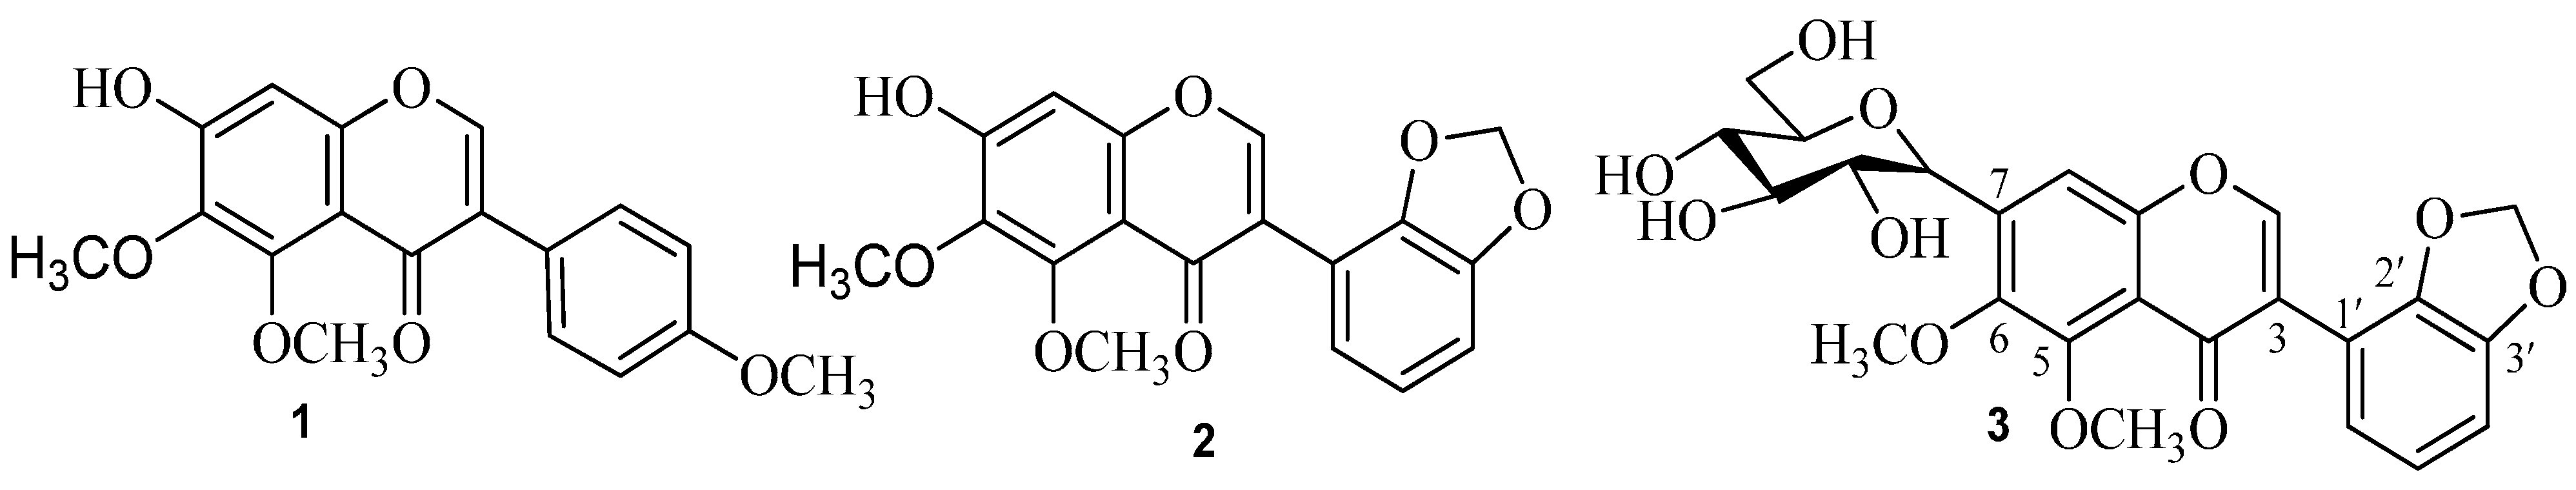
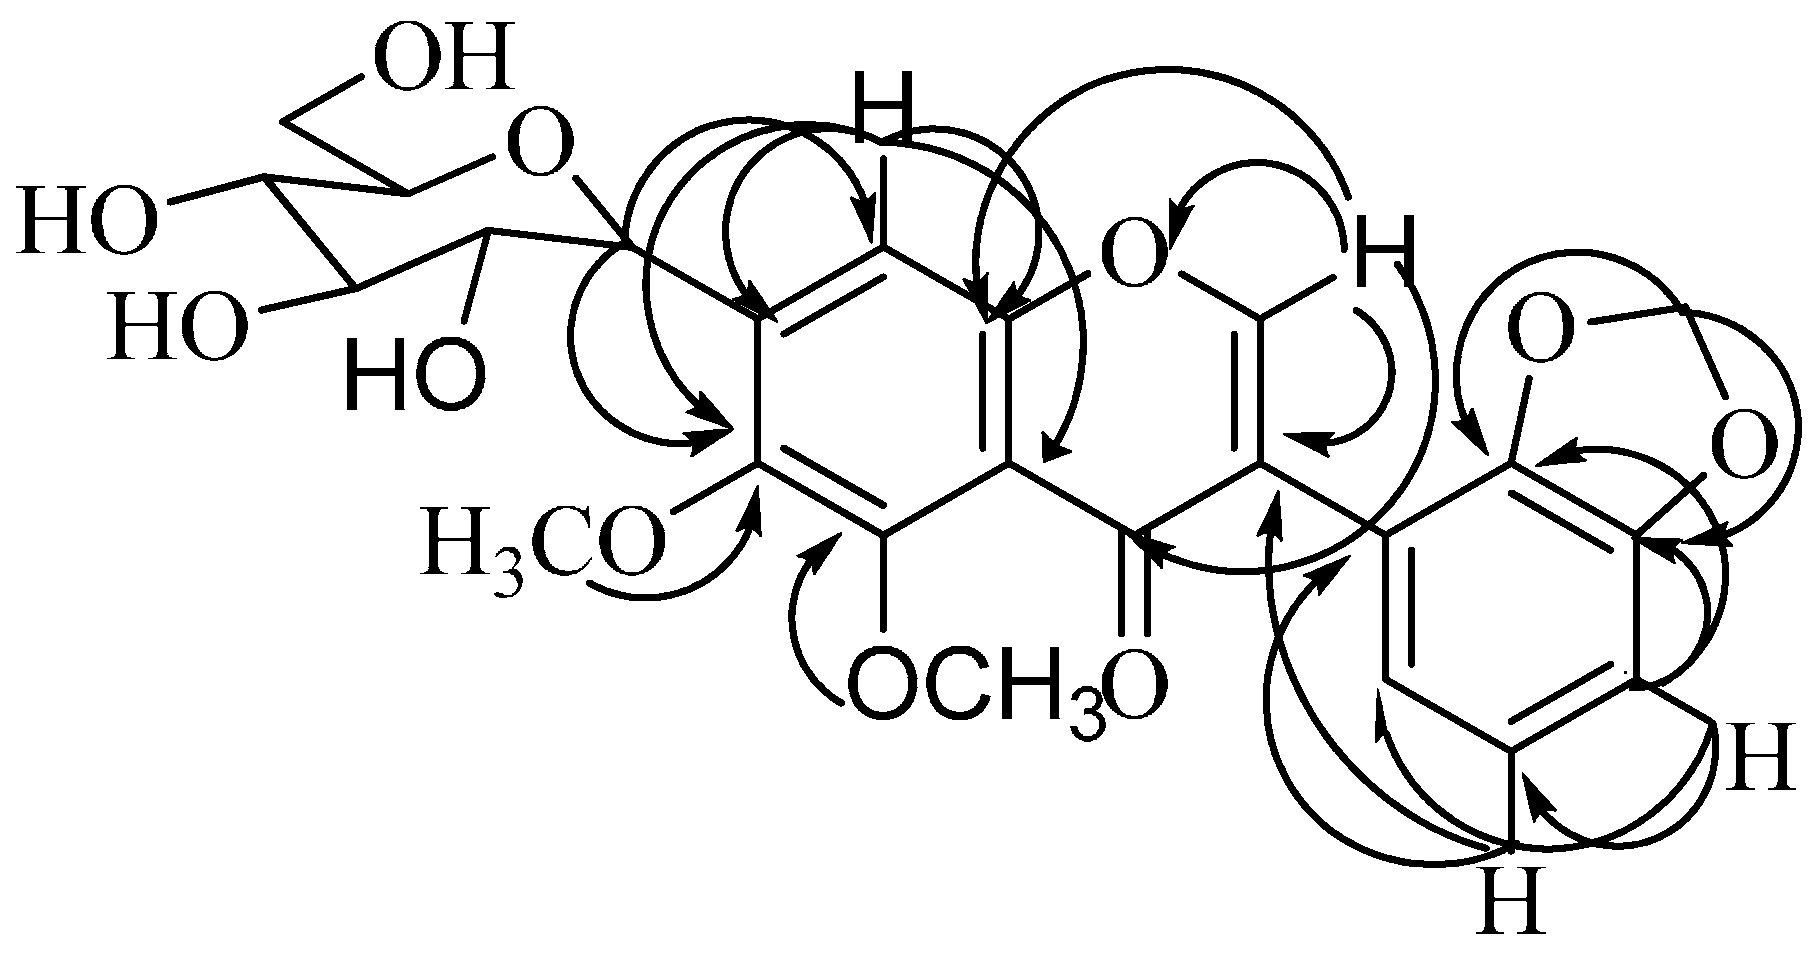
2.1. Chemistry

Seeds of L. sativum were divided into petroleum ether, ethyl acetate and methanol fractions. The methanolic fraction was purified by repeated silica gel column chromatography to give compounds 13 (Figure 1). The known compounds 1 and 2 were identified as 7-hydroxy-4',5,6-trimethoxyisoflavone [7] and 7-hydroxy-5,6-dimethoxy-2',3'-methylenedioxyisoflavone [8], respectively, by comparison of their NMR, MS and physical data with those described in the corresponding literatures. This is the first report of natural isolation of compound 3. In our initial biological study, as shown in Table 2 and Table 3, compound 3 showed higher ability to reduce the hepatotoxicity induced by paracetamol than compounds 1 and 2. This effect could help explain the use of L.sativum in traditional medicine.
Figure 1. Structures of the isolated compounds.
Molecules 19 15440 g001
Compound 3 was isolated as a white solid, which was further crystallized from acetone. It showed a molecular-ion peak at m/z 489.1317 corresponding to the molecular formula C24H25O11. A retro-Diels-Alder reaction (RDA) is the main fragmentation pattern observed in the ESI spectra, resulting in a diagnostic peak at m/z 149 corresponding to the (OCH2O) C6H3–C≡O+ fragment, consistent with a 2',3'-methylenedioxy substitution pattern on the B-ring [9]. The UV spectrum exhibited absorption maxima at 250 and 314 nm, which are characteristic of an isoflavonoid skeleton [10]. Its IR spectrum showed a chelated carbon at 1700 cm−1 (γ-pyrone nucleus) along with other absorption bands at 1600 and 859 cm−1, a characteristic of an aromatic nucleus. The FTIR spectrum of compound 3 shows a broad absorption band around 3489 cm−1 that indicated the presence of hydroxyl groups as expected. The band at 2954 cm−1 is attributed to the CH moieties in the molecule [11]. In the 1H-NMR spectrum of 3 (Table 1), the characteristic resonance for H-2 of an isoflavonoid was observed at δ 8.5 [12]. This assignment was confirmed by long-range connectivities to the quaternary carbons at δ 180.5 (C-4), 150.3 (C-9), 121.7 (C-3), and 120.8 (C-1') in the HMBC spectrum. The 1H-NMR spectrum of 3 (Table 1) showed the presence of two methoxy groups [δ 3.79 (3H, s) and 3.83 (3H, s)] and one methylenedioxy group [δ 6.07 (2H, s)]. In addition, protons at δ 6.76 (1H, d, J = 1.95 Hz, H-4'), 6.98 (1H, d, J = 2.0 Hz, H-5') and 7.15 (1H, d, J = 1.95Hz, H-6')] [9], suggested that C-2' and C-3' were substituted. Moreover a singlet at δ 6.87, corresponding to H-8, showed HMBC correlations with quaternary carbons at δ 150.3 (C-9), 144.2 (C-6),131.5 (C-7) and 116.3 (C-10) [13], as well as H-2 (δ 8.5) showed long-range HMBC connectivities to the carbonyl carbon (δ 180.5, C-4), two quaternary carbons (δ 121.7, C-3 and 122.3, C-6'), and the quaternary oxygenated carbon C-9 (δ 150.3). The 13C-NMR spectrum (Table 1), revealed the presence of two methoxy methyl groups, two methylene groups, ten methane carbons and ten quaternary carbon atoms. In addition, the 13C-NMR spectrum showed two methoxy carbon signals resonating at lower magnetic field δ 60.6 (H-6) and 61.8 (H-5). This suggested that both positions ortho to the methoxy group were substituted [8,9,13]. The carbon shifts of OCH3 substituent usually occur between δ 55.0 and 56.5, but in some cases they are observed further downfield between δ 60.6 and 61.8 [8]. This deshielding effect is seen only when the OCH3 is di-ortho-substituted. From the 1H spectrum, two one proton doublets resonated at δ 4.82 and 3.81 and were assigned to H-1'' (J = 8.9, anomeric) and H-6'' (J = 12.3). Two one proton doublets of doublets at δ 3.75 (J = 8.9, 9.2) and 3.54 (J = 6.2, 12.5) were attributed to H-2'' and H-6''. Multiplet at δ 3.37 (J = 8.9), 3.41 (J = 8.9) and 2.94 (J = 6.2, 8.8) corresponding to H-3'', H-4'' and H-5'' were also seen. The position of the sugar was confirmed by HMBC long-range correlation in which the anomeric H-1'' showed long-range coupling with the signals at 144.2 (C-6), 131.3 (C-7), and 107.8 (C-8) ppm, suggesting the sugar position to be at C-7 of aromatic ring A (Figure 2). Please confirm the highlights.
Figure 2. HMBC correlation of compound 3.
Molecules 19 15440 g002
The appearance of an anomeric carbon (73.7) and proton (4.82) related to those of aromatic C-glycoside data and the anomeric proton correlation with C-6, C-7, and C-8 in the HMBC experiment elucidated its C-glycosidic nature which was confirmed by its resistance to acidic hydrolysis [14]. All correlations in the HMBC spectrum (Figure 2) were in complete agreement with the proposed structure. From the above data, compound 3 could thus be identified as 5,6-dimethoxy-2',3-methylenedioxy-7-C-β-d-glucopyranosylisoflavone.
Table 1. NMR spectroscopic data of the isolated compounds.
Position123
1H13C1H13C1H13C
28.68s153.18.51s153.68.5s153.2
3-124.7-120.9-121.7
4-174.5-180.6-180.5
5-153.2-153.6-157.2
6-137.2-137.5-144.2
7-157.3-157.1-131.3
86.14s96.16.15s94.76.78s107.8
9-151.3-151.9-150.3
10-113.2-113.9-116.3
1'-124.8-120.9-120.8
2'7.52 (d2.0)130.1-149.1-147.8
3'6.94 (d8.0)114.7-148.7-148.2
4'-159.36.75 (d1.99)114.36.76 (d1.95)114.5
5'6.96 (d2,4)114.57.18 (d2.0)121.56.98 (d2.0)121.3
6'7.52 (d2.9)130.66.85 (d1.95)122.67.15 (d1.95)122.3
1''----4.82 (d,8.9)73.7
2''----3.75 (dd8.9,9.2)84.2
3''----3.37 (t8,9)72.2
4''----3.41 (t8.9)71.3
5''----2.94 (ddd6.2, 8.8)84.6
6''----3.81 (d12.3) 3.54 (dd6.2, 12.5)62.2
OCH3-53.83s62.23.84s61.33.79s61.8
OCH3-63.83s61.13.85s62.23.83s60.6
OCH3-4'3.86s55.5-- -
OCH2O-3',4'--6.15s101.36.07s101.6
OH-75.33s-5.35s---

2.2. Biology Assays

2.2.1. Effect of Compounds 1, 2 and 3 on Liver Function

The data summarized in Table 2 indicated that AST, ALT, ALP, GGT activities were significantly increased (p < 0.05) in rats that received paracetamol (group 2) or rats that received paracetemol + compound 1 (group 3) or rats that received paracetemol + compound 2 (group 4) when compared with the control group (group 1). However, no significant differences of these parameters were seen when the compound 3 treated group (group 5) is compared to the control group. There is a also a significant decrease (p < 0.05) in AST, ALT, ALP, GGT activities in rats that received paracetemol + compound 1 (group 3) or rats the received paracetemol + compound 2 (group 4) or rats that received paracetemol + compound 3 (group 5) when compared with the paracetemol group (group 2). In the assessment of liver injury by paracetemol, the analysis of levels of enzymes such as AST and ALT is widely used. Necrosis or membrane damage releases the enzymes into circulation and hence they can be measured in the serum. High levels of AST indicate liver damage. ALT is more specific to the liver, and is thus a better parameter for detecting liver injury. Elevated levels of serum enzymes are indicative of cellular leakage and loss of functional integrity of the cell membranes in the liver. Serum ALP and bilirubin levels, on the other hand, are related to the function of hepatic cells. Administration of paracetemol caused a significant (p < 0.001) elevation of the levels of enzymes such as AST, ALT, ALP and GGT [15]. In agreement with our results mean serum AST, ALT, ALP levels and bilirubin concentration were significantly increased in the CCl4 induced hepatotoxicity group of rats compared to the control (p < 0.05). However significant reduction in these parameters were found in groups treated with Lepidium sativum [7].
Table 2. Levels of serum ALT, AST, ALP and GGT of normal and experimental groups.
GroupALT(U/L)AST(U/L)ALP(U/L)GGT(U/L)
Control Group 140 ± 1.543 ± 2.133 ± 2.460 ± 1.4
Group2: Paracetamol70 ± 1.6 *80 ± 2.5 *71 ± 2.2 *117 ± 2.5 *
Group 3: Paracetamol + compound 160 ± 1.45 *#60 ± 2.2 *#53 ± 1.9 *#91 ± 2.4 *#
Group 4: Paracetamol + compound 261 ± 1.33 *#62.2 ± 2.3 *#54 ± 1.8 *#95 ± 2.7 *#
Group 5: Paracetamol + compound 350 ± 1.2 #53.5 ± 2.1 #39 ± 2.1 #72 ± 1.6 #
Values are expressed as means ± SE; n = 10 for each treatment group; Significant difference from the control group at * p ˂ 0.05; Significant difference from paracetemol group at # p ˂ 0.05.

2.2.2. Effect of Compounds 1, 2 and 3 on Oxidative Stress Parameters

Table 3 showed that plasma total antioxidant capacity and liver SOD, GPx, CAT, GST and GSH were significantly decreased (p < 0.05) in Paracetamol group (Group 2) compared to control group (group 1). However the concentrations and activities of total antioxidant enzymes GST, SOD and CAT were significantly increased when compound 1, 2 or 3 was administered (group 3, 4 and 5) while animals treated with Paracetamol had a significant increase (p < 0.05) in the level of MDA concentration compared to control group as well as treatment with compound 1, 2 or 3 (groups 3, 4 and 5) significantly overcomes the effect of Paracetamol on hepatic lipid peroxidation by lowering hepatic MDA. lipid peroxidation in the Paracetemol group reveals hepatic damage due to paracetemol ,which was supported by increasing the activities of ALT, AST, ALP and GGT. Compounds 1, 2 and 3 decreases the peroxidation of lipids and SOD activity indicates hepatocellular damage because it scavenges the superoxide anion to form hydrogen peroxide, thus decreases the toxic effect caused by this radical [15]. In agreement with our results Lepidium sativum seed extract protects the liver from damage by CCl4 and this was supported by histology and biochemical parametes of liver injury. The hepatoprotective action of the plant may be due to the ability of the plant to overcome lipid peroxidation in the liver. Lepidium sativum inhibits free radicals mediated damage and so protects from liver injury [7]. The hepatoprotective effect of Lepidium sativum is due to flavonoids, triterpens and tannin as antioxidant agents that decrease free radicals formation [16,17,18]. On the basis of results obtained it can be concluded that the methanolic extract of Lepidium sativum seeds seems to possess hepatoprotective effect in rats.
Table 3. Changes in the levels of plasma total antioxidant capacity (mM/L) and liver MDA, SOD, GPx, CAT, GST and GSH of male albino rats in normal and experimental rats.
GroupTAC (mM/L)MDA
nmole/g tissue
SOD units/g tissueGPx units/g tissueCAT mole/min/g tissueGSH
μmol/
mg protein
GST
units/g
tissue
Group 1: Control1.2 ± 0.04160 ± 3.2360 ± 1.25150 ± 1.50.8 ± 0.0260 ± 1.32.2 ± 0.11
Group 2: Paracetamol0.52 ± 0.02 *547 ± 9.46 *24 ± 2.4 *112 ± 1.2 *0.42 ± 0.01 *35 ± 0.85 *1.1 ± 0.01 *
Group 3: Paracetamol + compound 10.61 ± 0.03 *#320 ± 8.5 *#30 ± 2.1 *#118 ± 1.5 *#0.56 ± 0.01 *#40 ± 0.65 *#1.34 ± 0.01 *#
Group 4: Paracetamol + compound 20.65 ± 0.03 *#323 ± 9.11 *#33 ± 2.2 *#115 ± 1.4 *#0.55 ± 0.01 *#42 ± 0.54 *#1.37 ± 0.01 *#
Group 5: Paracetamol + compound 30.73 ± 0.02 #211 ± 5.22 #36 ± 1.5 #120 ± 6.5 #0.621 ± 0.01 #45.5 ± 1.2 #1.50 ± 0.8 #
Significant difference from the control group at * p ˂ 0.05; Values are expressed as means ± SE; n = 10 for each treatment group; Significant difference from paracetemol group at # p ˂ 0.05.

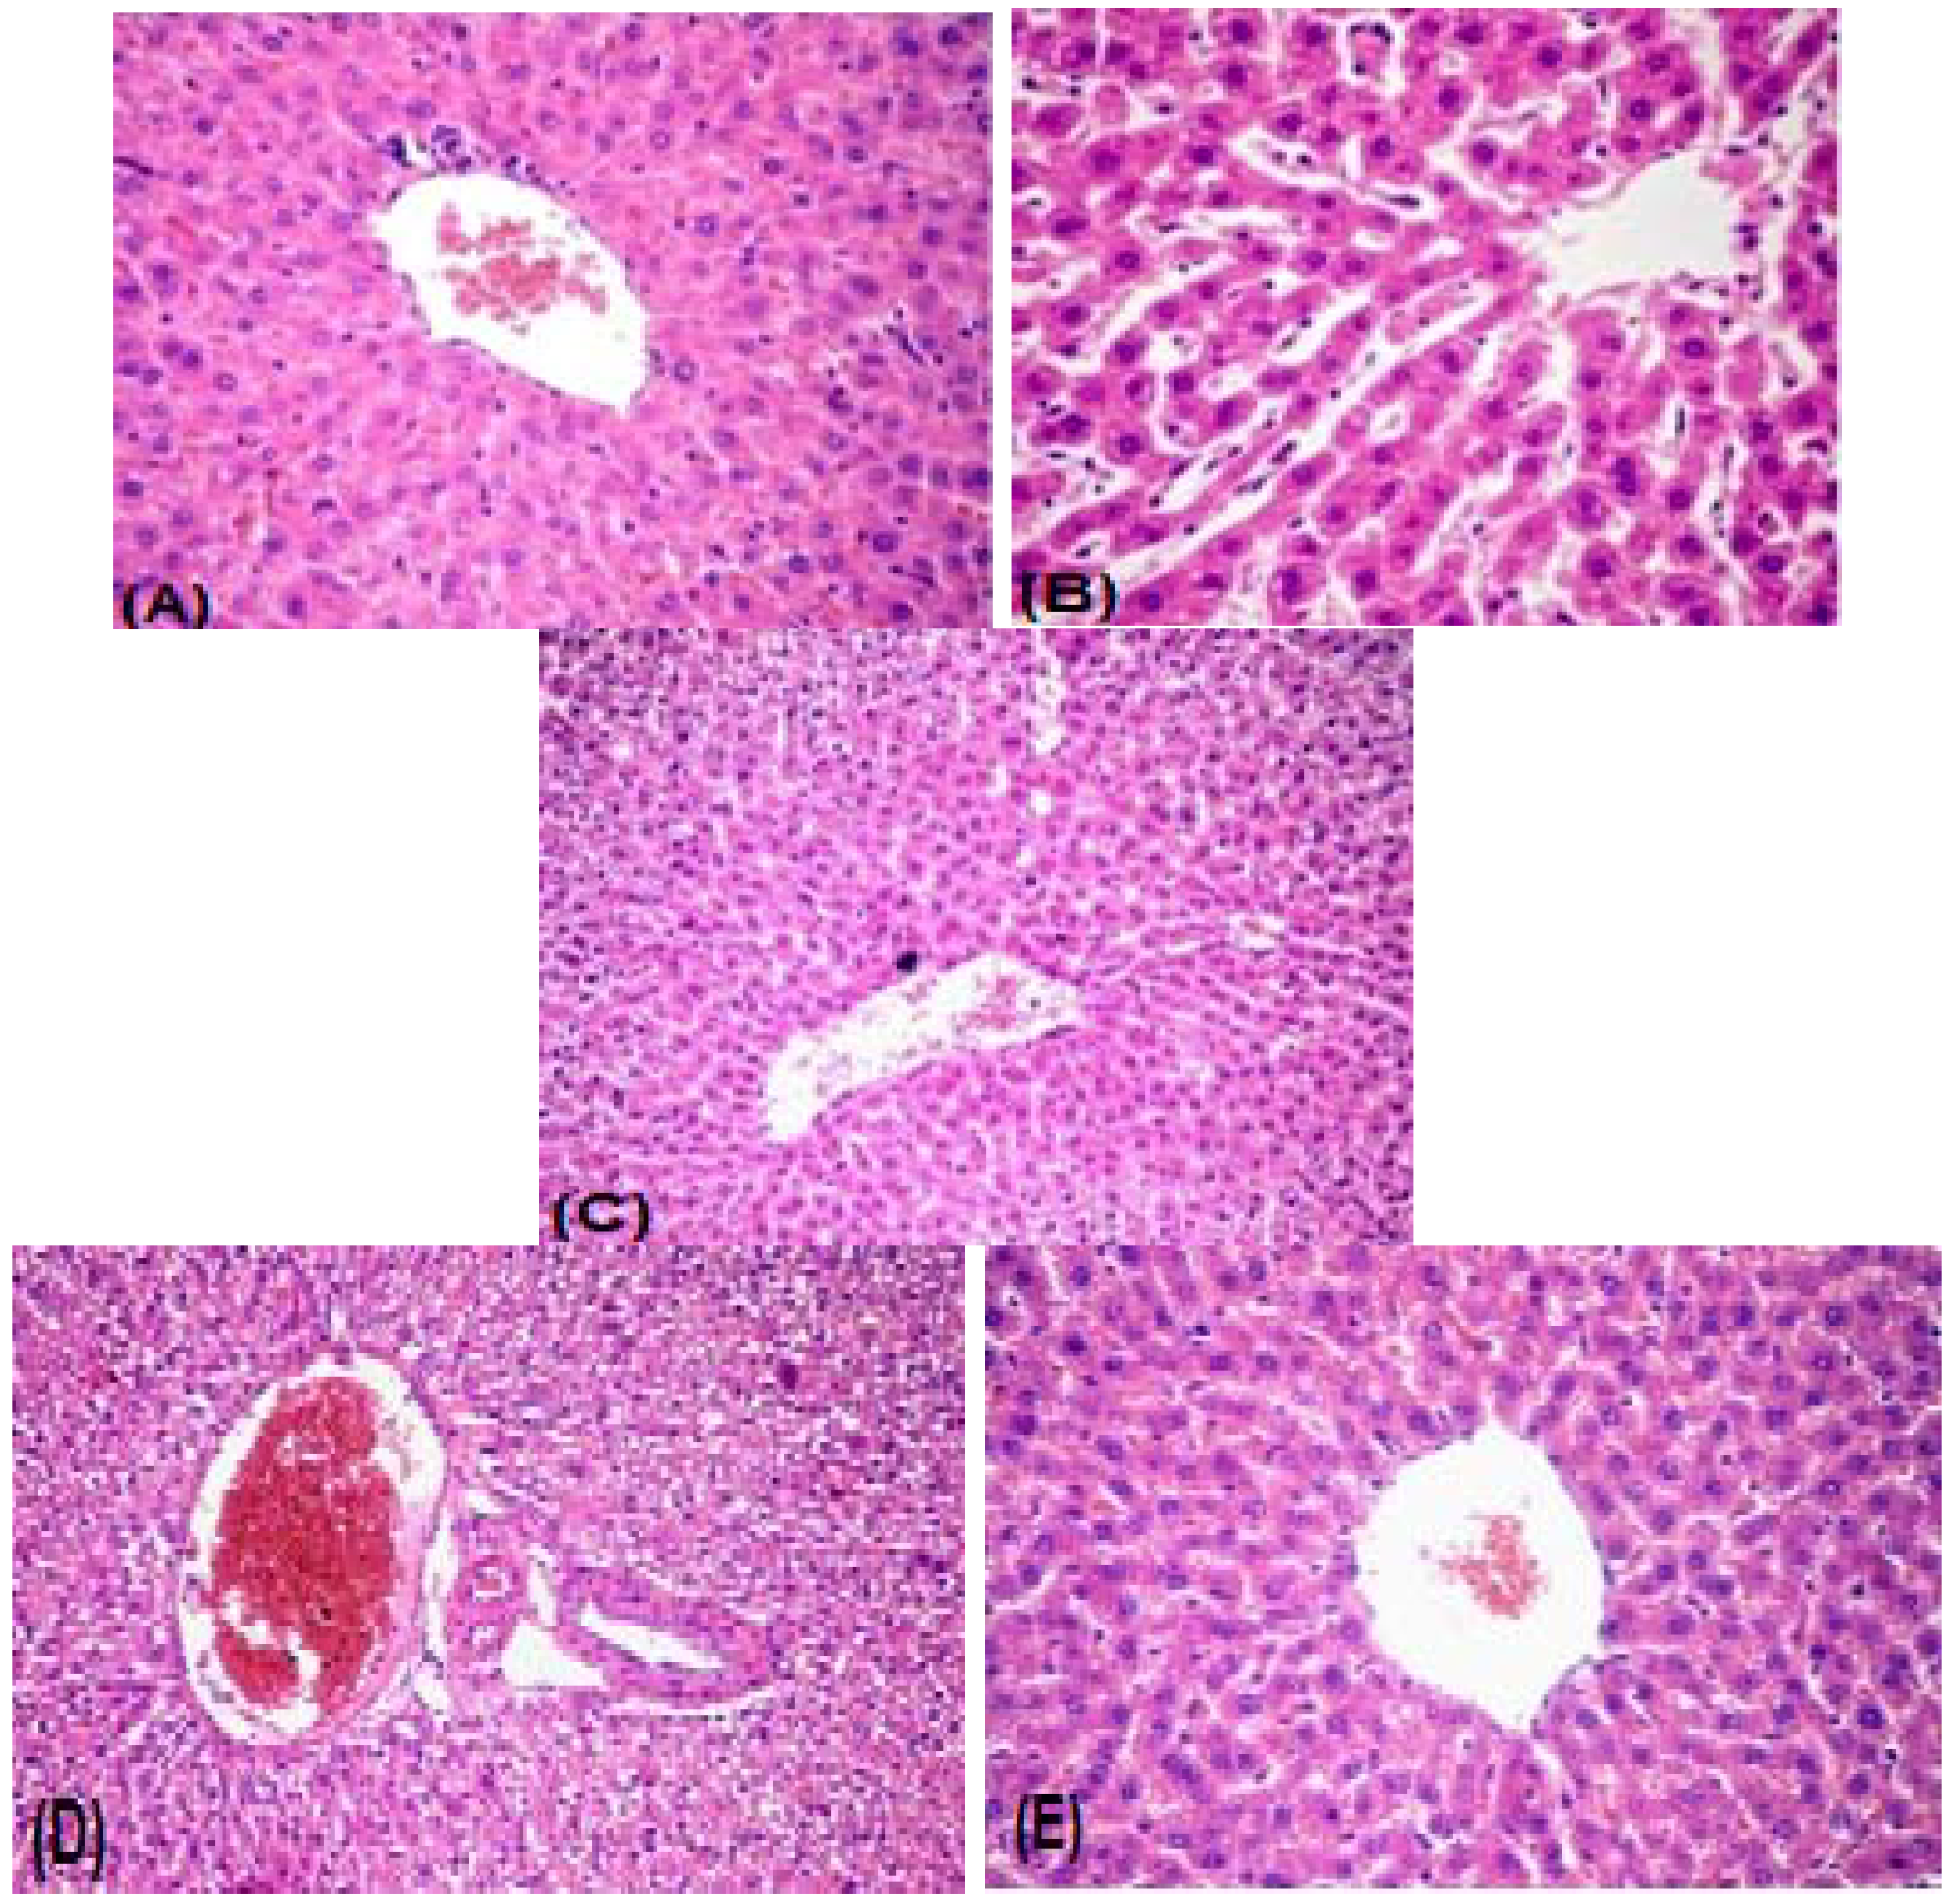
2.2.3. Histopathology

Histopathological examination of the liver of control group revealed normal hepatic architecture, cellular and nuclear configurations (Figure 3A). Histopathological alterations observed in the paracetemol-treated group included sinusoidal dilatation and atrophy of hepatocytes (Figure 3B). The livers of rats treated with paracetemol + compound 1 showed no areas of necrosis and they regained their normal structure (Figure 3C). Liver sections of rats treated with paracetemol + compound 2 showed moderate dilatation of portal blood vessels and vacuolar degeneration of hepatocytes (Figure 3D). Livers of rats treated with paracetemol + compound 3 appeared more or less similar to the control sections (Figure 3E).
Figure 3. (A) normal liver section of rats; (B) liver sections in the paracetemol treated group exhibited cirrhosis, and macro nodular structures surrounded by fibrous tissue; (C) rats treated with paracetamol plus compound 1; (D) rats treated with paracetamol plus compound 2; (E) rats treated with paracetamol + compound 3. H&E stain (40×).
Molecules 19 15440 g003

3. Experimental Section

3.1. General Information

Optical rotations were measured in MeOH or H2O on a Perkin-Elmer241 polarimeter (Manchester, UK) equipped with a sodium lamp (589 nm) and a 1 dm microcell. The melting points were determined using a Digital Melting Point Apparatus (model IA 8103, Electro Thermal Engineering Ltd., Soutthend-on-Sea, UK). The UV spectra were recorded with a Perkin-Elmer Lambda 2UV/VIS spectrophotometer. IR spectra (KBr) were recorded on a Perkin-Elmer 1650 FT-IR spectrometer. 1H- and 13C-NMR spectra were recorded in CDCl3 on a Bruker Avance DRX-500 spectrometer (Oxford, UK) 1H at 500 MHz and 13C at 125 MHz), and 2D-NMR experiments were performed using Bruker’s standard programs [19]. ESI and high resolution mass spectra were recorded using a Finnigan MAT 90 instrument (Manchester, UK) and a VG Auto Spec-3000 spectrometer (Manchester, UK), respectively. TLC was carried out on precoated silica gel 60 F254 (Merck, Munich, Germany), and spots were visualized by heating after spraying with 50% H2SO4. Column chromatography was carried out on silica gel 60 (63–200 μm, Merck).

3.2. Plant Material

Lepidium sativum L. seeds were collected from a local market in Egypt (May 2012), authenticated by Prof. Dr. F. Gamal, Prof. of the Aromatic and Medicinal Plants, Botany Department, Faculty of Science, Zagazig University (Zagazig, Egypt). The voucher specimen of L. sativum is number L2620 and was kept in a dark and dry container.

3.3. Plant Extract

The dried, powdered roots (750 g) were extracted successively with petroleum ether, EtOAc, and MeOH (3 L each) for 96 h to yield after solvent evaporation the corresponding petroleum ether (4.1 g), EtOAc (3.8 g), and MeOH (25.4 g) extracts. The methanol crude extract was chromatographed over silica gel (800 g) and eluted with mixtures of 100% CHCl3-100% MeOH as eluents to give three fractions F1 to F3 (9:1, 8.5:1.5, 8:1 v/v). Fraction F2 (7.4 g) was rechromatographed on silica gel with CHCl3/MeOH mixtures (9:1, 8.5:1.5, 8:1 v/v) to yield compounds 1 (60 mg), 2 (95 mg) and 3 (126 mg). See Figure 1.

3.4. 7-Hydroxy-4',5,6-trimethoxyisoflavone (1)

White amorphous solid; m.p. 265–267 °C; UV (MeOH) 275, 331 nm; IR (KBr) νmax 3440, 2955, 1658, 1565, 1430, 1381, 1291, 1153, 1061, 1036, 841 cm−1; 1H- and 13C-NMR (Table 1). The melting point was identical to that of an authentic sample and the value reported for this compound [6]; HRESIMS: 329. 0945 ([M + H]+, C18H17O6; calc.329.3160).

3.5. 7-Hydroxy-5,6-dimethoxy-2',3'-methylenedioxyisoflavone (2)

White amorphous solid; m.p. 270–271 °C; UV (MeOH) λmax 259, 317 nm; IR (KBr) νmax 3451, 2958, 1648, 1622, 1571, 1463, 1373, 1297, 1229, 1147, 1071, 1042 ,817 cm−1; 1H- and 13C-NMR (Table 1). The melting point was identical to that of an authentic sample and the value reported for this compound [7]; HRESIMS: 343.0738 ([M + H]+, C18H15O7; calc.343.2995).

3.6. 5,6-Dimethoxy-2',3'-methylenedioxy-7-C-β-d-glucopyranosylisoflavone (3)

White amorphous solid (purity of compound > 98%); m.p. 277–279 °C; UV (MeOH) λmax nm 250, 314. IR (KBr) νmax cm−1: 3,489, 2,954, 1,700, 1,600, 1,591, 1,343, 1,081, 901, 859. 1H- and 13C-NMR see Table 1. ESIMS: 489 (12, M+H), 461 (14), 451 (31), 427 (11), 149 (94), 261 (2), 203 (2), 136 (3). HRESIMS: 489.1317 ([M + H]+, C24H25O11; calc.489.4405).

3.7. Animals

Adult Sprague Dawley male rats (albino) weighing around 180 to 200 g were purchased from the breeding unit of the Egyptian Organization for Biological Products and Vaccines (Abbassia, Cairo, Egypt). The animals were housed in steel mesh cages and maintained for a one week acclimatization period on commercial standard and pellet diet and drinking water ad libitum. The housing cycle was 12:12 h light-dark cycle under controlled temperature (20–22 °C). The animal use protocol had been approved by the Institutional Animals Ethics Committee (IAEC) of Tanta University.

3.8. Animal Treatments

The rats were fasted overnight (16–18 h) prior to administration of an oral dose (100 mg/kg) of paracetemol once a day for eight weeks dissolved in sterile normal saline warmed to 40 °C. The rats were divided into five experimental groups of 10 animals each. Group 1 (control group); rats were orally administered with normal saline (1 mL/kg) for eight weeks; Group 2 (paracetemol group); rats were orally administered with paracetamol (100 mg/kg b.wt.) for 8 weeks. Group 3; paracetemol (100 mg/kg b.wt.) + compound 1 treated group (100 mg/kg b.wt/week). Group 4; paracetemol + compound 2 treated group (100 mg/kg b.wt/week) Group 3; paracetemol + compound 3 treated group (100 mg/kg b.wt/week). For co-administration of paracetemol and L. sativum, compounds 1, 2 and 3 were gaved at a dose of 100 mg/kg immediately after oral administration of paracetemol for eight weeks. We have selected the random dose of paracetemol from the literature. Regarding the efficacy of L. sativum we have chosen a minimal effective dose of 100 mg/kg b. wt. which shows a great response against paracetemol intoxication. Though we have tested up to 2000 mg/kg b.wt dose and observed no signs of mortality, toxicity and gross behavioral changes [15].

3.9. Sample Preparation

Animals were fasted overnight and for clinical chemistry blood samples were obtained from the orbital sinus using capillary tubes (with and without heparin as per requirement) under mild ether anesthesia. Blood for hematology studies was collected into tubes containing ethylenediaminetetra- acetic acid (EDTA) as an anti-coagulant. After animals were sacrificed, the liver was instantly removed, washed three times in ice cold saline and blotted on ash free filter paper, then used for preparation of tissue homogenates for estimation of tissue malondialdehyde (MDA) and glutathione (GSH) levels and the activity of superoxide dismutase (SOD), glutathione peroxidase (GPx), glutathione S-transferase (GST) and catalase (CAT) enzyme levels.

3.10. Biochemical Analysis

Serum was used to estimate the following liver enzymes: alanine transaminase (ALT) and aspartate transaminase (AST) [20], alkaline phosphatase (ALP) [21], γ-glutamyl transferase (GGT) [22], Total antioxidant capacity was measured in plasma [23]. Hepatic malondialdehyde (MDA) level was estimated [24]. The activity of glutathione S-transferase (GST) was measured [25]. The catalase activity in tissue supernatant was measured [26], as were superoxide dismutase (SOD) [27], reduced glutathione [28] and glutathione peroxidase (GPx) levels [29].

3.11. Preparation of Tissue Homogenates

Tissue homogenates were prepared as reported by Sakran et al. [15]. Briefly, specimens were separated into two parts. Each piece was weighed and homogenized separately with a Potter Elvenhjem tissue homogenizer. The crude tissue homogenate was centrifuged at 11,739 rpm, for 15 min in a cold centrifuge and the resultant supernatant was used for the different estimations [30]. Briefly, liver were immediately excised, washed using chilled saline solution, blotted, weighed and processed for biochemical studies. A small piece of each was immediately fixed in 10% formalin. These formalin-fixed tissues were embedded in paraffin, sectioned (5 μm), stained with hematoxylin and eosin (H&E), and examined under a light microscope for histopathological assessment.

3.12. Statistical Analysis

Statistical analysis using SPSS software version 16 [31] was performed using one-way analysis of variance (ANOVA) to assess significant differences among different groups [32]. The results are considered to be significant when p ˂ 0.05.

4. Conclusions

A new isoflavone C-glycoside was isolated from the seeds of L. sativum (Asali). Based on spectroscopic techniques and chemical evidence, its structure was elucidated as 5,6-dimethoxy-2',3'-methylenedioxy-7-C-β-d-glucopyranosylisoflavone (3) The present study indicated that compound 3 could improve the liver functions, the lipid profile in serum and decrease the generation of free radicals by inducing the antioxidant defense mechanism. New isoflavonoid 3 could be used as a potential antioxidant against paracetamol intoxication with its antioxidant properties and could restore the normal liver functions.

Acknowledgments

We thank staff of Faculty of Sciences Aristotle University of Thessaloniki, Greece for the performance of some1D&2D NMR & MS spectral analyses experiments. The authors are also grateful to F. Gamal, the Biochemistry Department, Faculty of Science, Zagazig University for identification of plant.

Author Contributions

Mohamed Sakran and Yasser Selim have supervised the study. Yasser Selim have written and revised the paper. Yasser Selim performed the isolation of new compounds and has analyzed the data. Mohamed Sakran performed the biological assays and analyzed the results of hepatotoxicity and revised the paper. Nahla Zidan prepare the plant and performed in the biological assays.

Conflicts of Interest

The authors declare no conflict of interest.

References

  1. Loatfy, B. Flora of Egypt; Al Hadara Publishing: Cairo, Egypt, 1999; Volume 1. [Google Scholar]
  2. Broun, A.F.; Massey, R.E. Flora of the Sudan; Wellington House, Buckingham Gate: London, UK, 1929; p. 5. [Google Scholar]
  3. Merzouki, A.; Ed-derfoufi, F.; Molero, M.J. Contribution to the knowledge of Rifian traditional medicine. II: Flok Medicine in ksar lakbir district (NW Morocco). Fitoterapia 2002, 71, 278–307. [Google Scholar] [CrossRef]
  4. Maghrani, M.; Zeggwah, N.; Michel, J.; Eddouks, M. Antihypertensive effect of Lepidium sativum in spontaneously hypertensive reats. J. Ethnopharmacol. 2005, 100, 193–197. [Google Scholar] [CrossRef] [PubMed]
  5. Sahu, S.C.; Washington, M.C. Effect of ascorbic acid and curcumin on quercetin-induced nuclear DNA damage, lipid peroxidation and protein degradation. Cancer Lett. 1992, 63, 237–241. [Google Scholar] [CrossRef] [PubMed]
  6. Aranda, E.; Garcia-Romera, I.; Ocampo, J.I.; Carbone, V.; Mari, A.; Malorni, A.; Sannino, F.; de Martino, A.; Capasso, R. Chemical characterizationand effects on Lepidium Sativum of the native and biomediated components of dry olive mill residue. Chemosphere 2007, 69, 229–239. [Google Scholar] [CrossRef]
  7. Horie, T.; Shibata, K.; Yamashita, K.; Fujii, K.; Tsukayama, M.; Ohtsuru, Y. Studies of the selective o-alkylation and dealkylation of flavonoids. A convenient method for synthesizing 6- and 8-methoxylated 5,7 dihydroxyisoflavones. Chem. Pharm. Bull. 1998, 46, 222–230. [Google Scholar] [CrossRef]
  8. Roitman, J.N.; James, L.F. Chemistry of toxic range plants. Highly oxygenated fiavonol methyl ethers from Gutierrezia micmcephala. Phytochemistry 1985, 24, 835–848. [Google Scholar] [CrossRef]
  9. Kingston, D.G.I. Mass spectrometry of organic compounds—VI: Electron-impact spectra of flavonoid compounds. Tetrahedron 1971, 27, 2691–2700. [Google Scholar] [CrossRef]
  10. Markham, K.R.; Geiger, H. The Flavonoids: Advances in Research Since 1986; Harborne, J.B., Ed.; CRC Press: London, UK, 1994; p. 447. [Google Scholar]
  11. Andreas, K.; Susann, D.; Thomas, H.; Adiaratou, T.; Berit, S.P. Synthesis and characterization of branched polysaccharides by reaction of cellulose with 2,3,4,6-tetraacetyl-1-bromo-α D glucopyranoside. Arkivoc 2012, 3, 76–89. [Google Scholar]
  12. Minami, M.; Yoshikawa, H. A simplified assay method of superoxide dismutase activity of clinical use. Clin. Chem. Acta 1979, 92, 337–342. [Google Scholar] [CrossRef]
  13. Calvert, D.J.; Cambie, R.C.; Davis, B.R. 13C-NMR spectra of polymethoxy-polymethylenedioxyflavonols. Org. Magn. Reson. 1979, 12, 583–586. [Google Scholar] [CrossRef]
  14. Miserez, F.; Potterat, O.; Marston, A.; Mungai, G.M.; Hostettmann, K. Flavonol glycosides from Vernonia galamensis ssp. nairobiensis. Phytochemistry 1996, 43, 283–286. [Google Scholar] [CrossRef]
  15. Sakeran, M.I.; Zidan, N.; Rehman, H.; Aziz, A.T.; Saggu, S. Abrogation by Trifolium alexandrinum root extract on hepatotoxicity induced by acetaminophen in rats. Redox Rep. 2014, 19, 26–33. [Google Scholar] [CrossRef] [PubMed]
  16. Banskota, A.H.; Tezuka, Y.; Adnyaa, I.K. Hepatoprotective effect of commbretum quadrang, ulare and its constituents. Biol. Pharm. Bull. 2000, 23, 456–460. [Google Scholar] [CrossRef] [PubMed]
  17. Takeoka, G.R.; Dao, L.T. Antioxidant constituent of almond [Ptunus dulicis (mill) D.A. Webb.] hulls. J. Agric. Food Chem. 2003, 51, 496–501. [Google Scholar] [CrossRef] [PubMed]
  18. Babu, B.H.; Shylesh, B.S.; Padikkala, J. Antioxidant and hepatoprotective effect of Acanthus ilicifolius. Fitoterapia 2001, 72, 272–277. [Google Scholar] [CrossRef] [PubMed]
  19. XWIN-NMR Software, Version 2.6; Bruker Co.: Oxford, UK, 2002.
  20. Ritman, S.; Frankel, S. A colorimeteric determination of GOT and GPT. Am. J. Clin. Pathol. 1957, 28, 56–63. [Google Scholar] [PubMed]
  21. Bessey, O.A.; Lowry, O.H.; Brock, M.J. A method for the rapid determination of alkaline phosphatase with five cubic millimeters of serum. J. Biol. Chem. 1964, 164, 321–329. [Google Scholar]
  22. Rosalki, S.B. Gamma-glutamyltranspeptidase. In Advances in Clinical Chemistry; Bodanski, O., Latner, A.L., Eds.; Academic Press: New York, NY, USA, 1975; Volume 17, pp. 53–107. [Google Scholar]
  23. Koracevic, D.; Koracevic, G.; Djordjevic, V.; Andrejevic, S.; Cosic, V. Method for the measurement of antioxidant activity in human fluids. J. Clin. Pathol. 2001, 54, 356–361. [Google Scholar] [CrossRef] [PubMed]
  24. Esterbauer, H.; Cheeseman, K.H. Determination of aldehydic lipid peroxidation products: Malonaldehyde and 4-hydroxynonenal. Methods Enzymol. 1990, 186, 407–421. [Google Scholar] [PubMed]
  25. Habig, W.H.; Pabst, M.J.; Jakoby, W.B. Glutathione S-transferase, the first enzymatic step in mercapturic acid formation. J. Biol. Chem. 1974, 249, 7130–7139. [Google Scholar] [PubMed]
  26. Xu, J.B.; Yuan, X.F.; Lang, P.Z. Determination of catalase activity and catalase inhibition by ultraviolet spectrophotometery. Chin. Environ. Chem. 1997, 16, 73–76. [Google Scholar]
  27. Marklund, A.; Marklund, G. Involvement of the superoxide anion radical in the auto oxidation of pyrogallol and convenient assay for superoxide dismutase. Eur. J. Biochem. 1974, 47, 469–474. [Google Scholar] [CrossRef] [PubMed]
  28. Beutler, E.; Duron, O.; Kelly, B.M. Improved method for the determination of blood glutathione. J. Lab. Clin. Med. 1963, 61, 882–888. [Google Scholar] [PubMed]
  29. Lawrence, R.A.; Burk, R.F. Glutathione peroxidase activity in selenium-deficient rat liver. Biochem. Biophys. Res. Commun. 1976, 71, 952–958. [Google Scholar] [CrossRef] [PubMed]
  30. Scheuer, P.J.; Chalk, B.T. Clinical Test: Histopathology; Wolfe Medical Publications: London, UK, 1986. [Google Scholar]
  31. SPSS Software for Windows, Version 16; IBM Corporation: Armonk, NY, USA, 2010.
  32. Sokal, R.P.; Rohlf, F.J. The Principles and Practice of Statistics in Biological Research, 1st ed.; Freeman WH: San Francisco, CA, USA, 1969; pp. 469–484. [Google Scholar]
  • Sample Availability: Samples of the compounds 1, 2 and 3 are available from the authors.

