1. Introduction
Due to the increasing global interest in Traditional Chinese Medicines (TCMs), a legal foundation for establishing the scientific and appropriate quality standards for TCMs is both essential for the modernization and internationalization of TCMs and necessary to satisfy the urgent need for long-term studies to ensure their clinical safety and efficacy [
1].
In the past several decades, many changes have taken place in the development of TCMs quality standards, especially due to the wide application of modern analytical techniques. Chromatography coupled with spectrometric detectors such as the diode array detector (DAD), have provided previously inaccessible information that has been helpful in distinguishing false herbs and evaluating the quality of TCMs [
2,
3]. Because the quantitative determination of a single marker compound was increasingly important in the quality control of TCMs, HPLC had been adopted for the quantitative analysis of 1,206 Chinese herbs in the 2010 edition of the
Chinese Pharmacopoeia. However, problems may arise due to a lack of adequate reference standards, high cost of detection techniques and instability of some reference standards. Moreover, the preparation and calibration of the reference standards is time-consuming, labor intensive and expensive because of the complexity of the chemical composition of TCMs. Additionally, the determination of a single marker compound was far from sufficient for comprehensively evaluating the quality of TCMs. Consequently, the simultaneous determination of multi-active components in TCMs had become the primary aim of research in the field of quality evaluation of TCMs.
A reference extractive is a substance containing known contents of multiple active compounds. To date, 16 reference extractives had been recorded in the
Chinese Pharmacopoeia (2010 edition), such as the total extractive of
Ginkgo biloba, the total saponin extractive of
Dioscorea pathaica and the volatile oil of
Illicium verum Hook f. A great majority of the reference extractives were primarily used for thin-layer chromatography (TLC). TLC identification using reference extractives has a much higher specificity than the use of single reference standards and is particularly useful as a replacement for reference standards that are unstable or difficult to obtain. To a certain extent, it is equivalent to a qualitative fingerprint. Based on our literature survey, few reports focusing on the applicability and feasibility of reference extractives used for quantitative analysis of TCMs have been presented and published [
4]. If the reference extractive could be used for both qualitative identification and quantitative analysis, then this measure would be equivalent to multi-component quality evaluation, which would certainly be beneficial for the quality control of TCMs. The most fundamental and essential requirement for a reference extractive suitable for use in quantitative analysis was that it had to have a stable and reproducible chromatographic behavior, which also requires that the composition of the compounds in the reference extractive be stable as well. Accordingly, the reference extractives should contain known contents of each compound in proportions that are fairly fixed and close to those found in the crude herbs. In this way, the reference extractive could be used for both the identification of chromatography peaks and quantitative analysis.
S. miltiorrhiza Bunge is an important and representative TCM known as “Danshen”. Danshen root and its preparations, such as compound Danshen tablets, compound Danshen dripping pills and Danshen injections, are used in the prevention and treatment of coronary heart disease, cerebrovascular disease, hyperlipidemia, hepatitis, chronic renal failure, dysmenorrhoea and neurasthenic insomnia [
5,
6,
7]. Pharmacological studies of
S. miltiorrhiza Bunge have revealed a variety of biological activities, including anti-tumor, anti-inflammatory, antimicrobial, anti-viral and antioxidant effects [
8,
9,
10,
11]. Thus, the worldwide consumption of
S. miltiorrhiza Bunge and its extractives has been increasing due to its comprehensive pharmacological activities. As a result, quality control of
S. miltiorrhiza Bunge is very important, especially for its clinical efficacy and safety. According to the current literature reports, several methods including HSCCC [
12], HPTCL [
13], NAPE [
14] HPLC [
15,
16,
17], and HPLC-MS [
18,
19,
20,
21] have been established for the quality control of
S. miltiorrhiza Bunge, and substantial bioactive components such as danshensu, protocatechuic aldehyde, salvianolic acid B, cryptotanshinone, tanshinone IIA and tanshinone I were separated, identified and used for quantitative analysis. In China, quality control of
S. miltiorrhiza Bunge was performed by the determination of tanshinone IIA and salvianolic acid B as the marker compounds using HPLC [
22]. However, studies show that nonpolar compounds, such as tanshinone I and cryptotanshinone, were also beneficial active compounds responsible for good biological activities, with anti-tumor properties [
23,
24]. Since many of the existing quality control methods require a large amount of reference standard, and these standards are difficult to separate and expensive to generate, this places a significant economic burden on the quality control processes associated with production of marker compounds. Accordingly, it was particularly important and imperative to develop a reference substance which could be substituted single reference for quantitative analysis and could be easily and rapidly prepared as well.
Therefore, taking S. miltiorrhiza Bunge as an example, the preparation of the reference extractive using tanshinone IIA, tanshinone I and cryptotanshinone as the marker compounds is described in detail. Moreover, the quantitative analysis method using the prepared reference extractive has been tentatively applied to the quality assessment on the crude herbs of S. miltiorrhiza Bunge by comparison with the single reference standard. The final goal of this work was to develop a rapid and efficient quantitative analysis method by using reference extractive, which could be used for quality control of more traditional Chinese herbs, especially for the lack or high price of reference standards, ultimately contributing to the development of TCMs.
2. Results and Discussion
2.1. Selection of Chromatographic Conditions
To obtain the optimal elution conditions for the separation and determination of the marker compounds, various isocratic gradients of aqueous solutions and acetonitrile at a flow rate of 1.0 mL/min were investigated. In the optimal isocratic elution, the peaks of the three compounds could be well separated with aqueous phosphoric acid (0.02%, v/v) and acetonitrile (58%, v/v) as the mobile phase. The UV absorption maxima for cryptotanshinone, tanshinone I and tanshinone IIA was located at 263, 245 and 270 nm, respectively. Hence, the characteristic chromatographic patterns were obtained by setting the detection wavelength to 270 nm.
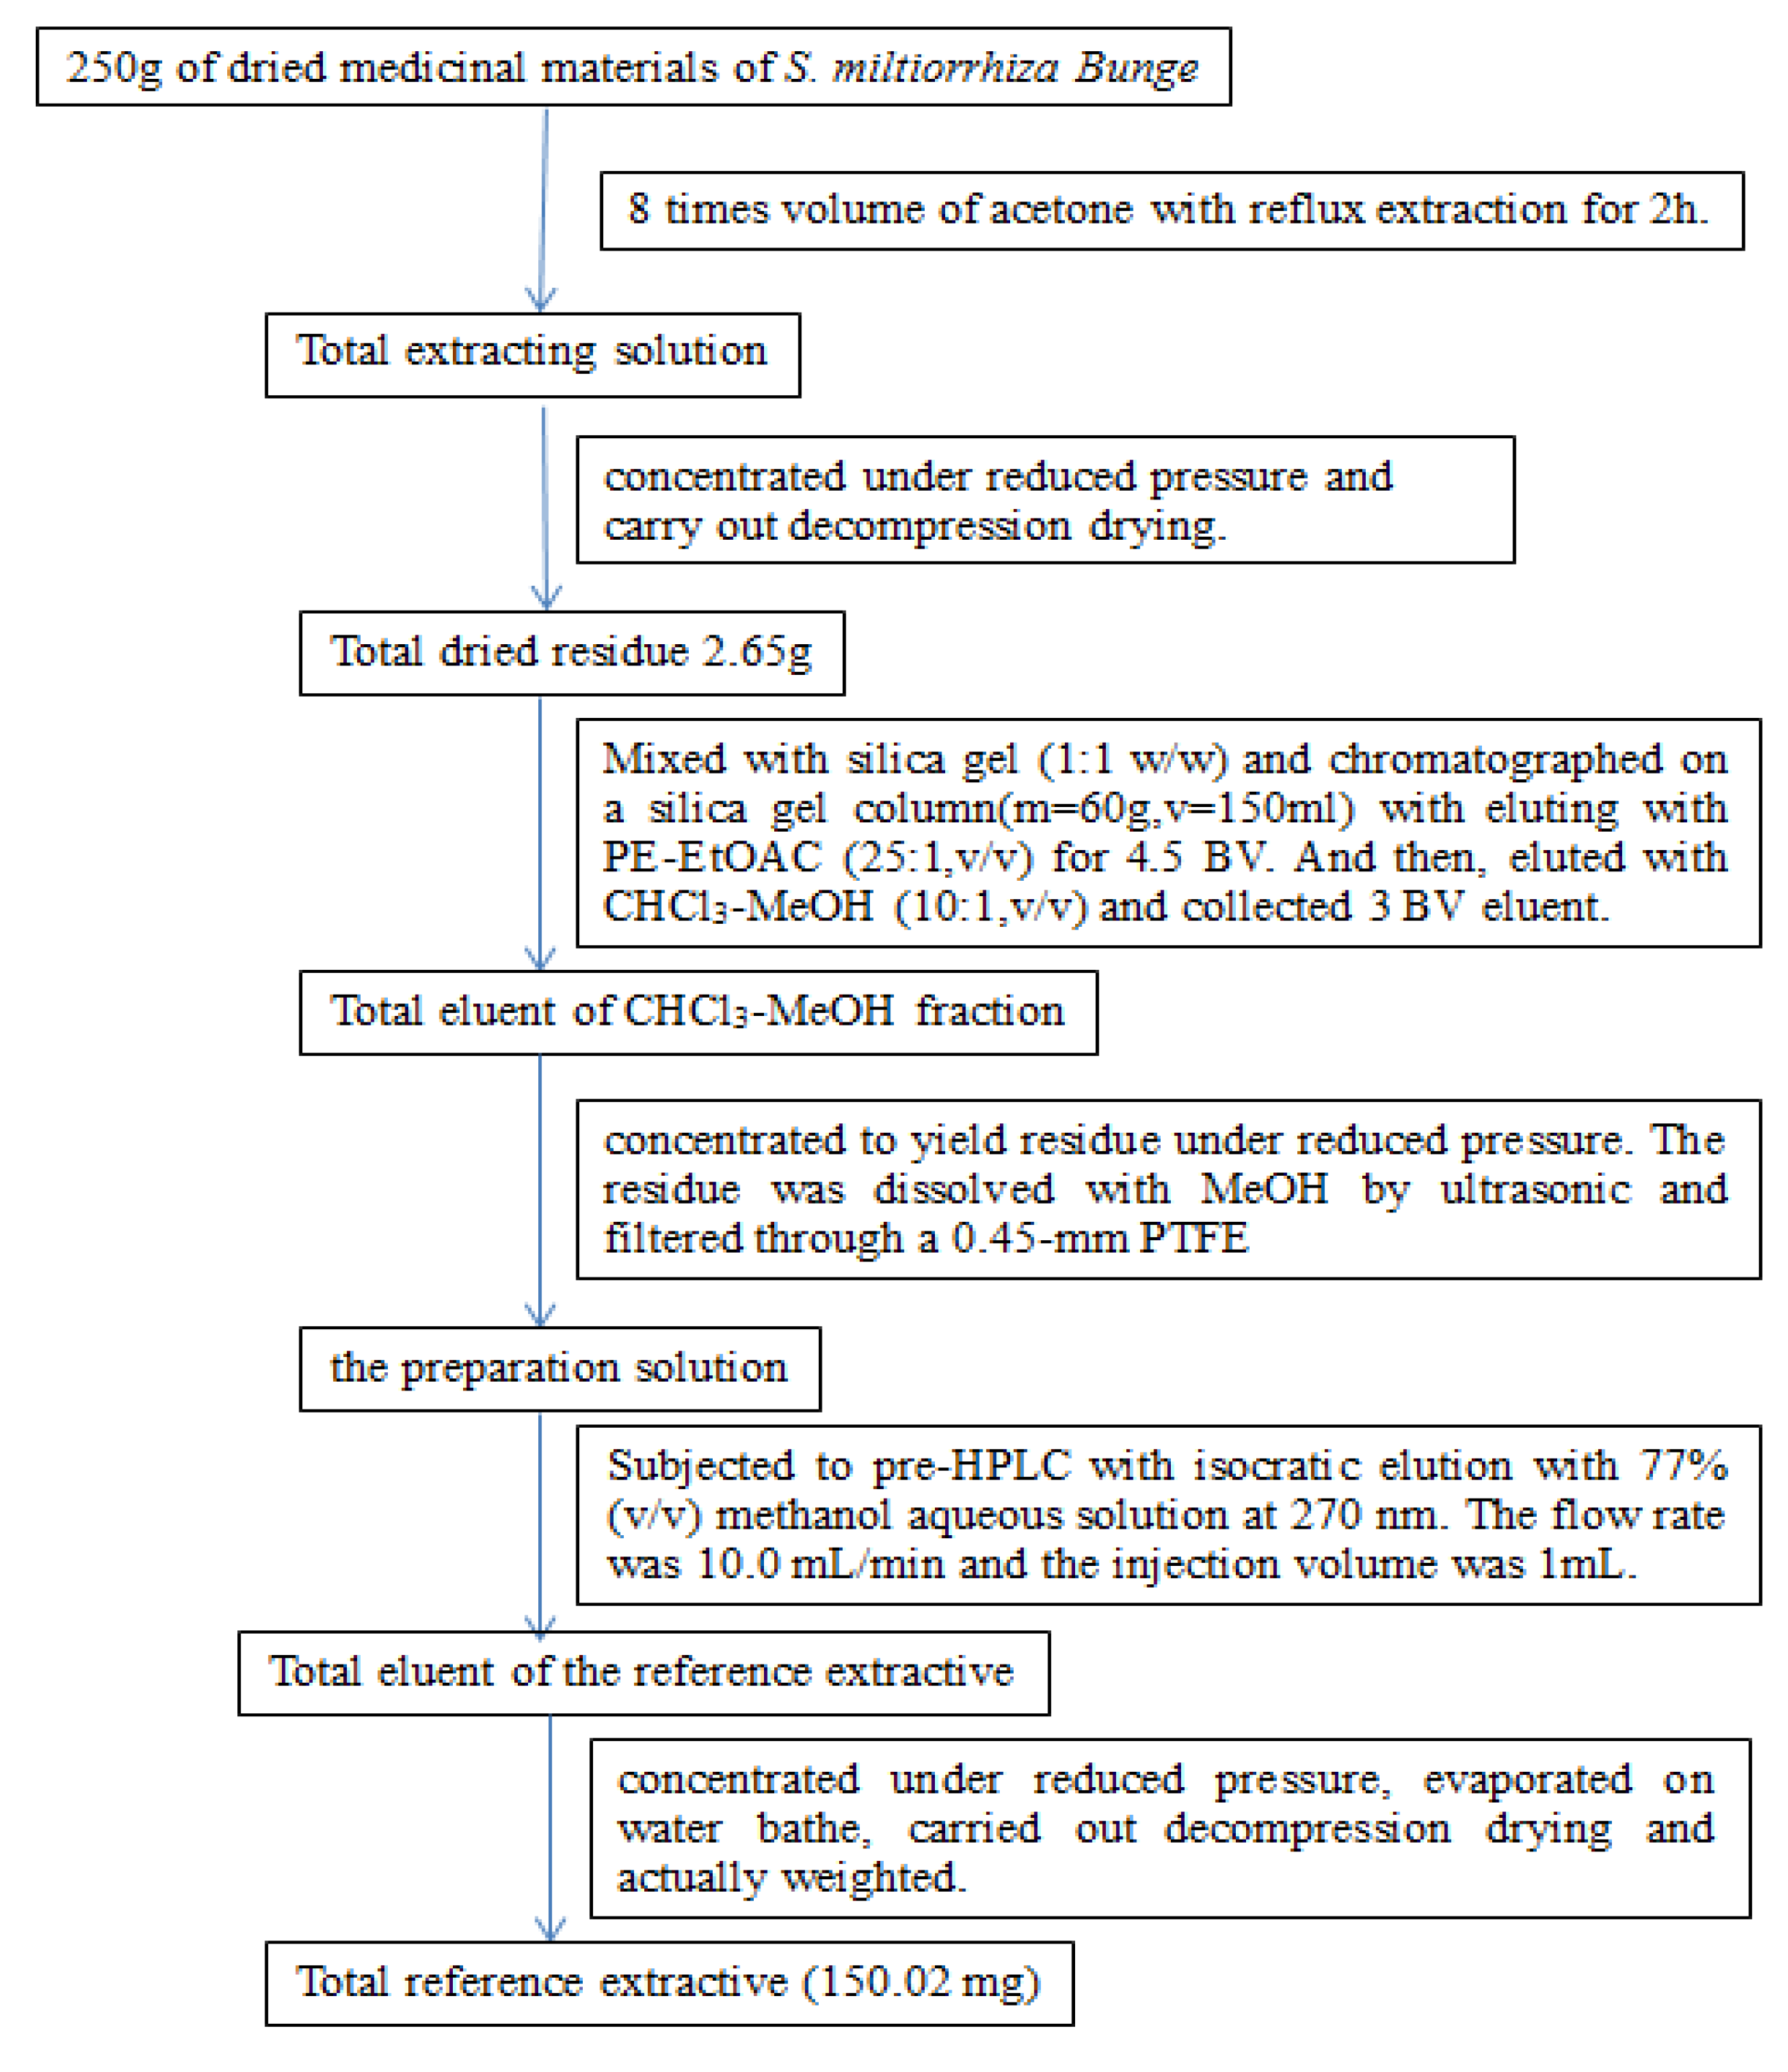
2.3. Removing Non-Target Components with Silica Gel Column Chromatography
The mixed powder which contained silica and crude extract was evaporated to dryness, pulverized and chromatographed on a silica gel column (column volume: 50 mL) with a petroleum ether (PE)- ethyl acetate (EtOAC) system as the eluting solvent.
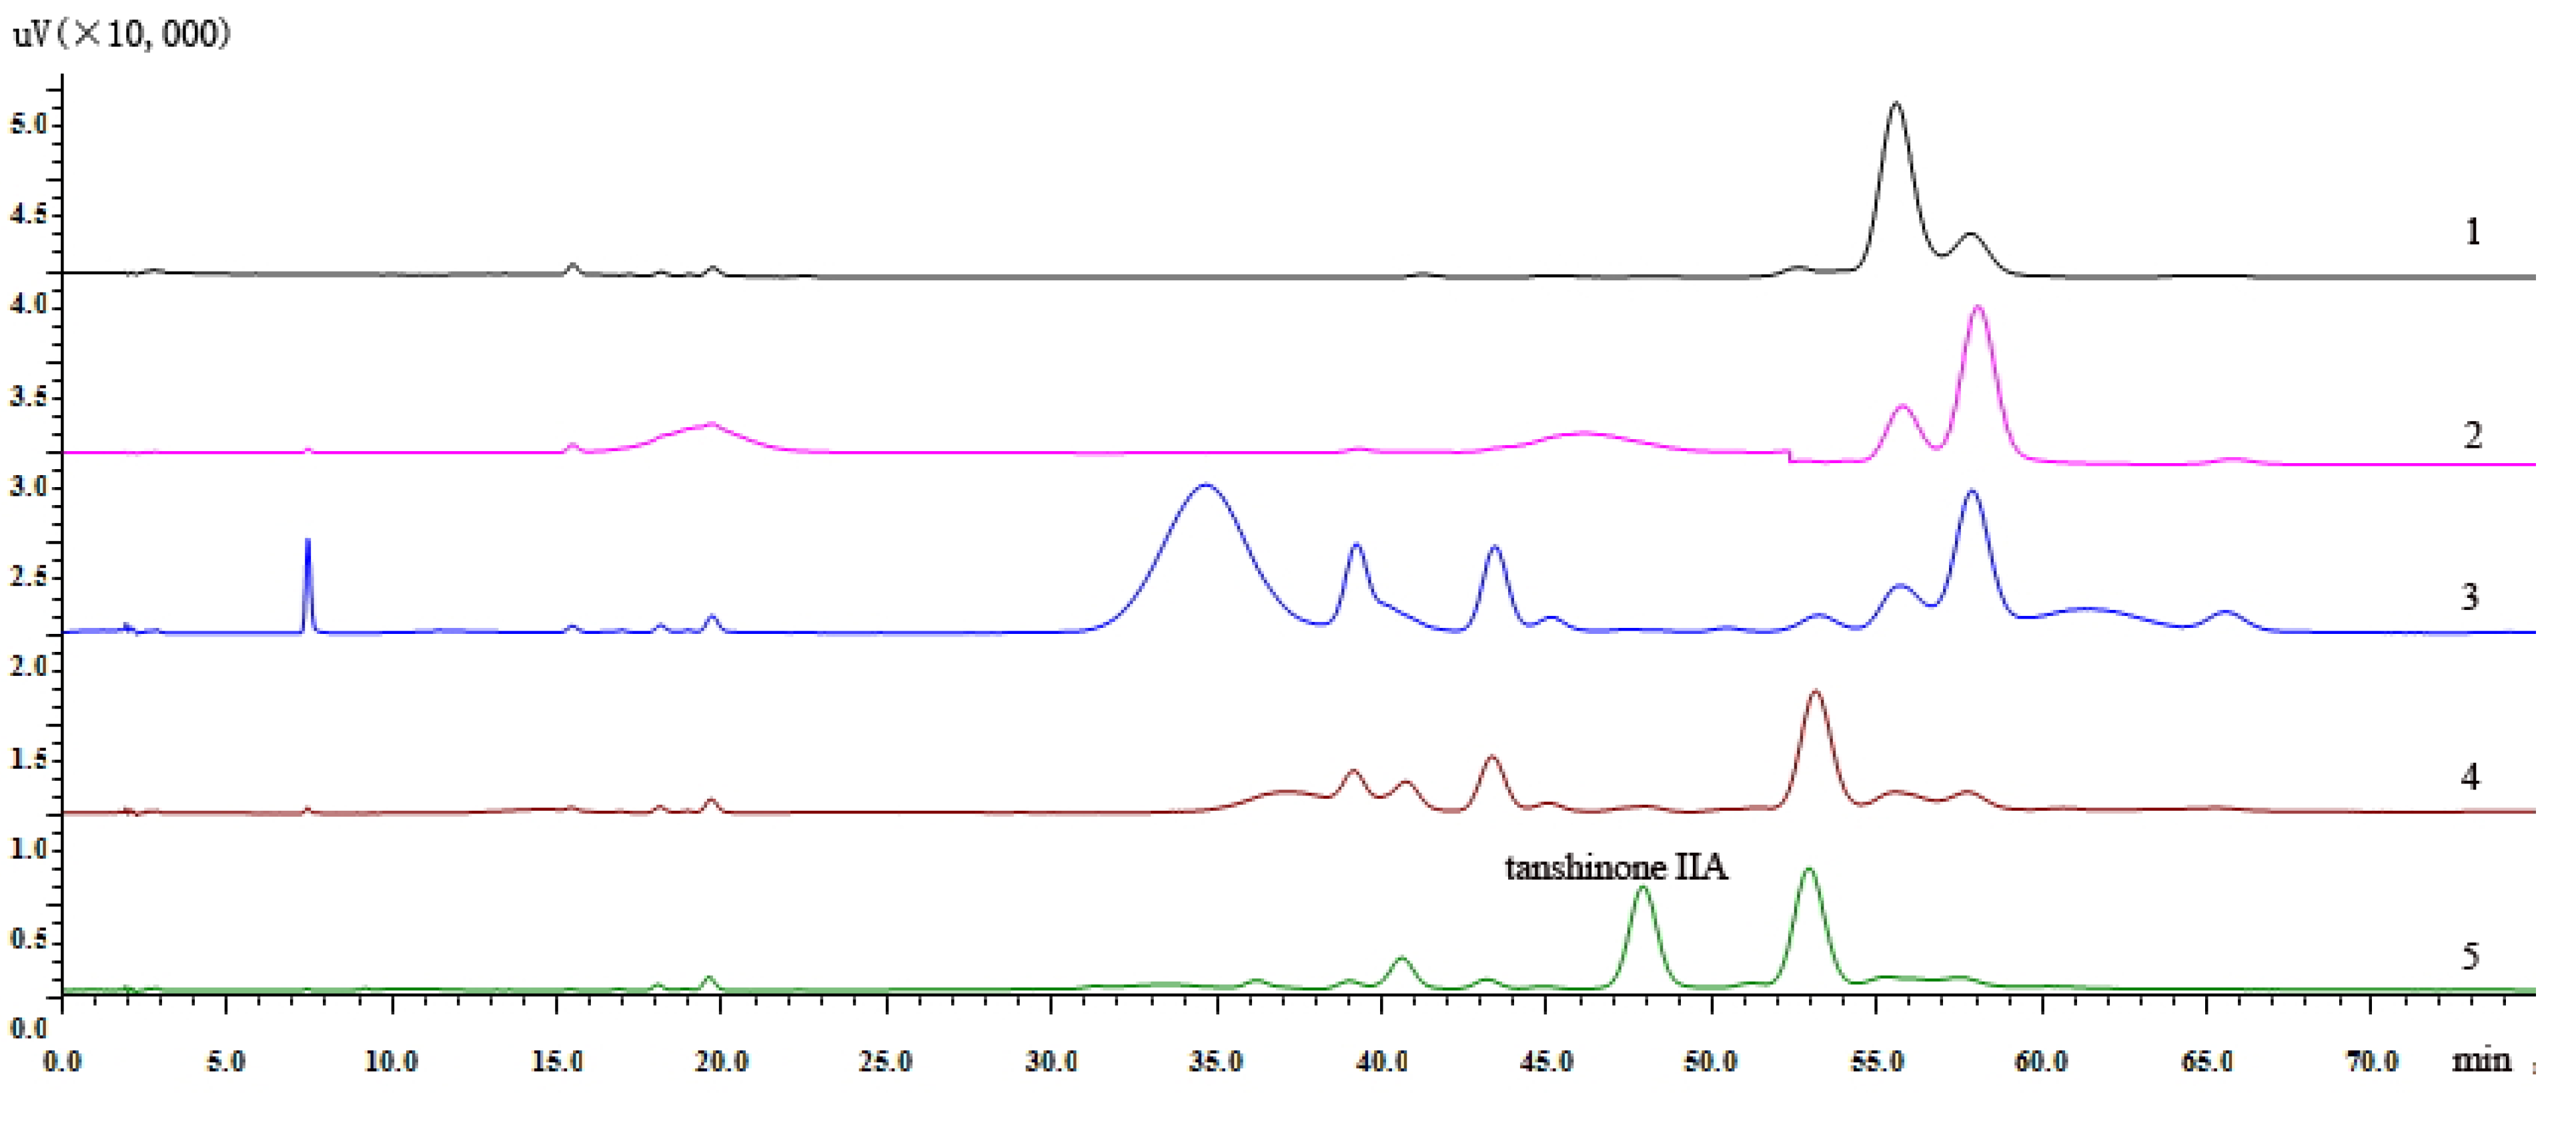
Comparison of the 95:5 (v/v), 90:10 (v/v), 25:1 (v/v) ratios of the petroleum ether-ethyl acetate system in combination with TLC and HPLC analysis, showed that the 25:1 (v/v) ratio of the PE-EtOAC was the optimal eluting solvent. The mixed powder was subjected to silica gel column and eluted successively with PE-EtOAC (25:1, v/v) for 4.5 BV while collecting 0.5 BV each time to remove non-target components. It can be seen from
Figure 1 that tanshinone IIA, which had smaller polarity was eluted from the silica gel column when eluting at 4.5 BV.
Figure 1.
(1) Liquid chromatogram of elution to the 2.5 BV with PE-EtOAC (25:1, v/v). (2) Liquid chromatogram of elution to the 3.0 BV. (3) Liquid chromatogram of elution to the 3.5 BV. (4) Liquid chromatogram of elution to the 4.0 BV. (5) Liquid chromatogram of elution to the 4.5 BV.
Figure 1.
(1) Liquid chromatogram of elution to the 2.5 BV with PE-EtOAC (25:1, v/v). (2) Liquid chromatogram of elution to the 3.0 BV. (3) Liquid chromatogram of elution to the 3.5 BV. (4) Liquid chromatogram of elution to the 4.0 BV. (5) Liquid chromatogram of elution to the 4.5 BV.
In order to rapidly elute the maker compounds from the silica gel and ensure less impurities after eluting with 4.5 BV of PE- EtOAC (25:1, v/v), elution using PE-EtOAC (3:1, v/v) and chloroform (CHCl3)-methanol (MeOH) (10:1, v/v) were compared. Meanwhile, the elution effect and expenditure of the eluents were also taken into account for consideration. Complete elution of three compounds from the silica gel column when using chloroform-methanol required 4 BV (10:1, v/v), while elution of these compounds required 14 BV when using PE-EtOAC (3:1, v/v). The use of CHCl3-MeOH (10:1, v/v) for elution with 3 BV was preferable to be applied to the further elution of the target components from the silica gel column.
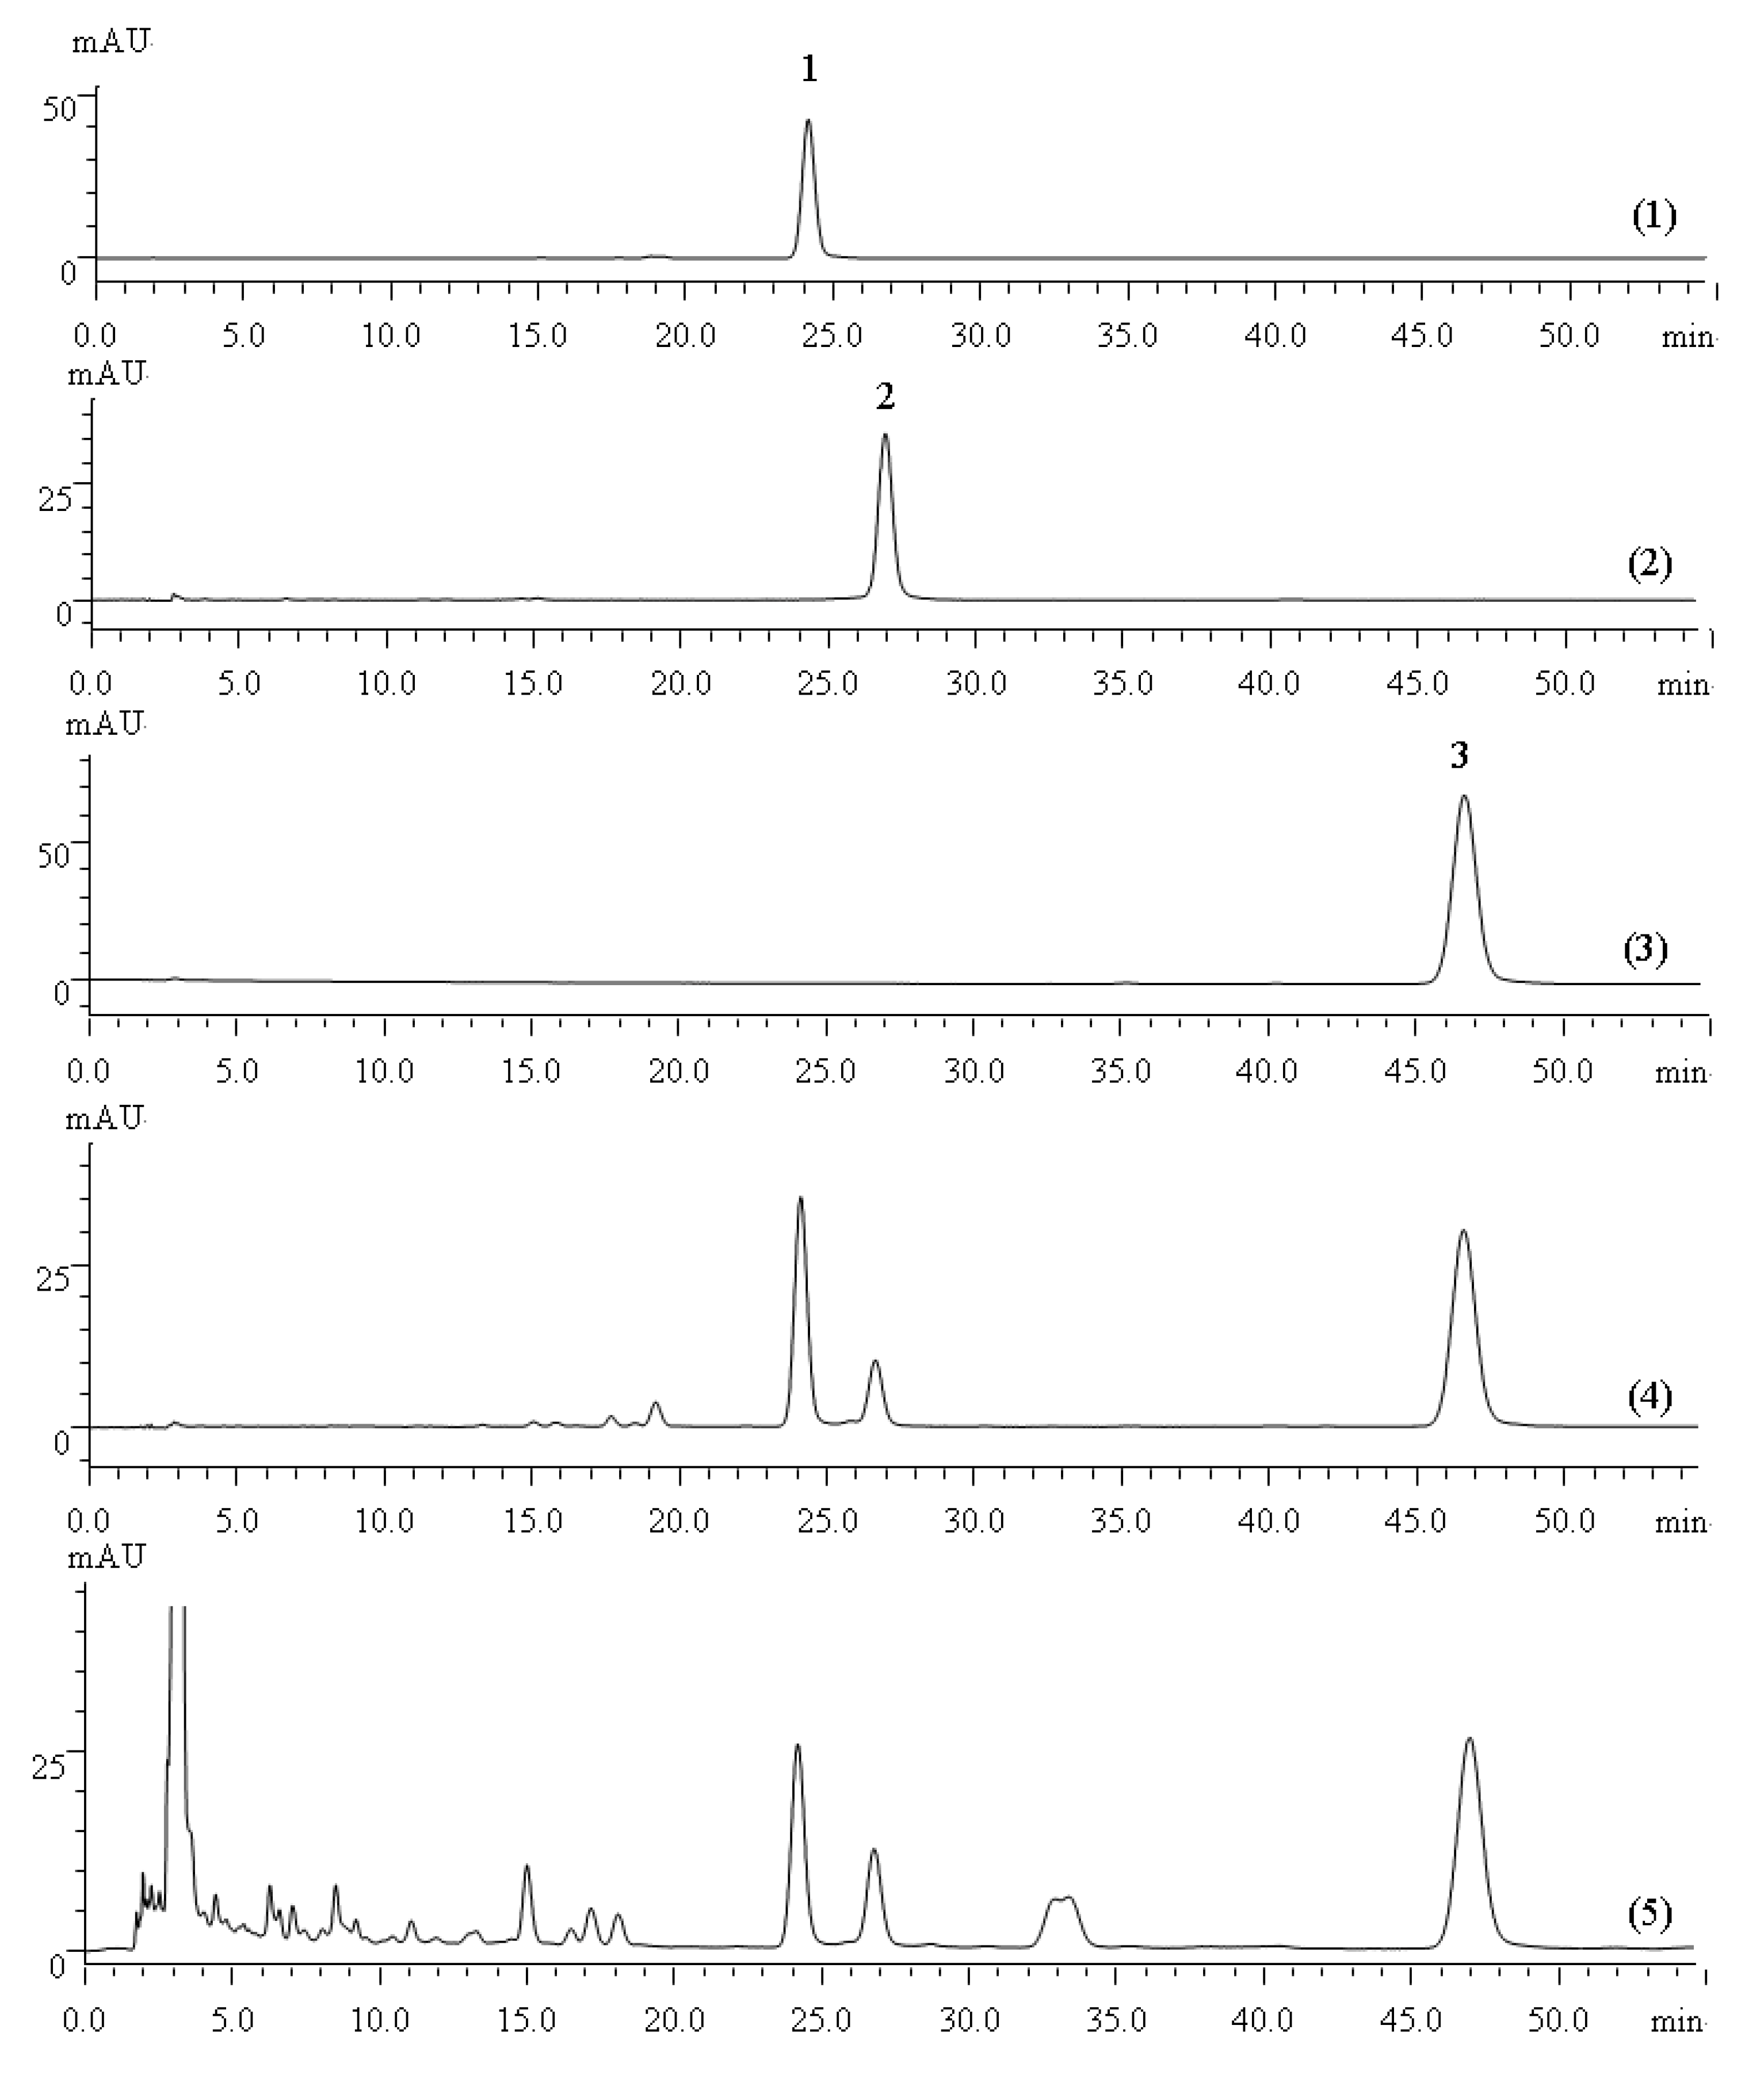
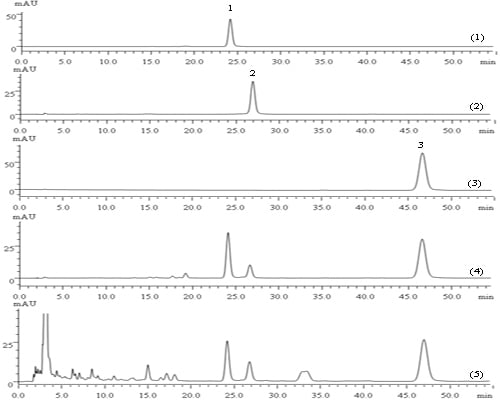
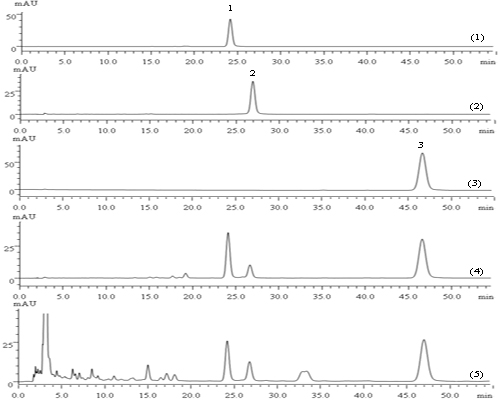
2.6. Quantitative Calibration Analysis of the Three Compounds in the Reference Extractive Using HPLC with the Corresponding Reference Standards
The HPLC chromatograms of the quantification of tanshinone IIA, tanshinone I and cryptotanshinone in the reference extractive of
S. miltiorrhiza Bunge and crude samples are shown in
Figure 5. Method validation for the assay of the three marker compounds was performed, after which the HPLC conditions were carefully optimized, including the mobile phase and detection wavelength. The validation results (calibration curve, precision and repeatability) are listed in
Table 3. Good linearity, injection precision, stability and repeatability (RSD < 2%) were demonstrated for these three compounds.
Figure 5.
(1) HPLC chromatogram for the cryptotanshinone reference standard; (2) HPLC chromatogram for the tanshinone I reference standard; (3) HPLC chromatogram for the tanshinone IIA. reference standard; (4) HPLC chromatogram for the S. miltiorrhiza Bunge reference extractive; (5) HPLC chromatogram for the S. miltiorrhiza Bunge crude sample. Peak 1: cryptotanshinone; Peak 2: tanshinone I; Peak 3: tanshinone IIA.
Table 3.
Regression, precision, repeatability and stability of the three compounds in the S. miltiorrhiza Bunge reference extractive.
Table 3.
Regression, precision, repeatability and stability of the three compounds in the S. miltiorrhiza Bunge reference extractive.
| Analyte | Regression equation | r2 | Linear range (μg/mL) | Precision (RSD, %, n = 6) | Repeatability (RSD, %, n = 5) | Stability (RSD,%, n = 8) | Total amount (RSD, %, n = 3) |
|---|
| Cryptotanshinone | Y = 34464.36X + 2.03 | 0.9999 | 3.88~38.80 | 0.02 | 0.26 | 0.08 | 0.40 |
| Tanshinone I | Y = 17574.55X + 1.31 | 0.9999 | 4.41~44.08 | 0.02 | 0.87 | 0.84 | 1.38 |
| Tanshinone IIA | Y = 48224.6X + 0.87 | 0.9999 | 3.99~39.96 | 0.02 | 0.48 | 0.15 | 0.73 |
A methanol stock solution containing the standard samples was prepared and diluted to a series of appropriate concentrations for the construction of the calibration curves. Six concentrations of the mixed standard solution were injected in triplicate, and their regression equations were calculated in the form of Y = A × X + B. The intra-day precision was determined by analyzing the six replicated calibration samples on the same day. The RSD was taken as a measure of precision. Stability was tested with an extractive solution at room temperature, both at 0, 2, 4, 8, 12, and 24 h. over the course of one day and within six consecutive months. The R.S.D was also taken as the measure for testing stability and repeatability. A recovery test was conducted to evaluate the accuracy of this method. Each sample was analyzed in triplicate. The total amounts of each compound were calculated from the corresponding calibration curve. The results were given in
Table 4.
Table 4.
Recovery of the three compounds in the S. miltiorrhiza Bunge reference extractive.
Table 4.
Recovery of the three compounds in the S. miltiorrhiza Bunge reference extractive.
| Analyte | Original mean (mg) | Spiked mean (mg) | Detected mean (mg) | Recovery mean (mg) | RSD (%, n = 6) |
|---|
| Cryptotanshinone | 1.72 | 1.70 | 3.39 | 98.35 | 0.67 |
| Tanshinone I | 1.05 | 1.05 | 2.12 | 101.57 | 0.89 |
| Tanshinone IIA | 1.95 | 1.96 | 3.94 | 101.59 | 0.57 |
All of these findings indicated that the established quantification method was suitable for the quantitative analysis of the three compounds in the reference extractive. The results, listed in
Table 5, showed that the total mean content of the three compounds in the reference extractive exceeds 90% and that the RSD was less than 2%.
Table 5.
Contents of the three compounds contained in the S. miltiorrhiza Bunge reference extractive.
Table 5.
Contents of the three compounds contained in the S. miltiorrhiza Bunge reference extractive.
| Analyte | Content (%, n = 3) | Mean Content (%) | RSD (%) |
|---|
| Cryptotanshinone | 34.3666 | 34.5023 | 34.2292 | 34.3660 | 0.40 |
| Tanshinone I | 21.0120 | 21.3019 | 20.7226 | 21.0122 | 1.38 |
| Tanshinone IIA | 39.0130 | 39.3001 | 38.7278 | 39.0136 | 0.73 |
| Total Amount | 94.3903 | 95.1043 | 93.6796 | 94.3914 | 0.75 |
2.8. Comparison of the Determination of the Three Marker Compounds in the Crude Samples Using Both Reference Extractive and Reference Standards
Based on the above-optimised HPLC conditions, both the reference extractives and standards were simultaneously used in the quantitative determination of seven batches of
S. miltiorrhiza Bunge samples purchased from representative regions of China. Each sample was analysed in duplicate to obtain the mean content of the three marker compounds. Similar results were obtained by each method. The quantitative results were compared in
Table 8, which showed that the reference extractive method was reliable and consistent with that of the reference standards.
In addition, the cost of the preparation of reference extractives, including the cost of crude herbs, reagents and other experimental materials, was also computed and summarised. According to our investigation, about 150 mg reference extractive of
S. miltiorrhiza Bunge containing 58.53 mg of tanshinone IIA, 31.52 mg of tanshinone I, and 51.56 mg of cryptotanshinone was obtained from 250 g of crude drugs, at a cost of approximately 21 h. of time and RMB 207.58. In comparison, obtaining the three reference standards takes approximately 58 hr. As depicted in
Table 9, the cost of the reference extractive was much lower than that of any single reference standard. Furthermore, the method developed by our lab to prepare the
S. miltiorrhiza Bunge reference extractive can be easily scaled to 100 g.
Table 8.
Contents of the three compounds in S. miltiorrhiza Bunge as determined using reference extractive and standards.
Table 8.
Contents of the three compounds in S. miltiorrhiza Bunge as determined using reference extractive and standards.
| Samplenumber | Batchnumber | Source | Place of origin | Analyte | Mean Content (%, n = 3) | RSD (%) |
|---|
| 1 a | 2 b |
|---|
| 1 | 110902002 | Beijing Qiancao Zhongyao Yinpian Co., Ltd. | Shandong | Cryptotanshinone | 0.1483 | 0.1480 | 0.15 |
| Tanshinone I | 0.1384 | 0.1442 | 2.90 |
| Tanshinone IIA | 0.1832 | 0.1802 | 1.17 |
| 2 | | Beijing Tong Ren Tang Group Co., Ltd. | Shandong | Cryptotanshinone | 0.0904 | 0.0902 | 0.16 |
| 100255051 | Tanshinone I | 0.1163 | 0.1212 | 2.92 |
| | Tanshinone IIA | 0.1745 | 0.1717 | 1.14 |
| 3 | | Beijing Tong Ren Tang Group Co., Ltd. | Shandong | Cryptotanshinone | 0.0983 | 0.0981 | 0.14 |
| 100255050 | Tanshinone I | 0.1291 | 0.1345 | 2.90 |
| | Tanshinone IIA | 0.1688 | 0.1661 | 1.14 |
| 4 | | Shuang Qiao Yanjing Sliced Medicinal Herbs Factory | Shandong | Cryptotanshinone | 0.2125 | 0.2121 | 0.13 |
| 1201039 | Tanshinone I | 0.2196 | 0.2288 | 2.90 |
| | Tanshinone IIA | 0.2851 | 0.2805 | 1.15 |
| 5 | | Beijing Ren Wei Sliced Medicinal Herbs Factory | Anhui | Cryptotanshinone | 0.0749 | 0.0748 | 0.13 |
| 11072401 | Tanshinone I | 0.0675 | 0.0703 | 2.87 |
| | Tanshinone IIA | 0.0879 | 0.0865 | 1.14 |
| 6 | | Beijing Fengtai Jinyuan Zhongyao Yinpian Co., Ltd. | Hebei | Cryptotanshinone | 0.0719 | 0.0718 | 0.14 |
| 11111701 | Tanshinone I | 0.0697 | 0.0726 | 2.89 |
| | Tanshinone IIA | 0.0971 | 0.0955 | 1.17 |
| 7 | 11100901 | Shandong Province, China | Shandong | Cryptotanshinone | 0.0446 | 0.0445 | 0.22 |
| Tanshinone I | 0.0397 | 0.0413 | 2.79 |
| | | Tanshinone IIA | 0.0627 | 0.0617 | 1.14 |
Table 9.
Preparation costs for the reference extractive and single reference standards.
Table 9.
Preparation costs for the reference extractive and single reference standards.
| Specific items | Amount (mg) | Expenses (RMB) | Cost price (RMB/mg) |
|---|
| Single reference standards a | Cryptotanshinone | 20 | 147 | 7.35 |
| Tanshinone I | 20 | 179 | 8.95 |
| Tanshinone IIA | 20 | 173 | 8.65 |
| Reference extractive of S. miltiorrhiza Bunge | 150 | 207.58 | 1.38 |
3. Experimental
3.1. Instrumentation and Chromatographic Conditions
A Shimadzu LC-20AT HPLC system consisting of a SIL-20A auto-sampler, quaternary pumps and SPD-M20A diode array detector (Shimadzu Corporation, Kyoto, Japan) was used to acquire chromatograms and UV spectra. Chromatographic analysis was conducted on a suitable guard column (Diamons C18, 250 mm × 4.6 mm, 5 μm), and HPLC separation was performed using an isocratic elution with aqueous phosphoric acid (0.02%, v/v) and acetonitrile as the mobile phase and a flow rate of 1.0 mL/min. The column temperature was maintained at 25 °C, and the sample injection volume was 10 μL. The DAD detector was set to scan from 200 nm to 800 nm, and 270 nm was selected as detection wavelength for HPLC analysis.
3.2. Solvents and Chemicals
HPLC-grade methanol (Merck KGaA, Darmstadt, Germany), acetonitrile (Merck) and deionised water obtained from a Milli-Q water system (Millipore Corp., Bedford, MA, USA) were used to prepare the mobile phase. All solvents were degassed by ultrasonication and an on-line degassing system. Analytical-grade methanol, ethyl acetate, chloroform and acetone (Beijing Chemical Works, Beijing, China) were used for sample preparation.
3.3. Reference Standards
Standard samples of tanshinone IIA (Batch number. 110766-200619), cryptotanshinone (Batch number. 110852-200806) and tanshinone I (Batch number. 1428-070322) were purchased from the National Institute for Food and Drug Control (NIFDC, Beijing, China). The purity of each standard was determined to be above 98% by normalization of the peak area detected by HPLC-DAD. The reference extractive, containing 34.37% cryptotanshinone, 21.01% tanshinone IIA and 39.01% tanshinone I, was prepared from the dried roots of S. miltiorrhiza Bunge in our laboratory.
3.6. Samples Collection and Preparation
S. miltiorrhiza Bunge was collected from different commercial herb suppliers located in China. All of the samples were authenticated by Professor Cheng Ming of the Institute of Chinese Materia Medica, Chinese Academy of Chinese Medical Sciences, based on the description in the
Chinese Pharmacopoeia (2010 edition). The sources and origin of the samples, including batch numbers, are listed in
Table 8.
Regarding the preparation of the test solutions of the crude drugs, comparative studies on ultrasonic and reflux extraction were implemented using the contents of the three marker compounds as the main indicators. The ultrasonic treatment procedure was found to be the best extraction method, and the preparation of the test solution was carried out as described above. S. miltiorrhiza Bunge powder (0.30 g) was extracted with methanol for 30, 45, 60 and 90 min using ultrasonication and it was suggested that all three compounds were almost completely extracted within 45 min. The reference standards were prepared by accurately weighing tanshinone IIA (11.64 mg), tanshinone I (10.00 mg) and cryptotanshinone (9.80 mg) into 100 mL, 50 mL and 50 mL volumetric flasks, respectively, and adding methanol to volume. The resulting concentrations of tanshinone IIA, cryptotanshinone and tanshinone I were 116.40, 200.00 and 196.00 μg mL−1, respectively, and the solution was filtered through a 0.45 mm PTFE filter (Iwaki Glass, Tokyo, Japan) as the reference solution. Meanwhile, approximately 10.25 mg of the reference extractive was dissolved with methanol in a 50 mL volumetric flask to volume and mixed well. The mixture was also filtered through a 0.45 mm PTFE filter (Iwaki Glass) to obtain the test solution.
4. Conclusions
Due to the lack of adequate reference standards in the study of the quality control of TCMs, the conception of the reference extractive was put forward in the Chinese Pharmacopoeia (2005 edition) for the first time. In this paper, a rapid and efficient quality assessment method was first established to meet the complex requirements of the quantitative determination of TCMs and then it was successfully applied to the quality control of various S. miltiorrhiza Bunge samples. Our results confirmed that using reference extractive to determine drug contents was both feasible and reliable.
Based on above comparison and analysis, the preparation of the reference extractive was generally easier than that of the single reference standard, which helped to reduce substantially the analysis cost. Moreover, in comparison to the single reference standard, the reference extractive used for quantitative analysis had advantages of controlling multi-index constituents and improving the specificity of identification. Although some problems, such as the source of herbs used for preparation of the reference extractive, selection of compositions contained in the reference extractive, standardization of the reference extractive preparation technology, etc. should be taken into account for future research in order to enhance its quality, the significance of our results lies in the demonstration that it is feasible and reliable to apply reference extractives for quantitative analysis. Such a method would not only exhibit great superiority in terms of simplicity, time efficiency and economy but also provide a powerful and rational method for the quality evaluation of TCMs. We hope that this study will contribute to future studies improving the quality standard of TCMs.

