Article

Different Analytical Approaches in Assessing Antibacterial Activity and the Purity of Commercial Lysozyme Preparations for Dairy Application

1
Institute of Sciences of Food Production, Italian National Research Council, Via Celoria 2, Milan 20133, Italy
2
Department of Food, Environmental and Nutritional Sciences, State University of Milan, Via Celoria 2, Milan 20133, Italy
*
Author to whom correspondence should be addressed.
Molecules 2013, 18(5), 6008-6020; https://doi.org/10.3390/molecules18056008
Submission received: 9 April 2013 / Revised: 16 May 2013 / Accepted: 16 May 2013 / Published: 21 May 2013
(This article belongs to the Section Natural Products Chemistry)

Abstract

:
Hen egg-white lysozyme (LSZ) is currently used in the food industry to limit the proliferation of lactic acid bacteria spoilage in the production of wine and beer, and to inhibit butyric acid fermentation in hard and extra hard cheeses (late blowing) caused by the outgrowth of clostridial spores. The aim of this work was to evaluate how the enzyme activity in commercial preparations correlates to the enzyme concentration and can be affected by the presence of process-related impurities. Different analytical approaches, including turbidimetric assay, SDS-PAGE and HPLC were used to analyse 17 commercial preparations of LSZ marketed in different countries. The HPLC method adopted by ISO allowed the true LSZ concentration to be determined with accuracy. The turbidimetric assay was the most suitable method to evaluate LSZ activity, whereas SDS-PAGE allowed the presence of other egg proteins, which are potential allergens, to be detected. The analytical results showed that the purity of commercially available enzyme preparations can vary significantly, and evidenced the effectiveness of combining different analytical approaches in this type of control.

1. Introduction

Lysozyme (LSZ, muramidase, EC 3.2.1.17) is one of the most extensively studied antimicrobial enzymes. It occurs in several mammalian secretions (milk, saliva, tears) and also in hen egg white (HEW), which represents the raw material of choice for the production of LSZ on an industrial scale [1]. This low molecular weight enzyme (14,307 Dalton) consists of 129 amino acids cross-linked by four disulphide bridges, and shows lytic activity on the β(1→4) glycosidic bond between N-acetyl-D-glucosamine and N-acetylmuramic acid in the cell wall of bacterial species, particularly Gram-positive microorganisms such as lactic acid bacteria (LAB) and Clostridia. The main use of LSZ in the food industry is related to limiting the proliferation of LAB spoilage in the production of wine and beer [2,3], and to inhibiting Clostridia growth during cheese maturation [4]. Butyric acid fermentation in cheese (late blowing), caused by the outgrowth of clostridial spores present in raw milk, most commonly originating from silage, can cause considerable product loss, especially in the production of hard and extra-hard cheeses. The most common strategies adopted to prevent late blowing defects are bactofugation and microfiltration of milk, and the addition of nitrates or LSZ [4,5,6]. Lysozyme has been shown to be particularly effective in cheeses like Edam, Gouda, Cheddar, Emmental, Asiago, Grana Padano, Montasio, Provolone, Manchego, Brebiou and Castelões [6,7,8]. France, in 1981, was the first country to allow the industrial application of LSZ in cheese production [6], and nowadays LSZ is permitted as a preservative (E1105) in ripened cheeses, in accordance with current EU legislation [9] and the Codex Alimentarius [10]. The estimated content of LSZ in cheese roughly ranges between 100 and 350 mg per kilogram [7,11].
Egg products count among the most common causes of food allergies, with the estimated prevalence of egg allergies being 2%–3% in children and in adults [12]. For this reason, the use of LSZ must be declared to comply with EU allergen labelling instructions [13].
Previous studies have reported the antigenicity and allergenicity of egg white proteins, suggesting that ovotransferrin and ovomucoid have important implications in the anaphylactic reaction to eggs while ovoalbumin and ovomucoid are crucial for atopic reactions [14]. At present, the role of LSZ itself as an allergen is still controversial. In fact, some studies have come to the conclusion that LSZ is only a weak allergen [15,16], while others support the opposite conclusion [17,18]. The Joint FAO/WHO Expert Committee on Food Additives [19] advises carrying out a turbidimetric analysis to determine LSZ potency. The method is based on LSZ lytic activity on the bacterial cells of Micrococcus luteus (Micrococcus lysodeikticus) quantified by turbidimetric analysis [20,21]. Indeed several methods have been developed to identify and quantify the LSZ molecule, including Sodium Dodecyl Sulphate-Polyacrylamide Gel Electrophoresis (SDS-PAGE) [22], High Performance Liquid Chromatography with fluorescence detection (HPLC-FLD) [11], Enzyme-Linked Immunosorbent Assay (ELISA) [23], immunocapture mass spectrometry [24], and surface-enhanced mass spectrometry [7,25]. The HPLC-FLD method proposed by Pellegrino and Tirelli [11] to quantify LSZ in milk and dairy products was recently published as an ISO Technical Specification [26].
The EU Commission Regulation No 231/2012 [27] recently defined specifications for food additives, including LSZ. The aim of this work was to assess the suitability of different analytical approaches to evaluate the purity and molecular integrity of the enzyme, with respect to its activity as determined by the turbidimetric assay.

2. Results and Discussion

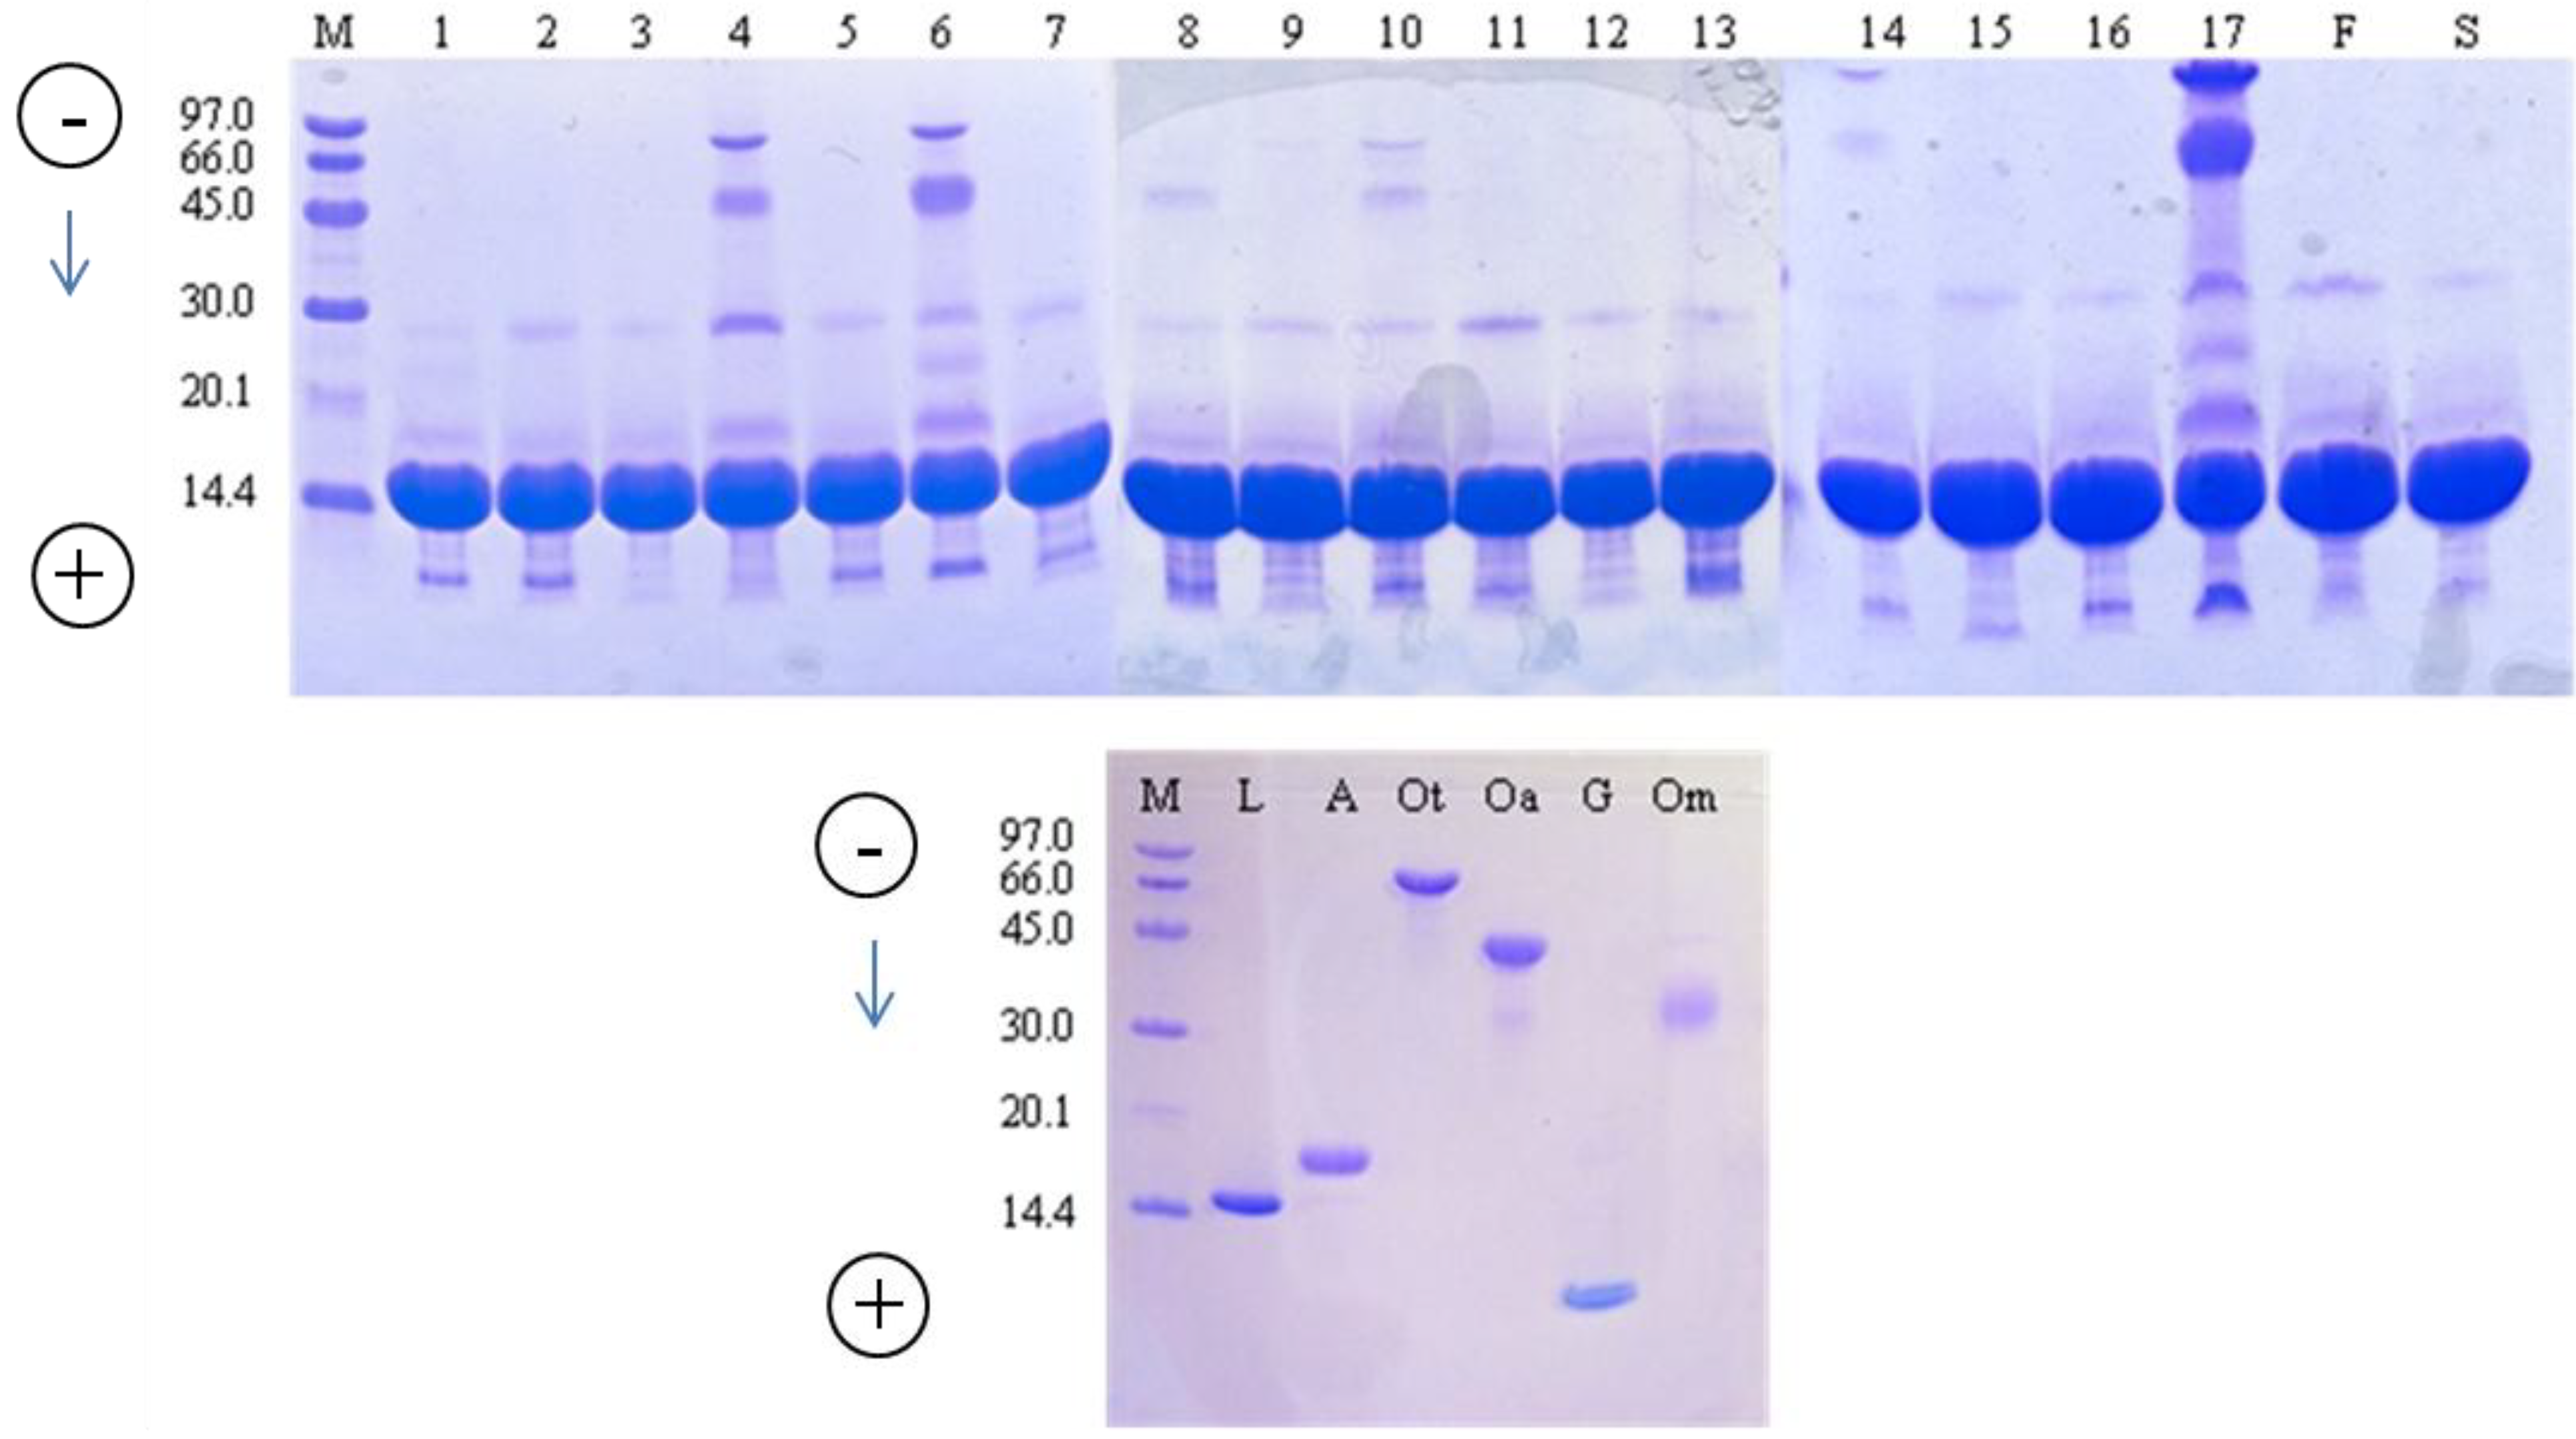
2.1. Purity of Commercial Lysozyme Preparations

The gross composition of 17 LSZ preparations marketed in different countries, and intended for use in the dairy industry (Table 1), was evaluated with respect to the most relevant specifications provided in Commission Regulation 213/2012 [27].
Table 1. Origin, type, and composition characteristics of the commercial lysozyme preparations. Values not complying with specifications of EU Reg. 231/2012 are in bold.
SampleCountry of Purchase 1Type of preparationWater (g/100 g)Nitrogen (g/100 g)Total Protein 2 (g/100 g)Sugars 3 (g/100 g)HEW proteinsother than LSZ 4 (+/−)
1Netherland (M)Granular5.0017.3891.9n.d.+
2Italy (D)Granular6.7116.7388.5n.d.+
3Italy (D)Granular6.6716.7588.6n.d.-
4Germany (M)Powder7.6116.4887.20+++
5Italy (D)Granular6.3716.8188.9n.d.+
6Italy (D)Powder5.0715.6782.97.6 (g)+++
7Italy (M)Granular8.6616.8689.2n.d.+
8Italy (D)Granular5.1016.7788.7n.d.++
9Switzerland (M)Granular5.7017.2091.0n.d.-
10Italy (D)Granular5.0017.4492.3n.d.++
11Germany (D)Powder8.0616.8489.1n.d.+
12Spain (D)Granular6.6012.5366.324.0 (g)-
13Spain (D)Liquid 5n.d.4.1522.0n.d.+
14Spain (D)Granular5.5013.3170.417.3 (s)++
15Belgium (M)Powder4.1017.1490.7n.d.+
16Canada (M)Granular5.4017.3191.6n.d.+
17Poland (M)Powder5.0016.1185.20++++
1 (M): manufacturer or (D): distributor; 2 By calculation (N × 5.29); 3 (g): glucose; (s): starch and trace levels of maltose, maltotriose and glucose; 4 As visually evaluated from SDS-PAGE gels; n.d.: not determined; 5 Values are expressed as g/100 mL.
With the exception of the liquid sample, the water content varied from 4.1 to 8.7 g/100 g (Table 2). Despite the wide variability, many samples did not comply with the maximum limit of 6%. It should be mentioned here that the water content was measured by gravimetric oven drying, whereas the legal limit refers to Karl Fischer titration. This latter method is much more accurate for products like dried milk and lactose powder [28] as it also determines the water of crystallization, however this is not present in our samples. Moisture has a relevant effect on the stability of solid-state enzymes during storage, and an increase in LSZ aggregation with increasing humidity was evidenced by Separovich, Lam, Ke, and Chan [29]. On the other hand, the dehydration of LSZ caused a loss of activity, apparently due to the removal of water molecules residing functionally in the active site [30]. These aspects will be further discussed throughout this paper.
Table 2. Potency (microbiological activity) and concentration (HPLC) of lysozyme in the commercial preparations.
SampleType of preparationAnhydrous basis (mg/g)Product basis 1 (g/100 g product)Protein basis (g/100 g protein)
PotencyPotencyConcentrationPotencyConcentration
1Granular 100896 ± 1.73 100 ± 0.71104109
2Granular 92987 ± 0.06 83 ± 0.709894
3Granular 104097 ± 1.58 97 ± 2.11110109
4Powder 87281 ± 0.13 75 ± 0.70 9286
5Granular 96891 ± 0.46 86 ± 1.6810296
6Powder 75371 ± 0.51 66 ± 1.958680
7Granular 94987 ± 0.17 80 ± 1.369790
8Granular 98593 ± 0.23 95 ± 4.28105107
9Granular 102797 ± 0.02 99 ± 2.10106109
10Granular 100195 ± 0.41 95 ± 1.42103103
11Powder 96088 ± 0.32 79 ± 2.139989
12Granular 74770 ± 2.9076 ± 0.69105114
13 2Liquid n.d.26 ± 0.56 24 ± 1.41 3 118108 3
14Granular 74670 ± 1.1370 ± 0.7010099
15Powder 98594 ± 0.07 84 ± 0.7110493
16Granular 102597 ± 1.4093 ± 2.11106101
17Powder 64361 ± 0.24 52 ± 0.727261
1 Mean values ± relative standard deviation; 2 Values on product basis are expressed as g/100 mL; 3 Area of the two main peaks was considered (see paragraph 2.2); n.d.: not determined.
The EU product specification for LSZ provides that the nitrogen content will be in the range 16.8%–17.8%. Five samples out of 17 proved to be below the range, none were above (Table 1). Although there is no reference to protein content in the LSZ specification, this was calculated in order to have a better evaluation of product purity. We derived the specific nitrogen-to-protein conversion factor of 5.29 from the atomic composition of LSZ [31], instead of using the general value of 6.25 commonly adopted for food protein, as this last led to large overestimation.
The protein content varied from 88.5 to 92.3 g/100 g in samples with a nitrogen content within the legal limits, irrespective of whether the product was powdered or granular. In the liquid sample (n.13) the protein content was 22 g/100 mL, corresponding to the content declared by the manufacturer on the technical sheet, whereas in the five remaining samples collected in Spain (samples 12 and 14), Germany (n.4), Italy (n.6) and Poland (n.17), it ranged from 66.3% to 87.2% (Table 1). Based on such low levels, and taking the respective water content into consideration, it was hypothesized that other ingredients had been added to the commercial LSZ preparation as excipients. Therefore, these five samples were analyzed for the presence of sugars using an HPLC method that allows both mono- and polysaccharides to be quantified. The presence of 7.6% and 24% glucose was detected in samples 6 and 12, respectively, while starch (17%), maltotriose, and traces of glucose and maltose were found in sample 14 (Table 1). These saccharides are not among those commonly used as stabilizers in protein preparations, hence their presence could have been due to an intentional addition as low cost fillers. As stated by Wang [32], disaccharides such as sucrose are the most effective in stabilizing protein during dehydration steps, as large saccharides are ineffective and glucose is extremely reactive with free amino groups of lysine and arginine to form adducts via the Maillard reaction. Surprisingly, no sugars were found in sample 17, despite its very low protein content. This sample was analyzed for the presence of other common excipients such as free amino acids, calcium chloride, sodium chloride and potassium chloride, and all these substances were found at the expected trace levels (not shown).
SDS-PAGE was used to evaluate the protein pattern of the commercial LSZ preparations (Figure 1). Electrophoretic bands were identified by running the pure HEW proteins separately. Although the LSZ band (approx. 14 kDa) markedly dominated in all of the samples, the presence of other HEW proteins was also evident. Samples 3, 9 and 12 proved to be the most pure, only weak bands of LSZ dimer and avidin being detected (Table 2) along with that of LSZ. Bands of LSZ dimer, avidin and gallin were detected in the remaining commercial samples, and additional bands were present in seven of them. Ovalbumin and/or ovotransferrin was present in samples 4, 6, 8, 10, 14 and 17. Sample 17 was by far the worst commercial LSZ preparation, being heavily contaminated by several HEW proteins other than LSZ.
Figure 1. Sodium dodecyl sulphate (SDS) gel electrophoresis of commercial lysozyme preparations. Lane M: molecular weight markers; Lane from 1 to 17: lysozyme samples; F: FIP lysozyme standard; S: Sigma-Aldrich lysozyme; L: lysozyme; A: avidin; Ot: ovotransferrin; Oa: ovalbumin; G: gallin; Om: ovomucoid.
Molecules 18 06008 g001
SDS-PAGE proved to be a useful technique to detect the presence of undesired HEW proteins in commercial preparations, and this aspect could be of concern as LSZ is used in several food products. As already mentioned, the band corresponding to MW of 28,600 Da was assumed to be the LSZ dimer. In fact, the formation of intermolecular covalent bonds was reported to occur in LSZ submitted to dry-heating [33], and it was recently proposed that the chemical pathway involves the formation of a succinimide ring [34]. Interestingly, a weak band corresponding to the LSZ dimer was detected also in the pure LSZ standard (lane S, Figure 1), confirming that even mild technological treatments or prolonged storage at a low water-activity level may induce the reaction [34]. Several researchers have shown the lytic activity of LSZ dimer to be the same as that of the monomer [33,35]. Therefore, the presence of the dimerized form should not result in a lower potency of the preparations.
Avidin with an estimated molecular mass of 16 kDa was detected in all the samples, although its theoretical molecular mass is 68.3 kDa [36]. Korpela [37] demonstrated that, under reducing conditions, avidin is fragmented into four monomers of MW from 15.6 to 15.9 kDa. Avidin has antimicrobial activity due to its ability to bind to various gram-negative and gram-positive bacteria, including Escherichia coli K-12, Klebsiella pneumoniae, Serratia marcescens, Pseudomonas aeruginosa, Staphylococcus aureus and S. epidermidis [37].
No data are available on the allergenic nature of avidin. In contrast, ovotransferrin (70 kDa) and ovalbumin (45 kDa) are considered the major allergens in the egg white fraction [14]. These proteins were observed in preparations 5 and 6 (Figure 1). In three samples (samples 1, 6, 17) a band of approximately 23 kDa, which could be attributed to the Ch21 protein [38], was detected. The Ch21 protein, which belongs to the lipocalin family, is located in albumen and has been reported as allergenic [39]. In all the LSZ preparations, except for samples 3 and 9, the egg protein named gallin (7 kDa) was observed (Figure 1). Gallin was first identified in the analysis of HEW using a proteomic approach [40]. It was named gallin because of its homology to meleagrin, a peptide previously discovered as a contaminant in turkey ovomucin preparation, and to cygnin, discovered in the preparation of black swan LSZ [41,42]. The function of this peptide has not yet been identified, but it has a potent antimicrobial activity, particularly against Escherichia coli [43]. Proteins such as ovomucin and ovostatin, of molecular mass higher than 100 kDa, cannot be observed using this type of polyacrylamide gel because it only permits the resolution of proteins smaller than 100 kDa [44]. The data showed that, at the industrial level, the LSZ purification process is sometimes disregarded by manufacturers, due to the high costs and significant amounts of potentially allergenic proteins that can be retained in the commercial preparation. The presence of residual egg proteins other than LSZ can be detected with good sensitivity by SDS-PAGE, although the quantitative evaluation is far from being accurate.

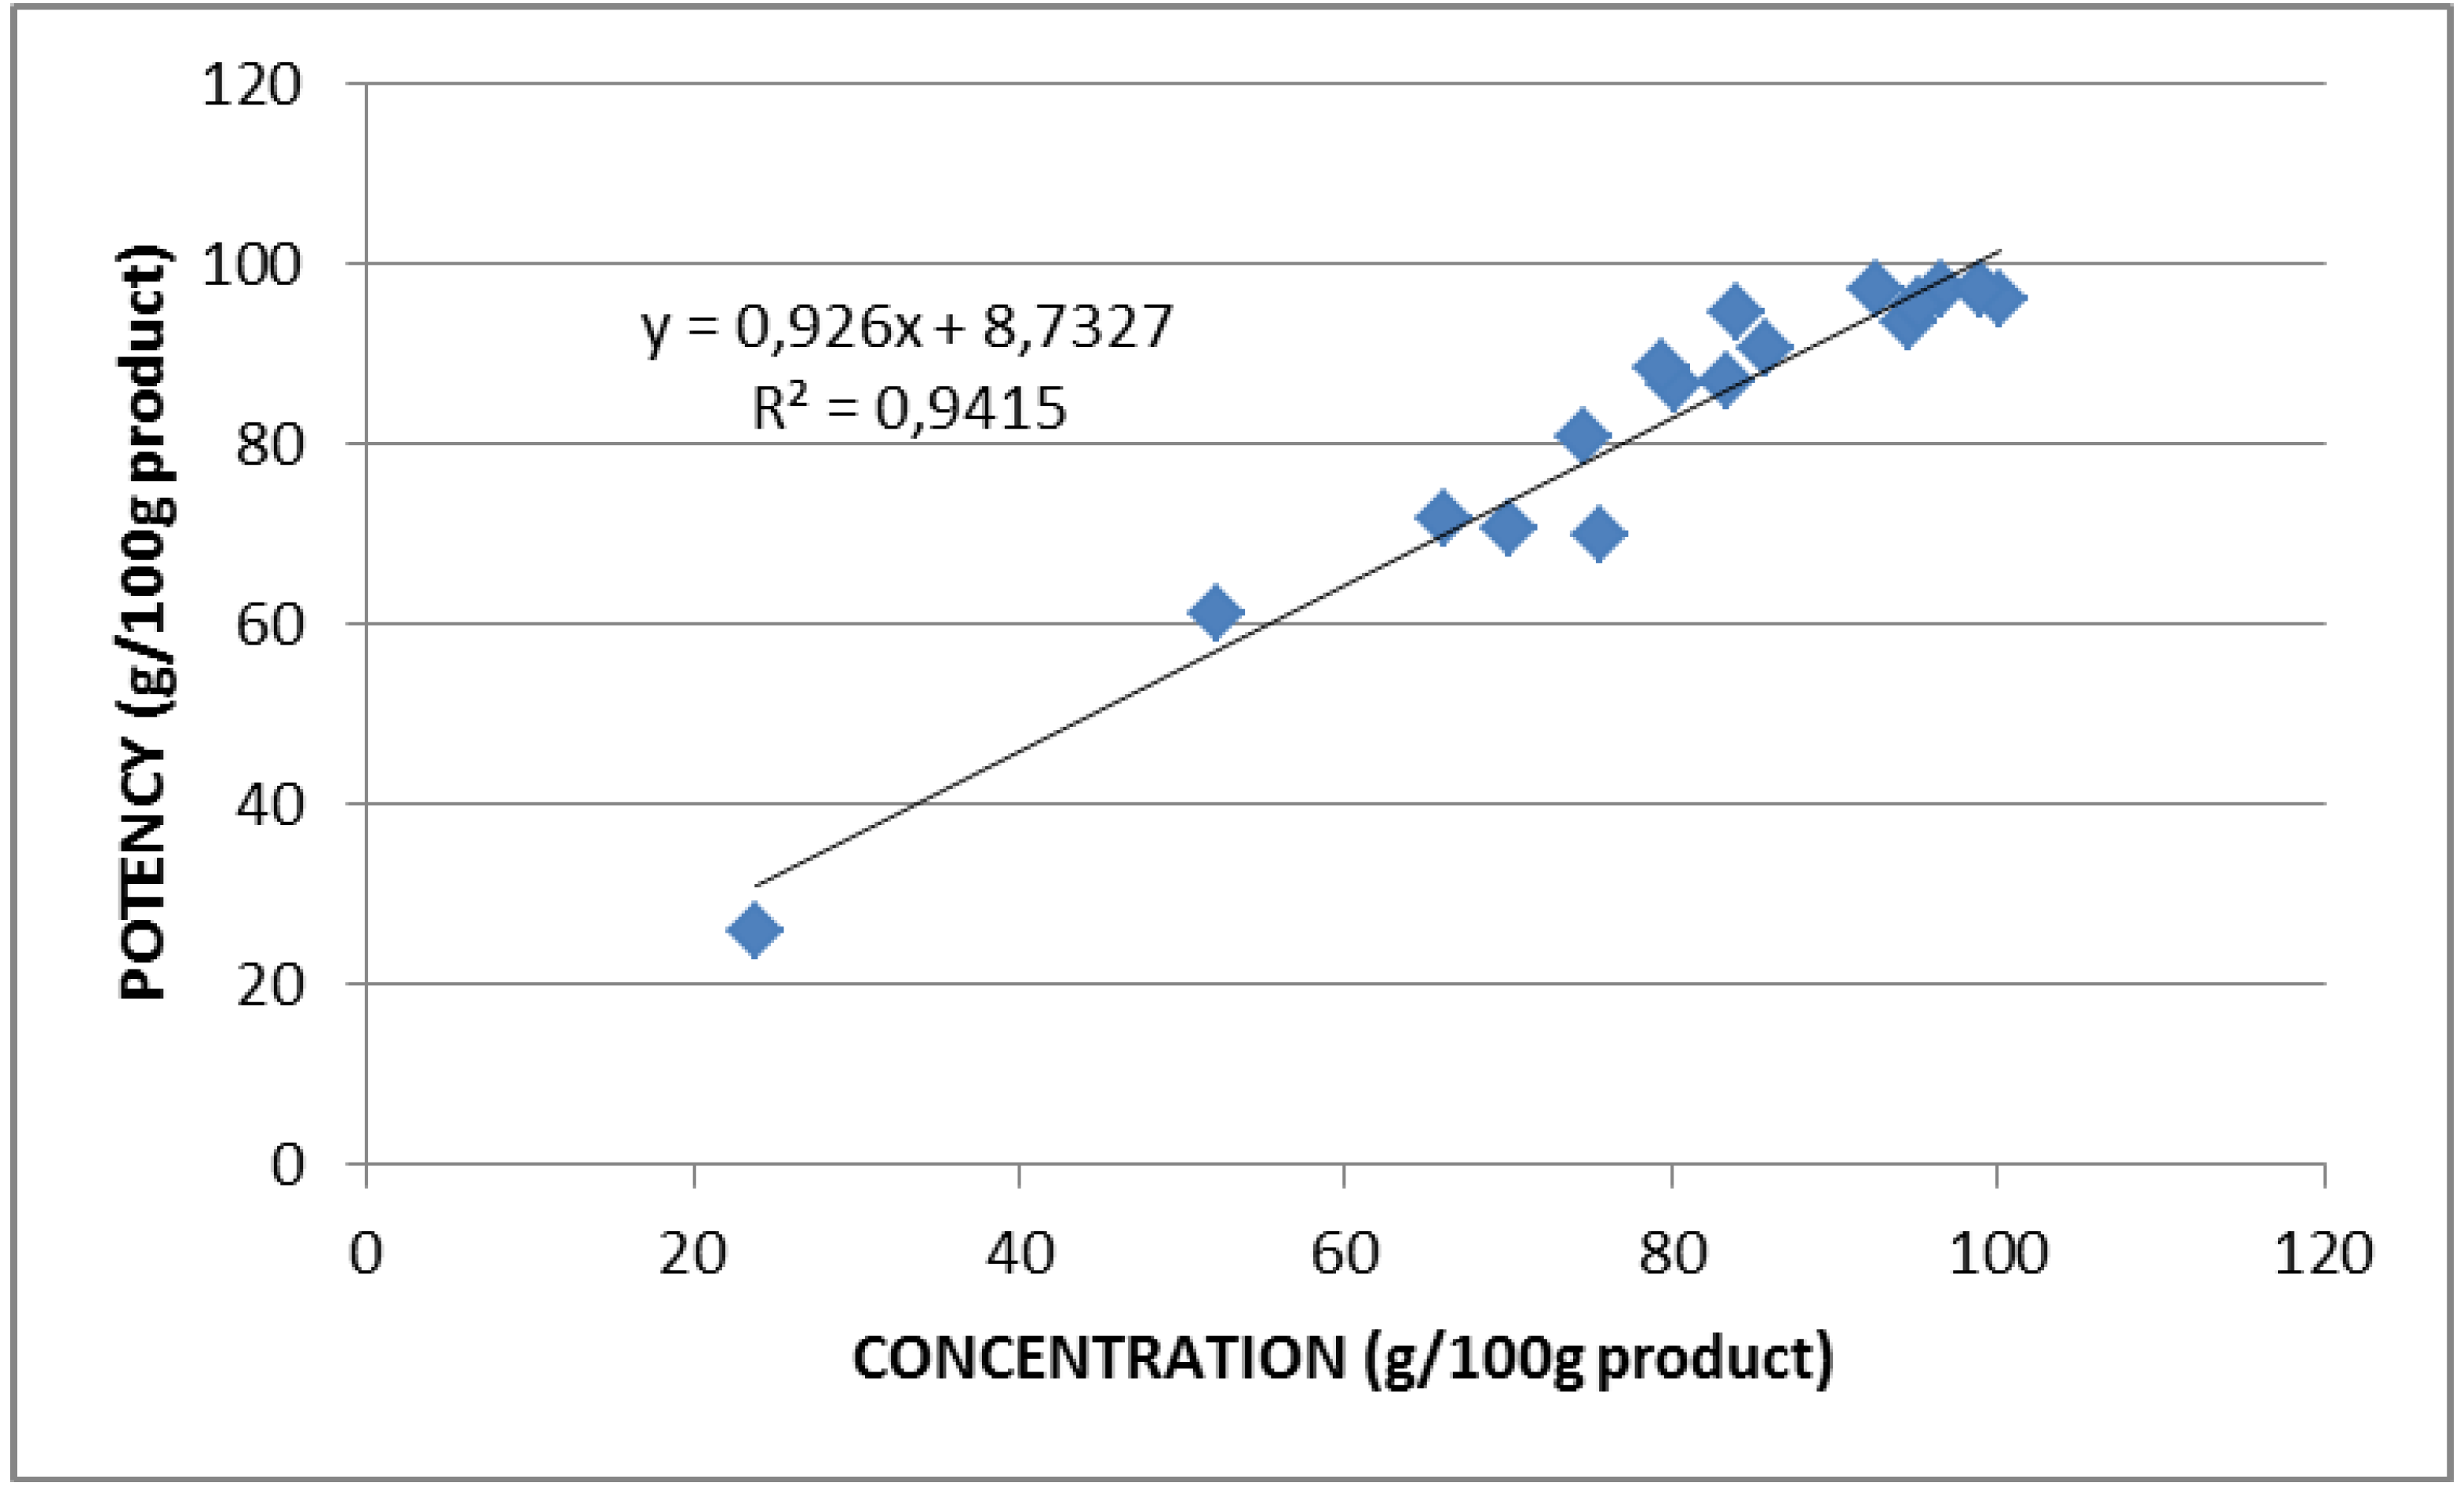
2.2. Lysozyme Concentration and Potency

The specifications laid down by EU Regulation 231/2012 provide microbiological assay as the only parameter directly related to LSZ content in the finished product, and the minimum limit is 950 mg/g on the anhydrous basis.
Considering the microbiological activity determined by the turbidimetric assay [19], the derived potency values ranged between 643 and 1,040 mg/g on the anhydrous basis (Table 2). Six preparations did not comply with the legal minimum content and, as expected, the lowest values of potency were found in samples with low nitrogen content, confirming the presence of substances other than LSZ.
LSZ concentration can be directly determined in milk and cheese by a dedicated HPLC-FLD method widely adopted by the dairy industry and official control organizations [26]. We determined the LSZ concentration in all the commercial preparations by using this method and a pure LSZ standard for quantification. Chromatographic separation was originally optimized to quantify added LSZ in ripened cheeses [11], hence without the interference of other milk proteins or peptides. Under these conditions, HEW proteins other than LSZ are eluted elsewhere in the chromatogram (not shown) and were not detected. The LSZ concentration was in the range of 79 to 100 g/100 g product in those formulations complying with the limits provided by the EU Regulation for nitrogen content, whereas lower levels were found in the irregular samples (Table 1 and Table 2).
Overall, the concentration values were in very good agreement with the potency values, despite they were obtained using completely different approaches. In fact, the former implies the evaluation of the LSZ molecule in the preparation, the latter its enzymatic activity. The high correlation between the two determinations is shown in Figure 2. On the anhydrous basis the potency data highlighted those samples (2, 4, 6, 12, 14, 17) not meeting the required EU Regulation specification, while figures expressed on product basis provide the real LSZ content in the commercial preparation. On the other hand, low values expressed on protein basis demonstrate the presence of proteins other than LSZ (samples 4, 6, 17). Values expressed on protein basis nearest 100 in combination with low values of potency on an anhydrous basis indicate the presence of substances other than protein, as evidenced in samples 6, 12, 14.
Figure 2. Correlation between potency (microbiological activity) and concentration (HPLC) of lysozyme in commercial preparations.
Molecules 18 06008 g002
The LSZ concentration in the liquid formulation (sample 13) was 12 g/100 mL. However, this sample presented an incredibly unusual HPLC pattern, with a large peak eluting at 13 min just before the LSZ peak (Figure 3, pattern a). This peak is usually very small in the commercial preparations (pattern b, referring to sample 15), pure standard (pattern c), as well as in milk and cheese samples [11]. Thus it is disregarded in LSZ quantification in accordance with the ISO-IDF method [26], despite the same UV spectrum as LSZ. By considering both the peaks of sample 13 in the calculation, we found a LSZ concentration of 24 g/100 mL, which is very close to both the expected value according to product specifications (i.e., 22 g/100 mL) and potency value (Table 2). Interestingly, we found a large amount of the peak eluting before LSZ in a very old (10 years) powder preparation, the LSZ peak decreasing proportionally. The identity of this peak is under investigation by HPLC/ESI MS. Preliminary results showed the presence of LSZ with both m/z of 14290 and 14292, whereas the main peak showed the expected m/z 14306 (data not shown). Schneider et al. [25], suggested a conformational isomer of LSZ to elute in this peak which progressively increased in a LSZ solution heated at 99 °C for up to 120 min, as well as in cheese samples during storage. On the other hand, Desfougères et al. [34] studied the effect of heating LSZ in the dry state (80 °C for up to 7 days) under mildly acidic conditions. Using cation exchange liquid chromatography and MS, these authors demonstrated that succinimide derivatives formed in LSZ from ASP and ASN residues without affecting the secondary and tertiary structure of the molecule but decreasing its lytic activity against Micrococcus lysodeikticus.
Figure 3. HPLC patterns of lysozyme in commercial preparations nr 13 (pattern a) and nr 15 (pattern b) and in lysozyme standard (pattern c).
Molecules 18 06008 g003

3. Experimental

3.1. Lysozyme Samples and Reference Materials

A total of 17 different LSZ preparations, collected from 8 different countries, were purchased from either the producer or the commercial distributor (Table 1). A 10-year old LSZ preparation was provided by the manufacturer. Pure HEW LSZ L-6876 from Sigma Aldrich (St. Louis, MO, USA) and from FIP (International Commission on Pharmaceutical Enzymes, Centre for Standards, Harelbekestraat, Belgium) were taken as working standards for HPLC-FLD and potency determination respectively. Pure avidin, ovalbumin, ovomucoid, and ovotransferrin, were purchased from Sigma. Gallin was kindly supplied by the QA/QC laboratory of Neova Technologies, Abbotsford, BC, Canada.

3.2. Composition Analysis

Water content was determined gravimetrically, with the exclusion of the liquid sample. A glass dish and its lid were dried overnight in a drying oven at 102 ± 2 °C. The glass dish was allowed to cool to room temperature in a desiccator. Five grams of LSZ preparation were weighed into the glass dish to the nearest 0.1 mg. The loaded dish with open lid was dried in the oven at 102 ± 2 °C for 3 h (constant weight), then it was closed, cooled in the desiccator and weighed. The total nitrogen content was determined by the Kjeldahl method [45] and 5.29 was used as the conversion factor to protein. Sugar content was determined by HPLC, with refractive index detection on selected samples according to the Standard ISO 22662: IDF 198 – 2007 [46]. About 250 mg of LSZ preparation were weighed into a 100-mL one-mark volumetric flask, added with 80 mL of water and 5 mL Biggs-Szijarto solution [46] to precipitate out protein, and diluted to the 100-mL mark with water. The sample was kept at room temperature for 30 min, then was centrifuged at 5,000 g for 10 min, filtered on PVDF filter and analyzed by HPLC. Mean values of two replicates were considered. Repeatability of the data was within the limits provided by the respective reference methods.

3.3. SDS-PAGE Analysis

SDS-PAGE was performed on a PhastSystem electrophoresis apparatus (Amersham Biosciences, Buckinghamshire, UK) using the commercial Homogeneous 20% polyacrylamide precast gels and PhastGel SDS buffer strips (Amersham Biosciences). Electrophoretic and staining conditions with PhastGel Blue R were those recommended by the manufacturer. Two-hundred µL of LSZ solution (20 mg/mL) was dissolved in 200 µL of 10 mM tris(hydroxymethyl) aminomethane–HCl sample buffer (pH 8.0), containing 2.5% SDS (Merck, Darmstadt, Germany), 10 mM EDTA (Merck) and 5% 2-mercaptoethanol (Merck), and was heated at 99 °C for 10 min. A 1-µL aliquot of each sample was loaded on the gel. Molecular weight standard proteins (GE Healthcare, Little Chalfont, UK) were α-lactalbumin (14.4 kDa), soy trypsin inhibitor (20.1 kDa), carbonic anhydrase (30.0 kDa), ovalbumin (45.0 kDa), bovine serum albumin (66.0 kDa) and phosphorylase b (97.0 kDa). Identification of other egg proteins in the samples was achieved by running pure avidin, gallin, ovomucoid, and ovotransferrin under the same conditions.

3.4. Determination of Lysozyme Potency

The microbiological activity (potency) of LSZ preparations was determined by the turbidimetric assay, according to JECFA method [19]. The cell suspension of Micrococcus luteus (M. lysodeikticus) ATCC 4698 (80 mg in 200 mL) was obtained by rehydration of lyophilized commercial preparation (Sigma) in M/15 phosphate buffer (pH 6.6 ± 0.1). A calibration curve was prepared with the FIP enzyme of known activity. Required amounts of LSZ were added in the test-tubes in order to obtain final quantities of 0.20, 0.28 and 0.40 μg/mL. At exactly 30 s intervals, 5 mL of the suspension of M. luteus were added to each test-tube, and incubated in a water bath at 37 ± 0.5 °C for exactly 12 min. After incubation, the test-tubes were removed from the water bath in the same order as they were put in and the absorbance at 450 nm was recorded against the buffer solution every 30 s, using a UVIDEC320 spectrophotometer (Jasco, Easton, PA, USA). The potency was estimated as the mean value of three replicates for each LSZ sample.

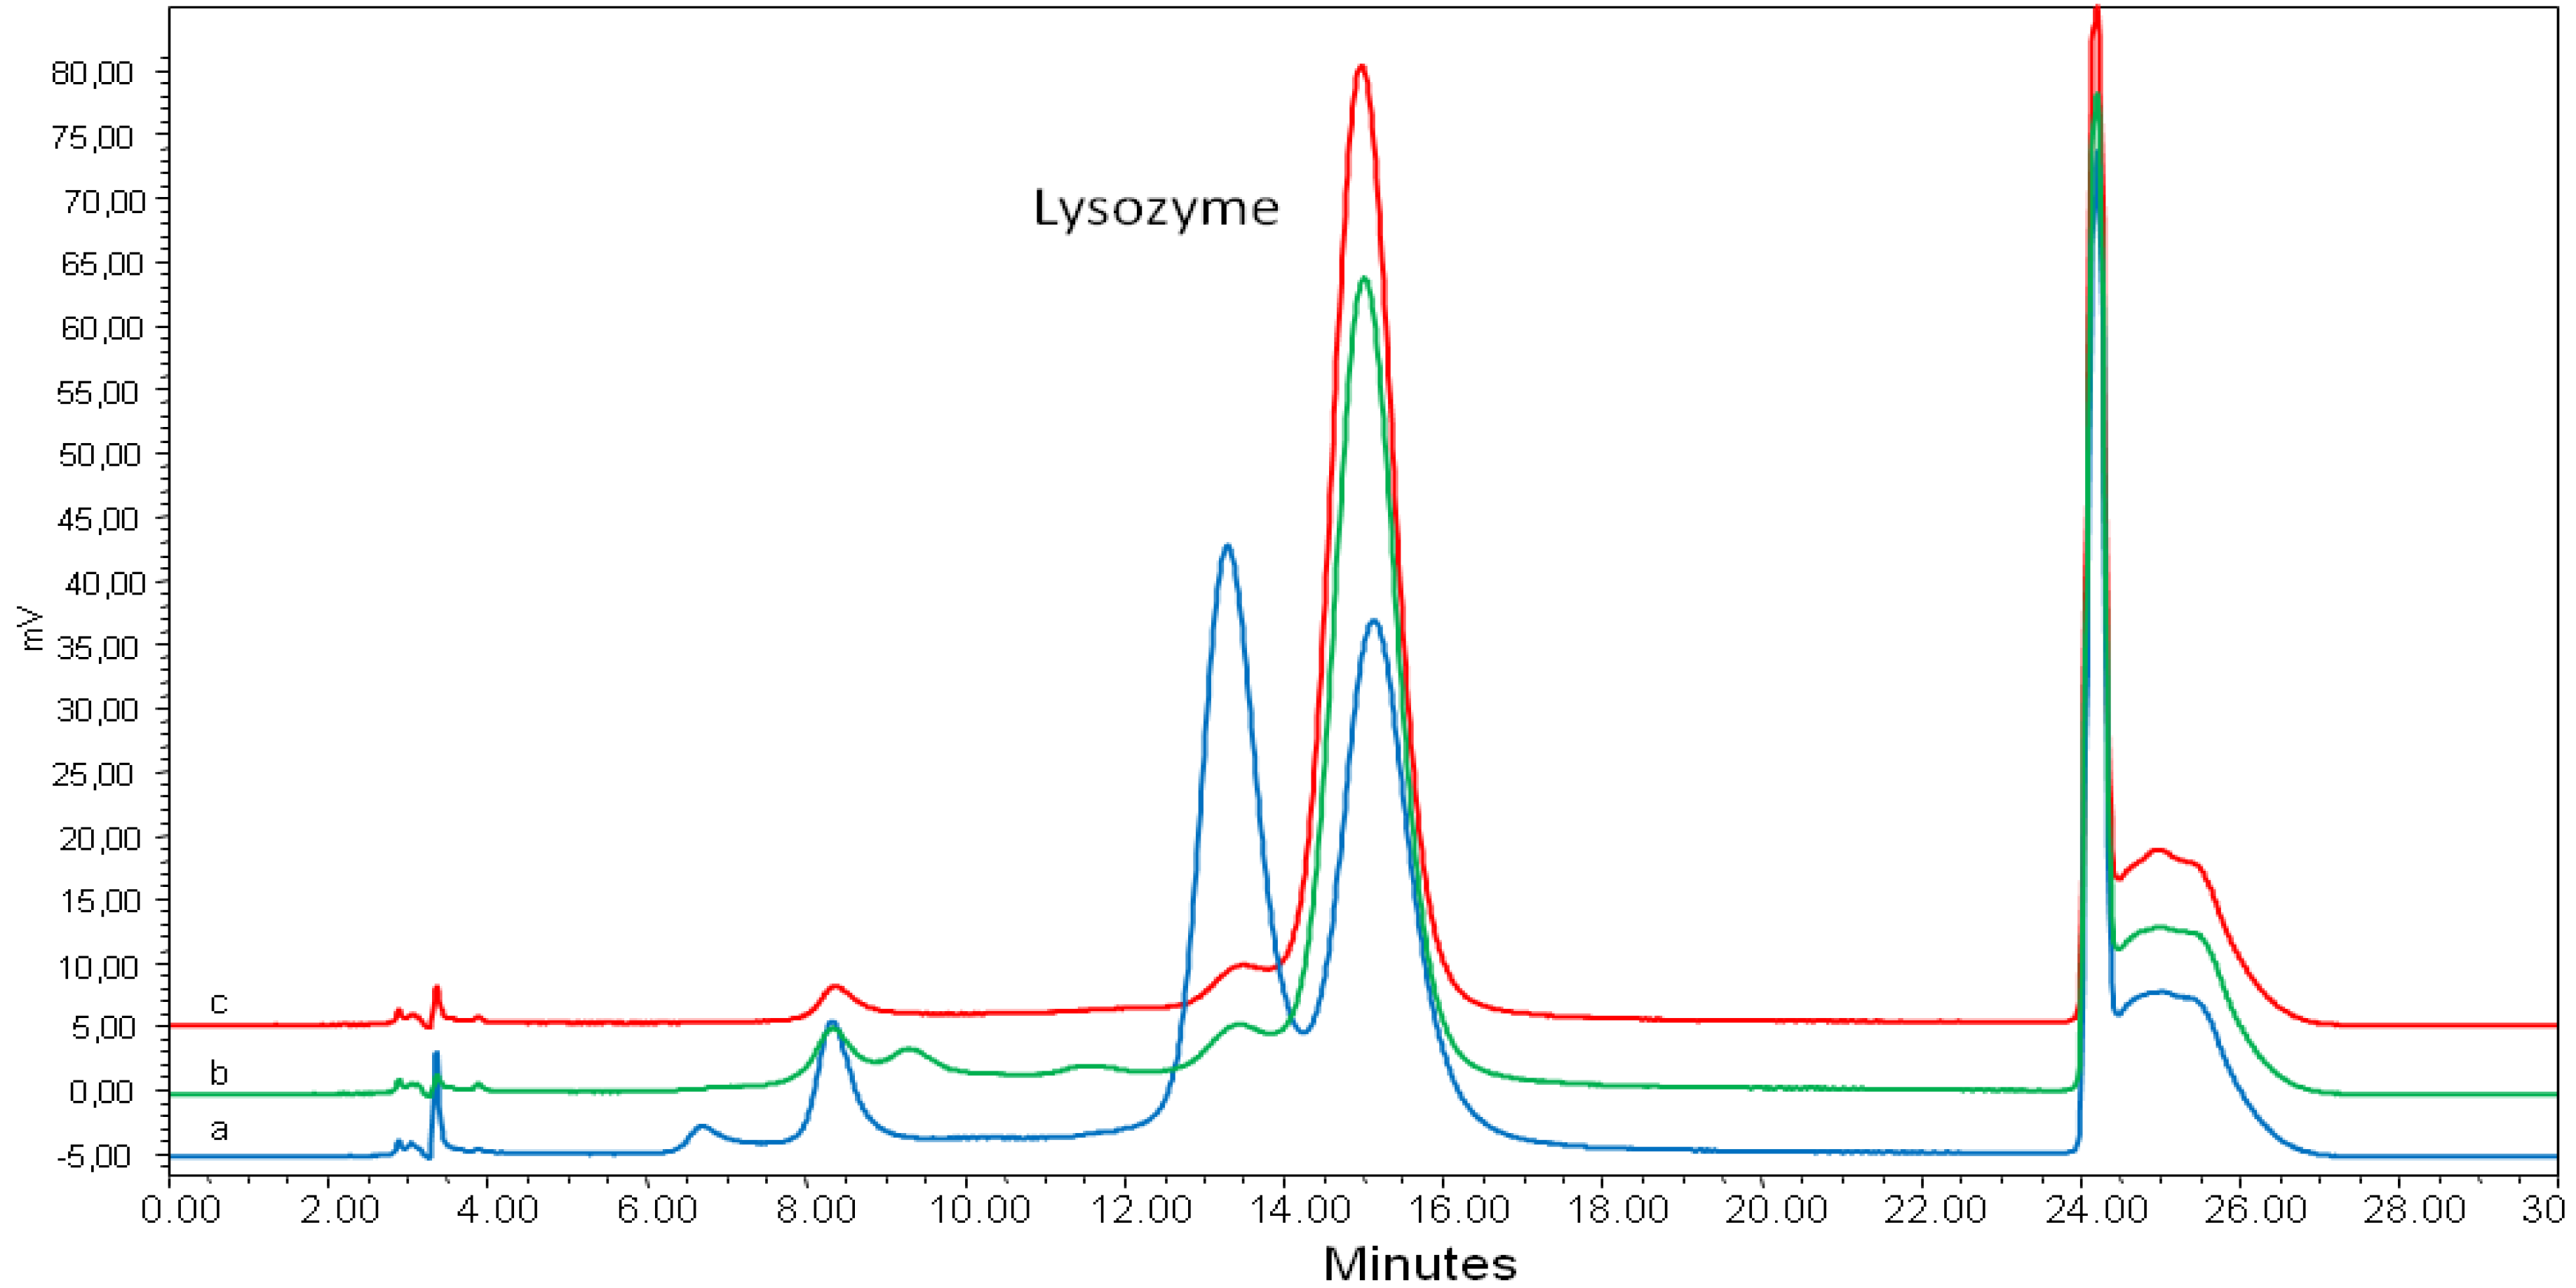
3.5. HPLC-FLD Analysis

Commercial preparations of LSZ were analyzed by HPLC-FLD following the procedure described in the ISO method [26]. Ten milligrams (or 10 µL for liquid preparation) of LSZ preparation were dissolved in 10 mL of water and, after complete solubilisation, 80 µL of the solution were further diluted to 10 mL with 1 mol/L sodium chloride. The chromatographic separation was performed with an Alliance system (Waters, Milford, MA, USA) equipped with a L-2485 fluorescence detector (VWR, Milan, Italy) operating at 280 nm excitation, and 340 nm emission and a 2996 DAD (Waters). The LSZ concentration was calculated by single point calibration using the pure LSZ from Sigma, as provided by the reference method, and results are mean values of duplicated analyses.

4. Conclusions

The analytical results of this study evidenced that the commercially available preparations vary significantly in terms of purity, LSZ concentration and potency. This work has demonstrated that the HPLC method adopted by ISO allows the LSZ concentration to be determined with accuracy and data are significantly correlated to those obtained by the turbidimetric assay advised by FAO/WHO. Furthermore, the HPLC method gives evidence of molecular modifications that can occur during the production process and conservation. SDS-PAGE is suitable for detecting the presence of undesired egg proteins. The rather widespread presence of residual HEW proteins other than LSZ suggests that the control of this aspect should be performed regularly when LSZ is intended as a food additive. To this end, reliable and sensitive analytical methods are indispensable tools. Finally, some of the samples analyzed did not comply with the specifications of EU Regulation 231/2012, most frequently because nitrogen content and enzyme potency were below their respective minimum limits. In some cases this was due to the undeclared presence of saccharides, which proved to replace up to 25% of the enzyme in the product.

Conflicts of Interest

The authors declare no conflict of interest.

References

  1. Durance, T.D. Separation, Purification, and Thermal Stability of Lysozyme and Avidin from Chicken Egg White. In Egg Uses and Processing Technologies. New Developments; Sim, J.S., Nakai, S., Eds.; CAB International Press: Wallingford, UK, 1994; pp. 77–93. [Google Scholar]
  2. Tirelli, A.; de Noni, I. Evaluation of lysozyme stability in young red wine and model systems by a validated HPLC method. Food Chem. 2007, 106, 1564–1570. [Google Scholar] [CrossRef]
  3. Silvetti, T.; Brasca, M.; Lodi, R.; Vanoni, L.; Chiolerio, F.; de Groot, M.; Bravi, A. Effects of lysozyme on the microbiological stability and organoleptic properties of unpasteurized beer. J. Inst. Brew. 2010, 116, 33–40. [Google Scholar] [CrossRef]
  4. Stadhouders, J. Prevention of butyric acid fermentation by the use of nitrate. Bull. Int. Dairy Fed. 1990, 251, 40–46. [Google Scholar]
  5. Van den Berg, G.; Meijer, W.C.; Düsterhöft, E.M.; Smit, G. Gouda and Related Cheeses. In Cheese: Chemistry, Physics and Microbiology, 3rd; Fox, P.F., McSweeney, P.L.H., Cogan, T.M., Guinee, T.P., Eds.; Chapman & Hall: London, UK, 2004; Volume 2, pp. 103–140. [Google Scholar]
  6. Lodi, R. The use of lysozyme to control butyric acid fermentation. Bull. Int. Dairy Fed. 1990, 251, 51–54. [Google Scholar]
  7. Bärtschi, F.; Muralt, L.; Rieder, K.; Kämpfer, U; Schaller, J. Bestimmung von Lysozym in Käse mittels LC-MS. Mitt. Lebensm. Hyg. 2006, 97, 478–488. [Google Scholar]
  8. Cunningham, F.E.; Proctor, V.A.; Goetsch, S.J. Egg-white lysozyme as a food preservative: An overview. World Poultry Sci. J. 1991, 47, 141–163. [Google Scholar] [CrossRef]
  9. Commission Regulation (EU) No. 1129/2011 of 11 November 2011. Off. J. Eur. Union 2011, L295, 1–177.
  10. Codex Alimentarius. Codex-STAN 283–1978, rev. 2010; General Standard for Cheese. 2010; pp. 1–7.
  11. Pellegrino, L.; Tirelli, A. A sensitive HPLC method to detect hen’s egg white lysozyme in milk and dairy products. Int. Dairy J. 2000, 10, 435–442. [Google Scholar] [CrossRef]
  12. European Food Safety Authority. Opinion of the Scientific Panel on Dietetic Products, Nutrition and Allergies on a request from the Commission related to a notification from AMAFE on egg lysozyme used as additive in food pursuant to Article 6 paragraph 11 of Directive 2000/13/EC. EFSA J. 2005, 186, 1–5. [Google Scholar]
  13. European Parliament and Council Regulation No 1169/2011 of 25 October 2011. Off. J. Eur. Union 2011, L 304, 18–63.
  14. Mine, Y.; Zhang, J.W. Comparative studies on antigenicity and allergenicity of native and denatured egg white proteins. J. Agric. Food Chem. 2002, 50, 2679–2683. [Google Scholar] [CrossRef]
  15. Bernhisel-Broadbent, J.; Dintzis, H.M.; Dintzis, R.Z.; Sampson, H.A. Allergenicity and antigenicity of chicken egg ovomucoid (Gal d III) compared with ovalbumin (Gal d I) in children with egg allergy and in mice. J. Allergy Clin. Immun. 1994, 93, 1047–1059. [Google Scholar] [CrossRef]
  16. Iaconelli, A.; Fiorentini, L.; Bruschi, S.; Rossi, F.; Mingrone, G.; Piva, G. Absence of allergic reactions to egg white lysozyme additive in Grana Padano cheese. J. Am. Coll. Nutr. 2008, 27, 326–331. [Google Scholar] [CrossRef]
  17. Fremont, S.; Kanny, G.; Nicolas, J.P.; Moneret-Vautrin, D.A. Prevalence of lysozyme sensitization in an egg-allergic population. Allergy 1997, 52, 224–228. [Google Scholar] [CrossRef]
  18. Holen, E.; Elsayed, S. Characterization of four major allergens of hen egg white by IEF/SDS-PAGE combined with electrophoretic transfer and IgE immunoautoradiography. Int. Arch. Allergy Imm. 1990, 91, 136–141. [Google Scholar] [CrossRef]
  19. Joint FAO/WHO Expert Committee on Food Additives (JECFA) 2006. Available online: http://www.fao.org/food/food-safety-quality/scientific-advice/jecfa/jecfa-additives/en/ (accessed on 18 March 2013).
  20. Gorin, G.; Wang, S.F.; Papapavlou, L. Assay of lysozyme by its lytic action on M.lysodeikticus cells. Anal. Biochem. 1971, 39, 113–127. [Google Scholar] [CrossRef]
  21. McKenzie, H.A.; White, F.H., Jr. Determination of lysozyme activity at low levels with emphasis on the milk enzyme. Anal. Biochem. 1986, 157, 367–374. [Google Scholar] [CrossRef]
  22. Weth, F.; Schroeder, T.; Buxtorf, U.P. Determination of lysozyme content in eggs and egg products using SDS-gel electrophoresis. Z. Lebensm. Unters. For. 1988, 187, 541–545. [Google Scholar] [CrossRef]
  23. Kerkaert, B.; Mestdagh, F.; de Meulenaer, B. Detection of hen’s egg white lysozyme in food: Comparison between a sensitive HPLC and a commercial ELISA method. Food Chem. 2010, 120, 580–584. [Google Scholar] [CrossRef]
  24. Schneider, N.; Becker, C.M.; Pischetsrieder, M. Analysis of lysozyme in cheese by immunocapture mass spectrometry. J. Chromatogr. B 2010, 878, 201–206. [Google Scholar] [CrossRef]
  25. Schneider, N.; Werkmeister, K.; Becker, C.M.; Pischetsrieder, M. Prevalence and stability of lysozyme in cheese. Food Chem. 2011, 128, 145–151. [Google Scholar] [CrossRef]
  26. International Organization for Standardization. Milk and milk products—Determination of hen’s egg white lysozyme by HPLC; ISO/TS 27105:2009|IDF 216:2009; ISO: Geneva, Switzerland, 2009. [Google Scholar]
  27. Commission Regulation (EU) No 231/2012 of 9 March 2012. Off. J. Eur. Union 2012, L 83, 1–295.
  28. Isengard, H.; Haschka, E.; Merkh, G. Determination of water content in lactose by Karl Fischer titration. Interlaboratory collaborative study. Bull. Int. Dairy Fed. 2011, 450, 2–14. [Google Scholar]
  29. Separovich, F.; Lam, Y.H.; Ke, X.; Chan, H.K. A solid-state NMR study of protein hydration and stability. Pharmacol. Res. 1998, 15, 1816–1821. [Google Scholar] [CrossRef]
  30. Nagendra, H.G.; Sukumar, N.; Vijayan, M. Role of water in plasticity, stability, and action of proteins: The crystal structures of lysozyme at very low levels of hydration. Proteins 1998, 32, 229–240. [Google Scholar] [CrossRef]
  31. Gasteiger, E.; Hoogland, C.; Gattiker, A.; Duvaud, S.; Wilkins, M.R.; Appel, R.D.; Bairoch, A. Protein Identification and Analysis Tools on the ExPASy Server. In The Proteomics Protocols Handbook; Walker, J.M., Ed.; Humana Press: New York, NY, USA, 2005; pp. 571–607. [Google Scholar]
  32. Wang, W. Lyophilization and development of solid protein pharmaceuticals. Int. J. Pharm. 2000, 203, 1–60. [Google Scholar] [CrossRef]
  33. Maroufi, B.; Ranjbar, B.; Khajeh, K.; Naderi-Manesh, K.; Yaghoubi, H. Structural studies of hen egg-white lysozyme dimer: Comparison with monomer. Biochim. Biophys. Acta 2008, 1784, 1043–1049. [Google Scholar] [CrossRef]
  34. Desfougères, Y.; Jardin, J.; Lechevalier, V.; Pezennec, S.; Nau, F. Succinimidyl residue formation in hen egg-white lysozyme favors the formation of intermolecular covalent bonds without affecting its tertiary structure. Biomacromolecules 2011, 12, 156–166. [Google Scholar] [CrossRef]
  35. Onuma, K.; Inaka, K. Lysozyme dimer association: Similarities and differences compared with lysozyme monomer association. J. Cryst. Growth 2008, 310, 1174–1181. [Google Scholar] [CrossRef]
  36. Hytonen, V.P.; Laitinen, O.H.; Grapputo, A.; Kettunen, A.; Savolainen, J.; Kalkkinen, N.; Marttila, A.T.; Nordlund, H.R.; Nyholm, T.K.M.; Paganelli, G.; et al. Characterization of poultry egg-white avidins and their potential as a tool in pretargeting cancer treatment. Biochem. J. 2003, 372, 219–225. [Google Scholar] [CrossRef]
  37. Korpela, J. Avidin, a high affinity biotin-binding protein as a tool and subject of biological research. Med. Biol. 1984, 62, 5–26. [Google Scholar]
  38. Desert, C.; Guérin-Dubiard, C.; Nao, F.; Jan, G.; Val, F.; Maillard, J. Comparison of different electrophoretic separation of hen egg white protein. J. Agric. Food Chem. 2001, 49, 4553–4561. [Google Scholar] [CrossRef]
  39. Suzuki, M.; Fujii, H.; Fujigaki, H.; Shinoda, S.; Takahashi, K.; Saito, K.; Wada, H.; Kimoto, M.; Kondo, N.; Seishima, M. Lipocalin-type prostaglandin D synthase and egg white cystatin react with IgE antibodies from children with egg allergy. Allergol. Int. 2010, 59, 175–183. [Google Scholar] [CrossRef]
  40. Mann, K. The chicken egg white proteome. Proteomics 2007, 7, 3558–3568. [Google Scholar] [CrossRef]
  41. Odani, S.; Koide, T.; Ono, T.; Takahashi, Y.; Suzuki, J. Covalent structure of a low-molecular-mass protein, meleagrin present in turkey (Melagris-gallopavo) ovomucoid preparation. J. Biochem-Tokyo 1989, 105, 660–663. [Google Scholar]
  42. Simpson, R.J.; Morgan, F.J. Isolation and complete amino-acid-sequence of a basic low-molecular weight protein from black swan egg-white. J. Biochem. 1983, 22, 476–481. [Google Scholar]
  43. Gong, D.; Wilson, P.W.; Bain, M.M.; Mc Dade, K.; Kalina, J.; Hervé-Grépinet, V.; Nys, Y.; Dunn, I.C. Gallin: An antimicrobial peptide member of a new avian defensin family, the ovodefensins, has been subject to recent gene duplication. BMC Immunol. 2010, 11. [Google Scholar] [CrossRef]
  44. Miguel, M.; Manso, M.A.; López-Fandiño, R.; Ramos, M. Comparative study of egg white proteins from different species by chromatographic and electrophoretic methods. Eur. Food Res. Technol. 2005, 221, 542–546. [Google Scholar] [CrossRef]
  45. International Organization for Standardization. Food and Feed Products—General Guidelines for the Determination of Nitrogen by the Kjeldahl Method; ISO 1871:2009; ISO: Geneva, Switzerland, 2009. [Google Scholar]
  46. International Organization for Standardization. Milk and Milk Products—Determination of Lactose Content by High-Performance Liquid Chromatography (Reference Method); ISO 22662|IDF 198:2007; ISO: Geneva, Switzerland, 2009. [Google Scholar]
  • Sample Availability: Samples are available by contacting the authors.

