Phylattrin, a New Cytotoxic Xanthone from Calophyllum soulattri

Abstract
:1. Introduction
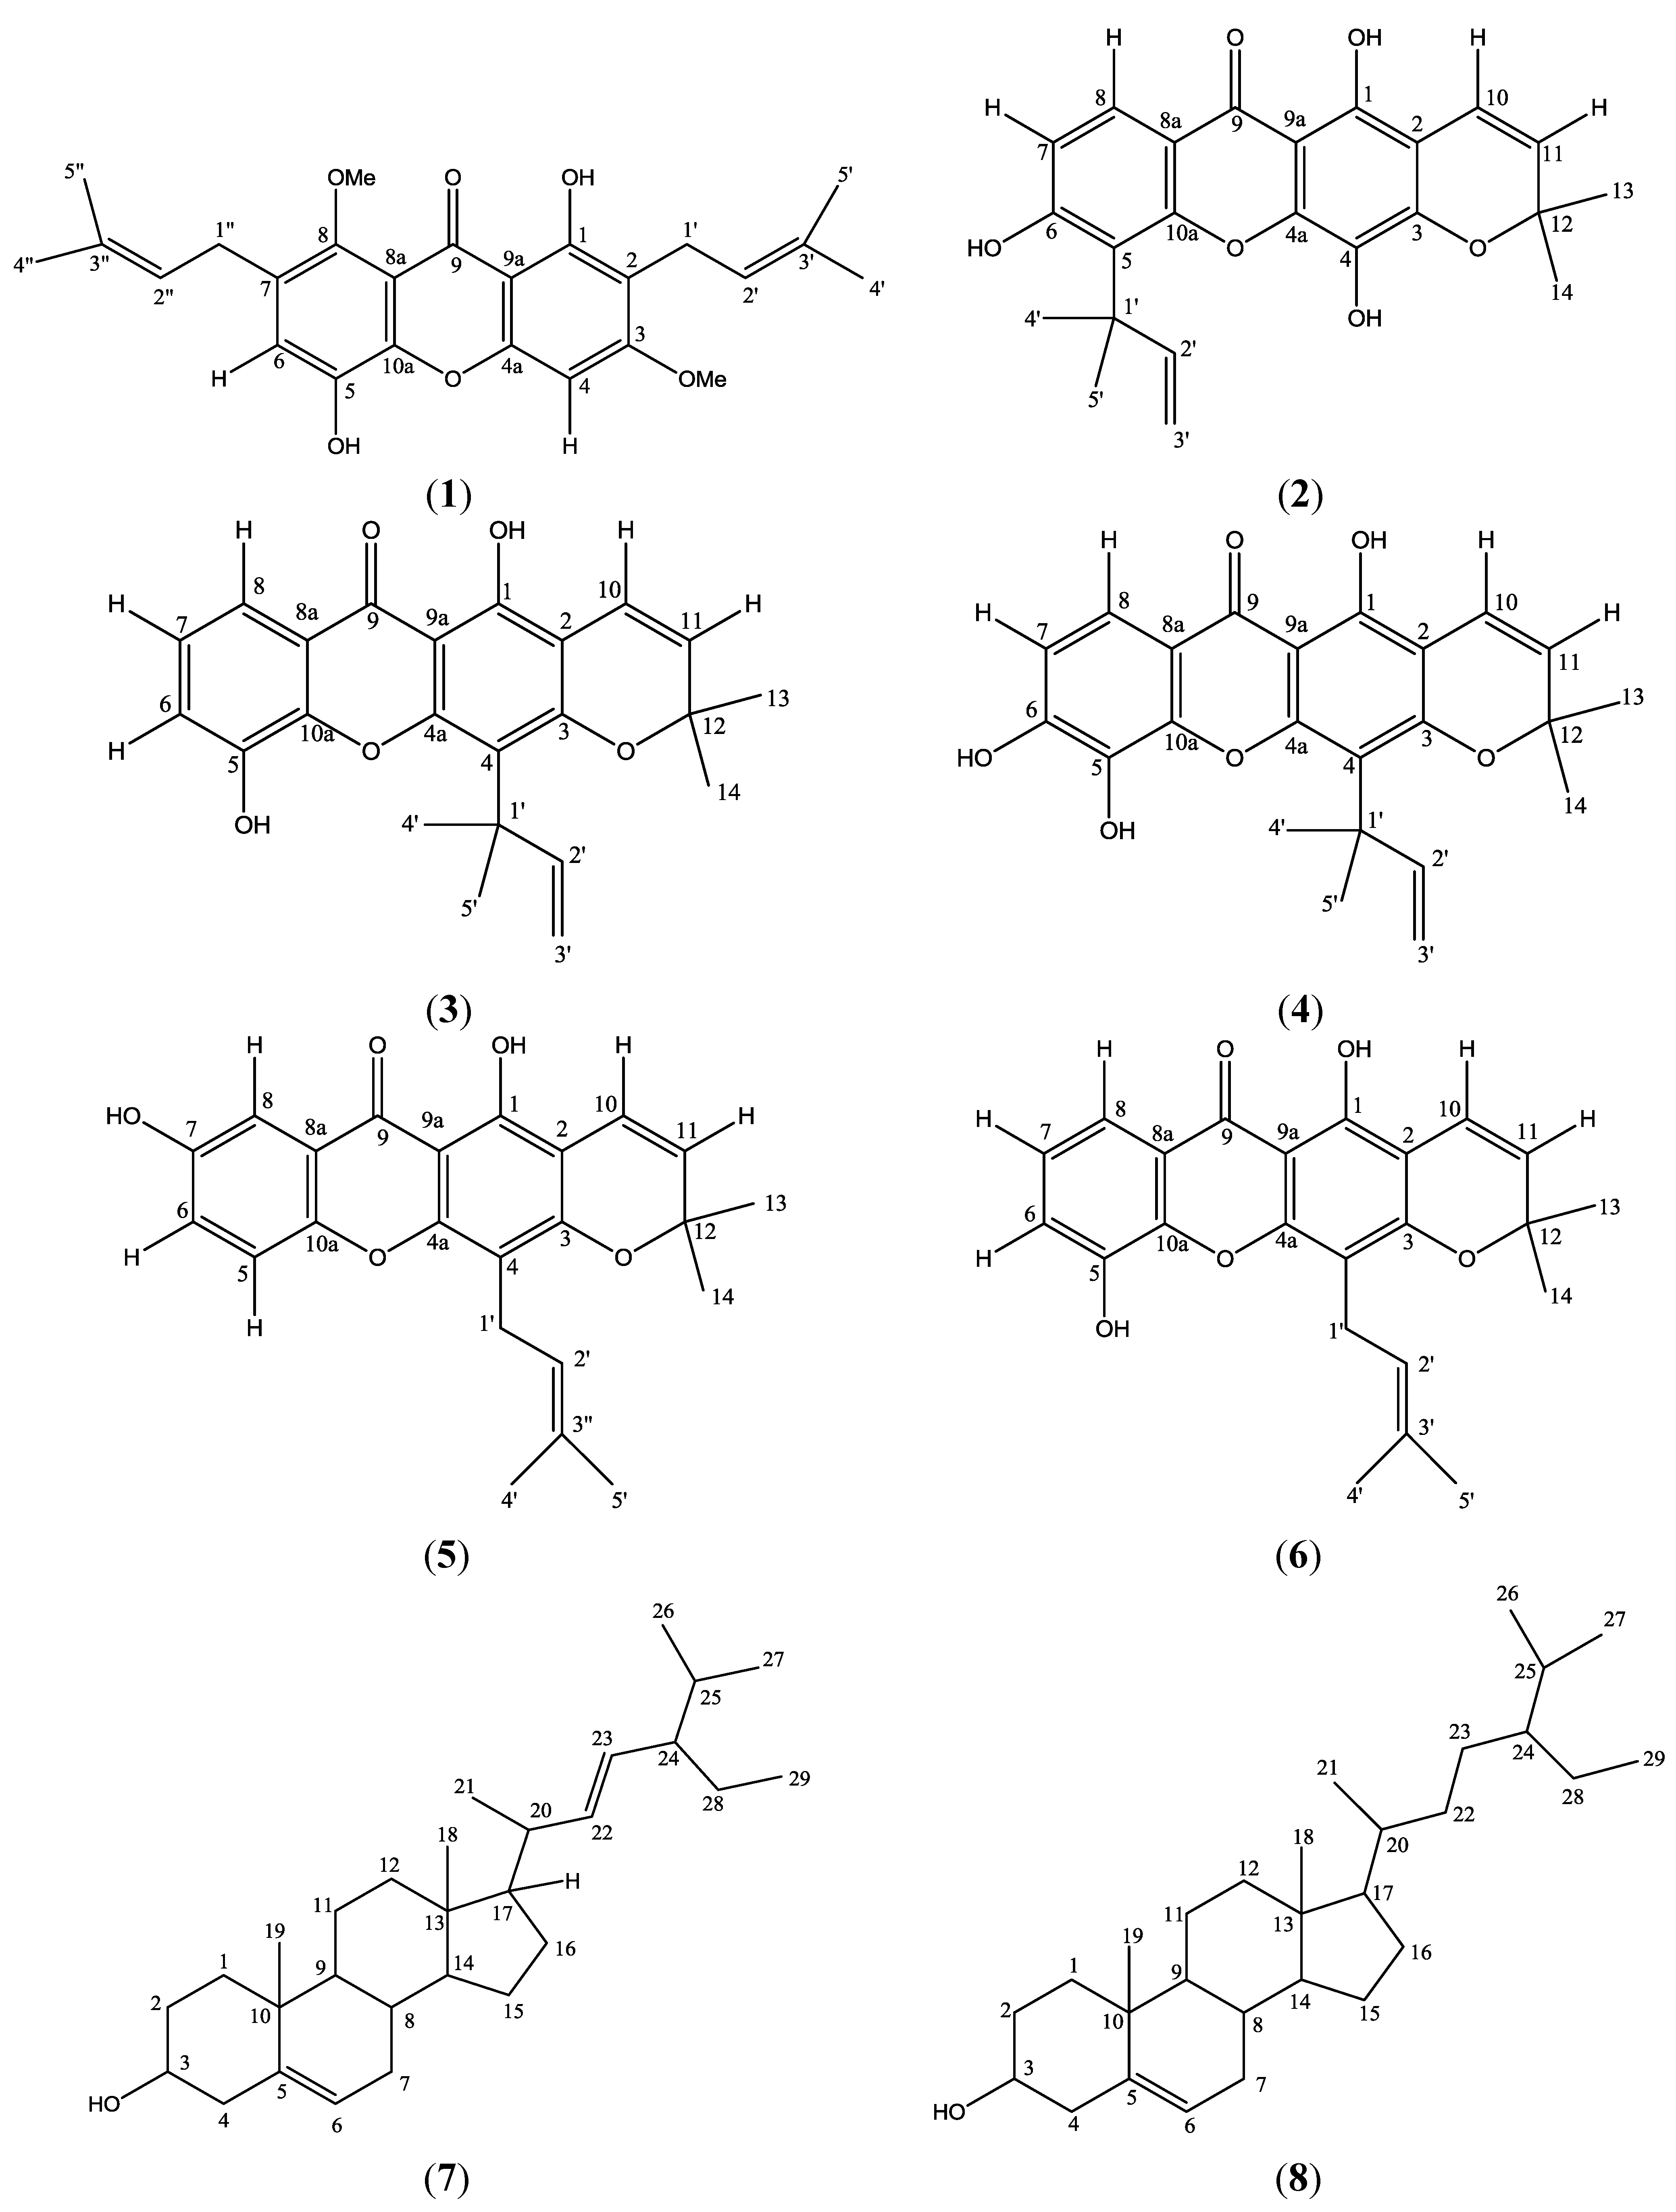
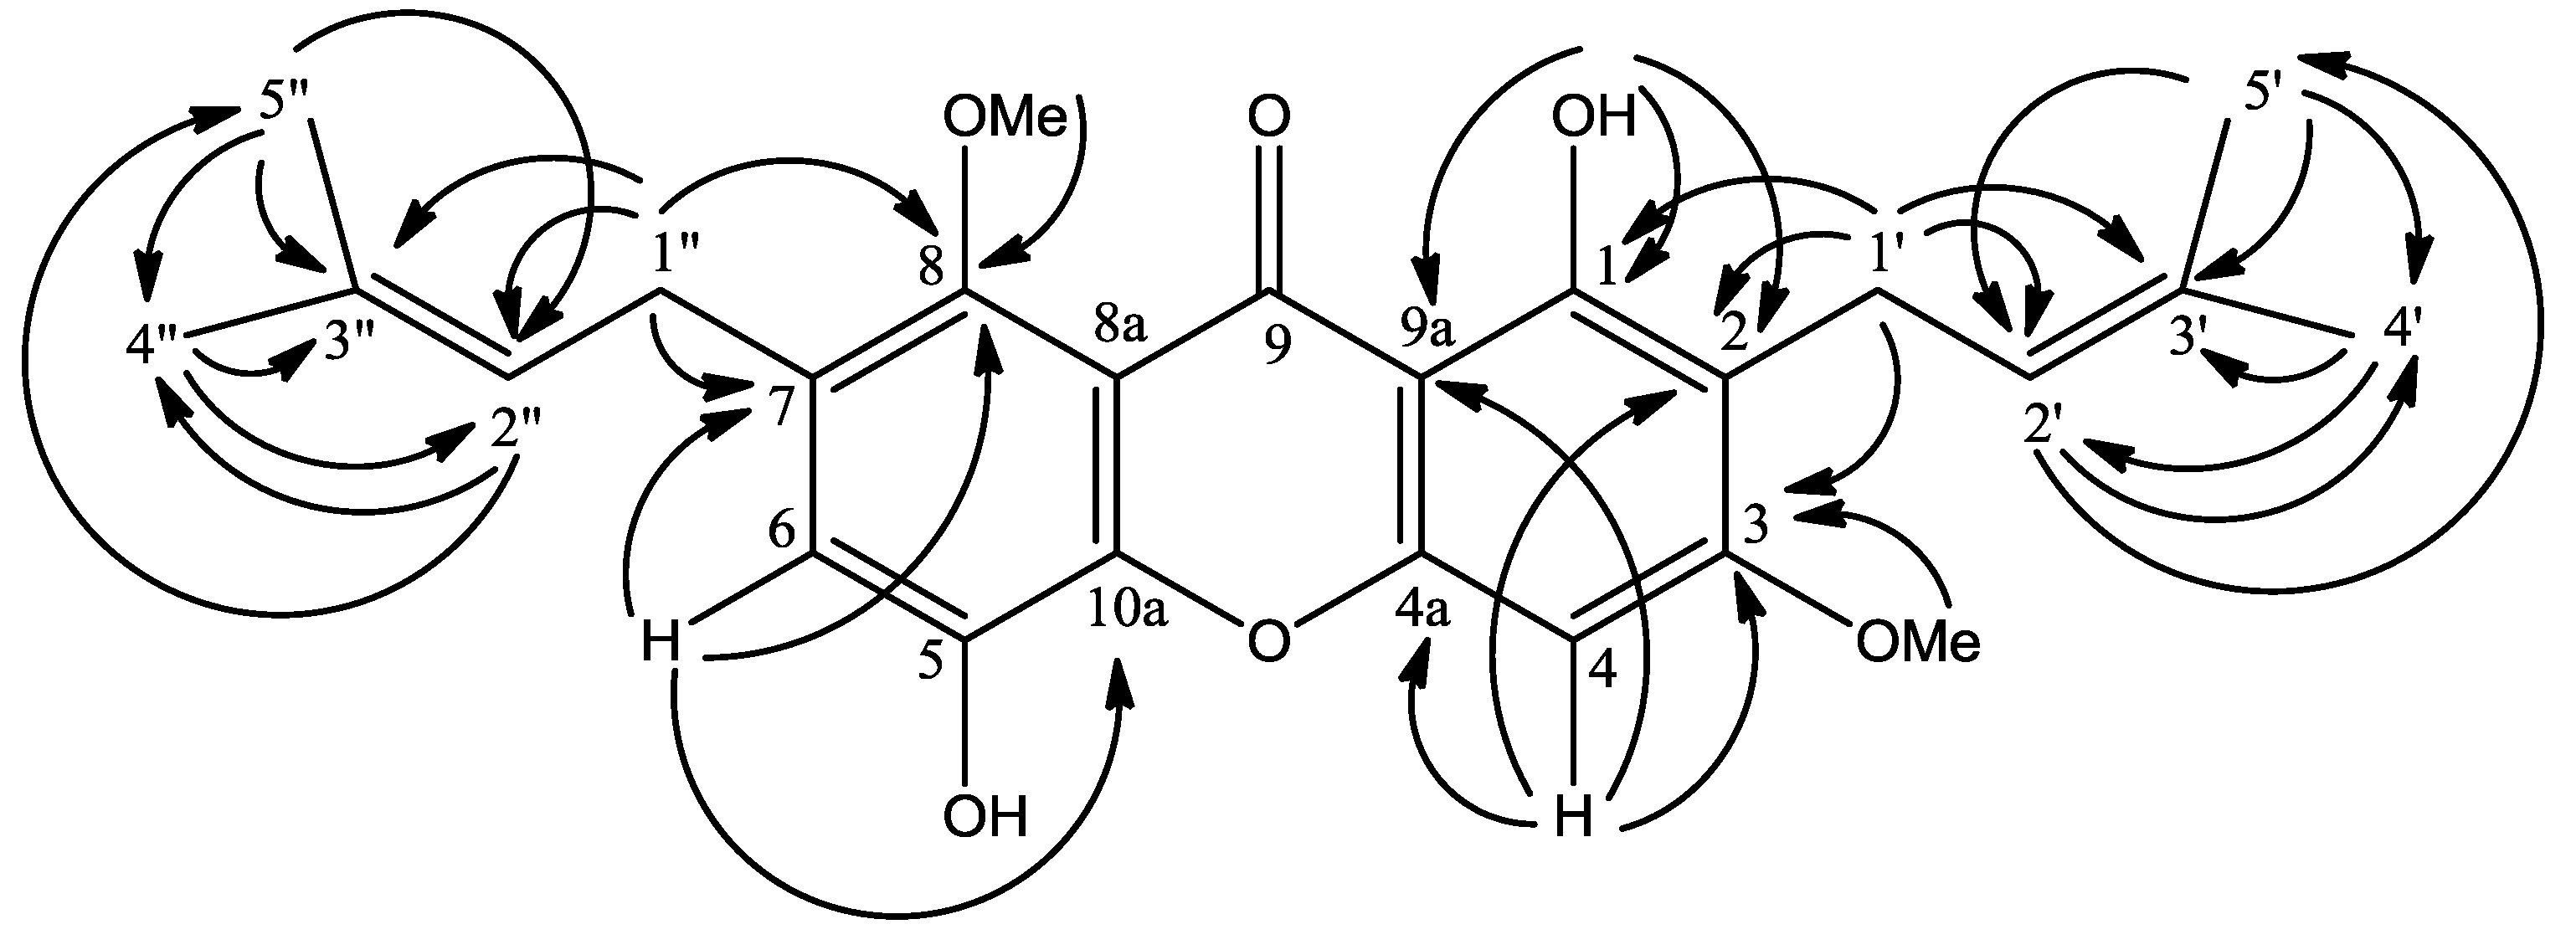
2. Results and Discussion


| Compounds | IC50 (μM) * | ||||||||
|---|---|---|---|---|---|---|---|---|---|
| SNU-1 | HeLa | NCI-H23 | Hep G2 | K562 | Raji | LS174T | SK-MEL-28 | IMR-32 | |
| 1 | 9.79 ± 0.23 | 9.20 ± 0.83 | 10.45 ± 0.58 | 20.64 ± 0.86 | 22.10 ± 0.61 | 11.67 ± 0.16 | 11.04 ± 1.08 | 11.04 ± 1.24 | 18.42 ± 1.06 |
| 2 | 1.98 ± 0.47 | 2.77 ± 0.59 | 2.64 ± 0.45 | 12.87 ± 1.03 | 2.23 ± 0.13 | 2.56 ± 0.80 | 3.17 ± 0.55 | 1.45 ± 1.04 | 0.69 ± 0.91 |
| 3 | 24.79 ± 0.78 | 6.88 ± 0.91 | 15.42 ± 0.83 | 6.22 ± 0.75 | 18.20 ± 0.76 | 15.50 ± 1.14 | 28.94 ± 0.57 | >100.00 | 18.60 ± 0.59 |
| 4 | 4.95 ± 0.85 | 6.95 ± 0.47 | 4.62 ± 0.38 | 11.12 ± 0.72 | 5.28 ± 0.22 | 4.44 ± 0.50 | 15.08 ± 0.94 | 39.64 ± 0.74 | 4.95 ± 1.20 |
| 5 | 20.66 ± 0.43 | >100.00 | 44.10 ± 1.19 | 24.81 ± 0.45 | 31.00 ± 0.21 | 26.16 ± 0.47 | 36.38 ± 0.37 | 28.92 ± 0.18 | 92.59 ± 1.00 |
| 6 | 15.71 ± 0.28 | 7.57 ± 0.44 | 82.67 ± 0.78 | 27.54 ± 1.48 | >100.00 | 20.66 ± 1.29 | 49.60 ± 0.71 | 26.85 ± 0.63 | >100.00 |
| 7 | >100.00 | >100.00 | >100.00 | >100.00 | >100.00 | 0.41 ± 0.87 | >100.00 | 9.47 ± 0.84 | >100.00 |
| 8 | >100.00 | >100.00 | >100.00 | >100.00 | >100.00 | >100.00 | >100.00 | >100.00 | >100.00 |
| Kaempferol ** | 38.22 ± 0.08 | 17.48 ± 1.13 | 65.56 ± 0.21 | >100.00 | >100.00 | 43.71 ± 0.80 | >100.00 | 76.15 ± 0.86 | >100.00 |
| Quercetin ** | 20.86 ± 1.01 | 26.49 ± 1.00 | 57.95 ± 0.31 | 17.25 ± 0.95 | 32.75 ± 1.20 | 6.89 ± 0.40 | >100.00 | 72.45 ± 0.84 | >100.00 |
3. Experimental
3.1. General
3.2. Plant Material
3.3. Extraction and Isolation
3.4. Cytotoxicity (MTT Assay)
4. Conclusions
Acknowledgments
References
- Mah, S.H.; Ee, G.C.L.; Rahmani, M.; Taufiq-Yap, Y.H.; Go, R.; Teh, S.S. A New Pyranoxanthone from the Stem Bark of Calophyllum inophyllum. Lett. Org. Chem. 2011, 8, 447–449. [Google Scholar] [CrossRef]
- Ee, G.C.L.; Mah, S.H.; Rahmani, M.; Taufiq-Yap, Y.H.; Teh, S.S.; Lim, Y.M. A new furanoxanthone from the stem bark of Calophyllum inophyllum. J. Asian Nat. Prod. Res. 2011, 13, 956–960. [Google Scholar]
- Dharmaratne, H.R.; Wijesinghe, W.M.; Thevanasem, V. Antimicrobial activity of xanthones from Calophyllum species, against methicillin-resistant Staphylococcus aureus (MRSA). J. Ethnopharmacol. 1999, 66, 339–342. [Google Scholar] [CrossRef]
- Mah, S.H.; Ee, G.C.L.; Rahmani, M.; Taufiq-Yap, Y.H.; Sukari, M.A.; Teh, S.S. A New Pyranoxanthone from Calophyllum soulattri. Molecules 2011, 16, 3999–4004. [Google Scholar]
- Ee, G.C.L.; Ng, K.N.; Taufiq-Yap, Y.H.; Rahmani, M.; Ali, A.M.; Muse, R. Mucigerin, a new coumarin from Calophyllum mucigerum (Guttiferae). Nat. Prod. Res. 2004, 18, 123–128. [Google Scholar]
- Dharmaratne, H.R.; Sotheeswaran, S.; Balasubramaniam, S.; Waight, E.S. Triterpenoids and Coumarins From The Leaves of Calophyllum cordato-oblongum. Phytochemistry 1985, 24, 1553–1556. [Google Scholar]
- Ravelonjato, B.; Kunesch, N.; Poisson, J.E. Neoflavanoids From The Stem Bark of Calophyllum verticillatum. Phytochemistry 1987, 26, 2973–2976. [Google Scholar]
- Ito, C.; Itoigawa, M.; Miyamoto, Y.; Rao, K.S.; Takayasu, J.; Okuda, Y.; Mukainaka, T.; Tokuda, H.; Nishino, H.; Furukawa, H. A new biflavonoid from Calophyllum panciflorum with antitumor-promoting activity. J. Nat. Prod. 1999, 62, 1668–1671. [Google Scholar]
- Ishikawa, T.; Oku, Y.; Tanaka, T.; Kumamoto, T. An Approach to Anti-HIV-1 Active Calophyllum Coumarin Synthesis: An Enantioselective Construction of 2,3-Dimethyl-4-chromanone Ring by Quinine- Assisted Intramolecular Michael-Type Addition. Tetrahedron Lett. 1999, 40, 3777–3780. [Google Scholar]
- Spino, C.; Dodier, M.; Sotheeswaran, S. Anti-HIV coumarins from Calophyllum seed oil. Bioorg. Med. Chem. Lett. 1998, 8, 3475–3478. [Google Scholar]
- Itoigawa, M.; Ito, C.; Tan, H.T.; Kuchide, M.; Tokuda, H.; Nishino, H.; Furukawa, H. Cancer chemopreventive agents, 4-phenylcoumarins from Calophyllum inophyllum. Cancer Lett. 2001, 169, 15–19. [Google Scholar] [CrossRef]
- Ali, M.S.; Mahmud, S.; Perveen, S.; Ahmad, V.U.; Rizwani, G.H. Epimers From The Leaves of Calophyllum inophyllum. Phytochemistry 1999, 50, 1385–1389. [Google Scholar] [CrossRef]
- Iinuma, M.; Tosa, H.; Tanaka, T.; Yonemori, S. Two xanthones from root bark of Calophyllum inophyllum. Phytochemistry 1994, 35, 527–532. [Google Scholar]
- Iinuma, M.; Tosa, H.; Tanaka, T.; Yonemori, S. Two new xanthones in the underground part of Calophyllum inophyllum. Heterocycles 1994, 37, 833–838. [Google Scholar] [CrossRef]
- Jamaluddin, F.; Mohamed, S.; Lajis, M.N. Hypoglycaemic effect of Parkia speciosa seeds due to the synergistic action of [beta]-sitosterol and stigmasterol. Food Chem. 1994, 49, 339–345. [Google Scholar] [CrossRef]
- Ito, C.; Itoigawa, M.; Mishina, Y.; Filho, V.C.; Mukainaka, T.; Tokuda, H.; Nishino, H.; Furukawa, H. Chemical Constituents of Calophyllum brasiliensis: Structure Elucidation of Seven New Xanthones and Their Cancer Chemopreventive Activity. J. Nat. Prod. 2002, 65, 267–272. [Google Scholar]
- Somanathan, R.; Sultanbawa, S.; Uvais, M. Chemical Investigation of Ceylonese Plants. Part VIII. Trapezifolixanthone, a New Di-isoprenylated Xanthone from the Bark of Calophyllum trapezifolium Thw. (Guttiferae). J. Chem. Soc. Perkin Trans. I 1974, 1974, 2515–2517. [Google Scholar]
- Mosmann, T. Rapid Colorimetric Assay for Cellular Growth and Survival: Application to Proliferation and Cytotoxicity Assays. J. Immunol. Meth. 1983, 65, 55–63. [Google Scholar] [CrossRef]
- Sample Availability: Samples of the compounds 1–9 are available from the authors.
© 2012 by the authors; licensee MDPI, Basel, Switzerland. This article is an open-access article distributed under the terms and conditions of the Creative Commons Attribution license (http://creativecommons.org/licenses/by/3.0/).
Share and Cite
Mah, S.H.; Ee, G.C.L.; Teh, S.S.; Rahmani, M.; Lim, Y.M.; Go, R. Phylattrin, a New Cytotoxic Xanthone from Calophyllum soulattri. Molecules 2012, 17, 8303-8311. https://doi.org/10.3390/molecules17078303
Mah SH, Ee GCL, Teh SS, Rahmani M, Lim YM, Go R. Phylattrin, a New Cytotoxic Xanthone from Calophyllum soulattri. Molecules. 2012; 17(7):8303-8311. https://doi.org/10.3390/molecules17078303
Chicago/Turabian StyleMah, Siau Hui, Gwendoline Cheng Lian Ee, Soek Sin Teh, Mawardi Rahmani, Yang Mooi Lim, and Rusea Go. 2012. "Phylattrin, a New Cytotoxic Xanthone from Calophyllum soulattri" Molecules 17, no. 7: 8303-8311. https://doi.org/10.3390/molecules17078303
APA StyleMah, S. H., Ee, G. C. L., Teh, S. S., Rahmani, M., Lim, Y. M., & Go, R. (2012). Phylattrin, a New Cytotoxic Xanthone from Calophyllum soulattri. Molecules, 17(7), 8303-8311. https://doi.org/10.3390/molecules17078303