Antibacterial, Antifungal and Cytotoxic Isoquinoline Alkaloids from Litsea cubeba

Abstract
:1. Introduction

2. Results and Discussion
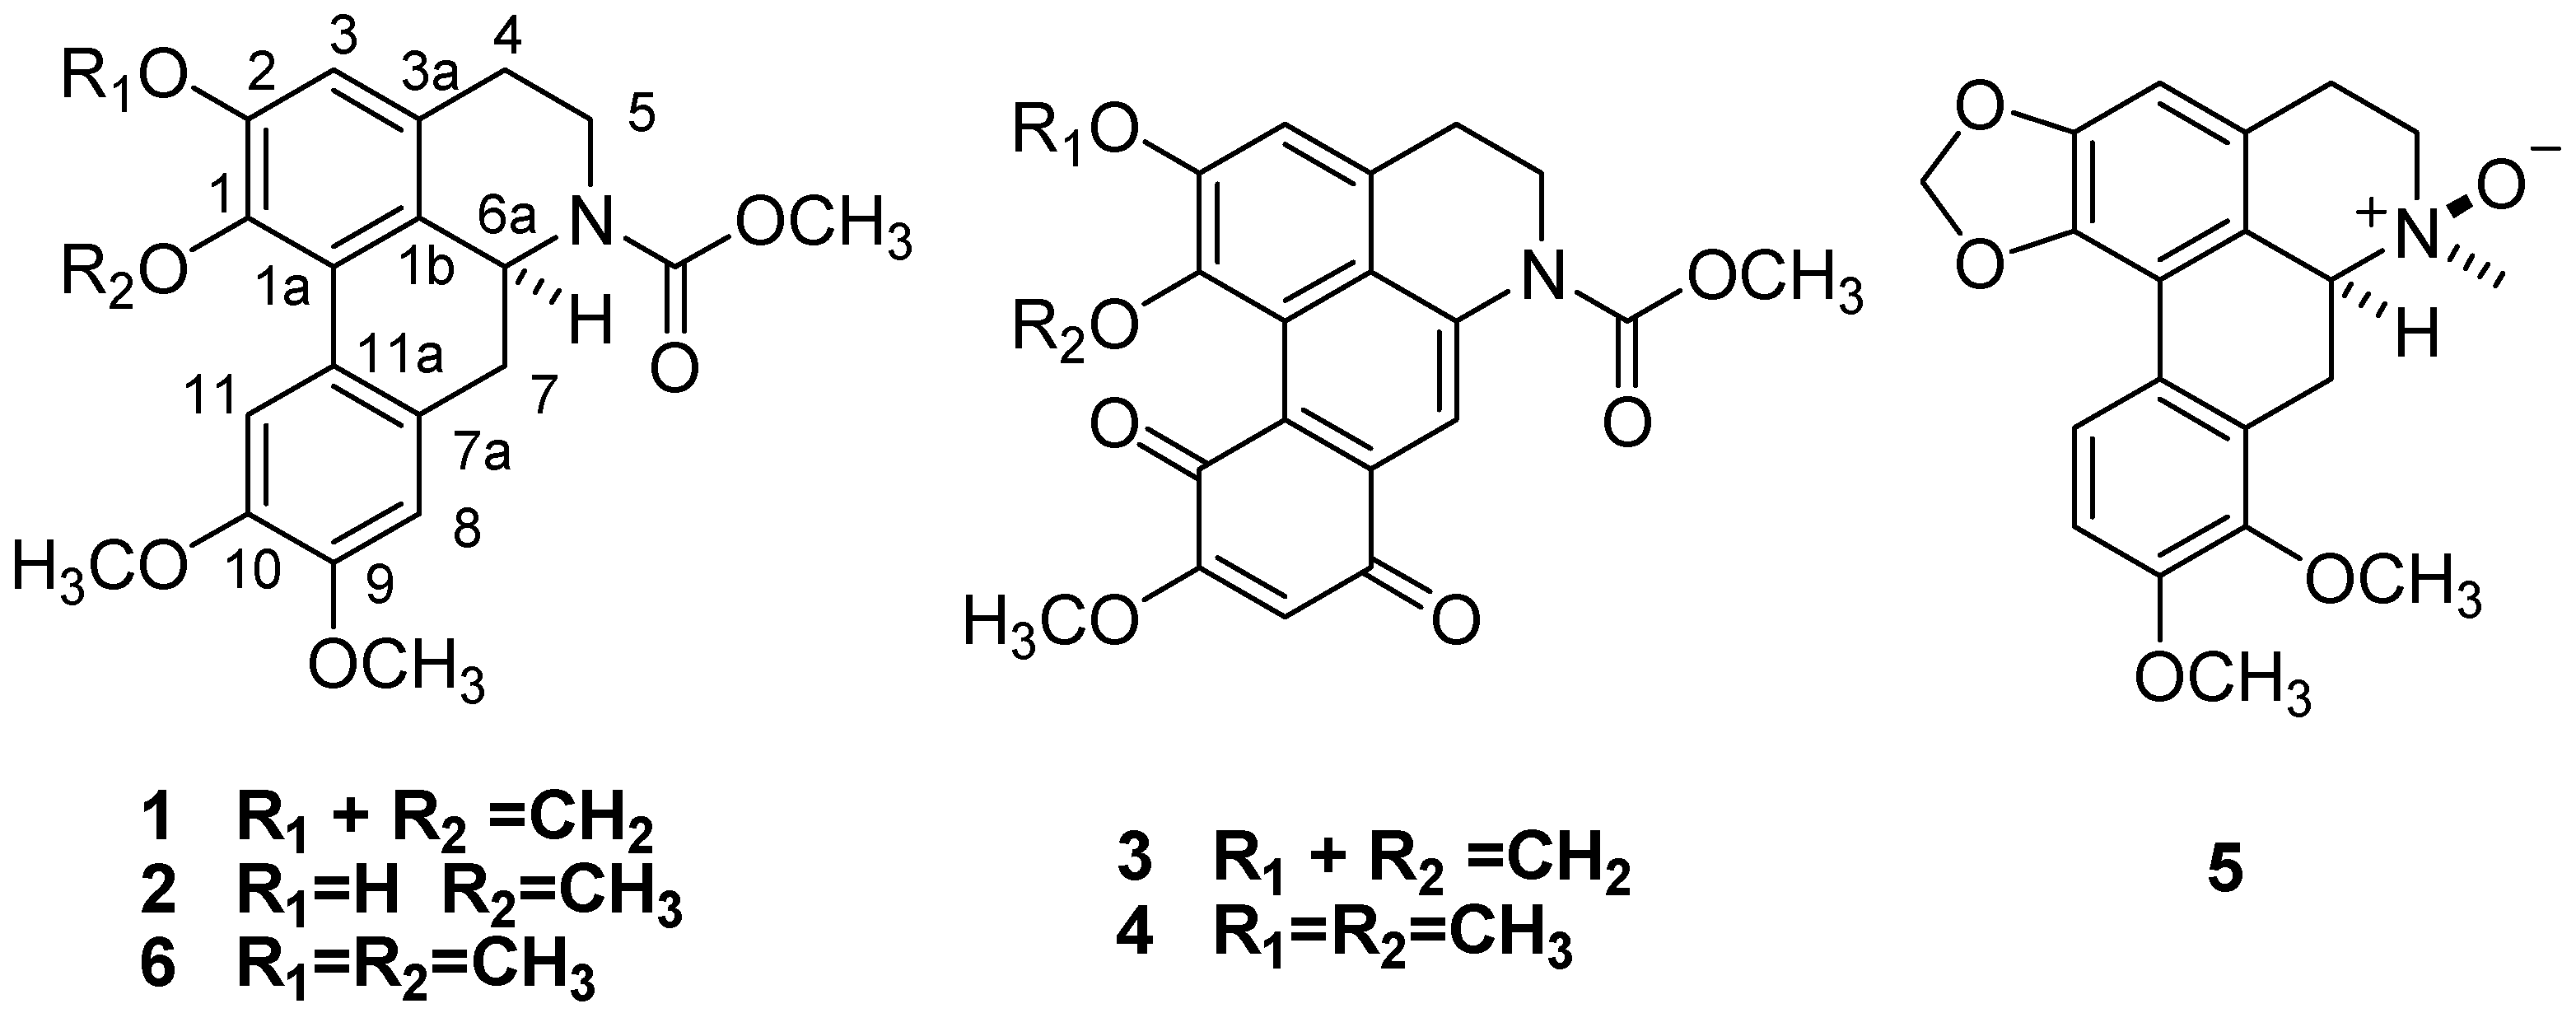
 = +96.13) [17]. Therefore, compound 1 was identified as (+)-N-(methoxycarbonyl)-N-nordicentrin.
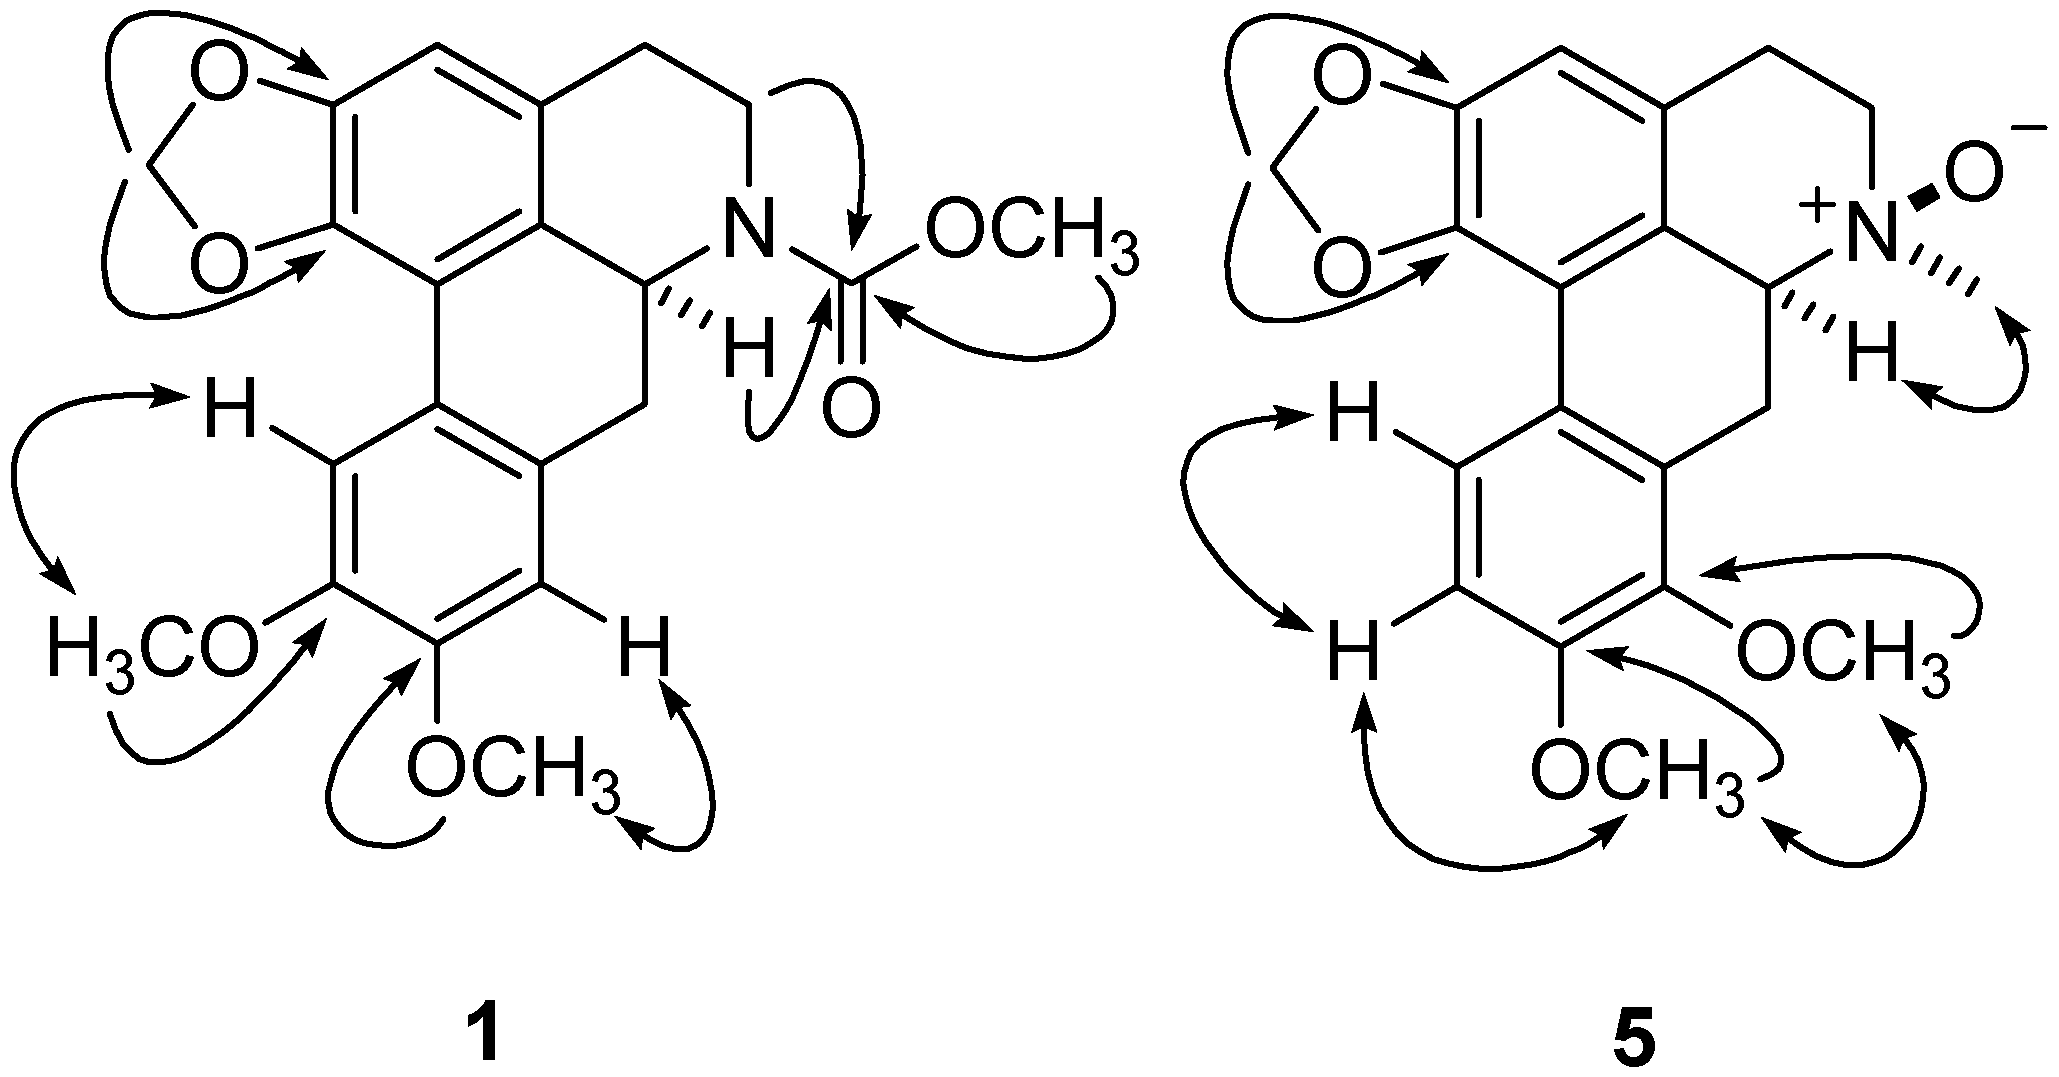
 ) and 1H-1H COSY (
  ) correlations of compounds 1 and 5.
 = +258.7 [17], the stereochemistry of 2 was expected to be the same. Accordingly, the structure of 2 was established as (+)-N-(methoxycarbonyl)-N-norpredicentrine. = +77.8 indicated stereochemistry of C-6a was determined to be S [19] Thus, Compound 3 was elucidated as (+)-N-(methoxycarbonyl)-N-norbulbodione.
| No. | δ 1H (Hz) | δ 13C | |||||||||
|---|---|---|---|---|---|---|---|---|---|---|---|
| 1 | 2 | 3 | 4 | 5 | 1 | 2 | 3 | 4 | 5 | ||
| 1 | - | - | - | - | - | 142.8 | 144.8 | 141.7 | 143.8 | 142.7 | |
| 1a | - | - | - | - | - | 127.8 | 128.5 | 127.0 | 127.1 | 121.4 | |
| 1b | - | - | - | - | - | 129.9 | 131.6 | 116.0 | 116.1 | 122.1 | |
| 2 | - | - | - | - | - | 146.8 | 150.5 | 145.5 | 151.9 | 146.6 | |
| 3 | 6.86 (s) | 6.56 (s) | 6.88 (s) | 6.63 (s) | 6.69 (s) | 107.5 | 115.3 | 107.3 | 111.0 | 109.6 | |
| 3a | - | - | - | - | - | 125.2 | 125.2 | 127.1 | 127.2 | 121.9 | |
| 4 | 2.59, 2.84 (m) | 2.52, 2.72 (m) | 2.63, 2.88 (m) | 2.62, 2.86 (m) | 2.73, 3.53 (m) | 30.1 | 30.8 | 30.2 | 30.4 | 25.4 | |
| 5 | 2.98, 4.42 (m) | 2.87, 4.25 (m) | 2.99, 4.43 (m) | 3.00, 4.44 (m) | 3.57, 3.71 (m) | 38.9 | 40.3 | 35.6 | 35.6 | 65.6 | |
| 6a | 4.70 (dd, 13.8, 3.8) | 4.55 (dd, 13.8, 4.0) | - | - | 4.40 (dd, 13.8, 3.8) | 51.6 | 53.2 | 139.9 | 140.0 | 72.5 | |
| 7 | 2.74, 2.84 (m) | 2.62, 2.75 (m) | 6.91 (s) | 6.96 (s) | 3.06, 3.18 (m) | 34.9 | 35.4 | 98.2 | 98.3 | 30.2 | |
| 7a | - | - | - | - | - | 124.0 | 124.1 | 136.5 | 136.5 | 124.8 | |
| 8 | 6.78 (s) | 6.80 (s) | - | - | - | 109.9 | 111.2 | 186.4 | 186.6 | 142.1 | |
| 9 | - | - | 5.92 (s) | 5.94 (s) | - | 147.2 | 147.3 | 105.0 | 105.2 | 146.2 | |
| 10 | - | - | - | - | 7.02 (d, 9.2) | 148.0 | 148.2 | 163.8 | 163.9 | 109.6 | |
| 11 | 8.16 (s) | 8.16 (s) | - | - | 8.66 (d, 9.2) | 111.5 | 111.5 | 178.3 | 178.5 | 117.4 | |
| 11a | - | - | - | - | - | 129.6 | 129.9 | 117.9 | 118.1 | 128.5 | |
| 1-OCH3 | - | 3.56 (s) | - | 3.65 (s) | - | - | 60.1 | - | 59.8 | - | |
| 2-OCH3 | - | - | - | 3.90 (s) | - | - | - | - | 55.7 | - | |
| 8-OCH3 | - | - | - | - | 4.00 (s) | - | - | - | - | 60.7 | |
| 9-OCH3 | 3.90 (s) | 3.91 (s) | - | - | 3.98 (s) | 55.8 | 55.8 | - | - | 56.2 | |
| 10-OCH3 | 3.93 (s) | 3.93 (s) | 3.85 (s) | 3.88 (s) | - | 55.9 | 56.0 | 56.4 | 56.6 | - | |
| OCH2O | 6.18 (s) | - | 6.20 (s) | - | 6.20 (s) | 101.1 | - | 101.3 | 101.4 | ||
| CO2CH3 | - | - | - | - | - | 157.2 | 157.6 | 156.2 | 156.0 | - | |
| CO2CH3 | 3.69 (s) | 3.72 (s) | 3.71 (s) | 3.70 (s) | - | 52.8 | 53.2 | 52.9 | 52.6 | - | |
| N-CH3 | - | - | - | - | 3.35 (s) | - | - | - | - | 58.0 | |
= +87.3) [19]. Thus, the structure of 4 was assigned the name (+)-N-(methoxycarbonyl)-N-norisocorydione. = +88.2) of 5 indicated an S configuration of C-6a [17], compared with the R configuration of that in (−)-isoboldine β-N-oxide (  = −90.3) [20]. Furthermore, the key NOE correlations of N-CH3 with H-6 indicated the β-N-oxide in 5 (Figure 2). Thus, compound 5 was determined to be (+)-8-methoxyisolaurenine N-oxide.
| Compound | S.aureus | M. tuberculosis | G. pulicaris | A. alternata | C. nicotianae | P. capsici. | G. amomi |
|---|---|---|---|---|---|---|---|
| 1 | 20/0.68 | - | - | 19/0.64 | 18/0.80 | - | - |
| 2 | 22/0.79 | - | - | 20/0.74 | 17/1.04 | - | - |
| 3 | 16.53 | - | - | - | - | - | - |
| 4 | 17.62 | - | - | - | - | - | - |
| 5 | - | - | - | 15.35 | - | - | - |
| 6 | 17/2.14 | - | - | 19/1.41 | 16/1.70 | - | - |
| Rifampicin | 25/0.003 | 22/0.003 | - | - | - | - | - |
| Nystatin | - | - | 20/0.008 | 17/0.007 | 21/0.006 | 18/0.061 | 19/0.010 |
| Compound | Cell lines | |||||
|---|---|---|---|---|---|---|
| BGC-823 | HepG2 | MCF-7 | SGC-7901 | SK-MEL-2 | SK-OV-3 | |
| 1 | 31.87 | 28.09 | 30.13 | 29.49 | 29.70 | 29.45 |
| 2 | 30.08 | 30.48 | 29.68 | 30.88 | 27.09 | 30.10 |
| 3 | 10.38 | 9.54 | 11.65 | 10.34 | 11.44 | 12.22 |
| 4 | 9.83 | 10.38 | 10.81 | 11.86 | 10.59 | 11.96 |
| 5 | 83.22 | 86.62 | 78.23 | 76.87 | 85.03 | 92.97 |
| 6 | 31.51 | 33.78 | 30.72 | 28.94 | 33.12 | 31.84 |
| Doxorubicin | 0.02 | 0.01 | 0.06 | 0.05 | 0.03 | 0.01 |
3. Experimental
3.1. General
3.2. Plant Material
3.3. Extraction and Isolation
= +96.13 (c = 0.19, MeOH). UV (CDCl3) λmax(logε) 303 (4.12), 284 (3.90), 216 (3.89) nm. IR (KBr)νmax 3030, 1705, 1665, 1452, 1255 cm−1. 1H-NMR (CDCl3, 600 MHz) and 13C-NMR (CDCl3, 125 MHz) data see Table 1. EI-MS m/z: 383 ([M]+). HR-ESI-MS (pos.) m/z: 406.1263 ([M+Na]+, C21H21NO6Na. calc. 406.1267). = +258.7 (c = 0.16, MeOH). UV (CDCl3) λmax(logε) 304 (3.73), 283 (4.20), 216 (3.99) nm. IR (KBr)νmax 3430, 1670, 1600, 1525, 1208 cm−1. 1H-NMR (CDCl3, 600 MHz) and 13C-NMR (CDCl3, 125 MHz) data see Table 1. EI-MS m/z: 385 ([M]+). HR-ESI-MS (pos.) m/z: calc. 408.1422 ([M+Na]+, C21H23NO6Na. calc. 408.1423). = +77.8 (c = 0.21, MeOH). UV (CDCl3) λmax(log ε) 304 (4.11), 284 (3.81), 217 (4.11) nm. IR (KBr)νmax 3028, 1707, 1654, 1455, 1251 cm−1. 1H-NMR (CDCl3, 600 MHz) and 13C-NMR (CDCl3, 125 MHz) data see Table 1. EI-MS m/z: 381 ([M]+). HR-ESI-MS (pos.) m/z: 404.0743 ([M+Na]+, C20H15NO7Na. calc. 404.0746). = +87.3 (c = 0.16, MeOH). UV (CDCl3) λmax(logε) 305 (4.25), 283 (3.86), 215 (3.98) nm. IR (KBr)νmax 3025, 1710, 1510, 1454, 1245 cm−1. 1H-NMR (CDCl3, 600 MHz) and 13C-NMR (CDCl3, 125 MHz) data see Table 1. EI-MS m/z: 397 ([M]+). HR-ESI-MS (pos.) m/z: 420.1055 ([M+Na]+, C21H19NO7Na. calc. 420.1059). = +88.2 (c = 0.20, MeOH). UV (CDCl3) λmax(log ε) 304 (3.69), 284 (3.77), 217 (4.07) nm. IR (KBr)νmax 3030, 1568, 1213, 1075, 1025 cm−1. 1H-NMR (CDCl3, 600 MHz) and 13C-NMR (CDCl3, 125 MHz) data see Table 1. EI-MS: 355 ([M]+). HR-ESI-MS (pos.) m/z: 378.1315 ([M+Na]+, C20H21NO5Na. calc. 378.1317).3.4. Antimicrobial Activity Bioassay
3.5. Cytotoxicity Assay in Vitro
4. Conclusions
References
- Liu, T.T.; Yang, T.S. Antimicrobial impact of the components of essential oil of Litsea cubeba from Taiwan and antimicrobial activity of the oil in food systems. Int. J. Food Microbiol. 2012, 156, 68–75. [Google Scholar] [CrossRef]
- Huang, C.H.; Huang, W.J.; Wang, S.J.; Wu, P.H.; Wu, W.B. Litebamine, a phenanthrene alkaloid from the wood of Litsea cubeba, inhibits rat smooth muscle cell adhesion and migration on collagen. Eur. J. Pharmacol. 2008, 596, 25–31. [Google Scholar] [CrossRef]
- Wang, Y.; Jiang, Z.T.; Li, R. Complexation and molecular microcapsules of Litsea cubeba essential oil with β-cyclodextrin and its derivatives. Eur. Food Res. Technol. 2009, 228, 865–873. [Google Scholar] [CrossRef]
- Luo, M.; Jiang, L.K.; Zou, G.L. Acute and genetic toxicity of essential oil extracted from Litsea cubeba (Lour.) Pers. J. Food Prot. 2005, 68, 581–588. [Google Scholar]
- Hwang, J.K.; Choi, E.M.; Lee, J.H. Antioxidant activity of Litsea cubeba. Fitoterapia 2005, 76, 684–686. [Google Scholar] [CrossRef]
- Wang, H.; Liu, Y. Chemical composition and antibacterial activity of essential oils from different parts of Litsea cubeba. Chem. Biodivers. 2010, 7, 229–235. [Google Scholar] [CrossRef]
- Chen, W.Y.; Ko, F.N.; Wu, Y.C.; Lu, S.T.; Teng, C.M. Vasorelaxing effect in rat thoracic aorta caused by laurotetanine isolated from Litsea cubeba Persoon. J. Pharm. Pharmacol. 1994, 46, 380–382. [Google Scholar]
- Yang, Y.; Jiang, J.; Qimei, L.; Yan, X.; Zhao, J.; Yuan, H.; Qin, Z.; Wang, M. The fungicidal terpenoids and essential oil from Litsea cubeba in Tibet. Molecules 2010, 15, 7075–7082. [Google Scholar] [CrossRef]
- Jiang, Z.; Akhtar, Y.; Bradbury, R.; Zhang, X.; Isman, M.B. Comparative toxicity of essential oils of Litsea pungens and Litsea cubeba and blends of their major constituents against the cabbage looper, Trichoplusia ni. J. Agric. Food Chem. 2009, 57, 4833–4837. [Google Scholar] [CrossRef]
- Wu, Y.C.; Liou, J.Y.; Duh, C.Y.; Lee, S.S.; Lu, S.T. Litebamine, a novel phenanthrene alkaloid from Litsea cubeba. Tetrahedron Lett. 1991, 32, 4169–4170. [Google Scholar]
- Lee, S.S.; Lin, Y.J.; Chen, C.K.; Liu, K.C.S.; Chen, C.H. Quaternary Alkaloids from Litsea cubeba and Cryptocarya konishii. J. Nat. Prod. 1993, 56, 1971–1976. [Google Scholar] [CrossRef]
- Lee, S.S.; Chen, C.K.; Huang, F.M.; Chen, C.H. Two Dibenzopyrrocoline Alkaloids from Litsea cubeba. J. Nat. Prod. 1996, 59, 80–82. [Google Scholar] [CrossRef]
- Chiou, C.M.; Kang, J.J.; Lee, S.S. Litebamine N-homologues: Preparation and antiacetylcholinesterase activity. J. Nat. Prod. 1998, 61, 46–50. [Google Scholar] [CrossRef]
- Teng, C.M.; Hsueh, C.M.; Chang, Y.L.; Ko, F.N.; Lee, S.S.; Liu, K.C. Antiplatelet effects of some aporphine and phenanthrene alkaloids in rabbits and man. J. Pharm. Pharmacol. 1997, 49, 706–711. [Google Scholar]
- Tantisewie, B.; Pharadai, T.; Pandhuganont, M.; Guinaudeau, H.; Freyer, A.J.; Shamma, M. (+)-N-Formylnornantenine, a new aporphine alkaloid from Cyclea atjehensis. J. Nat. Prod. 1989, 52, 652–654. [Google Scholar] [CrossRef]
- Chen, Y.Y.; Chang, F.R.; Wu, Y.C. Isoquinoline alkaloids and lignans from Rollinia mucosa. J. Nat. Prod. 1996, 59, 904–906. [Google Scholar] [CrossRef]
- Montgomery, C.T.; Freyer, A.J.; Guinaudeau, H. (+)-N-Methyllaurotetanine-β-N-oxide from Glossocalyx brevipes. J. Nat. Prod. 1985, 48, 833–834. [Google Scholar] [CrossRef]
- Lee, S.S.; Chen, C.K.; Chen, I.S.; Chen, C.H. Chemical Constituents from Dehaasia triandra. 1. Three New Alkaloids, Isocorydione, Norisocorydione, and Dehatriphine, from the Leaves. J. Nat. Prod. 1996, 59, 55–58. [Google Scholar] [CrossRef]
- Espine-Ingroff, A.; White, T.; Pfaller, M.A. Manual of Clinical Microbiology, 7th ed; American Society for Microbiology: Washington, DC, USA, 1999; pp. 1640–1652. [Google Scholar]
- Lin, F.W.; Wu, P.L.; Wu, T.S. Alkaloids from the leaves of Cryptocarya chinensis hemsl. Chem. Pharm. Bull. 2001, 49, 1292–1294. [Google Scholar] [CrossRef]
- Jirapast, S.; Serm, S.; Pongpun, S.; Suttira, K.; Jonkolnee, J.A.; Santi, T.P. Two new cytotoxic isomeric indole alkaloids from the roots of Nauclea orientalis. Fitoterapia 2010, 81, 830–833. [Google Scholar] [CrossRef]
- Zhang, Y.; Wang, J.; Wei, D.; Wang, X.; Luo, J.; Kong, L. Cytotoxic tirucallane C26 triterpenoids from the stem barks of Aphanamixis grandifolia. Phytochemistry 2010, 71, 2199–2204. [Google Scholar] [CrossRef]
- Sample Availability: Samples of the compounds 1–6 are available from the authors.
© 2012 by the authors; licensee MDPI, Basel, Switzerland. This article is an open-access article distributed under the terms and conditions of the Creative Commons Attribution license (http://creativecommons.org/licenses/by/3.0/).
Share and Cite
Zhang, W.; Hu, J.-F.; Lv, W.-W.; Zhao, Q.-C.; Shi, G.-B. Antibacterial, Antifungal and Cytotoxic Isoquinoline Alkaloids from Litsea cubeba. Molecules 2012, 17, 12950-12960. https://doi.org/10.3390/molecules171112950
Zhang W, Hu J-F, Lv W-W, Zhao Q-C, Shi G-B. Antibacterial, Antifungal and Cytotoxic Isoquinoline Alkaloids from Litsea cubeba. Molecules. 2012; 17(11):12950-12960. https://doi.org/10.3390/molecules171112950
Chicago/Turabian StyleZhang, Wei, Jin-Feng Hu, Wen-Wen Lv, Qing-Chun Zhao, and Guo-Bing Shi. 2012. "Antibacterial, Antifungal and Cytotoxic Isoquinoline Alkaloids from Litsea cubeba" Molecules 17, no. 11: 12950-12960. https://doi.org/10.3390/molecules171112950
APA StyleZhang, W., Hu, J.-F., Lv, W.-W., Zhao, Q.-C., & Shi, G.-B. (2012). Antibacterial, Antifungal and Cytotoxic Isoquinoline Alkaloids from Litsea cubeba. Molecules, 17(11), 12950-12960. https://doi.org/10.3390/molecules171112950