Antioxidant Capacities and Total Phenolic Contents Increase with Gamma Irradiation in Two Types of Malaysian Honey

Abstract
:1. Introduction
2. Results and Discussion
2.1. Ferric reducing/antioxidant power (FRAP) assay

| Concentration (g/mL) | Honey Dissolved in Distilled water | ||||||
|---|---|---|---|---|---|---|---|
| NNI | NI | GNI | GI | ||||
| 0.1 | 105.64 ± 2.03 a,c | 200.74 ± 2.51 b,c | 210.08 ± 2.68 a,d | 283.24 ± 8.44 b,d | |||
| 0.2 | 179.19 ± 5.19 a,c | 354.07 ± 9.36 b,c | 367.37 ± 13.1 a,d | 571.13 ± 1.64 b,d | |||
| 0.3 | 255.37 ± 4.56 a,c | 513.40 ± 8.32 b,c | 526.80 ± 12.0 a,d | 909.27 ± 16.8 b,d | |||
| 0.4 | 311.4 ± 7.97 a,c | 660.20 ± 68.5 b,c | 689.37 ± 23.6 a,d | 1108.9 ± 28.5 b,d | |||
| Concentration (g/mL) | Honey Dissolved in Methanol | ||||||
| NNI | NI | GNI | GI | ||||
| 0.1 | 79.07 ± 0.81 a,c | 182.93 ± 6.05 b,c | 188.97 ± 5.44 a,d | 270.70 ± 13.8 b,d | |||
| 0.2 | 147.83 ± 0.60 a,c | 309.60 ± 15.8 b,c | 310.72 ± 11.6 a,d | 587.60 ± 40.7 b,d | |||
| 0.3 | 242.50 ± 5.68 a,c | 458.70 ± 22.7 b,c | 508.77 ± 39.0 a,d | 868.03 ± 14.5 b,d | |||
| 0.4 | 283.30 ± 21.9 a,c | 546.50 ± 34.6 b,c | 618.30 ± 26.1 a,d | 1091.6 ± 44.9 b,d | |||
2.2. The free radical-scavenging activity
| Concentration (g/mL) | Honey dissolved in distilled water | |||
|---|---|---|---|---|
| NNI | NI | GNI | GI | |
| 0.1 | 3.69 ± 0.07 a,c | 18.00 ± 0.21 b,c | 31.46 ± 0.36 a,d,e | 54.60 ± 1.82 b,d,e |
| 0.2 | 6.24 ± 3.25 a,c | 28.63 ± 5.98 b,c | 53.58 ± 1.57 a,d,e | 73.13 ± 1.08 b,d,e |
| 0.3 | 9.07 ± 1.25 a,c,e | 35.71 ± 0.37 b,c | 69.39 ± 0.74 a,d,e | 77.93 ± 0.49 b,d,e |
| 0.4 | 28.67 ± 0.95 a,c,e | 52.79 ± 0.82 b,c | 76.29 ± 0.58 a,d,e | 82.68 ± 0.80 b,d,e |
| Concentration (g/mL) | Honey dissolved in methanol | |||
| NNI | NI | GNI | GI | |
| 0.1 | 1.66 ± 1.12 a,c | 16.61 ± 1.85 b,c | 24.37 ± 3.98 a,d,f | 51.51 ± 0.42 b,d,f |
| 0.2 | 3.75 ± 1.26 a,c | 25.96 ± 4.98 b,c | 42.61 ± 2.40 a,d,f | 64.44 ± 0.14 b,d,f |
| 0.3 | 5.11 ± 1.86 a,c,f | 33.97 ± 1.31 b,c | 62.33 ± 4.15 a,d,f | 68.52 ± 1.77 b,d,f |
| 0.4 | 17.74 ± 1.33 a,c,f | 51.04 ± 0.22 b,c | 68.22 ± 0.94 a,d,f | 79.26 ± 0.14 b,d,f |
2.3. Total Flavonoid contents (TFC)
| Concentration (g/mL) | NNI | NI | GNI | GI |
|---|---|---|---|---|
| 0.1 | 1.23 ± 0.19 a | 1.96 ± 0.11 b,c | 1.47 ± 0.03 a | 2.93 ± 0.13 b,d |
| 0.2 | 1.86 ± 0.39 a,c | 2.89 ± 0.16 b,c | 3.38 ± 0.02 a,d | 5.05 ± 0.08 b,d |
| 0.3 | 3.79 ± 0.10 a,c | 4.23 ± 0.02 b,c | 4.24 ± 0.05 a,d | 5.68 ± 0.14 b,d |
| 0.4 | 4.52 ± 0.01 c | 4.79 ± 0.15 c | 4.94 ± 0.26 a,d | 6.92 ± 0.81 b,d |
2.4. Total phenolic contents (TPC)
| Concentration (g/mL) | Honey Dissolved in Distilled water | |||
|---|---|---|---|---|
| NNI | NI | GNI | GI | |
| 0.1 | 3.62 ± 0.18 a,c | 9.66 ± 0.32 b,c | 8.47 ± 0.20 a,d | 18.78 ± 1.60 b,d |
| 0.2 | 9.17 ± 1.00 a,c | 19.86 ± 0.90 b,c,e | 21.09 ± 0.37 a,d,e | 42.40 ± 0.34 b,d |
| 0.3 | 15.42 ± 0.35 a,c | 28.62 ± 1.27 b,c | 30.32 ± 0.77 a,d | 56.59 ± 1.24 b,d,e |
| 0.4 | 21.60 ± 0.45 a,c | 38.91 ± 1.64 b,c | 41.76 ± 0.84 a,d,e | 72.64 ± 0.89 b,d |
| Concentration (g/mL) | Honey Dissolved in Methanol | |||
| NNI | NI | GNI | GI | |
| 0.1 | 3.43 ± 0.31 a,c | 10.0 ± 0.91 b,c | 9.44 ± 1.69 a,d | 19.72 ± 1.44 b,d |
| 0.2 | 8.65 ± 1.17 a,c | 18.11 ± 1.06 b,c,f | 22.67 ± 0.59 a,d,f | 41.80 ± 1.38 b,d |
| 0.3 | 15.26 ± 0.18 a,c | 29.13 ± 0.11 b,c | 29.39 ± 0.49 a,d | 51.79 ± 0.24 b,d,f |
| 0.4 | 21.33 ± 1.40 a,c | 37.98 ± 0.10 b,c | 35.99 ± 1.03 a,d,f | 71.51 ± 1.32 b,d |
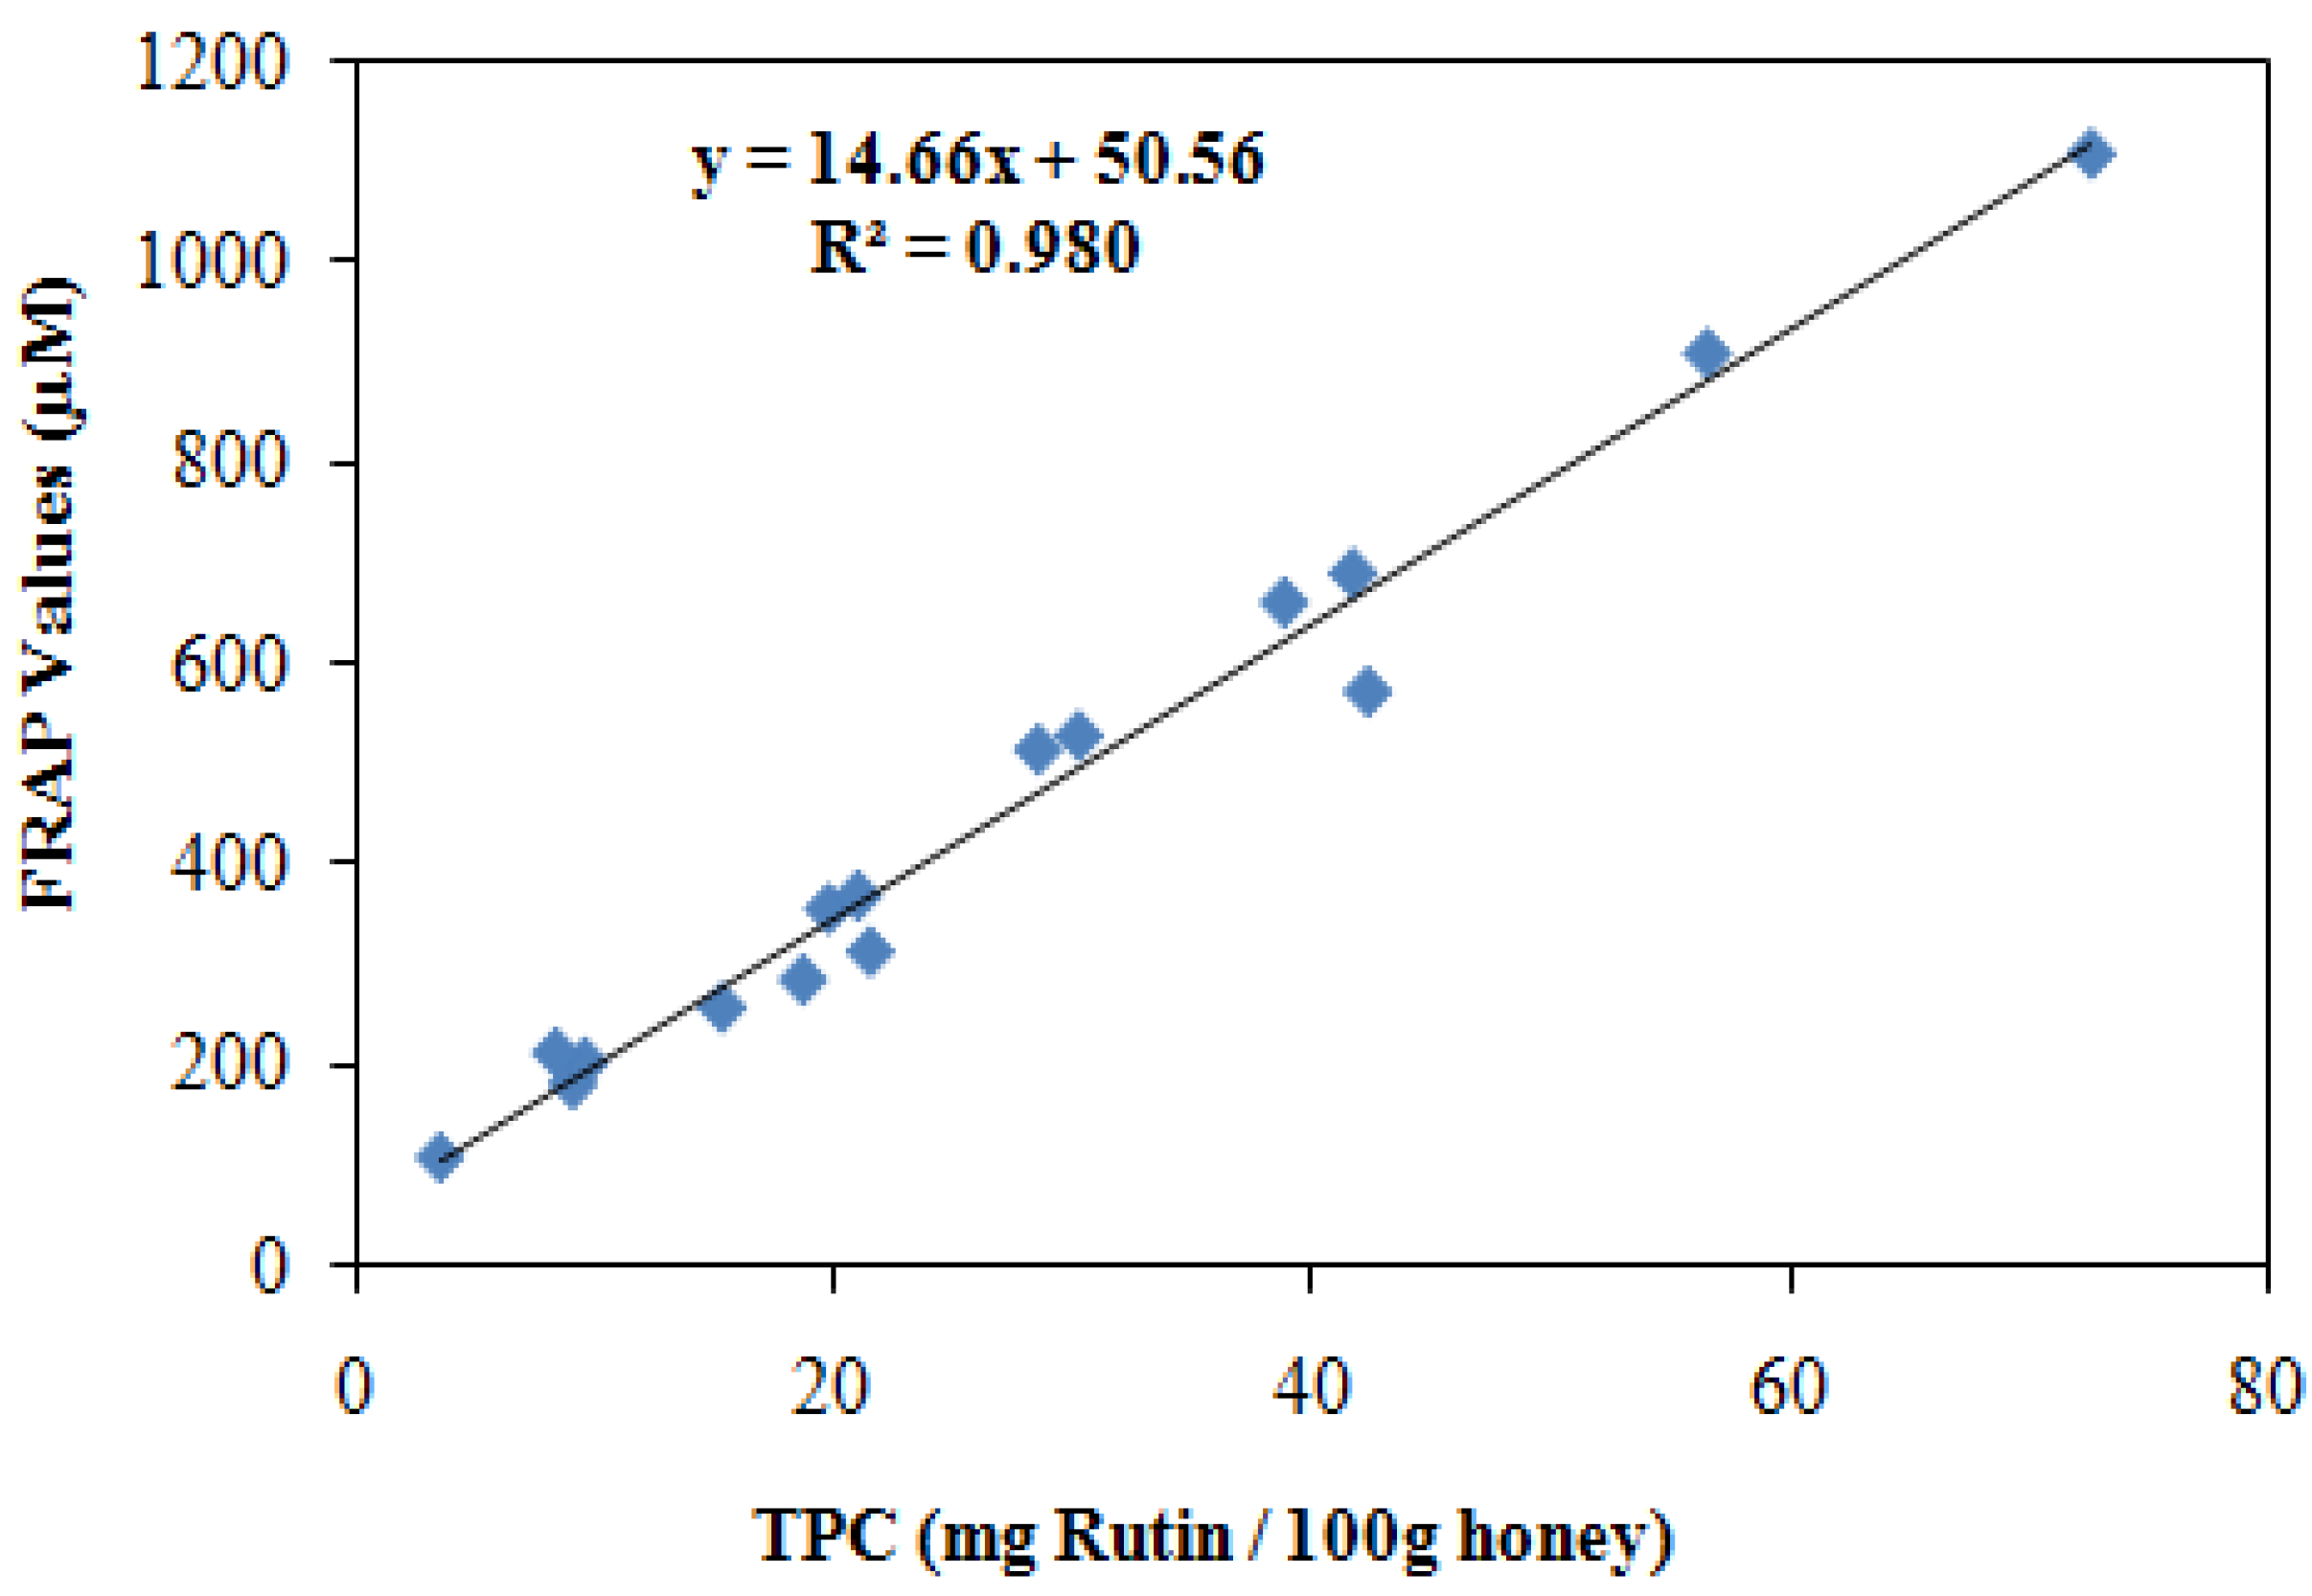
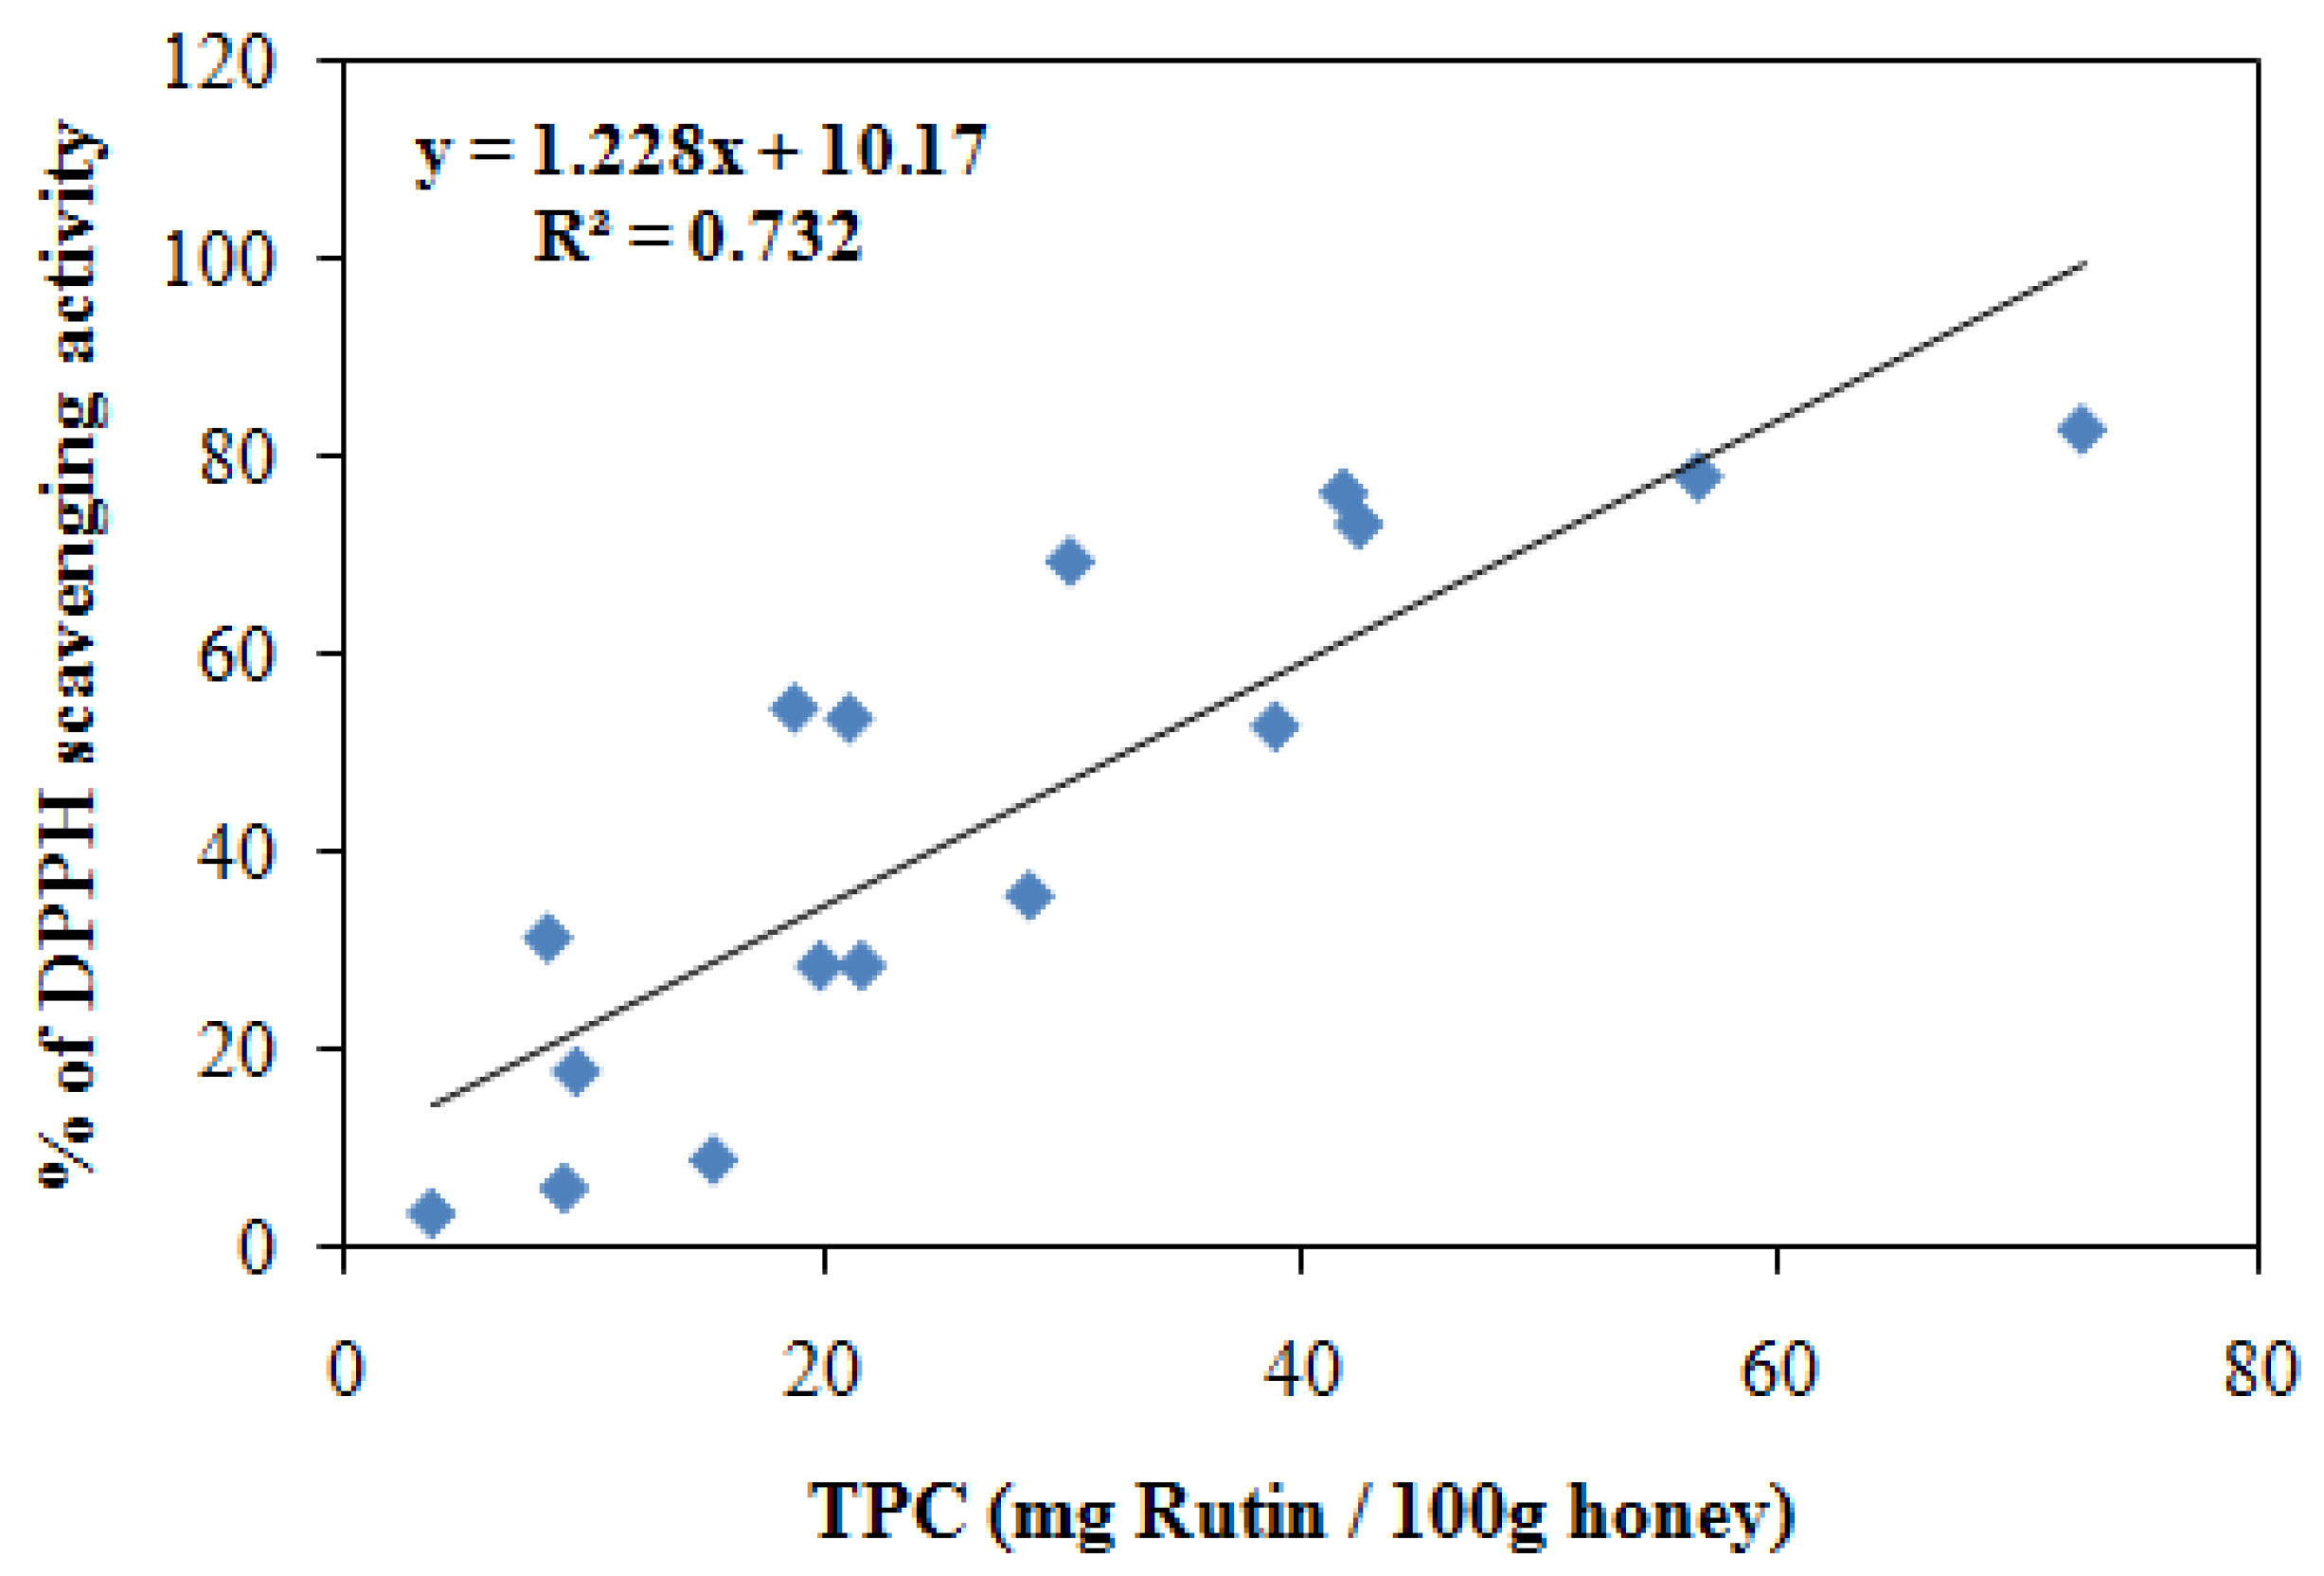
2.5. Correlation between Total phenolic contents (TPC) and antioxidant activities
| Honey sources | Honey types | Antioxidant activity by FRAP assay (µM FeII) | Radical scavenging activity by DPPH (% inhibition) | Total phenolic contents (mg/100 g honey) | Total flavonoid contents (mg/100 g honey) |
|---|---|---|---|---|---|
| Croatian monofloral honey (Piljac-Zegarac et al., 2009) [41] | Jerusalem thorn | 113.49 ± 2.91 | - | 48.58 ± 0.95 | - |
| Sunflower | 113.81 ± 9.72 | - | 54.63 ± 1.20 | - | |
| Sage | 121.27 ± 4.70 | - | 55.40 ± 1.14 | - | |
| Velebit winter | 118.57 ± 4.54 | - | 44.43 ± 2.83 | - | |
| Winter savory | 99.68 ± 3.99 | - | 44.17 ± 2.24 | - | |
| Amorpha | 23.02 ± 2.79 | - | 25.66 ± 0.99 | - | |
| Chestnut | 84.60 ± 2.62 | - | 43.09 ± 2.68 | - | |
| Linden | 73.81 ± 6.75 | - | 40.88 ± 1.05 | - | |
| Acasia | 12.06 ± 1.98 | - | 21.61 ± 0.63 | - | |
| Oilseed rape | 52.22 ± 6.14 | - | 36.92 ± 2.53 | - | |
| Goldenrod | 92.86 ± 1.65 | - | 49.24 ± 2.02 | - | |
| Northeast Portugal honey (Ferreira et al., 2009) [6] | Light | - | - | 22.61 ± 0.02 | 12.36 ± 0.01 |
| Amber | - | - | 40.62 ± 1.72 | 34.27 ± 0.17 | |
| Dark | - | - | 72.77 ± 0.02 | 58.74 ± 0.04 | |
| Commercial Indian honey (Saxena et al., 2010) [32] | I | - | 64 ± 0.7 | 98 ± 1.2 | - |
| II | - | 59 ± 0.5 | 47 ± 0.2 | - | |
| III | - | 61 ± 0.9 | 83 ± 1.1 | - | |
| IV | - | 44 ± 0.6 | 67 ± 0.8 | - | |
| V | - | 67 ± 1.1 | 91 ± 1.4 | - | |
| VI | - | 71 ± 1.3 | 94 ± 0.8 | - | |
| VII | - | 48 ± 0.8 | 99 ± 1.3 | - | |
| Malaysian Honey (Mohamed et al., 2010); Saba et al., 2010) [30,49] | Tualang | 322.7 ± 1.7 | 41.3 ± 0.78 | 25.17 ± 0.79 | - |
| Gelam GNI (0.4 g/mL) | 689.37 ± 23.6 | 76.29 ± 0.58 | 41.76 ± 0.84 | 2.64 ± 0.12 | |
| Nenas NNI (0.4 g/mL) | 311.4 ± 7.97 | 28.67 ± 0.95 | 21.60 ± 0.45 | 1.97 ± 0.21 |
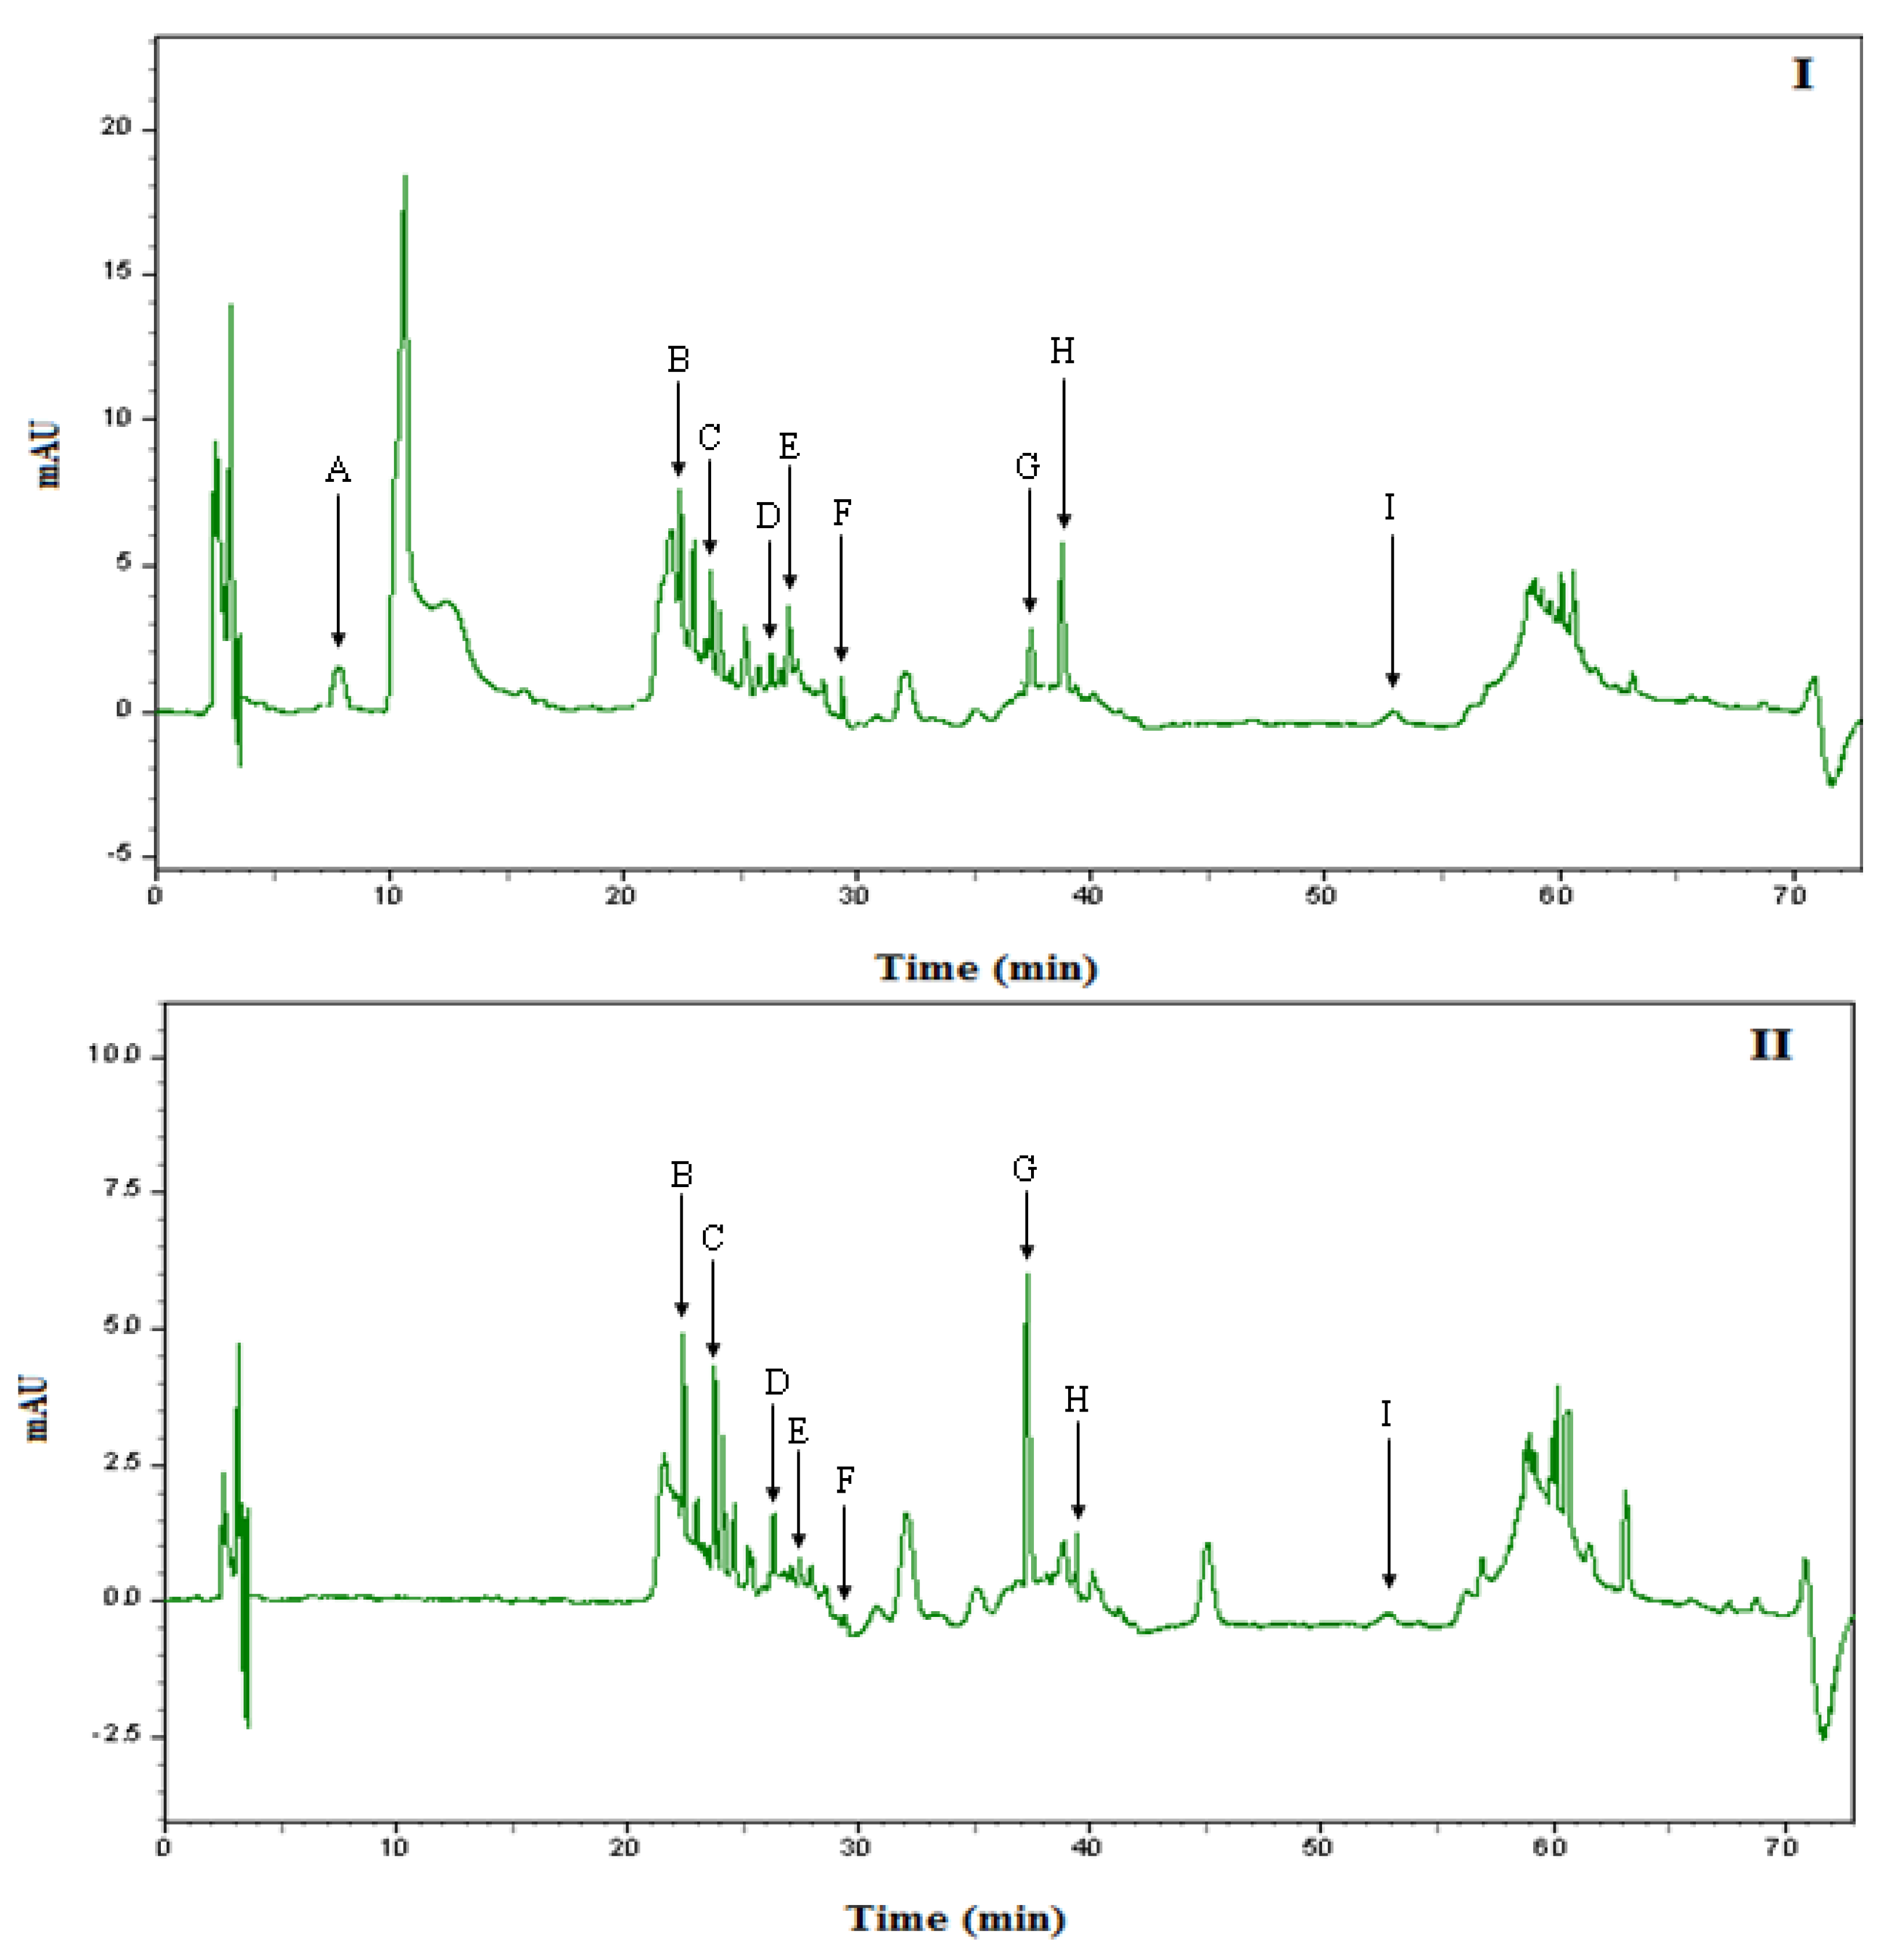
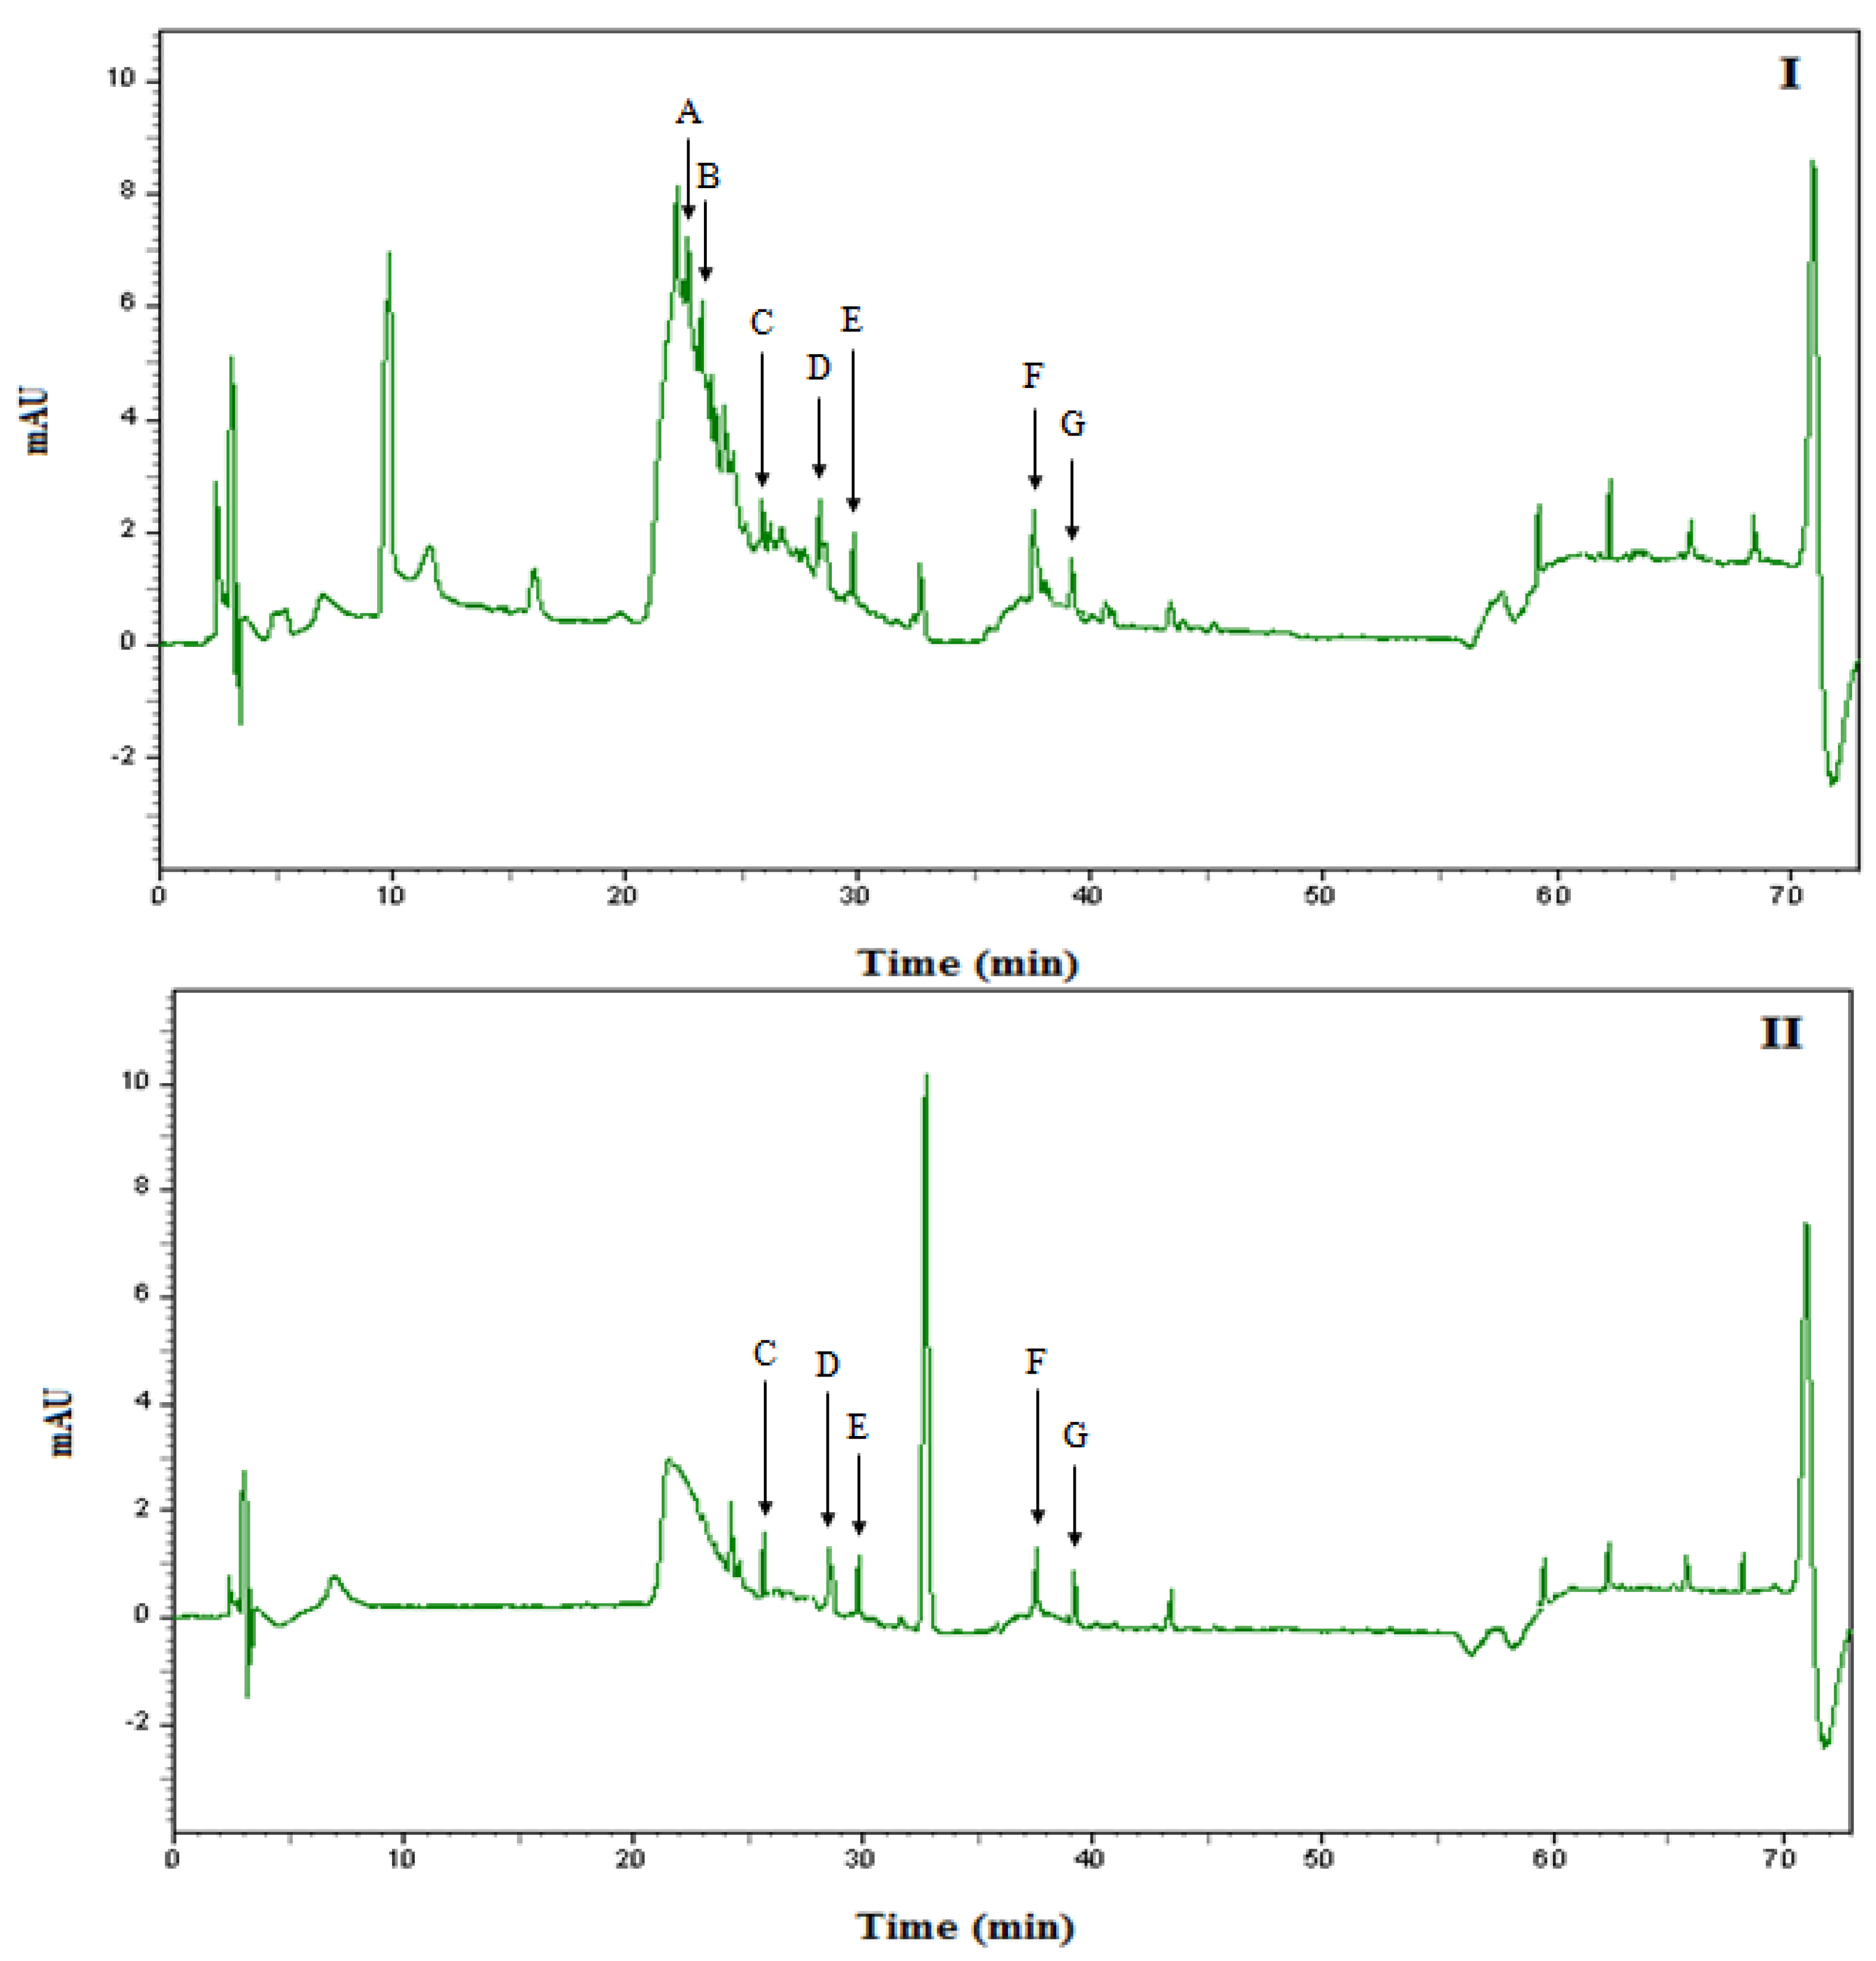
2.6. Identification and quantification of phenolic compounds in Malaysian honey by HPLC

| Phenolic Compounds | NNI | NI | ||
|---|---|---|---|---|
| Retention time (min) | µg/100 g honey at 290/340 nm | Retention time (min) | µg/100 g honey at 290/340 nm | |
| Gallic acid | ND | ND | ND | ND |
| Chlorogenic acid | 22.69 | 392.92 ± 42.22 | 22.69 | 433.73 ± 48.17 |
| Caffeic acid | 23.65 | 255.84 ± 11.83 | 23.66 | 278.26 ± 30.42 |
| P- Coumaric caid | 26.16 | 267.49 ± 13.99 | 26.18 | 312.10 ± 45.79 |
| Ferulic caid | ND | ND | ND | ND |
| Rutin | 28.52 | 1542.1 ± 60.21 | 28.50 | 1597.5 ± 125.37 |
| Ellagic acid | 29.73 | 306.33 ± 15.41 | 29.71 | 339.61 ± 44.41 |
| Quercetin | 37.75 | 1621.9 ± 91.11 | 37.76 | 1700.9 ± 93.97 |
| Hesperetin | 39.13 | 1493.9 ± 51.73 | 39.20 | 1536.6 ± 76.38 |
| Chrysin | ND | ND | ND | ND |
| Phenolic Compounds | GNI | GI | ||
| Retention time (min) | µg/100 g honey at 290/340 nm | Retention time (min) | µg/100 g honey at 290/340 nm | |
| Gallic acid | 7.86 | 859.43 ± 15.14 | 7.56 | 876.80 ± 7.47 |
| Chlorogenic acid | 22.40 | 502.77 ± 27.98 | 22.40 | 528.08 ± 6.31 |
| Caffeic acid | 23.73 | 428.84 ± 41.14 | 23.77 | 442.01 ± 32.70 |
| P- Coumaric caid | 26.19 | 301.45 ± 7.06 | 26.20 | 308.31 ± 18.69 |
| Ferulic caid | 26.91 | 356.93 ± 21.99 | 26.85 | 381.37 ± 17.07 |
| Rutin | ND | ND | ND | ND |
| Ellagic acid | 29.48 | 558.78 ± 36.68 | 29.50 | 575.67 ± 17.66 |
| Quercetin | 37.50 | 1588.9 ± 31.51 | 37.35 | 1594.30 ± 38.40 |
| Hesperetin | 39.20 | 1475.2 ± 5.40 | 39.21 | 1477.78 ± 1.91 |
| Chrysin | 53.22 | 1498.6 ± 3.50 | 53.31 | 1504.6 ± 3.20 |
3. Experimental
3.1. Chemicals and instruments
3.2. Honey samples
3.3. Gamma irradiation
3.4. Ferric reducing / antioxidant power (FRAP) assay
3.5. The free radical-scavenging activity
3.6. Total Flavonoid contents (TFC)
3.7. Total phenolic contents (TPC)
3.8. Extraction of phenolic compounds from honey by solid phase extraction (SPE)
3.9. HPLC analysis
3.10. Statistical analysis
4. Conclusions
Acknowledgments
Conflict of Interest
References
- Pyrzynska, K.; Biesaga, M. Analysis of phenolic acids and flavonoids in honey. Trac-Trend. Anal. Chem. 2009, 28, 893–902. [Google Scholar] [CrossRef]
- Mobarok, A.M.; Al Swayeh, O.A. Honey potentiates the gastric protection effects of sucralfate against ammonia-induced gastric lesions in rats. Saudi J. Gastroenterol. 2003, 9, 117–123. [Google Scholar]
- Subrahmanyam, M.; Sahapure, A.G.; Nagane, N.S.; Bhagwat, V.R.; Ganu, J.V. Effects of topical application of honey on burn wound healing. Ann. Burns Fire Dis. 2001, XIV, 1–3. [Google Scholar]
- Kucuk, M.; Kolayli, S.; Karaoglu, S.; Ulusoy, E.; Baltaci, C.; Candan, F. Biological activities and chemical composition of three honeys of different types from Anatolia. Food Chem. 2007, 100, 526–534. [Google Scholar] [CrossRef]
- Gomez-Caravaca, M.; Gomez-Romero, M.; Arraez-Roman, D.; Segua-Carretero, A.; Fernandez-Gutierrez, A. Advances in the analysis of phenolic compounds in products derived from bees. J. Pharmaceut. BioMed. 2006, 41, 1220–1234. [Google Scholar]
- Ferreira, I.; Aires, E.; Barreira, J.; Estevinho, L. Antioxidant activity of Portuguese honey sample: Different contributions of the entire honey and phenolic extract. Food Chem. 2009, 114, 1438–1443. [Google Scholar] [CrossRef]
- Ames, B.N.; Shigenaga, M.K.; Hagen, T.M. Oxidants, antioxidants, and the degenerative diseases of aging. Proc. Natl. Acad. Sci. USA 1993, 90, 7915–7922. [Google Scholar]
- Jennifer, S.M.; Michael, B.R. Oxidative stress, chronic disease and muscle wasting. Muscle Nerve 2007, 35, 411–429. [Google Scholar] [CrossRef]
- Al-Mamary, M.; Al-Meeri, A.; Al-Habori, M. Antioxidant activities and total phenolics of different types of honey. Nutr.Res. 2002, 22, 1041–1047. [Google Scholar] [CrossRef]
- Aljadi, A.M.; Kamaruddin, M.Y. Evaluation of the phenolic contents and antioxidant capacities of two Malaysian floral honeys. Food Chem. 2004, 85, 513–518. [Google Scholar] [CrossRef]
- The National honey Board. Honey-Health and Therapeutic Qualities; The National Honey Board: Logmont, CO, USA, 2003. Available online: http://www.nhb.org/.
- Bogdanov, S.; Jurendic, T.; Sieber, R.; Gallmann, P. Honey for Nutrition and health: A Review. J. Am. Coll. Nutr. 2008, 27, 677–689. [Google Scholar]
- Lachman, J.; Orsak, M.; Hejtmankova, A.; Kovarova, E. Evaluation of antioxidant activity and total phenolics of selected Czech honeys. LWT-Food Sci. Technol. 2010, 43, 52–58. [Google Scholar] [CrossRef]
- Migdal, W.; Owczarczyk, H.B.; Kedzia, B.; Holderna-Kedzia, E.; Madajczyk, D. Microbiological decontamination of natural honey by irradiation. Radiat.Phys. Chem. 2007, 57, 285–288. [Google Scholar]
- Finola, M.S.; Lasagno, M.C.; Marioli, J.M. Microbiological and chemical characterization of honeys from central Argentina. Food Chem. 2007, 100, 1649–1653. [Google Scholar] [CrossRef]
- Farkas, J. Irradiation as a method for decontaminating food: A review. Int. J. Food Microbiol. 1998, 44, 189–204. [Google Scholar] [CrossRef]
- IAEA,International Atomic Energy Agency, Irradiation of Spices, Herbs and Other Vegetables Seasoning. A Compilation of Technical Data for Its Authorization and Control; IAEA: Vienna, Austria, 1992; IAEA-TECDOC-639.
- Molan, P.C.; Allen, K.L. The effect of gamma-irradiation on the antibacterial activity of honey. J. Pharm. Pharmacol. 1996, 48, 1206–1209. [Google Scholar]
- Benzie, I.F.F.; Strain, J.J. The ferric reducing ability of plasma (FRAP) as a measure of “antioxidant Power”: The FRAP assay. Anal. Biochem. 1996, 239, 70–76. [Google Scholar]
- Benzie, I.F.F.; Strain, J.J. Ferric reducing/antioxidant power assay: Direct measure of total antioxidant activity of biological fluids and modified version for simultaneous measurement of total antioxidant power and ascorbic acid concentration. Method Enzymol. 1999, 299, 15–27. [Google Scholar]
- Gordon, M.H. The mechanism of antioxidant action in vitro. In Food Antioxidants; Hudson, B.J.F., Ed.; Elsevier Applied Science: London, UK, 1990; pp. 1–18. [Google Scholar]
- Duh, P.D.; Du, P.C.; Yen, G.C. Action of methanolic extract of mung bean hulls as inhibitors of lipid peroxidation and non-lipid oxidative damage. Food Chem. Toxicol. 1999, 37, 1055–1061. [Google Scholar] [CrossRef]
- Huda-Faujan, N.; Noriham, A.; Norrakiah, A.S.; Babji, A.S. Antioxidant activities of water extracts of some Malaysian herbs. ASEAN Food J. 2007, 14, 61–68. [Google Scholar]
- Postmes, T.; Van den, A.E.; Hazen, M. Honey foe wounds, ulcers and skin graft preservation. Lancet 1993, 341, 756–757. [Google Scholar]
- Song, H.P.; Kim, D.H.; Jo, C.; Lee, C.H.; Kim, K.S.; Byun, M.W. Effect of gamma irradiation on the microbiological quality and antioxidant activity of fresh vegetable juice. Food Microbiol. 2006, 23, 372–378. [Google Scholar]
- Stajner, D.; Milosevic, M.; Popovic, B.M. Irradiation effect on phenolic content, lipid and protein oxidation and scavenger ability of Soybean seeds. Int. J. Mol. Sci. 2007, 8, 618–627. [Google Scholar] [CrossRef]
- Khattak, K.F.; Simpson, T.J.; Ihasnullah. Effect of gamma irradiation on the extraction yield, total phenolic content and free radical-scavenging activity of Nigella Staiva seed. Food Chem. 2008, 110, 967–972. [Google Scholar] [CrossRef]
- Abu Bakar, M.F.; Mohamed, M.; Rahmat, A.; Fry, J. Phytochemicals and antioxidant activity of different parts of bambangan (Mangifera pajang) and tarap (Artocarpus odoratissimus). Food Chem. 2009, 113, 479–483. [Google Scholar] [CrossRef]
- Meda, A.; Lamien, C.E.; Romito, M.; Millogo, J.; Nacoulma, O.G. Determination of the total phenolic, flavonoid and proline contents in Burkina Fasan honey, as well as their radical scavenging activity. Food Chem. 2005, 91, 571–577. [Google Scholar] [CrossRef]
- Mohamed, M.; Sirajudeen, K.N.S.; Swamy, M.; Yaacob, N.S.; Sulaiman, S.A. Studies on the antioxidant properties of Tualang honey of Malaysia. Afr. J. Tradit. Complem. 2010, 7, 59–63. [Google Scholar]
- Sangsrichan, S.; Wanson, W. The antioxidant capacity of honey samples collected in the north part of Thailand in relationship with its total polyphenol. KMITL Sci. J. 2008, 8, 1–6. [Google Scholar]
- Saxena, S.; Gautam, S.; Sharma, A. Physical, biochemical and antioxidant properties of some Indian honeys. Food Chem. 2010, 118, 391–397. [Google Scholar] [CrossRef]
- Silici, S.; Sagdic, O.; Ekici, L. Total phenolic content, antiradical, antioxidant and antimicrobial activities of Rhododendron honeys. Food Chem. 2010, 121, 238–243. [Google Scholar] [CrossRef]
- Socha, R.; Juszczak, L.; Pietrzyk, S.; Fortuna, T. Antioxidant activity and phenolic composition of herbhoneys. Food Chem. 2009, 113, 568–574. [Google Scholar] [CrossRef]
- Jo, C.; Son, J.H.; Lee, H.J.; Byun, M.W. Irradiation application for color removal and purification of green tea leaves extract. Radiat.Phys. Chem. 2003, 66, 179–184. [Google Scholar]
- Khattak, K.F.; Simpson, T.J. Effect of gamma irradiation on the antimicrobial and free radical scavenging activities of Glycyrrhiza glabra root. Radiat.Phys. Chem. 2010, 79, 507–512. [Google Scholar]
- Lampart-Szczapa, E.; Korczak, J.; Nogala-Kalucka, M.; Zawirska-Wojtasiak, R. Antioxidant properties of lupin seed products. Food Chem. 2003, 83, 279–285. [Google Scholar] [CrossRef]
- Alvarez-Suarez, J.; Tulipani, S.; Diaz, D.; Estevez, Y.; Romandini, S.; Giampieri, F.; Damiani, E.; Astolfi, P.; Bompadre, S.; Battino, M. Antioxidant and antimicrobial capacity of several monofloral Cuban honeys and their correlation with color, polyphenol content and other chemical compounds. Food Chem. Toxicol. 2010, 48, 2490–2499. [Google Scholar] [CrossRef]
- Hertog, M.G.; Hollman, P.C.; Van de Putte, B. Content of potentially anticarcinogenic flavonoids of tea infusions, wines and fruits juices. J. Agr. Food Chem. 1993, 41, 1242–1246. [Google Scholar] [CrossRef]
- Yao, L.H.; Jiang, Y.M.; Shi, J.; Tomas-Barberan, F.A.; Datta, N.; Singanusong, R.; Chen, S.S. Flavonoids in food and their health benefits. Plant Food Hum.Nutr. 2004, 59, 113–122. [Google Scholar]
- Piljac-Zegarac, J.; Stipcevic, T.; Belscak, A. Antioxidant properties and phenolic content of different floral origin honeys. J. Apiproduct Apimedical Sci. 2009, 1, 43–50. [Google Scholar] [CrossRef]
- Breitfellner, F.; Solar, S.; Sontag, G. Effect of gamma irradiation on phenolic acids in strawberries. J.Food Sci. 2002, 67, 517–521. [Google Scholar] [CrossRef]
- Harrison, K.; Were, L.M. Effect of gamma irradiation on total phenolic content yield and antioxidant capacity of Almond skin extracts. Food Chem. 2007, 102, 932–937. [Google Scholar] [CrossRef]
- Variyar, P.S.; Bandyopadhyay, C.; Thomas, P. Effect of γ-irradiation on the phenolic acid of some Indian spices. Int. J. Food Sci. Tech. 1998, 33, 533–537. [Google Scholar] [CrossRef]
- Kim, J.H.; Shin, M.H.; Hwang, Y.J.; Srinivasan, P.; Kim, J.K.; Park, H.J.; Byun, M.W.; Lee, J.W. Role of gamma irradiation on the natural antioxidants in Cumin seeds. Radiat.Phys. Chem. 2009, 78, 153–157. [Google Scholar]
- Ahn, H.J.; Kim, J.H.; Kim, J.K.; Kim, D.H.; Yook, H.S.; Byun, M.W. Combined effects of irradiation and modified atmosphere packing on minimally processed Chinese cabbage (Brassica rapa L). Food Chem. 2005, 89, 589–597. [Google Scholar] [CrossRef]
- Baltrusaityte, V.; Venskutonis, P.R.; Ceksteryte, V. Radical scavenging activity of differential floral origin honey and beebread phenolic extracts. Food Chem. 2007, 101, 502–514. [Google Scholar] [CrossRef]
- Turkmen, N.; Sari, F.; Poyrazoglu, E.S.; Velioglu, Y.S. Effects of prolonged heating on antioxidant activity and colour of honey. Food Chem. 2006, 95, 653–657. [Google Scholar] [CrossRef]
- Saba, Z.H.; Suzana, M.; Norwahidah, A.K.; Yasmin Anum, M.Y. The antioxidant capacities and total phenolic contents of two Malaysian honey, Gelam and Nenas. 6th Malaysia Indonisia Brunei Medical Sciences Conference ‘Research for Better health”. University Brunei Barussalam: Brunei, Sudan, 21-23 July 2010; p. 64. [Google Scholar]
- Aljadi, A.M.; Kamaruddin, M.Y. Isolation and Identification of phenolic acids in Malaysian honey with antibacterial properties. Turk. J. Med. Sci. 2003, 33, 229–236. [Google Scholar]
- Kassim, M.; Achoui, M.; Mansor, M.; Yusoff, K.M. The inhibitory effect of Gelam honey and its extracts on nitric oxide and prostaglandin E2 in inflammatory tissues. Fitoterapia 2010, 81, 1196–1201. [Google Scholar] [CrossRef]
- Lee, J.W.; Kim, J.K.; Srinivasan, P.; Choi, J.; Kim, J.H.; Han, S.B.; Kim, D.J.; Byun, M.W. Effect of gamma irradiation on microbial analysis, antioxidant activity, sugar content and color of ready-to-use tamarind juice during storage. LWT-Food Sci. Technol. 2009, 42, 101–105. [Google Scholar] [CrossRef]
- Koseki, P.M.; Villavicencio, A.L.C.H.; Brito, M.S.; Nahme, L.C.; Sebastiao, K.I.; Rela, P.R.; Almeida-Muradian, L.B.; Mancini-Filho, J.; Freitas, P.C.D. Effects of irradiation in medicinal and eatable herbs. Radiat. Phys. Chem. 2002, 63, 681–684. [Google Scholar]
- Fan, X.; Mastovska, K. Effectiveness of ionizing radiation in reducing furan and acrylamide levels in foods. J. Agr. Food Chem. 2006, 54, 8266–8270. [Google Scholar] [CrossRef]
- Djeridane, A.; Yousfi, M.; Nadjemi, B.; Boutassouna, D.; Stocker, P.; Vidal, N. Antioxidant activity of some Algerian medicinal plants extracts containing phenolic compounds. Food Chem. 2006, 97, 654–660. [Google Scholar] [CrossRef]
- Velioglu, Y.S.; Mazza, G.; Gao, L.; Oomah, B.D. Antioxidant activity and total phenolics in selected fruits, vegetables and grain products. J. Agr. Food Chem. 1998, 46, 4113–4117. [Google Scholar] [CrossRef]
- Martos, I.; Cossentini, M.; Ferreres, F.; Tomas-Barberan, F.A. Flavonoid composition of Tunisian honeys and propolis. J. Agr. Food Chem. 1997, 45, 2824–2829. [Google Scholar]
- Sample Availability: Samples of the compounds are available from the authors.
© 2011 by the authors; licensee MDPI, Basel, Switzerland. This article is an open access article distributed under the terms and conditions of the Creative Commons Attribution license ( http://creativecommons.org/licenses/by/3.0/).
Share and Cite
Hussein, S.Z.; Yusoff, K.M.; Makpol, S.; Yusof, Y.A.M. Antioxidant Capacities and Total Phenolic Contents Increase with Gamma Irradiation in Two Types of Malaysian Honey. Molecules 2011, 16, 6378-6395. https://doi.org/10.3390/molecules16086378
Hussein SZ, Yusoff KM, Makpol S, Yusof YAM. Antioxidant Capacities and Total Phenolic Contents Increase with Gamma Irradiation in Two Types of Malaysian Honey. Molecules. 2011; 16(8):6378-6395. https://doi.org/10.3390/molecules16086378
Chicago/Turabian StyleHussein, Saba Zuhair, Kamaruddin Mohd Yusoff, Suzana Makpol, and Yasmin Anum Mohd Yusof. 2011. "Antioxidant Capacities and Total Phenolic Contents Increase with Gamma Irradiation in Two Types of Malaysian Honey" Molecules 16, no. 8: 6378-6395. https://doi.org/10.3390/molecules16086378
APA StyleHussein, S. Z., Yusoff, K. M., Makpol, S., & Yusof, Y. A. M. (2011). Antioxidant Capacities and Total Phenolic Contents Increase with Gamma Irradiation in Two Types of Malaysian Honey. Molecules, 16(8), 6378-6395. https://doi.org/10.3390/molecules16086378