Preparation, Spectrochemical, and Computational Analysis of L-Carnosine (2-[(3-Aminopropanoyl)amino]-3-(1H-imidazol-5-yl)propanoic Acid) and Its Ruthenium (II) Coordination Complexes in Aqueous Solution

Abstract
:1. Introduction
2. Results and Discussion
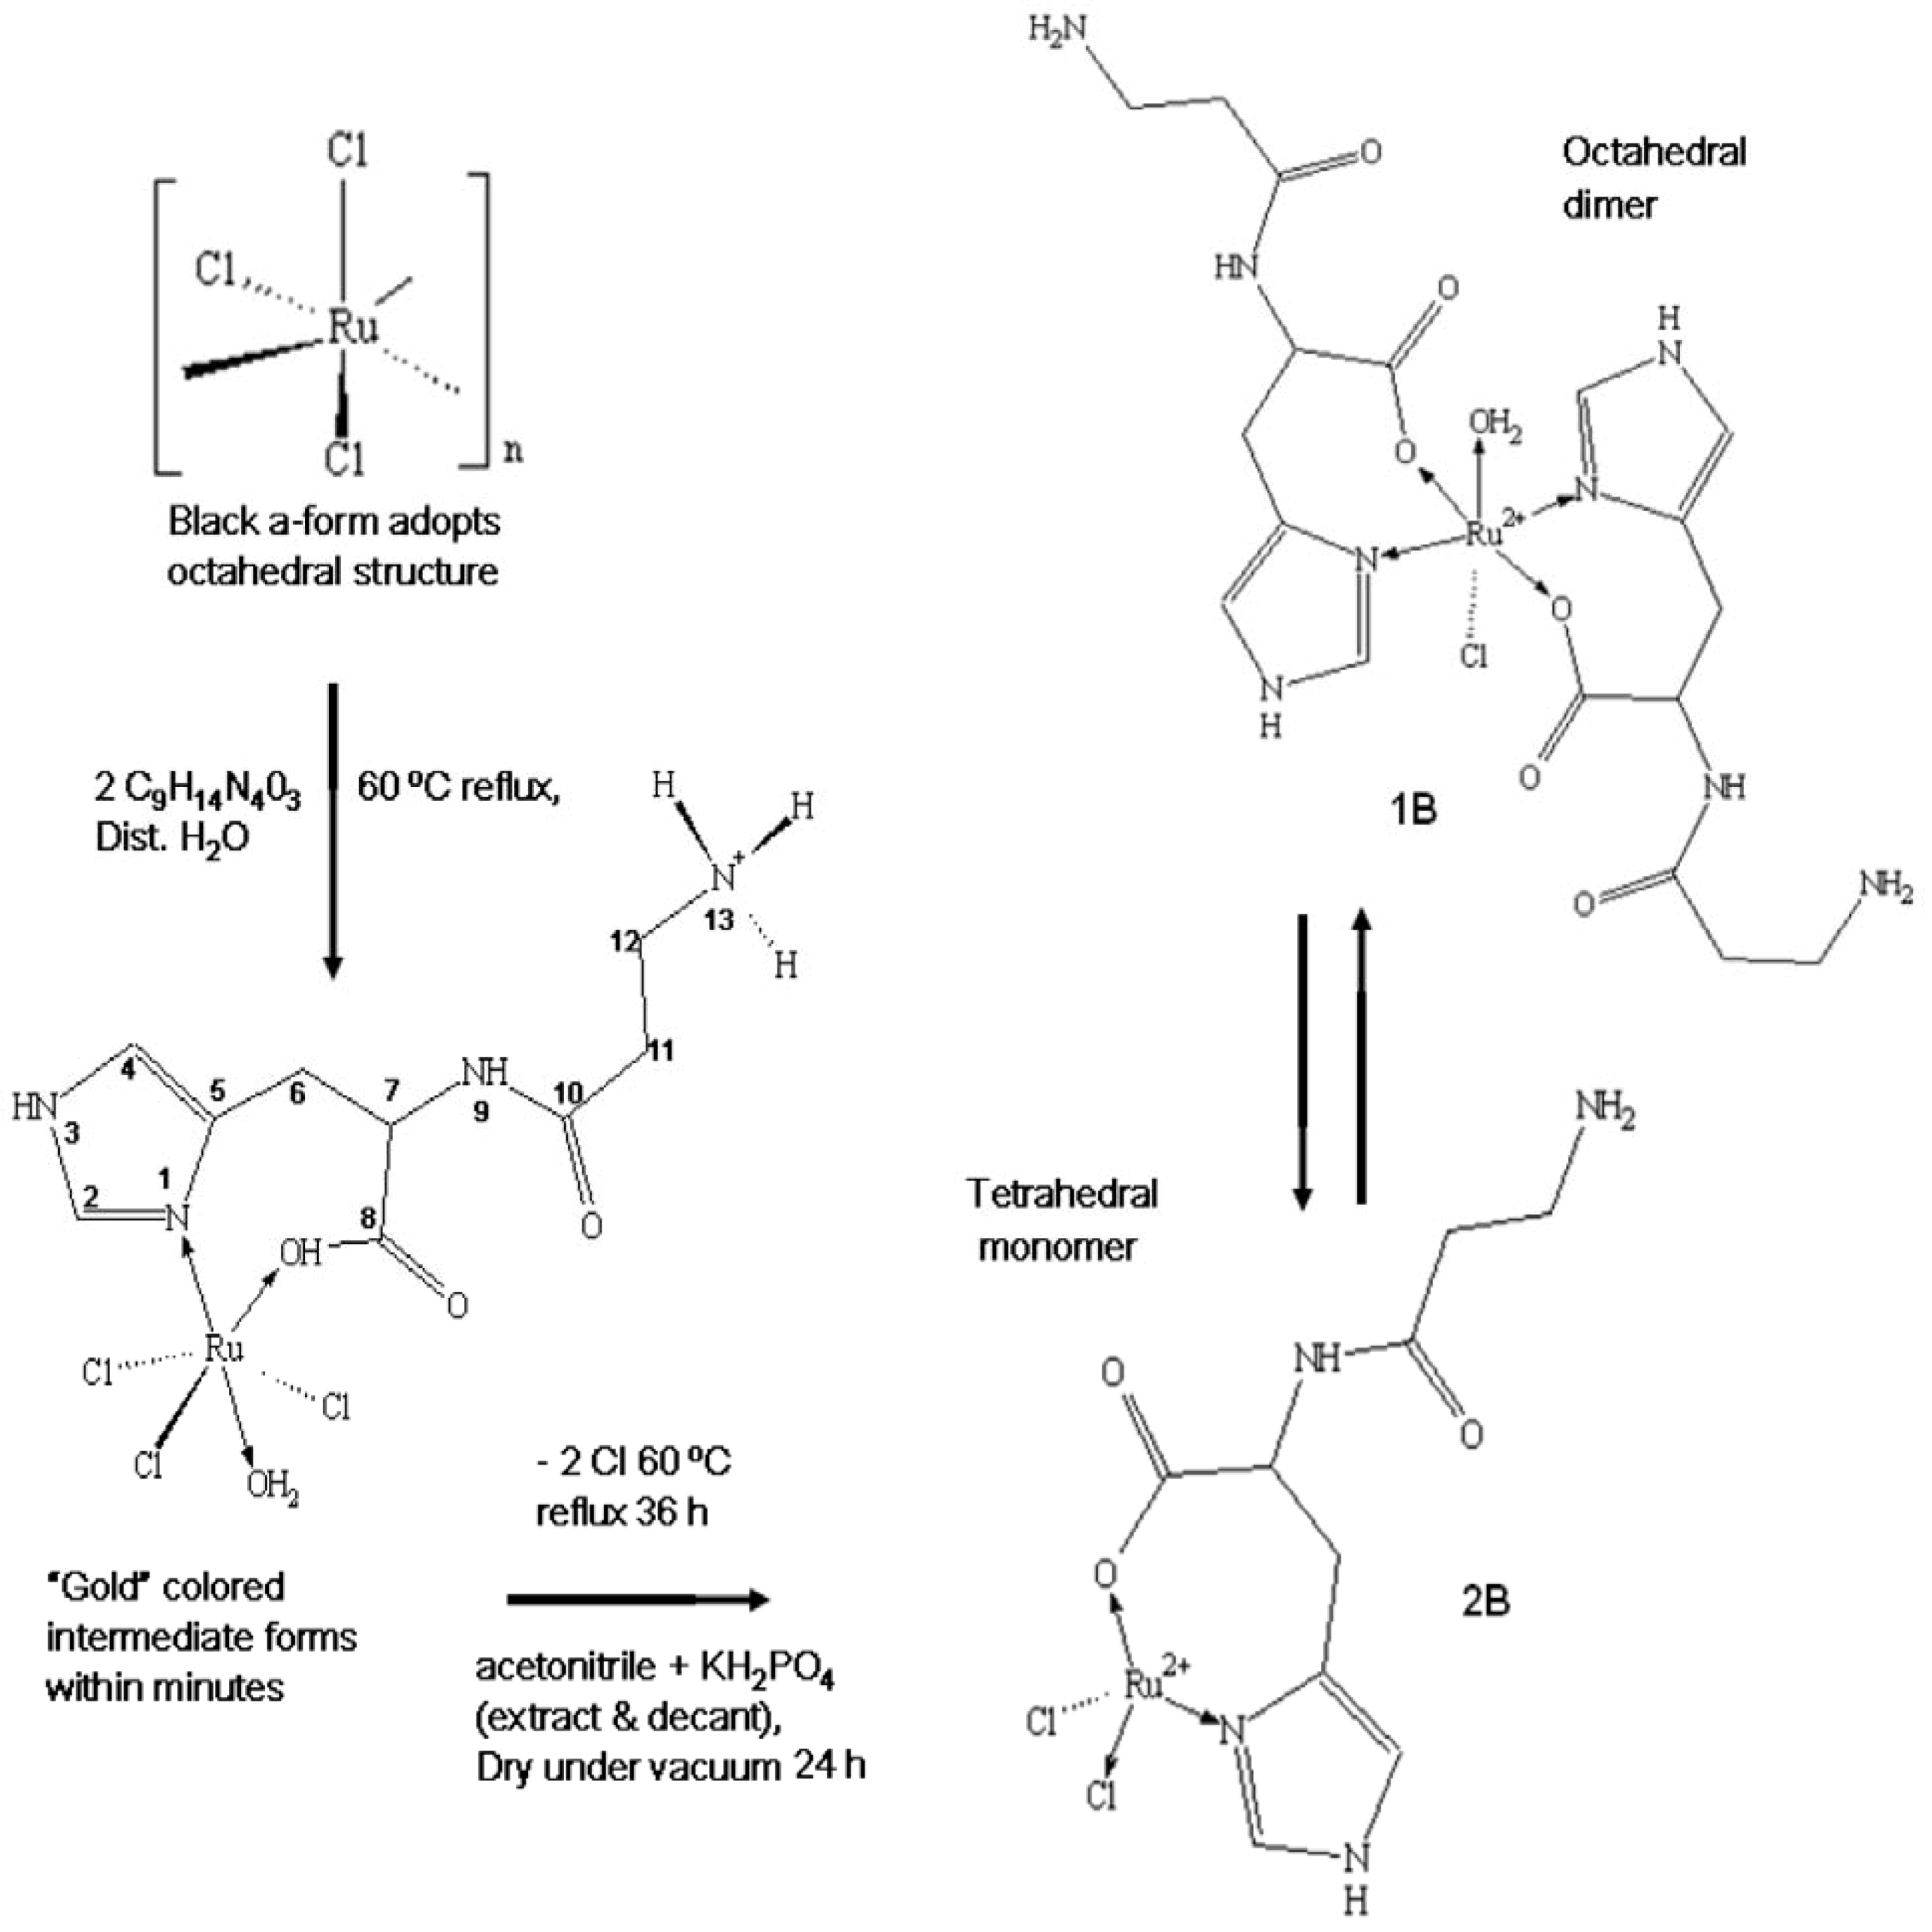
2.1. Preparation of the Complexes

| Physical Characteristics | ||||||
|---|---|---|---|---|---|---|
| Compound | Color | Yield | m.p. | Solubility | ||
| ligand | white | 303–323 °C | Insoluble org., soluble aqueous | |||
| Complex 1B | reddish-brown | 41.7% | 313 °C | Insoluble org., soluble aqueous | ||
| Complex 2B | reddish-brown | 41.7% | 313 °C | Insoluble org., soluble aqueous | ||
| Elemental Analysis | ||||||
| Carbon (%) | Nitrogen (%) | Oxygen (%) | Ruthenium (%) | |||
| 47.78 | 24.77 | 21.22 | 0 | |||
| 27.08 | 14.03 | 12.02 | 25.32 | |||
| 35.62 | 18.46 | 18.45 | 16.65 | |||
| Mean Atomic Ratio (s.d.) | ||||||
| Compound | Carbon:Ru | Oxygen:Ru | Nitrogen:Ru | |||
| Ru-complex | 18.5(3.8) | 6.3(0.52) | 19.1(1.1) | |||
| Probable Coordination number [RuLxClH2O] = Mean atomic ratio/atoms per ligand | ||||||
| Ru-complex | 18.5(3.8)/9 = x = 2.1 | 6.3(0.52)/3 = x = 2.2 | 19.1(1.1)/4 = x = 4.8 | |||

2.2. Physical Characterization
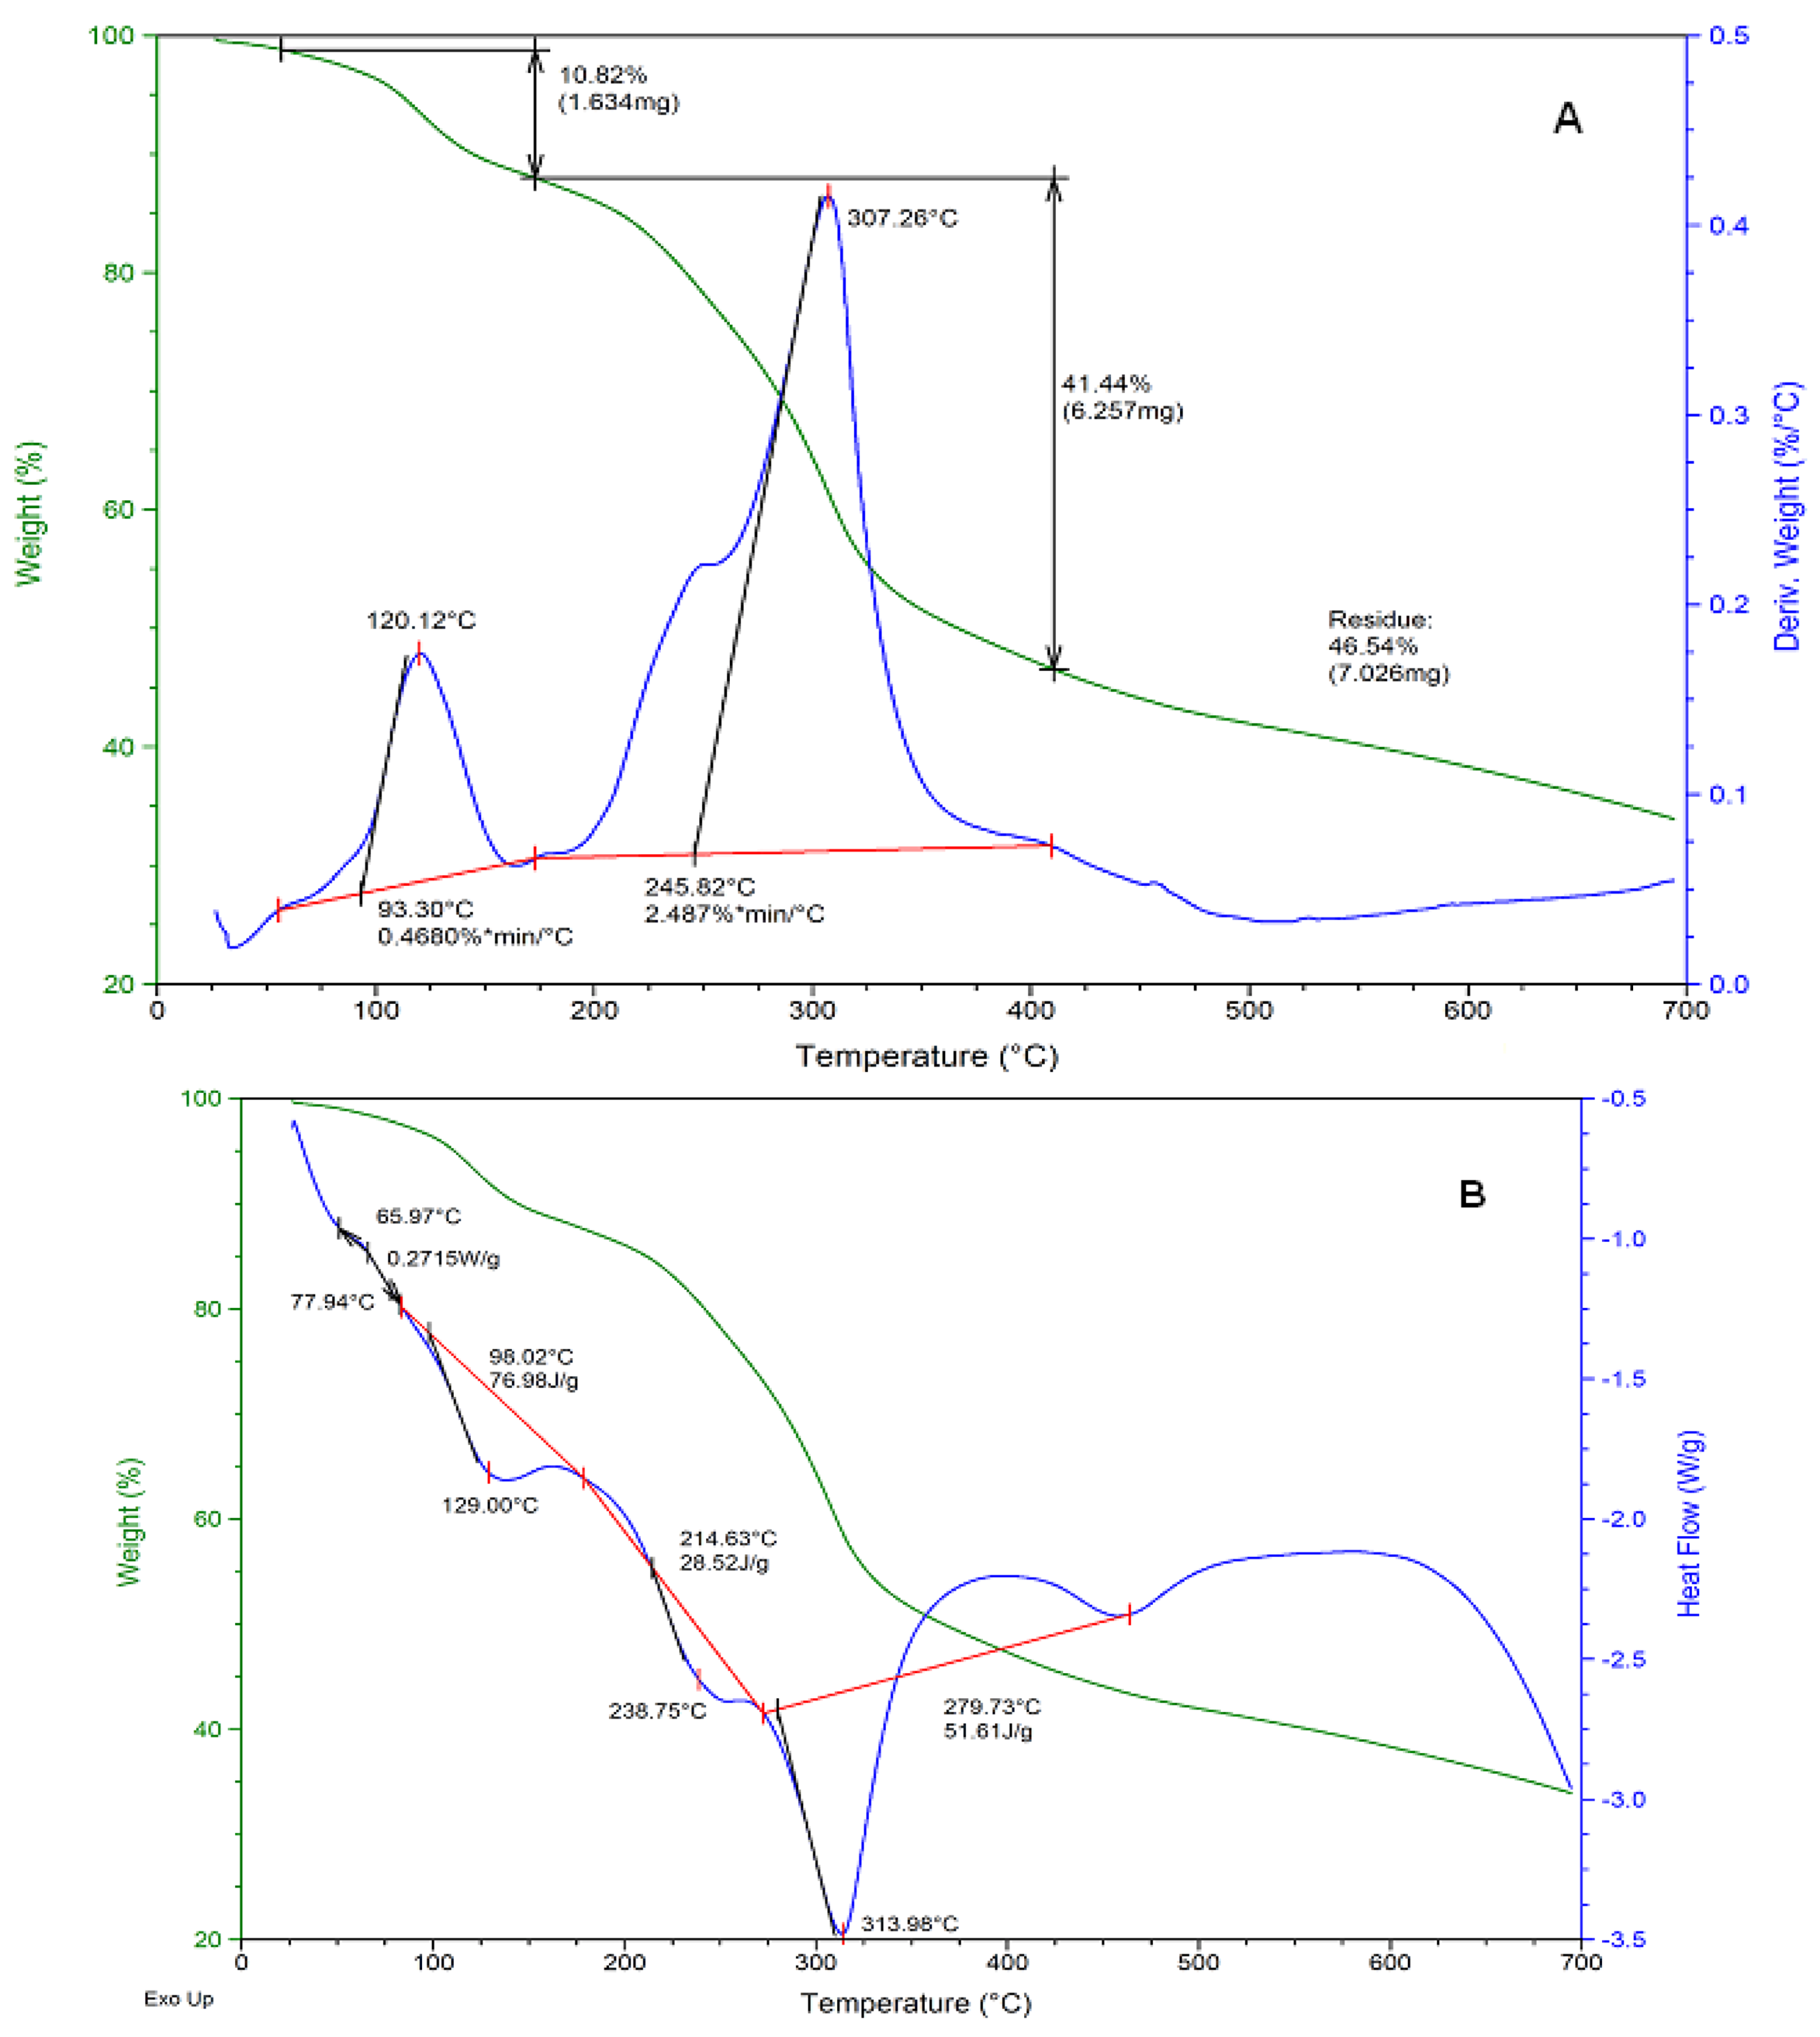
2.2.1. Differential Scanning Calorimetry/Thermogravimetric Analysis (DSC/TGA)
| Thermal Analysis DSC/TGA for Ru-Complex | |||||||
|---|---|---|---|---|---|---|---|
| Temp. Range (°C) | Weight loss (%) | Thermal event | Temp. Range (°C) | Thermal event | |||
| 65–100 | 10.82 | dehydration | 50–80 | dehydration | |||
| 103–175 | 1.0 | solvolysis | 129 | Tg | |||
| 180–307 | 41.44 | deligation | 238 | Tg | |||
| 307–320 | <1.0 | decomposition | 313 | Tm | |||
| 320–700 | <1.0 | decomposition | 460 | recrystallization | |||
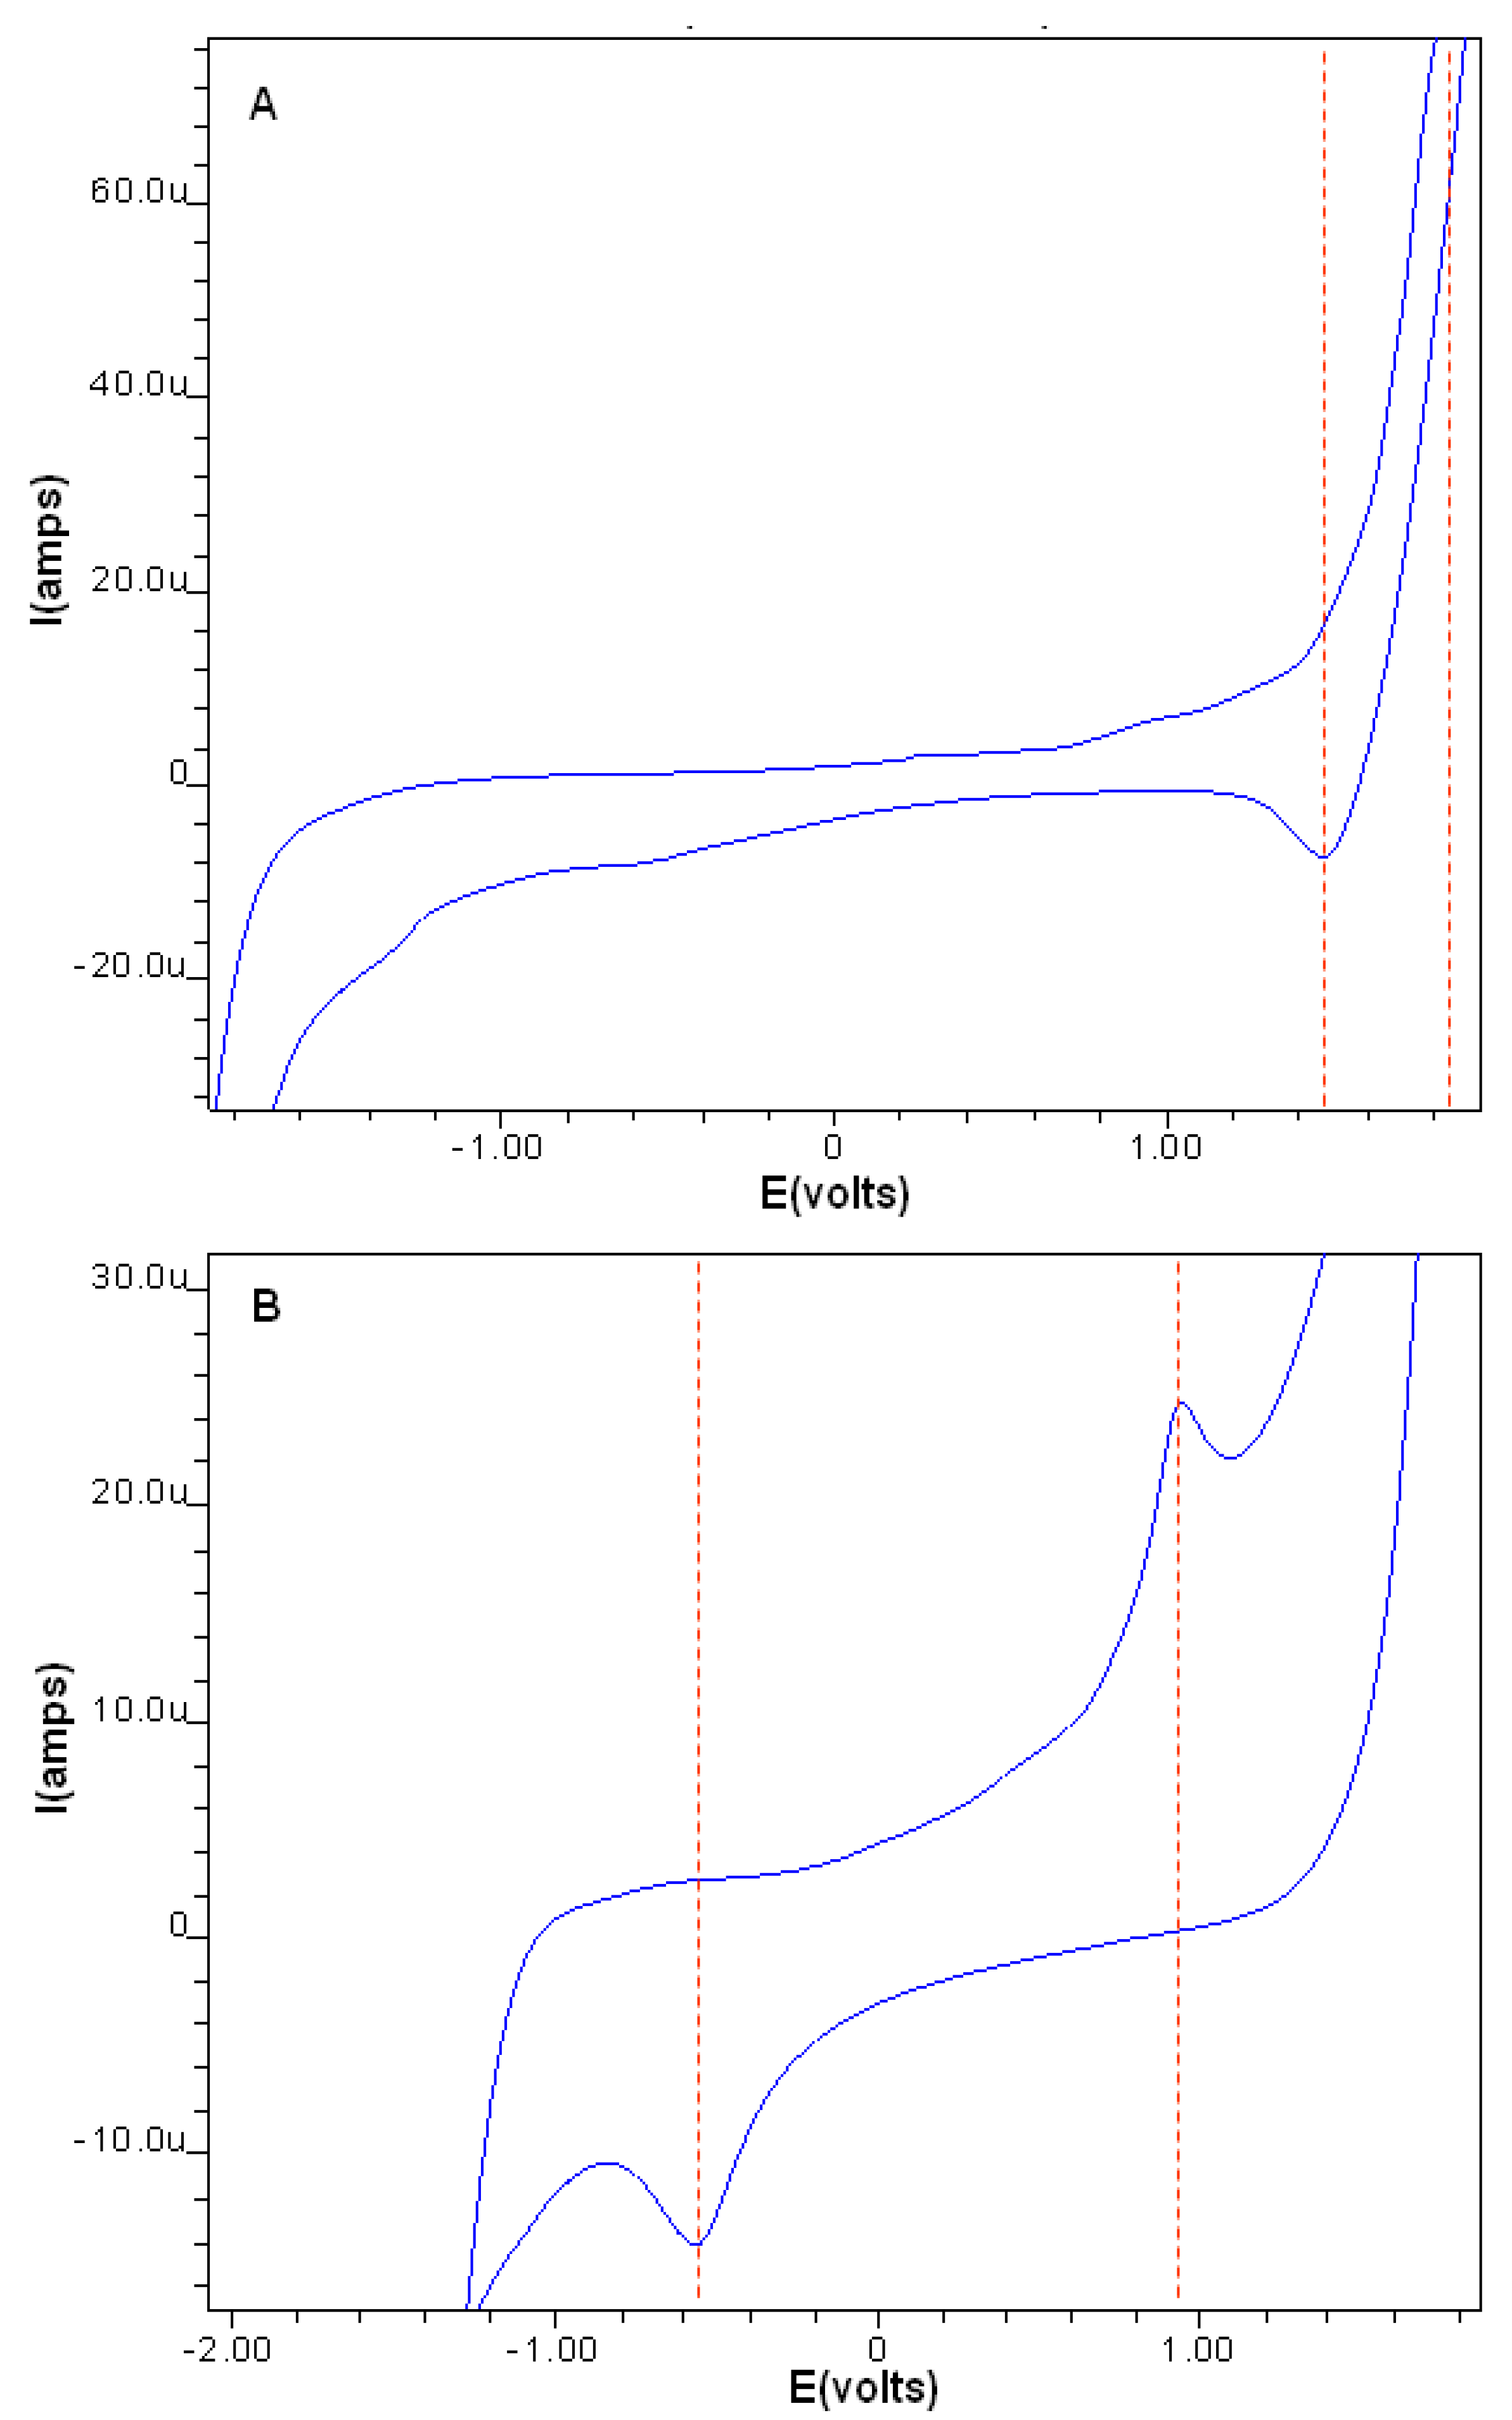
| Electrochemical Analysis for Carnosine and Ru-Complex | |||||||
| Compound | Epa | Epc | Ep1/2 | ΔEp | |||
| Carnosine | 1.8 | −0.6 | 0.6 | 2.4 | |||
| Ru-Complex | 0.94 | −0.56 | 0.19 | 1.5 | |||
| UV-Visible Absorbance/Molar extinction coefficients | |||||||
| Compound | Wavelength in nanometers (cm−1M−1) | ||||||
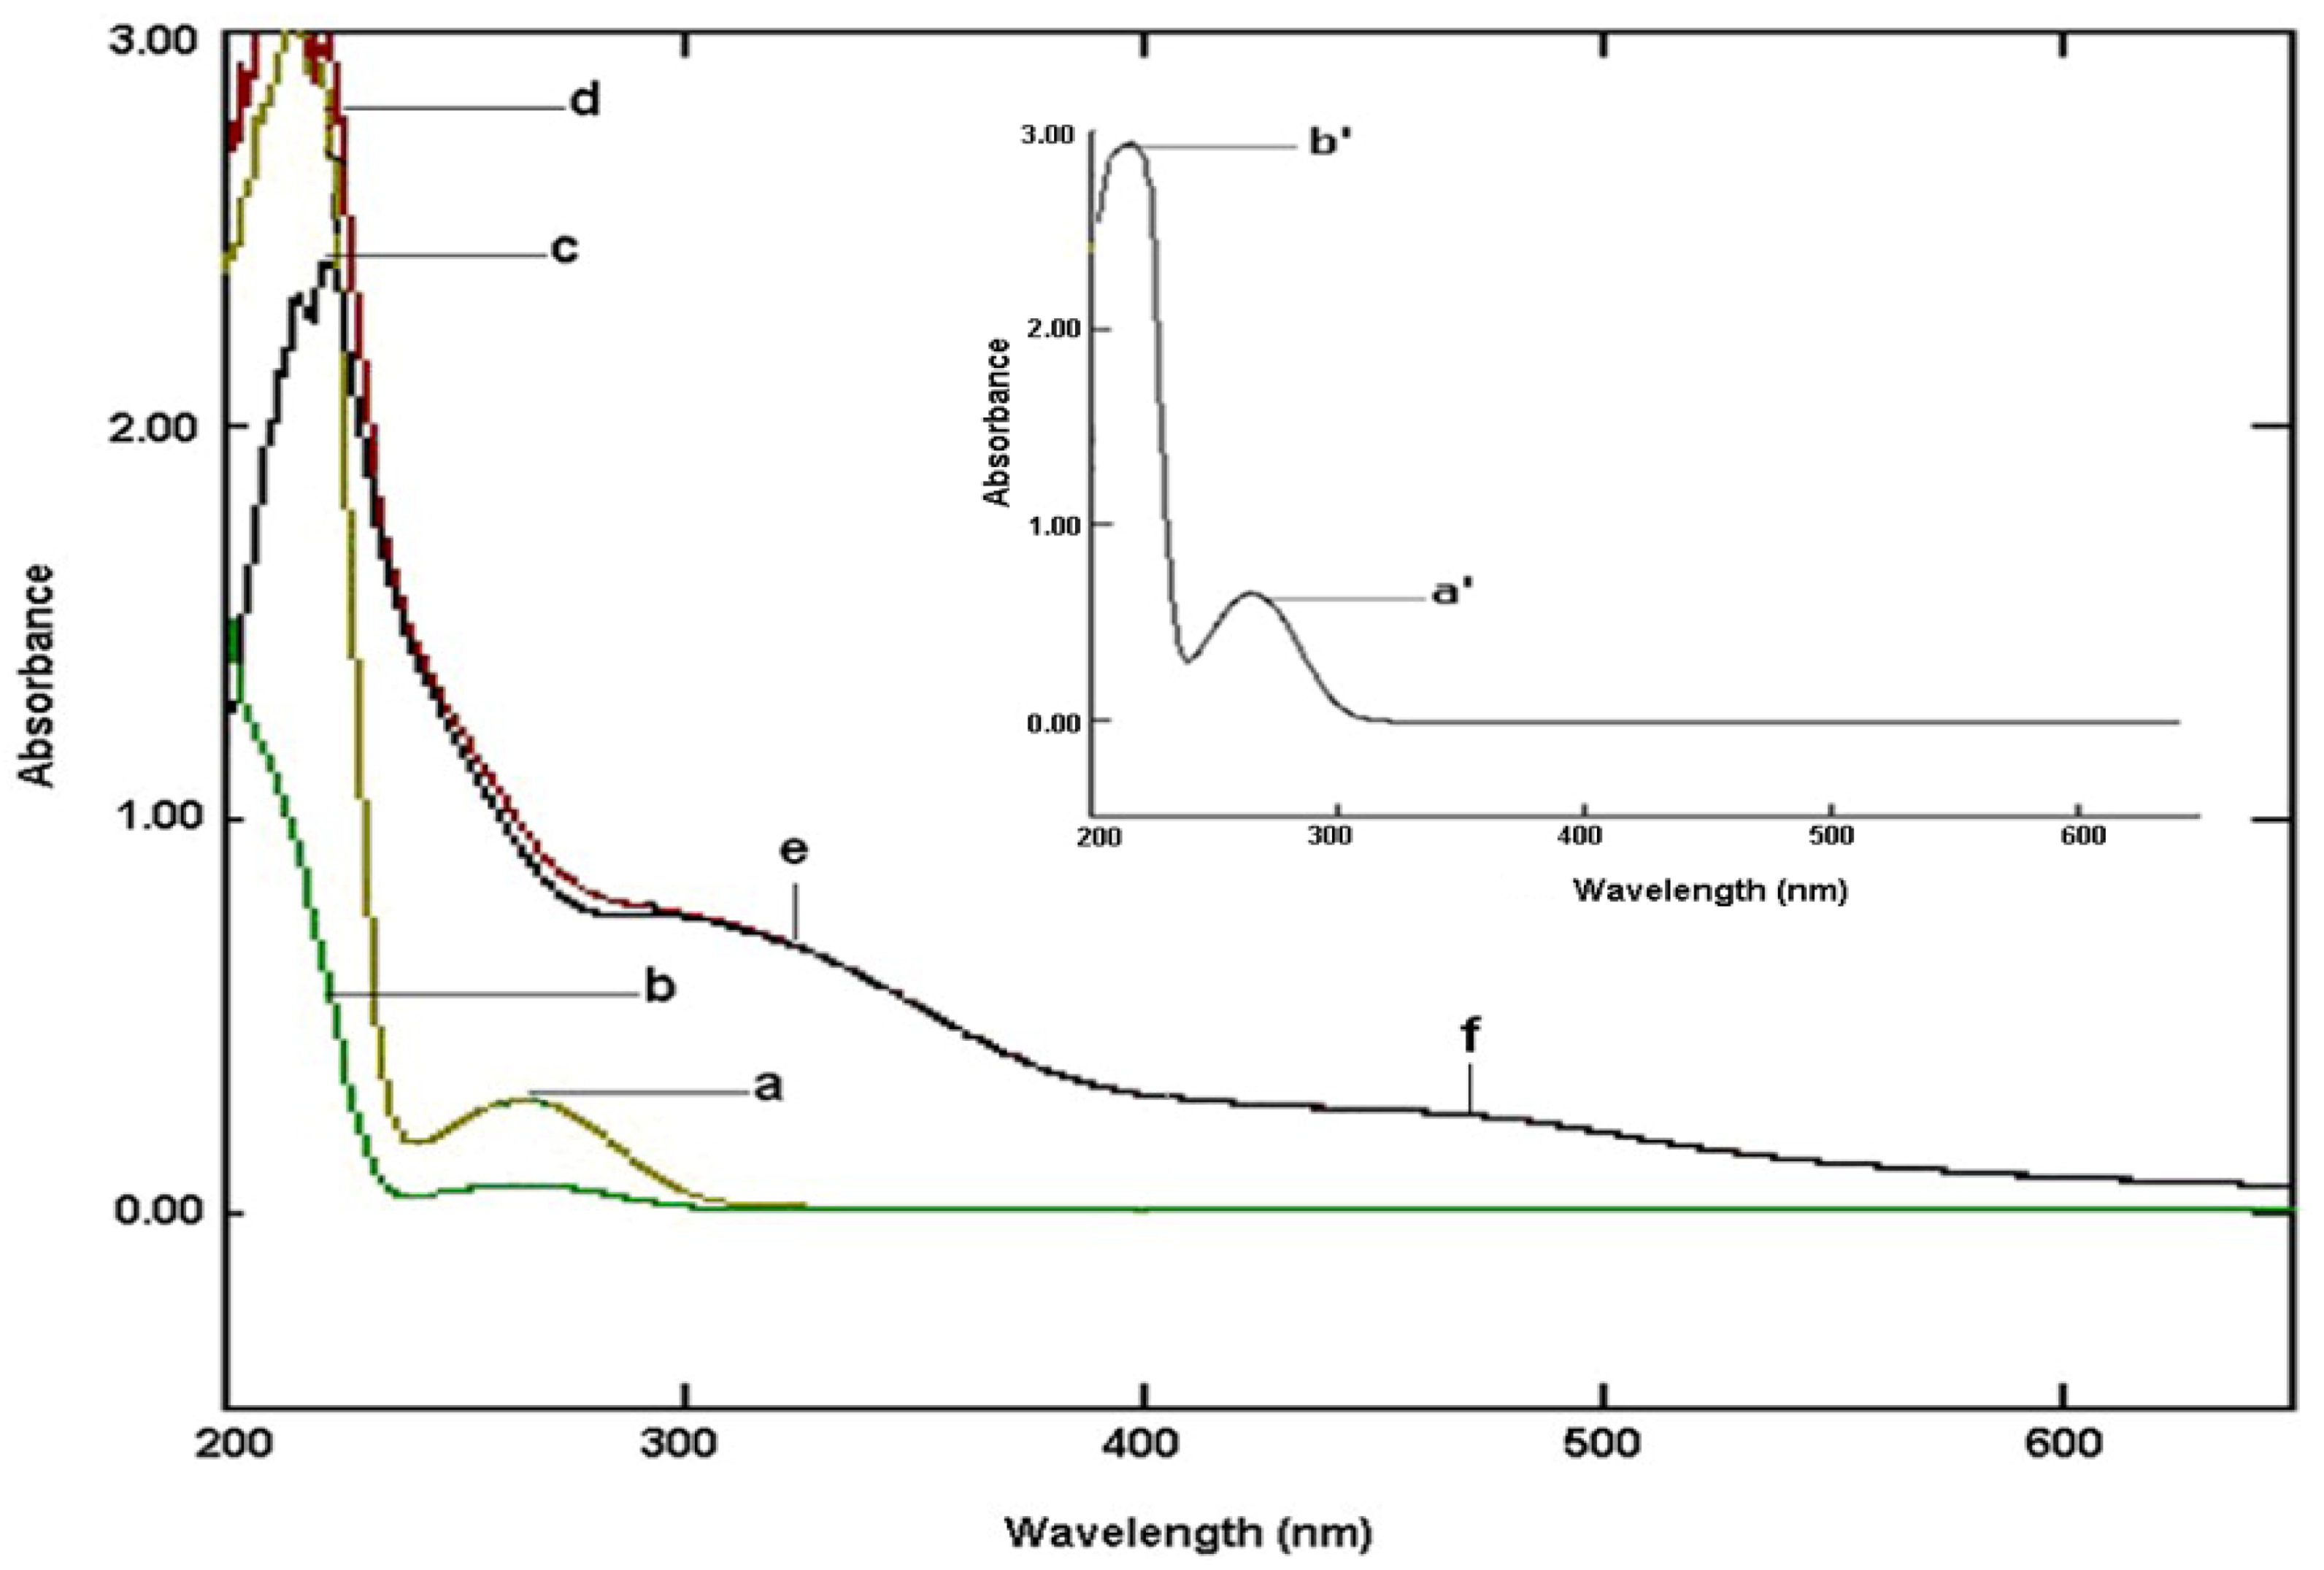
| L-carnosine | 265 (1790 a, 3886) | 214 (7517) | 209 (8350) | ||||
| Ru-complex | 469 (726) | 323 (1609) | 215 (3573) | ||||
| Ru-complex b | 469 (726) | 323 (1865) | 222 (4677) | ||||
2.2.2. Cyclic Voltammetry

2.3. Structure Elucidation
2.3.1. Electronic Spectroscopy
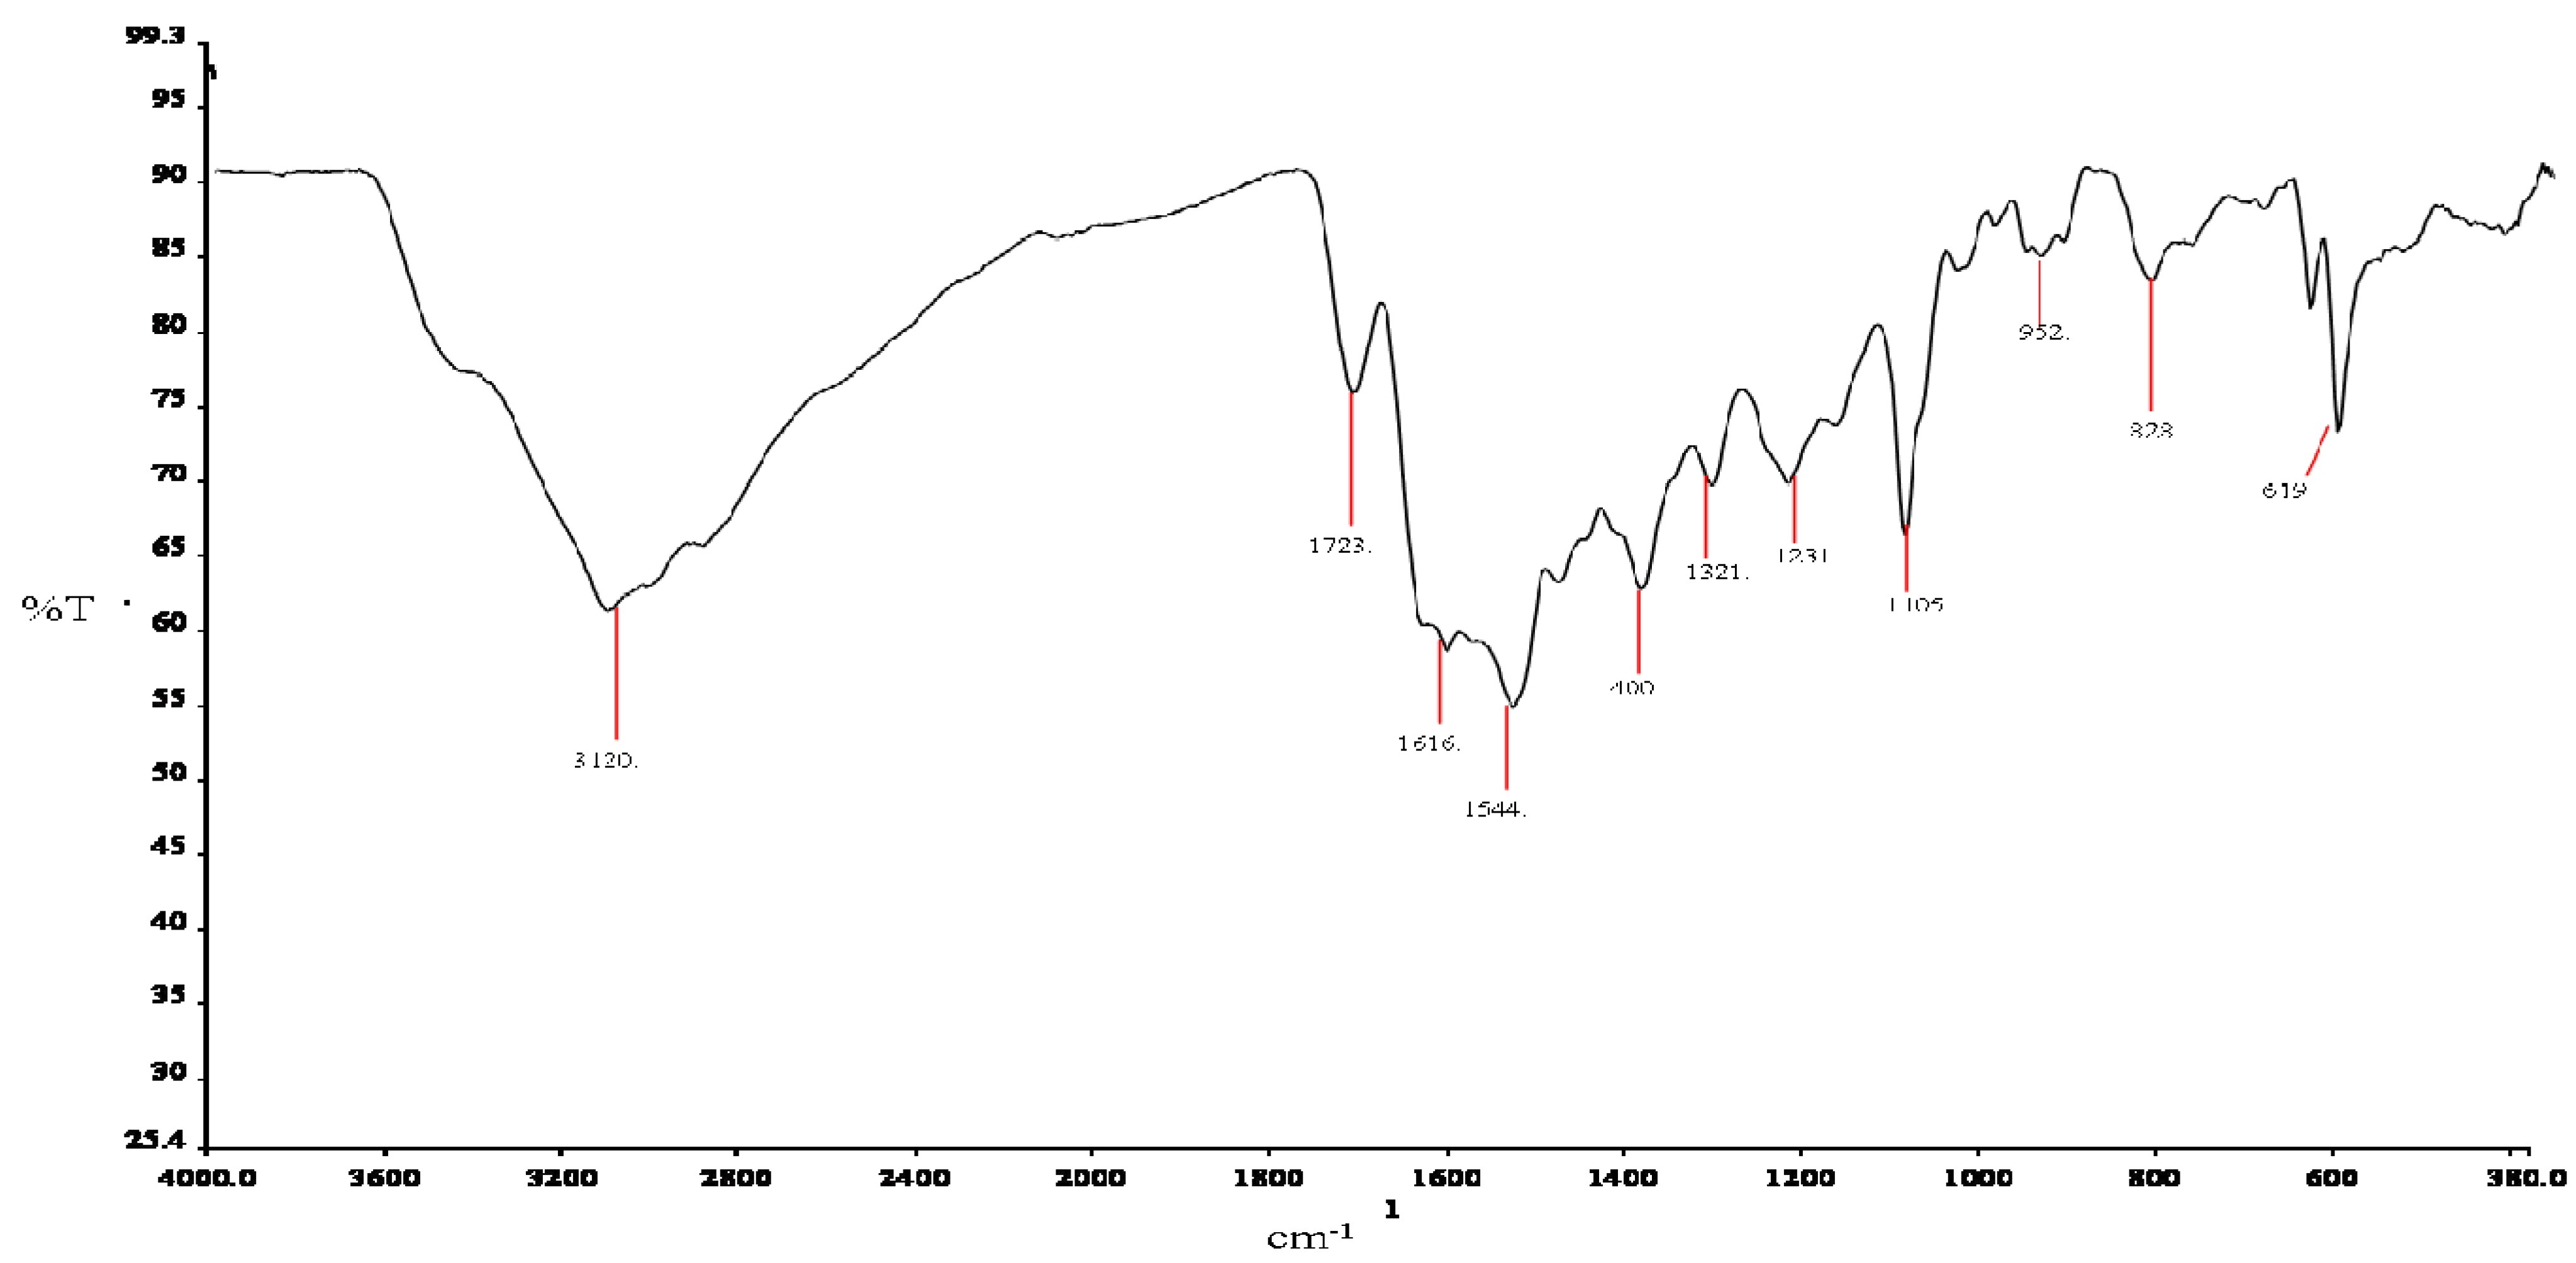
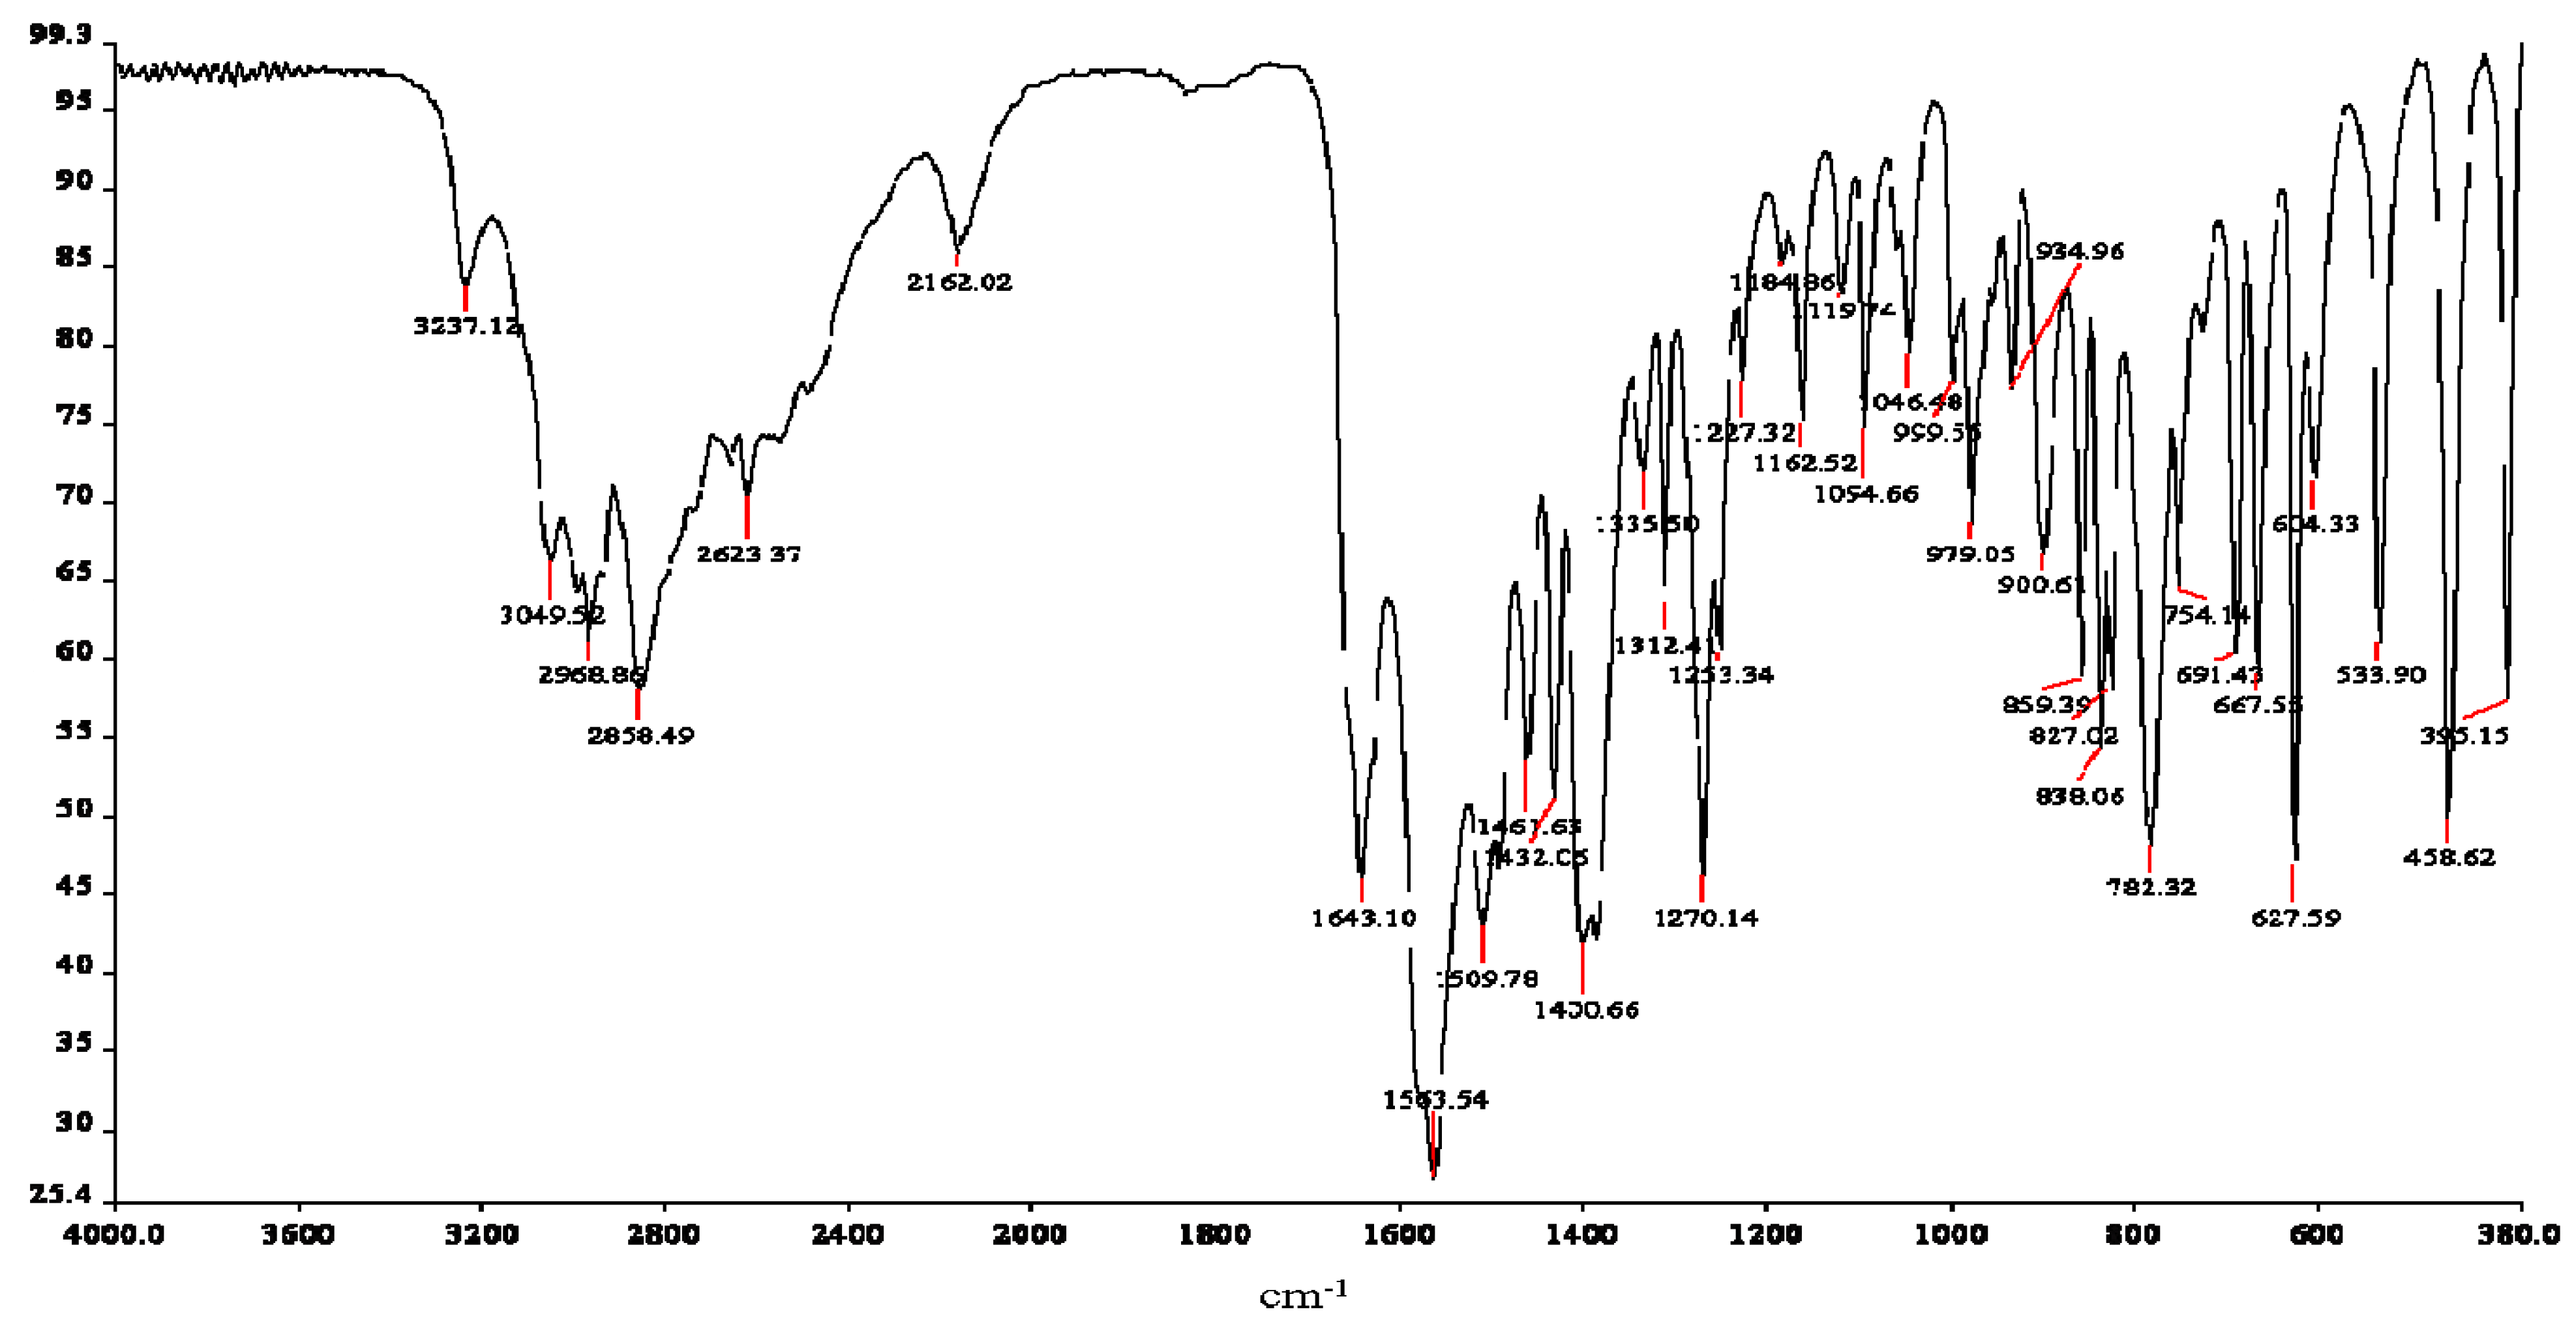
2.3.2. Infrared Spectroscopy

| Atom# | Carnosine V(cm−1) | Assignments | Atom# | Ru-complex V(cm−1) | Assignments |
|---|---|---|---|---|---|
| N13 | 3237 | νa(NH3)+ | ----- | ----- | ----- |
| N13 | 3049 | νa(NH3)+ | ----- | ----- | ----- |
| ----- | ----- | ----- | N3 | 3120 | νa (N-H) * |
| ----- | ----- | ----- | C1, N3 | 1723 | ν(N1=C2) * |
| ----- | ----- | ----- | ----- | ----- | ----- |
| C10 | 1643 | Amide l | C8 | 1616 | Amide l |
| C4, 5 | 1563 | ν(C4=C5) * | ----- | ----- | ----- |
| ----- | ----- | ----- | C8 | 1544 | va(COO)− |
| imidazole | 1461 | stretching * | ----- | ----- | ----- |
| N3, C11,12 | 1432 | δ(N-H) *, δ(CH2) | ----- | ----- | ----- |
| C8 | 1400 | νs(COO)− | C8 | 1400 | νs(COO)− |
| C2, 4, 7 | 1335 | ν(C-N) + breathing * | ----- | 1321 | ν(C-N) + breathing * |
| C2, 4 | 1312 | ν(C-N) + breathing * | ----- | ----- | ----- |
| imidazole | 1270 | Breathing * | ----- | ----- | ----- |
| N1, C2, N3 | 1227 | ν(NCN) * + δ(N-H) * | N1, C2, N3 | 1231 | ν(NCN) * + δ(N-H) * |
| N1, C2, N3 | 1162 | ν(NCN) * + δ(N-H) * | ----- | ----- | ----- |
| C7 | 1095 | δ(C-H) * | C7 | 1105 | δ(C-H) * |
| C2, 4 | 979 | δ(C-H) * | C2, 4 | 952 | δ(C-H) * |
| imidazole | 859 | deformation * | ----- | ----- | ----- |
| N13 | 838 | NH3+ deformation | N13 | 828 | NH3+ deformation |
| C8 | 625 | δ(COO)− | C8 | 619 | δ(COO)− |
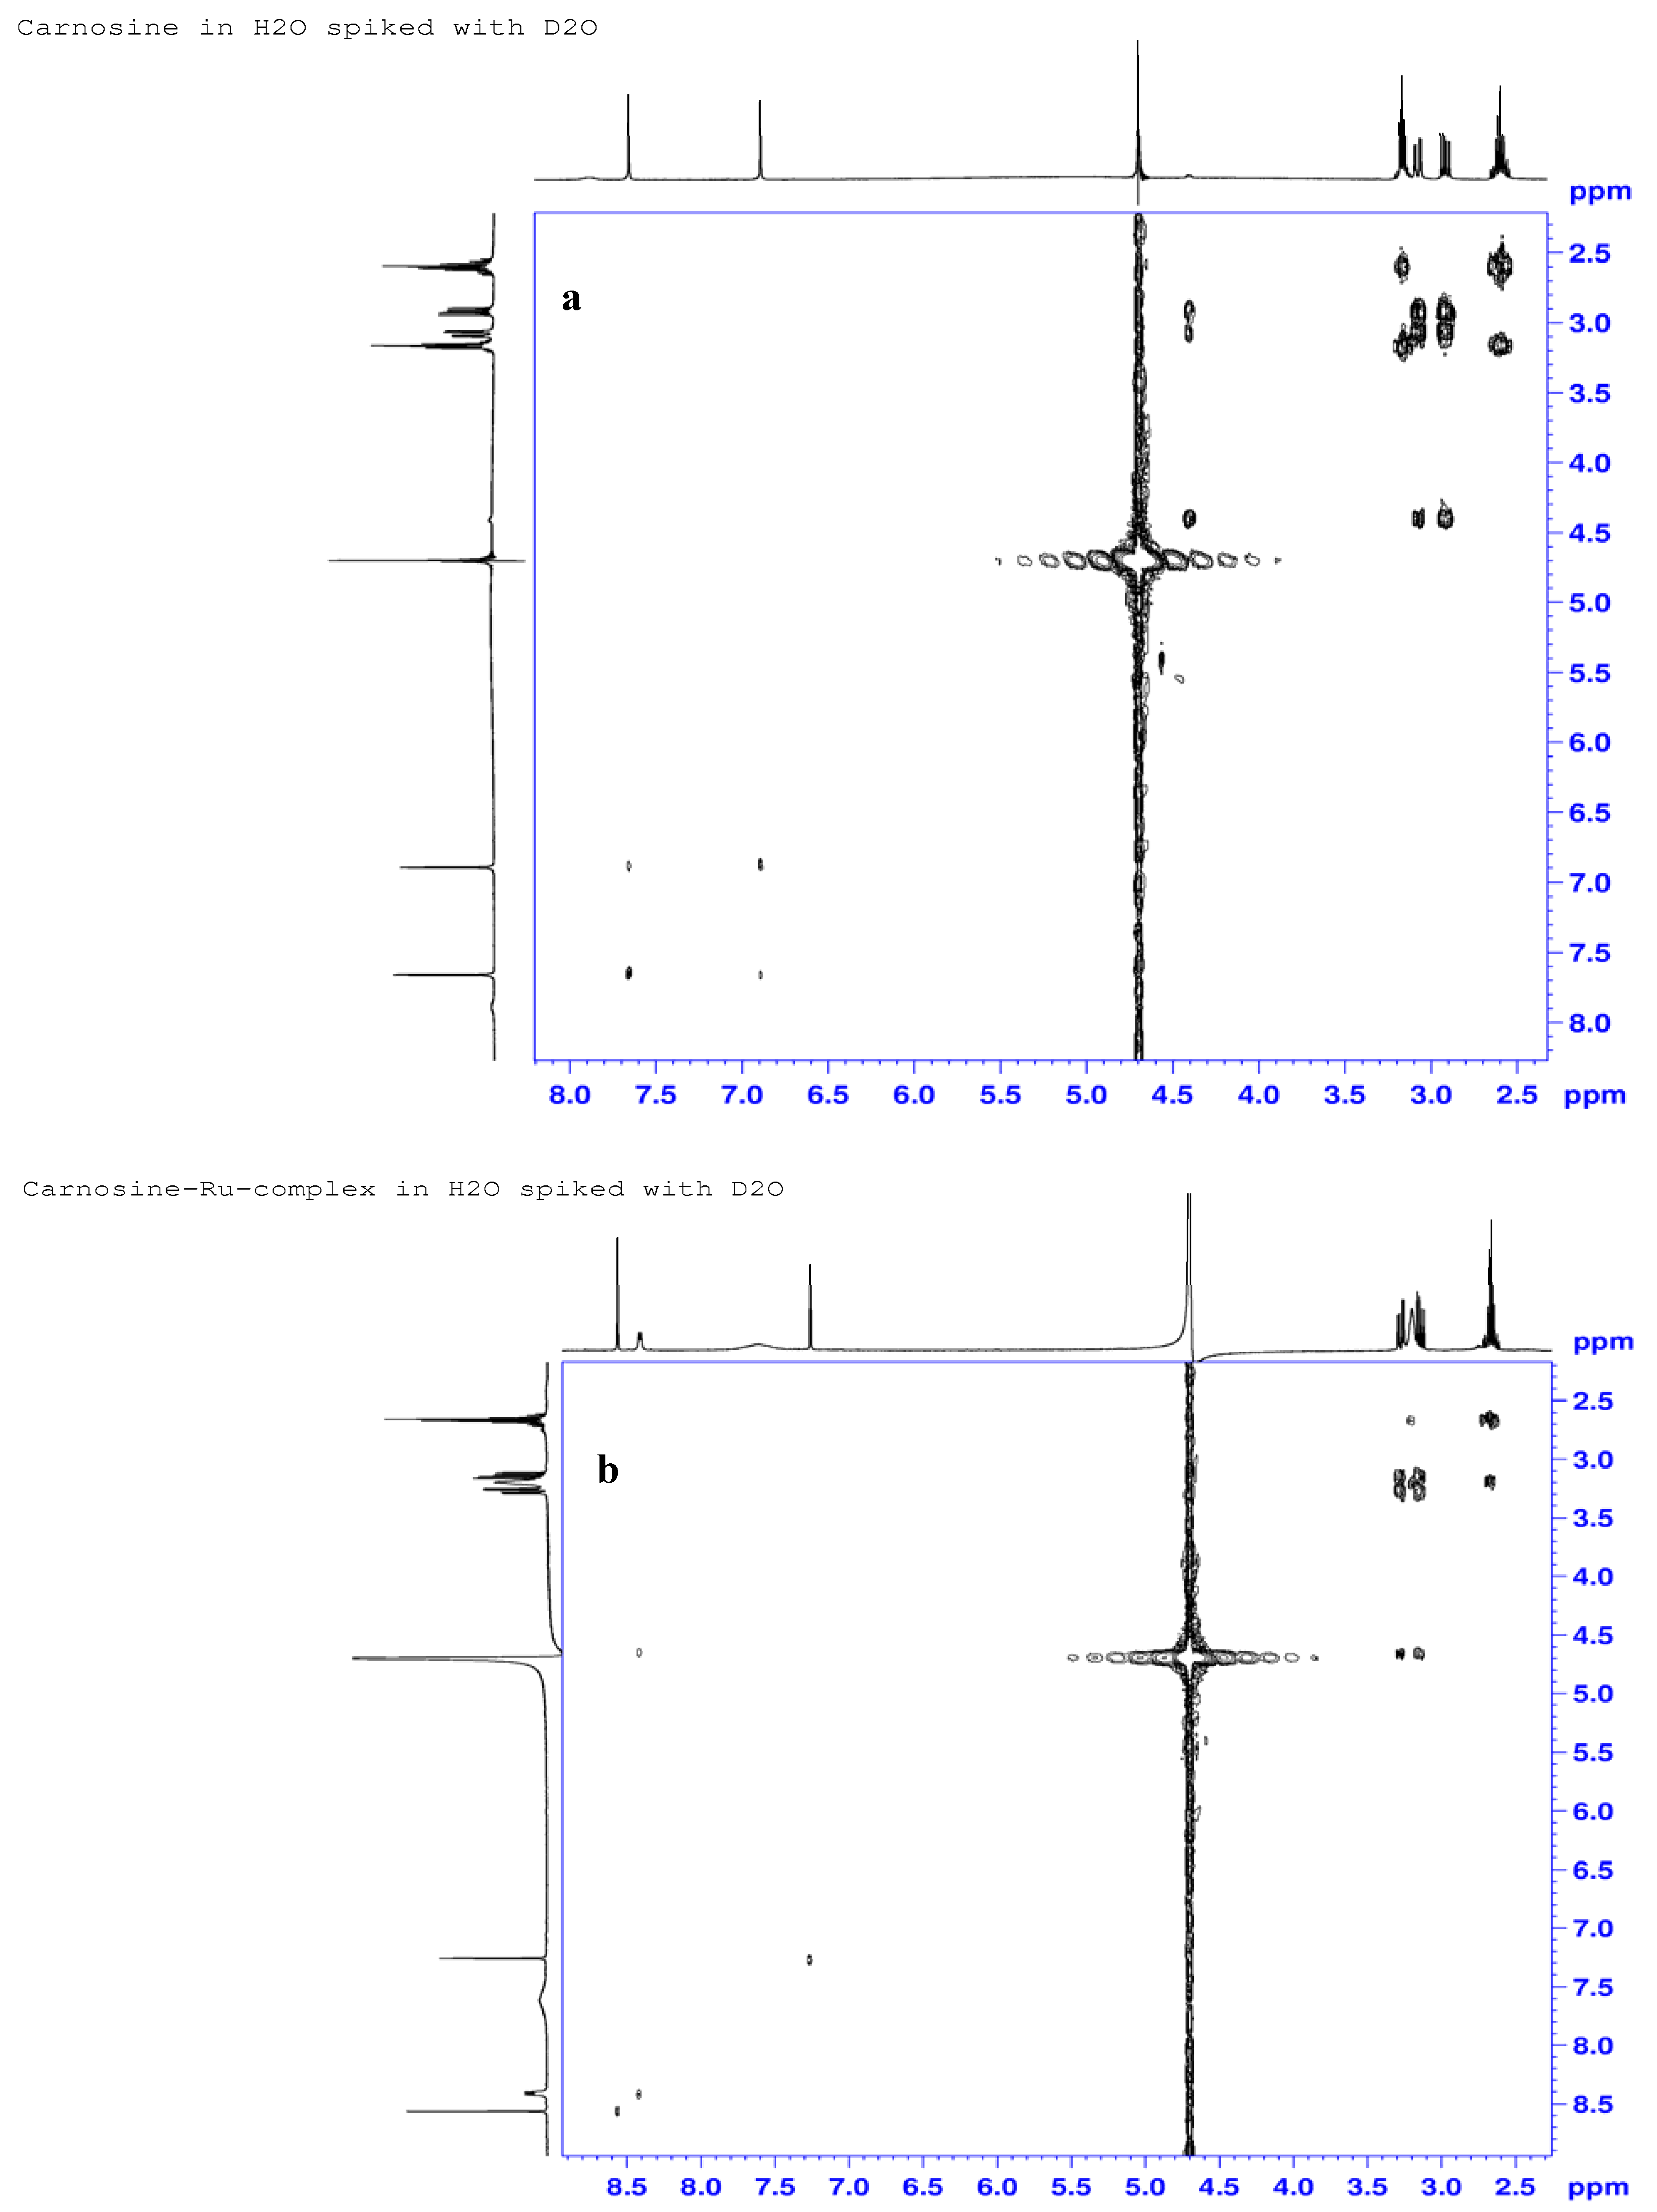
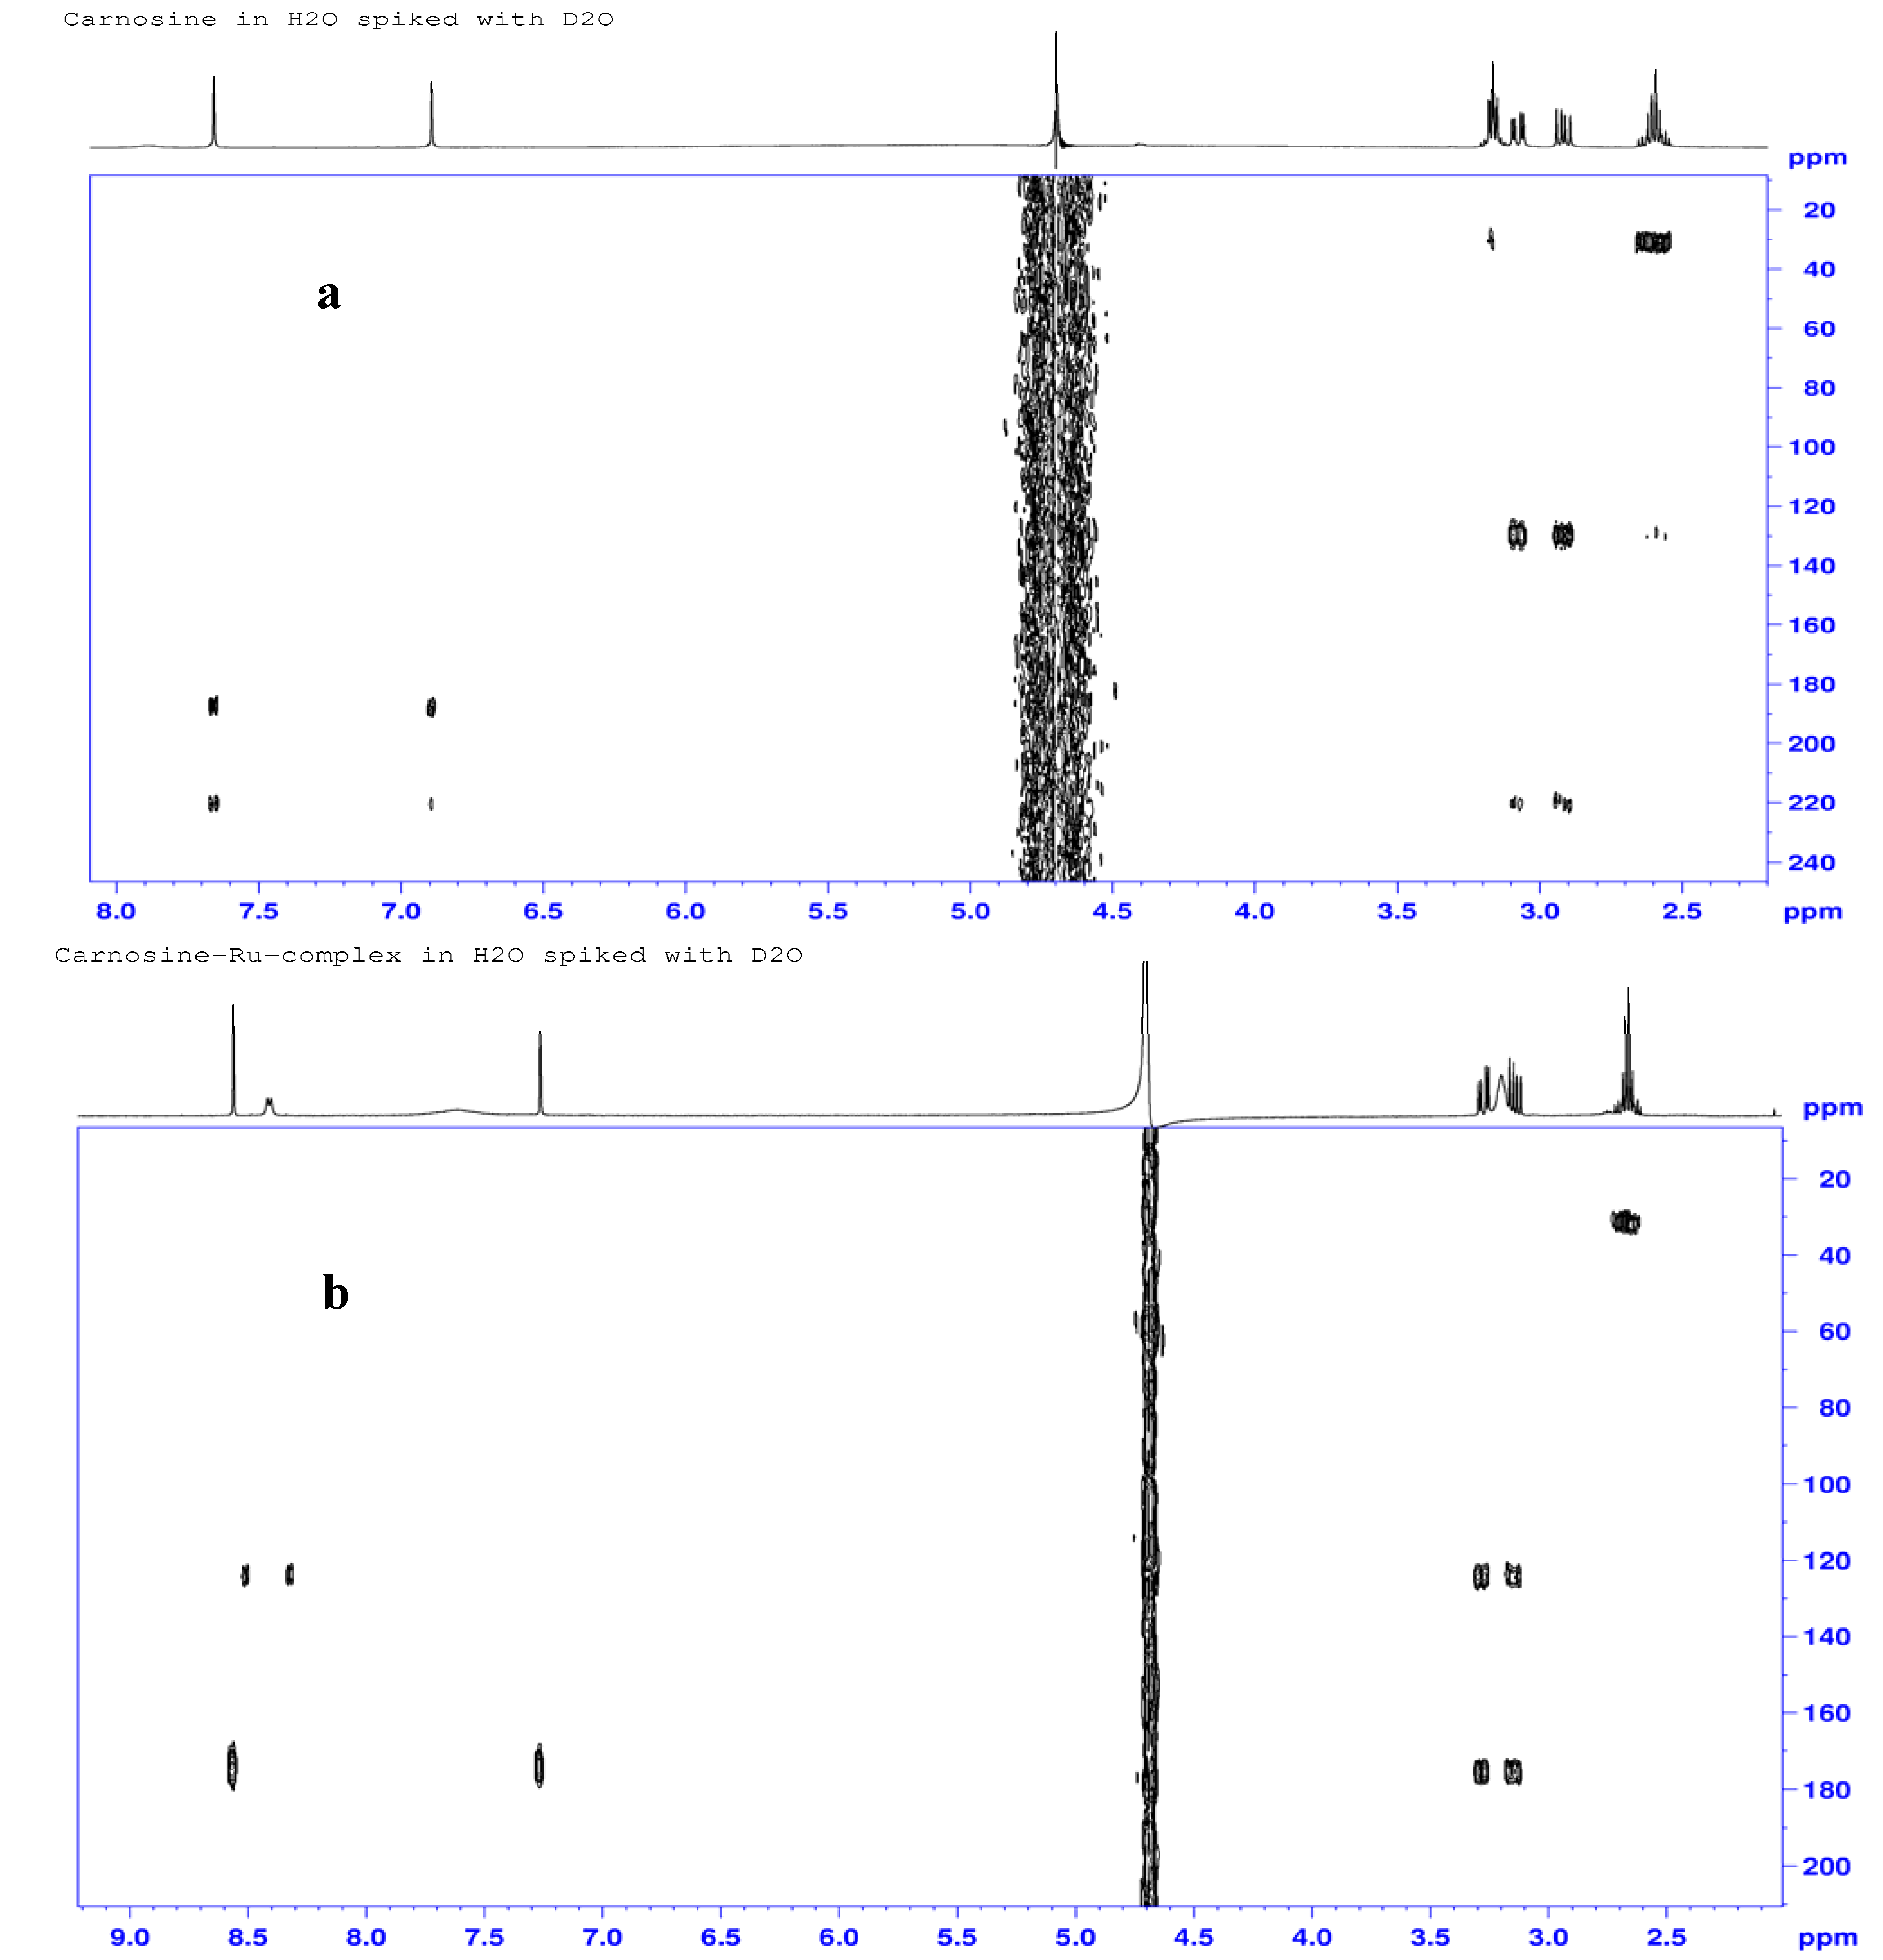
2.3.3. 1H-, 13C- and 15N-NMR Studies

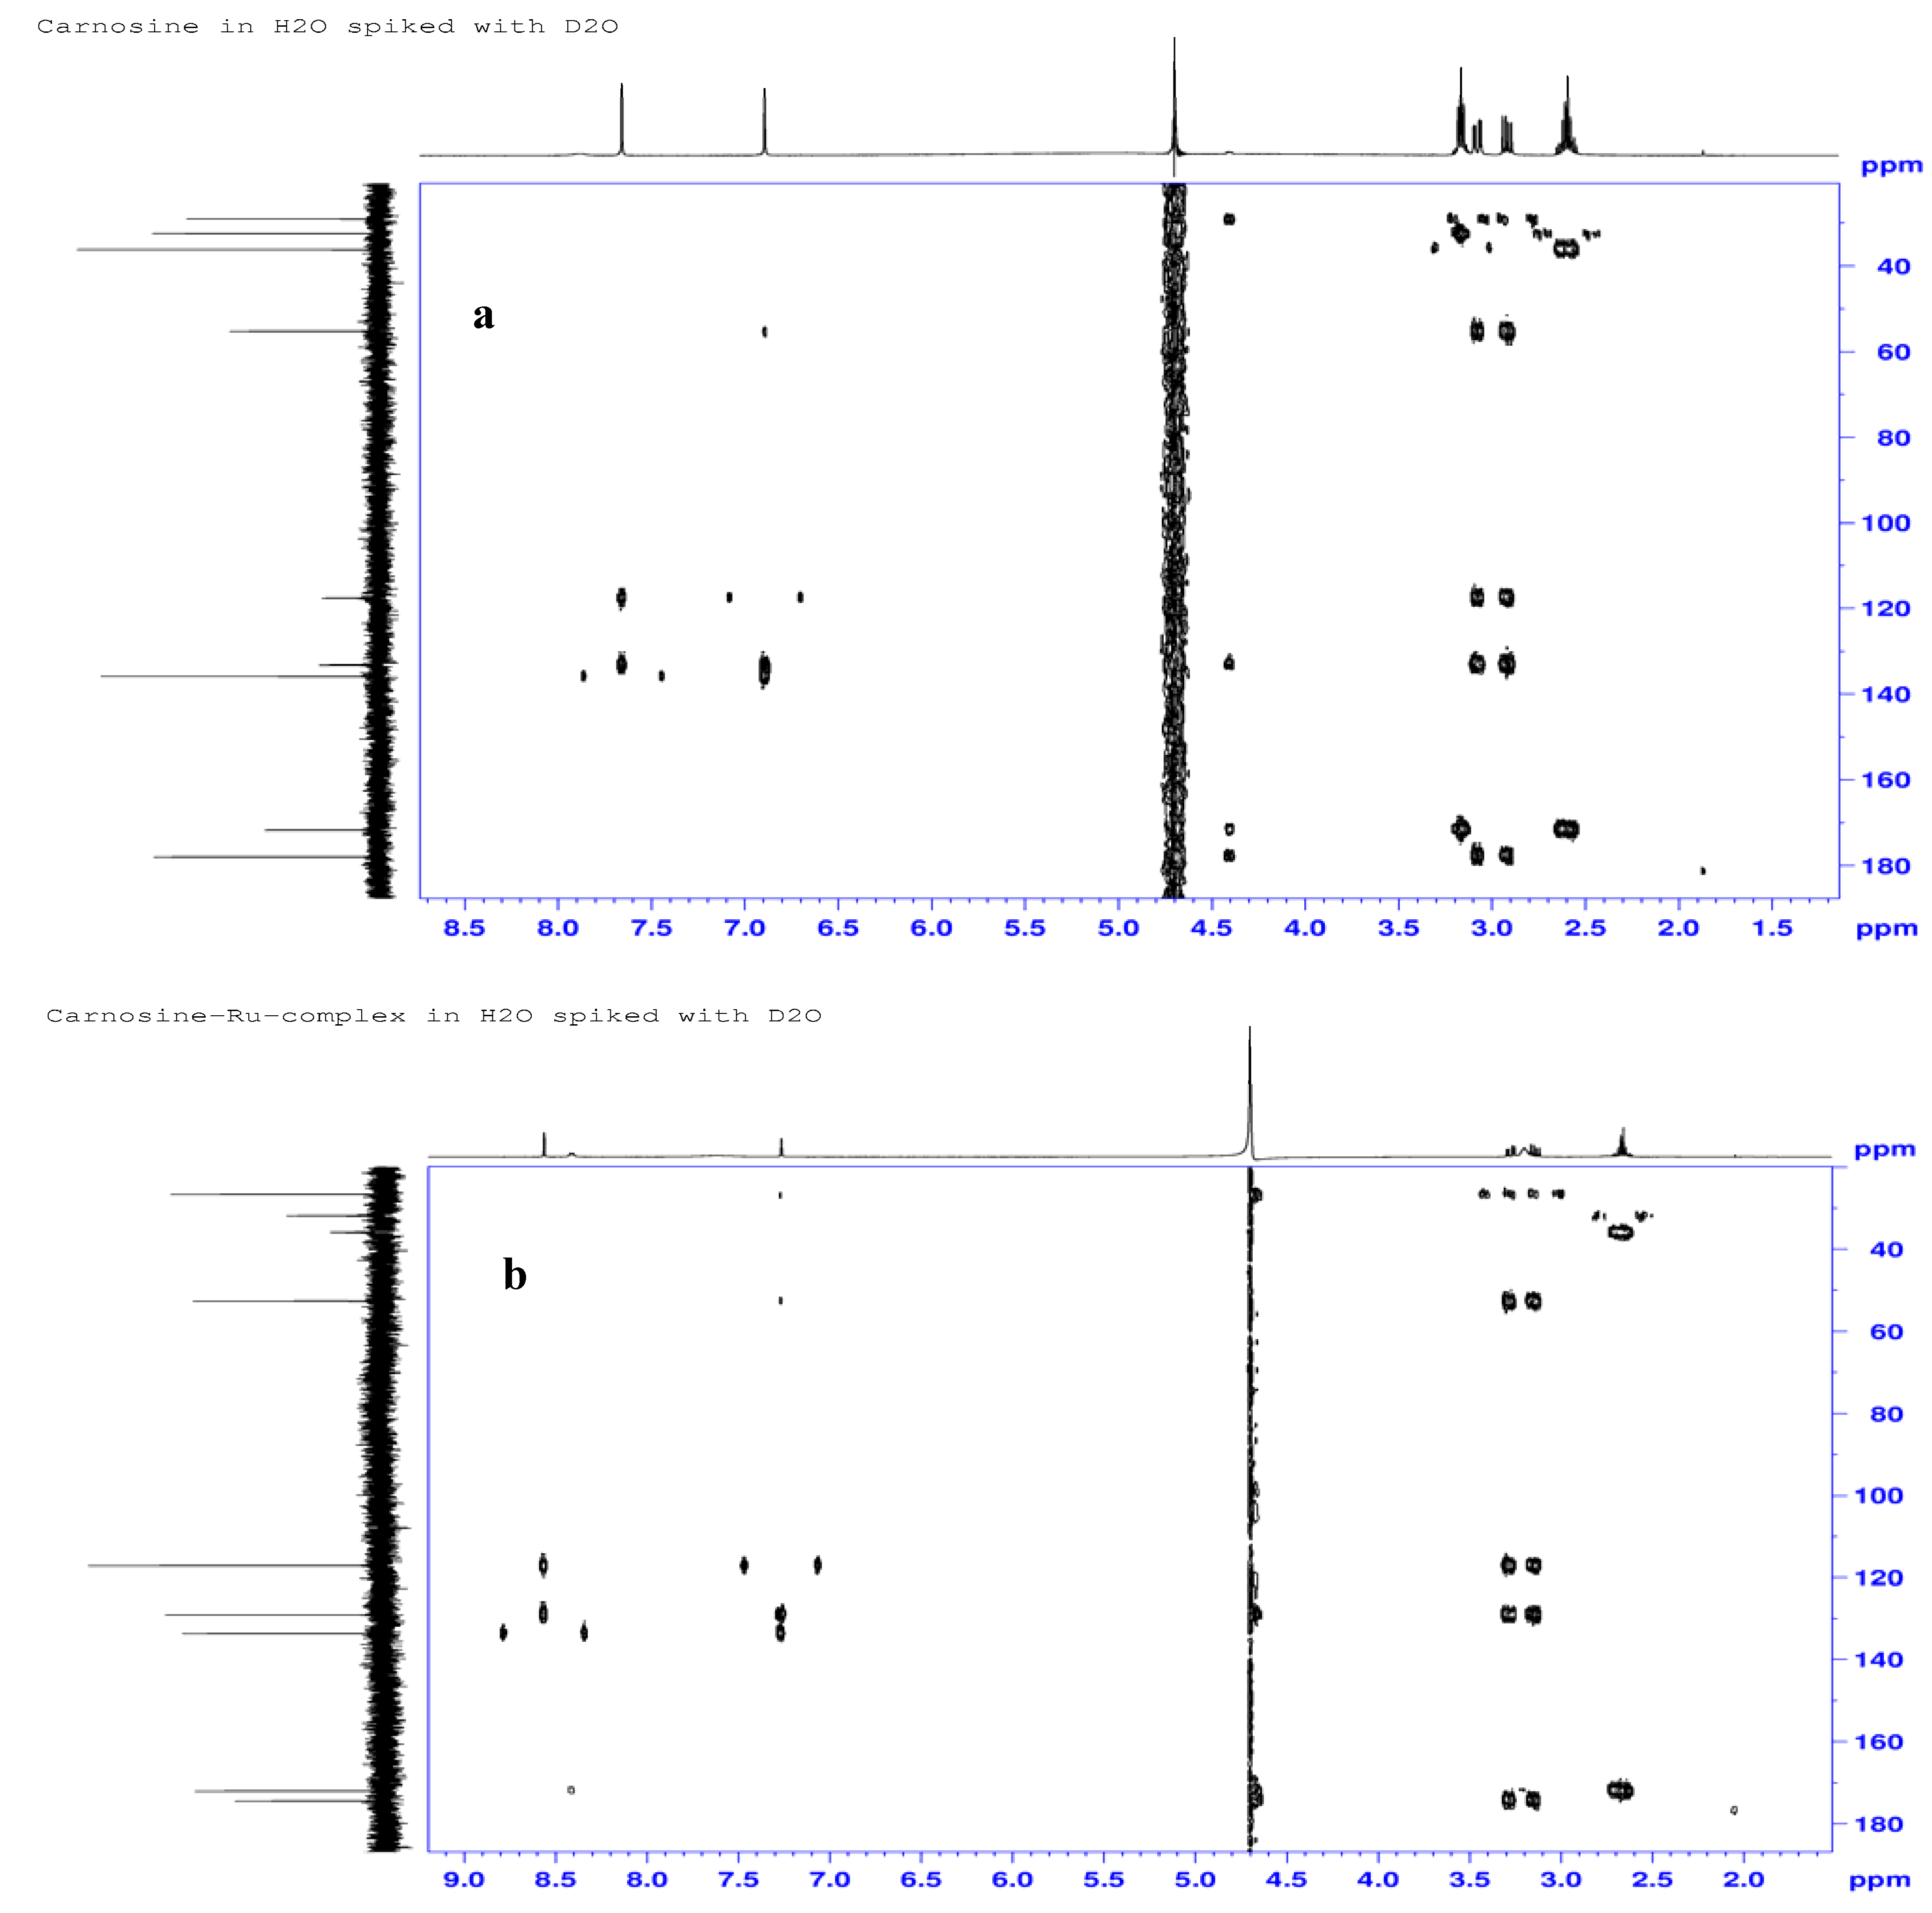

| Atom# | Carnosine (ppm) | Ru-complex (ppm) | %Delta δ (ppm) | Assignments |
|---|---|---|---|---|
| H7 | 4.40 | 4.65 | −5.7 | α-His-methine |
| H6 | 2.92; 3.08 | 3.14; 3.27 | −7.5; −6.5 | βS; βR -His-methylene |
| H9 | 7.89 | 8.41 | −6.6 | Amide N-H, H-bonding |
| H2 | 7.66 | 8.56 | −11.7 | Imine hydrogen |
| H4 | 6.89 | 7.26 | −5.37 | Ring methine |
| H11 | 3.16 | 3.2 | −1.9 | β-Ala-methylene |
| H12 | 2.60 | 2.66 | −2.3 | α-Ala-methylene |
| C8 | 177.9 | 174.5 | 1.9 | Carboxylate |
| C7 | 55.3 | 52.6; 52.7 | 4.9; 4.7 | α-His-methine |
| C6 | 29.0 | 26.5; 26.6 | 8.6; 8.3 | β-His-methylene |
| C2 | 135.9 | 133.6 | 1.7 | Imine carbon |
| C4 | 133.2 | 129.1 | 3.1 | Ring methine carbon |
| C5 | 117.6 | 117.1 | 0.4 | Ring carbon atom |
| C10 | 171.7 | 172.0; 172.0 | −0.1 | Amide carbonyl |
| C11 | 36.1 | 35.7 | 1.1 | β-Ala-methylene |
| C12 | 32.5 | 31.9 | 1.8 | α-Ala-methylene |
| N9 | 129.5 | 124.1 | 4.2 | Amide nitrogen |
| N3 | 188.5 | 174.0 | 7.7 | Pyrrole nitrogen |
| N1 | 220.7 | 175.3 | 11.5 | Imine nitrogen |
| N13 | 30.9 | 31.4 | −1.6 | NH3 |
2.4. Computational Methods
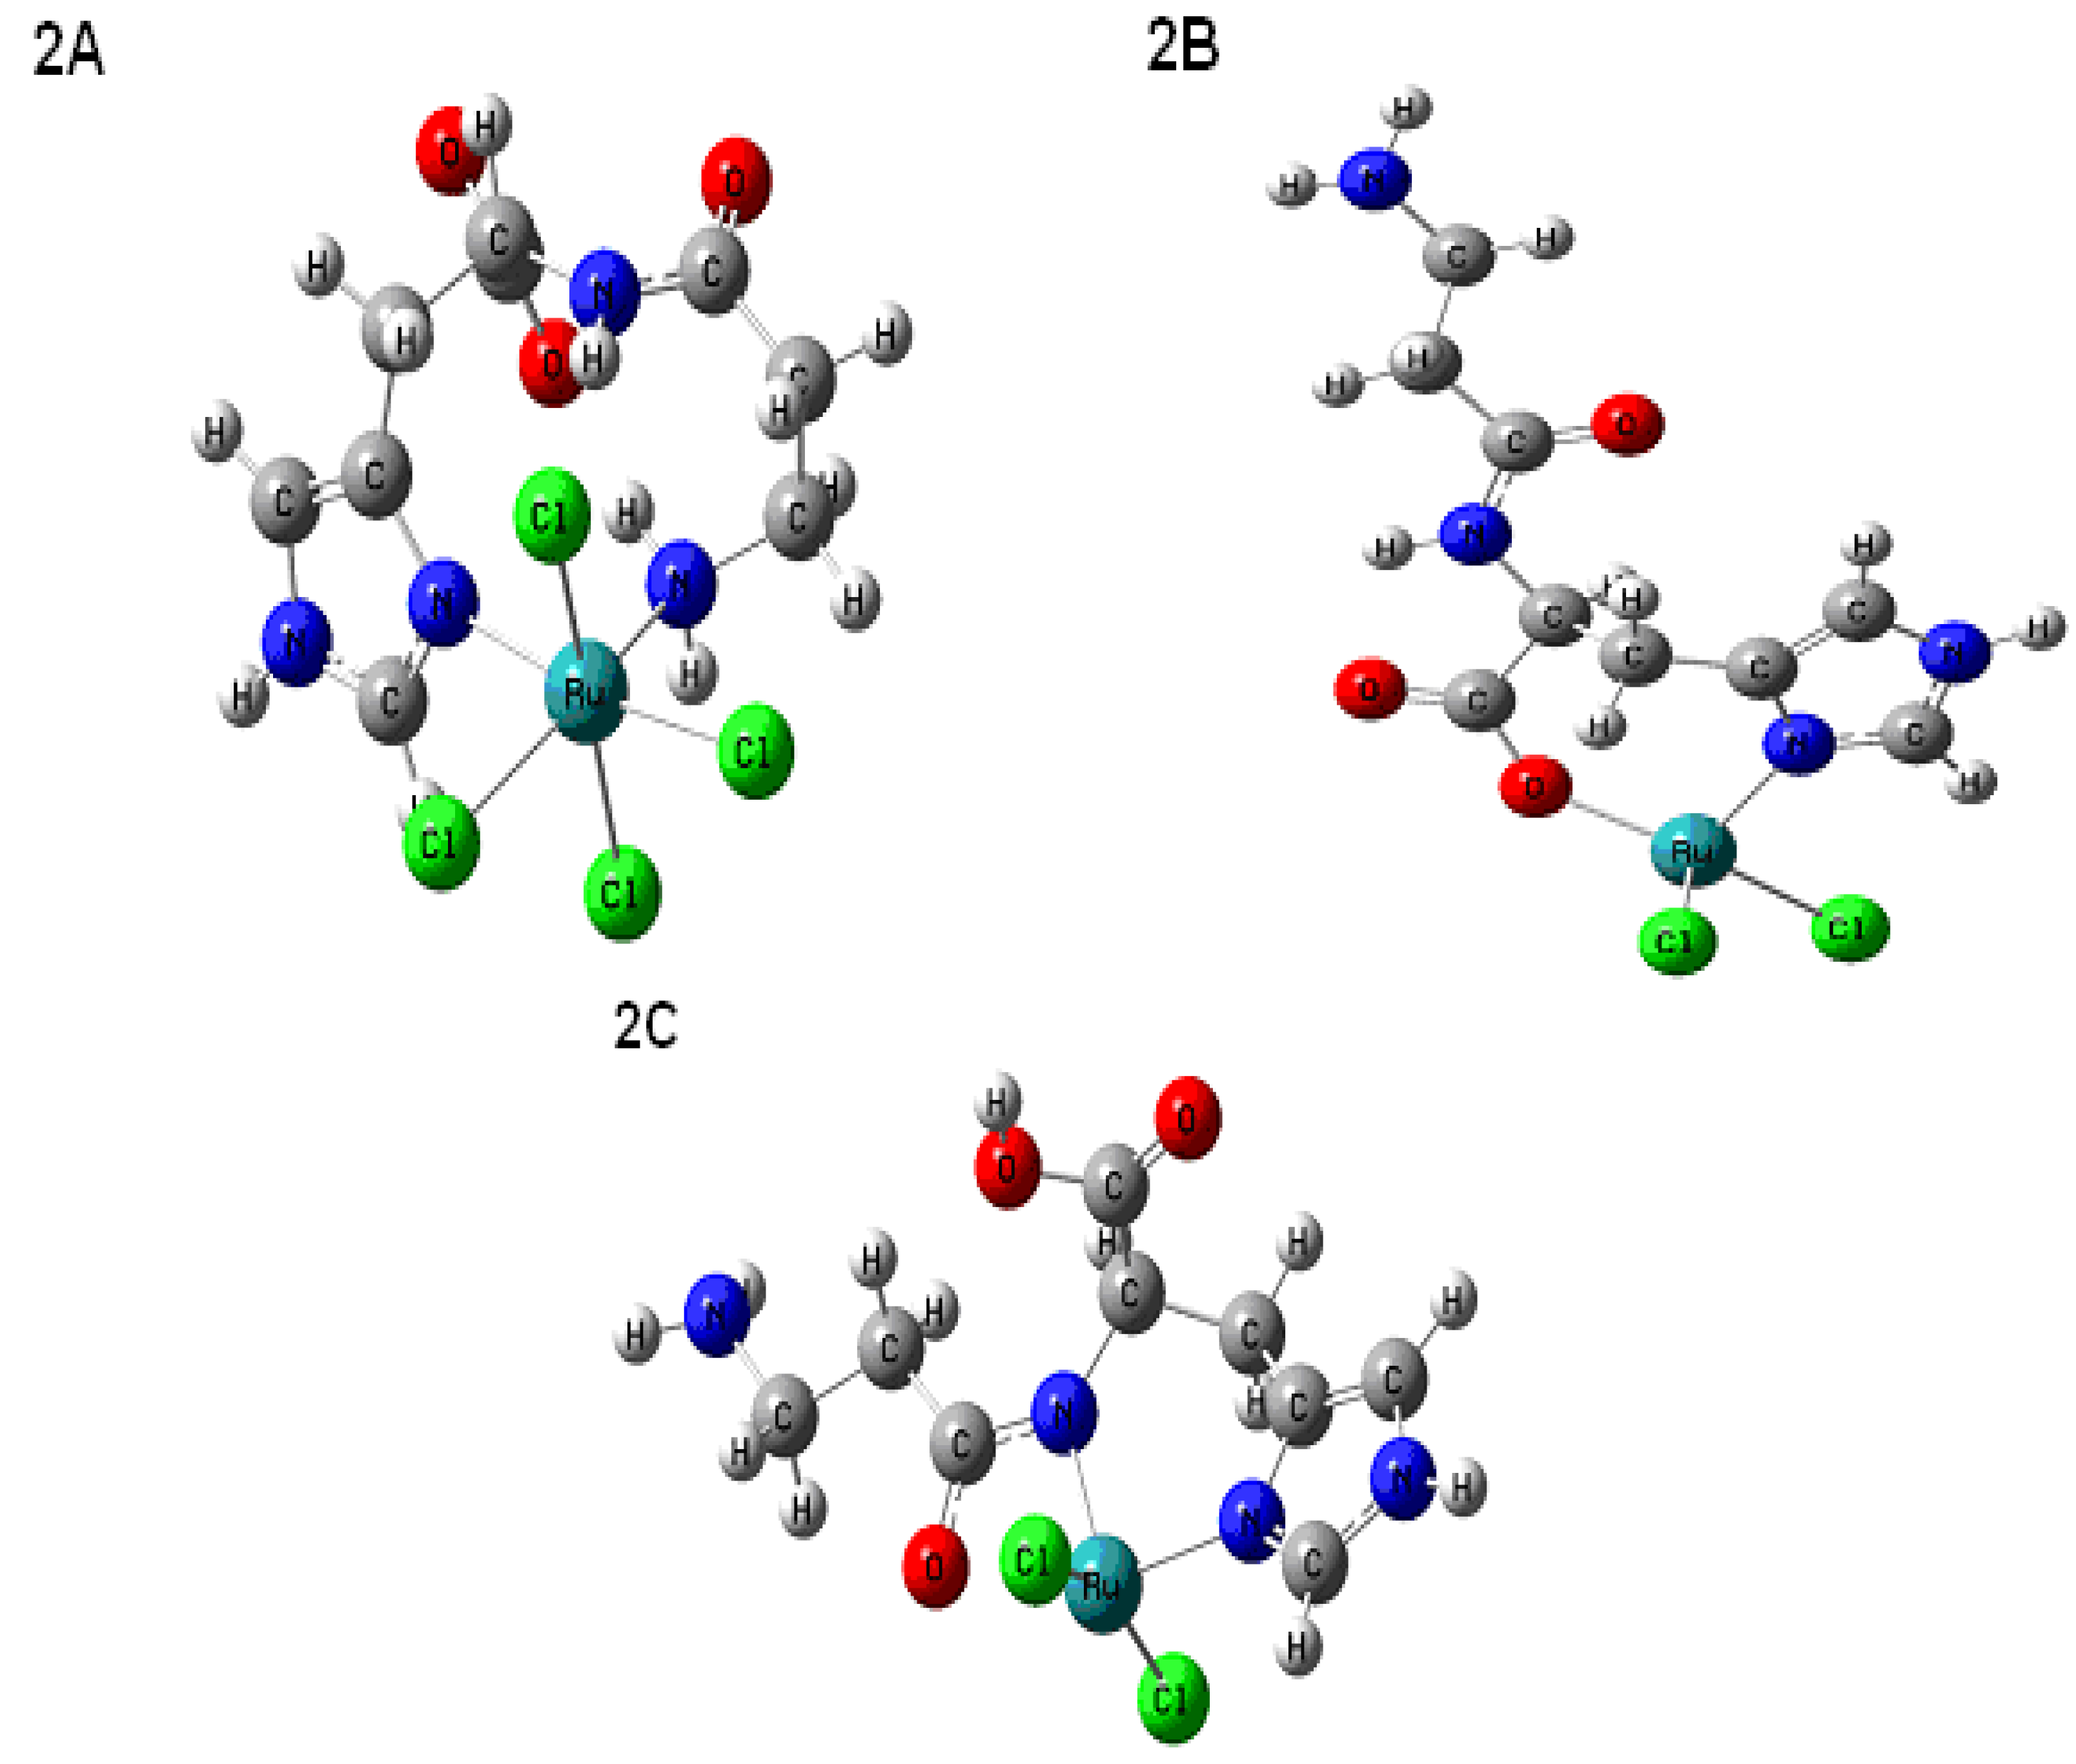
| Experimental δC | Predicted δC 2A | Predicted δC 2B | Predicted δC 2C |
|---|---|---|---|
| 133.57 | 164.7 | 131.6 | 134.1 |
| 129.06 | 140 | 130.5 | 132.2 |
| 117.1 | 110.8 | 115.2 | 110.6 |
| 26.57 | 29.3 | 25.1 | 23.4 |
| 52.7, 52.6 | 54.2 | 55.1 | 55 |
| 174.5 | 180.1 | 176 | 184.5 |
| 172.0, 171.96 | 177.6 | 172.7 | 175 |
| 35.7 | 41 | 36.3 | 32.1 |
| 31.88 | 29.4 | 33.2 | 30.4 |
| Experimental δH | Predicted δH 2A | Predicted δH 2B | Predicted δH 2C |
| 8.6(s) | 25.8 | 8.8 | 6.3 |
| 3.2–3.3(m) | 4.5 | 3.33 | 3.7 |
| 3.1–3.3(m) | 4.22–4.42 | 3.25–3.32 | 3.1–3.6 |
| 7.4 | 8.8 | 6.6 | 5.6 |
| 7.6 | 16.3 | 7.9 | -- |
| 2.6–3.4(m) | 1.1–5.9 (CH2) | 1.2–2.5 (CH2) | 1.3–2.4(CH2) |
| 8.4(s) | 9.5 | 7.3 | 6.85 |
| 6.4 | 5.8 | ||
| Experimental cm−1 | Predicted cm−1 2A | Predicted cm−1 2B | Predicted cm−1 2C |
| 1723(C=N) | |||
| ----- | 1692 | 1647 (acid C=O) | 1704 |
| 1647 | 1671 | 1638 | 1506 |
| 1544 | |||
| 1400 | ------- | 1408 | ----- |
| 1321 | 1331 | 1322 | 1351 |
| 1237 | 1193 | 1228 | ---- |
| 1105 | 1121 | 1114 | 1243 |
3. Experimental
3.1. Materials
3.2. Synthesis of the Complexes
3.2.1. Characterization of L-Carnosine (2-[(3-Aminopropanoyl)amino]-3-(1H-imidazol-5-yl)propanoic Acid)
3.2.2. Synthesis of the Complexes
3.3. Physical Measurements
3.3.1. Differential Scanning Calorimetry/Thermogravimetric Analysis (DSC/TGA)
3.3.2. Cyclic Voltammetry
3.3.3. UV-Vis Spectroscopy
3.3.4. Infrared Spectroscopy
3.3.5. Nuclear Magnetic Resonance Spectroscopy
3.4. Computational Methods
4. Conclusions
Acknowledgements
References
- Gariballa, S.E.; Sinclair, A.J. Carnosine: Physiological properties and therapeutic potential. Age Ageing 2000, 29, 207–210. [Google Scholar] [CrossRef]
- Holliday, R.; McFarland, G.A. A role of carnosine in cellular maintenance. Biochemistry (Mosc.) 2000, 65, 843–848. [Google Scholar]
- Fouad, A.A; Morsy, M.A.; Gomaa, W. Protective effect of carnosine against cisplatin-induced nephrotoxicity in mice. Environ. Toxicol. Pharmacol. 2008, 25, 292–297. [Google Scholar]
- Decker, E.A.; Livisay, S.A.; Zhou, S. A reevaluation of the antioxidant activity of purified carnosine. Biochemistry (Mosc.) 2000, 65, 766–770. [Google Scholar]
- Diez, R.P.; Baran, E.J. A density functional study of some physical properties of carnosine (N-β-alanyl-L-histidine). J. Mol. Struct. 2003, 621, 245–251. [Google Scholar]
- Quinn, P.J.; Boldyrev, A.A.; Formazuyk, V.E. Carnosine: Its properties, functions, and potential therapeutic applications. Mol. Aspects Med. 1992, 13, 379–444. [Google Scholar] [CrossRef]
- Baran, E.J. Metal complexes of carnosine. Biochemistry (Mosc.) 2000, 65, 789–797. [Google Scholar]
- Itoh, H.; Yamane, T.; Ashida, T.; Kakudo, M. Carnosine (β-alanyl-L-histidine). Acta Cryst. 1977, B33, 2959–2961. [Google Scholar]
- Freeman, H.C.; Szymanski, J.T. Crystallographic studies of metal-peptide complexes. V. (β-alanyl-L-histidinato) copper(II) dihydrate. Acta Cryst. 1967, 22, 406–417. [Google Scholar] [CrossRef]
- Simon, M.O.; Genet, J.P.; Darses, S. Ruthenium Chloride as an Efficient Catalytic Precursor for Hydroarylation Reactions via C-H bond Activation. Org. Lett. 2010, 12, 3038–3041. [Google Scholar]
- Ang, W.H.; Casini, A.; Savi, G.; Dyson, P.J. ChemInform Abstract: Organometallic ruthenium-based antitumor compounds with novel modes of action. ChemInform 2011, 42. [Google Scholar] [CrossRef]
- Clarke, M.J. Ruthenium metallopharmaceuticals. Coord. Chem. Rev. 2003, 236, 209–233. [Google Scholar]
- Allardyce, C.S.; Dorcier, A.; Scolaro, C.; Dyson, P.J. Development of organometallic (organo-transition metal) pharmaceuticals. Appl. Organomet. Chem. 2005, 19, 1–10. [Google Scholar] [CrossRef]
- Levina, A.; Mitra, A.; Lay, P.A. Recent developments in ruthenium anticancer drugs. Metallomics 2009, 1, 458–470. [Google Scholar] [CrossRef]
- Gaggelli, E.; Valensin, G. 1H and 13C NMR Relaxation Investigation of the Calcium Complex of β-Alanyl-L-Histidine (Carnosine) in Aqueous Solution. J. Chem. Soc. Perkin Trans. П 1990, 401-406. [Google Scholar]
- Brown, C.E.; Antholine, W.E. Chelation Chemistry of Carnosine. Evidence that Mixed Complexes May Occur In Vivo. J. Phys. Chem. 1979, 83, 3314–3319. [Google Scholar] [CrossRef]
- Sarkar, A.R.; Sarkar, M. Cadmium(II) Complex with L-Carnosine as a Ligand and the Tautomeric Change of the Imidazole Moiety upon Complexation. J. Chem. Res. (S) 1997, 304-305. [Google Scholar]
- Borodkin, G.S.; Borodkina, I.G.; Garnovskii, A.D. Heteronuclear NMR spectroscopy in the coordination chemistry. Russ. J. Coord. Chem. 2011, 37, 565–571. [Google Scholar] [CrossRef]
- Kohen, R.; Yamamoto, Y.; Cundy, K.C.; Ames, B.N. Antioxidant activity of carnosine, homocarnosine, and anserine present in muscle and brain. Proc. Natl. Acad. Sci. USA 1998, 85, 3175–3179. [Google Scholar]
- Sullivan, B.P.; Salmon, D.J.; Meyer, T.J. Mixed phosphine 2,2'-bipyridine complexes of ruthenium. Inorg. Chem. 1978, 17, 3334–3338. [Google Scholar] [CrossRef]
- Adeloye, A.O.; Ajibade, P.A. High Molar Extinction Coefficient Mono-Anthracenyl Bipyridyl Heteroleptic Ruthenium(II) Complex: Synthesis, Photophysical and Electrochemical Properties. Molecules 2011, 16, 4615–4631. [Google Scholar] [CrossRef]
- Murali, M.; Palaniandavar, M. Synthesis, spectral and electrochemical properties of the mixed ligand ruthenium(II) complexes of bis(pyrid-2yl)-and bis(benzimidazol-2-yl)-dithioether ligands: Effects of an asymmetric diimine co-ligand. Polyhedron 2007, 26, 3980–3992. [Google Scholar] [CrossRef]
- Jakupec, M.A.; Reisner, E.; Eichinger, A.; Pongratz, M.; Arion, V.B.; Galanski, M.; Hartinger, C.G.; Keppler, B.K. Redox-Active Antineoplastic Ruthenium Complexes with Indazole: Correlation of in Vitro Potency and Reduction Potential. J. Med. Chem. 2005, 48, 2831–2837. [Google Scholar]
- Daniele, P.G.; Prenesti, E.; Ostacoli, G. Ultraviolet–circular dichroism spectra for structural analysis of copper(II) complexes with aliphatic and aromatic ligands in aqueous solution. J. Chem. Soc. Dalton Trans. 1996, 3269–3275. [Google Scholar]
- Sigel, H.; Martin, H.R. Coordinating properties of the amide bond. Stability and structure of metal ion complexes of peptides and related ligands. Chem. Rev. 1982, 82, 385–426. [Google Scholar]
- Prenesti, E.; Daniele, P.G.; Prencipe, M.; Ostacoli, G. Spectrum–structure correlation for visible absorption spectra of copper(II) complexes in aqueous solution. Polyhedron 1999, 18, 3233–3241. [Google Scholar] [CrossRef]
- Prenesti, E.; Silvia Berto, S.; Daniele, P.G. Ultraviolet spectrophotometric characterization of copper(II) complexes with imidazole N-methyl derivatives of l-histidine in aqueous solution. Spectrochim. Acta A Mol. Biomol. Spectrosc. 2003, 59, 201–207. [Google Scholar] [CrossRef]
- Torreggiani, A.; Bonora, S.; Fini, G. Raman and IR Spectroscopic Investigation of Zinc(II)–Carnosine Complexes. Biopolymers 2000, 57, 352–364. [Google Scholar] [CrossRef]
- Torreggiani, A.; Taddei, P.; Tinti, A.; Fini, G. Vibrational study on the cobalt binding mode of carnosine. J. Mol. Struct. 2002, 641, 61–70. [Google Scholar] [CrossRef]
- Torreggiani, A.; Tamba, M.; Fini, G. Binding of Copper(II) to Carnosine: Raman and IR Spectroscopy Study. Biopolymers 2000, 57, 149–159. [Google Scholar] [CrossRef]
- Friedrich, J.O.; Wasylishen, R.E. A 1H and 13C nuclear magnetic resonance study of carnosine. Can. J. Chem. 1986, 64, 2132–2138. [Google Scholar] [CrossRef]
- Chatterjee, D. Ruthenium(III)-EDTA type complexes for DNA-metallation. Proc. Indian Acad. Sci. (Chem.Sci.) 1999, 111, 437–442. [Google Scholar]
- Steel, P.J.; Constable, E.C. Synthesis, spectroscopy and electrochemistry of homo, and heteroleptic Ru(II) complexes of new pyrazole- containing bidentate ligands. J. Chem. Soc. Dalton Trans. 1990, 1389–1396. [Google Scholar]
- Wei, Y.; de Dios, A.C.; McDermott, A.E. Solid-State 15N NMR Chemical Shift Anisotropy of Histidines: Experimental and Theoretical Studies of Hydrogen Bonding. J. Am. Chem. Soc. 1999, 121, 10389–10394. [Google Scholar] [CrossRef]
- Lee, K.W.; Eom, K.I.; Park, S.J. Ligand-field properties of histidine on the sharp-line excitation spectrum of trans(imidazole)-bis(L-histidianto-O,N,N’’) chromium(III) nitrate. Inorg. Chim. Acta 1997, 254, 131–136. [Google Scholar] [CrossRef]
- Pavlov, A.R.; Revina, A.A.; Dupin, A.M.; Boldyrev, A.A.; Yaropolov, A.I. Interaction of carnosine with superoxide radicals in aqueous solutions. Bull. Exp. Biol. Med. 1990, 110, 1374–1378. [Google Scholar] [CrossRef]
- Drozdzewski, P.; Musiała, M. Synthesis and vibrational spectroscopy of new palladium(II) complexes with 2-hydrazino-2-imidazoline. Band assignment based on isotope substitution and density functional calculations. J. Mol. Struct. 2004, 704, 145–153. [Google Scholar] [CrossRef]
- Frisch, M.J.; Trucks, G.W.; Schlegel, H.B.; Scuseria, G.E.; Robb, M.A.; Cheeseman, J.R. Zakrzewski, V.G.; Montgomery, J.A., Jr.; Stratmann, R.E.; Burant, J.C.; Dapprich, S.; Millam, J.M.; Daniels, A.D.; Kudin, K.N.; Strain, M.C.; Farkas, O.; Tomasi, J.; Barone, V.; Cossi, M.; Cammi, R.; Mennucci, B.; Pomelli, C.; Adamo, C.; Clifford, S.; Ochterski, J.; Petersson, G.A.; Ayala, P.Y.; Cui, Q.; Morokuma, K.; Malick, D.K.; Rabuck, A.D.; Raghavachari, K.; Foresman, J.B.; Cioslowski, J.; Ortiz, J.V.; Baboul, A.G.; Stefanov, B.B.; Liu, G.; Liashenko, A.; Piskorz, P.; Komaromi, I.; Gomperts, R.; Martin, R.L.; Fox, D.J.; Keith, T.; Al-Laham, M.A.; Peng, C.Y.; Nanayakkara, A.; Challacombe, M.; Gill, P.M.W.; Johnson, B.; Chen, W.; Wong, M.W.; Andres, J.L.; Gonzalez, C.; Head-Gordon, M.; Replogle, E.S.; Pople, J.A. GAUSSIAN 98, Revision A.9; Gaussian, Inc.: Pittsburgh, PA, USA, 1998. [Google Scholar]
- Sample Availability: Samples of the compounds are available upon written request from the authors.
© 2011 by the authors; licensee MDPI, Basel, Switzerland. This article is an open access article distributed under the terms and conditions of the Creative Commons Attribution license ( http://creativecommons.org/licenses/by/3.0/).
Share and Cite
Branham, M.L.; Singh, P.; Bisetty, K.; Sabela, M.; Govender, T. Preparation, Spectrochemical, and Computational Analysis of L-Carnosine (2-[(3-Aminopropanoyl)amino]-3-(1H-imidazol-5-yl)propanoic Acid) and Its Ruthenium (II) Coordination Complexes in Aqueous Solution. Molecules 2011, 16, 10269-10291. https://doi.org/10.3390/molecules161210269
Branham ML, Singh P, Bisetty K, Sabela M, Govender T. Preparation, Spectrochemical, and Computational Analysis of L-Carnosine (2-[(3-Aminopropanoyl)amino]-3-(1H-imidazol-5-yl)propanoic Acid) and Its Ruthenium (II) Coordination Complexes in Aqueous Solution. Molecules. 2011; 16(12):10269-10291. https://doi.org/10.3390/molecules161210269
Chicago/Turabian StyleBranham, Michael Lee, Parvesh Singh, Krishna Bisetty, Myalo Sabela, and Thirumala Govender. 2011. "Preparation, Spectrochemical, and Computational Analysis of L-Carnosine (2-[(3-Aminopropanoyl)amino]-3-(1H-imidazol-5-yl)propanoic Acid) and Its Ruthenium (II) Coordination Complexes in Aqueous Solution" Molecules 16, no. 12: 10269-10291. https://doi.org/10.3390/molecules161210269
APA StyleBranham, M. L., Singh, P., Bisetty, K., Sabela, M., & Govender, T. (2011). Preparation, Spectrochemical, and Computational Analysis of L-Carnosine (2-[(3-Aminopropanoyl)amino]-3-(1H-imidazol-5-yl)propanoic Acid) and Its Ruthenium (II) Coordination Complexes in Aqueous Solution. Molecules, 16(12), 10269-10291. https://doi.org/10.3390/molecules161210269