
A Geospatial Approach to Energy Planning in Aid of Just Energy Transition in Small Island Communities in the Philippines

 ,
,  , and
, and
Abstract
:1. Introduction
1.1. Background
1.2. Literature Review
2. Materials and Methods
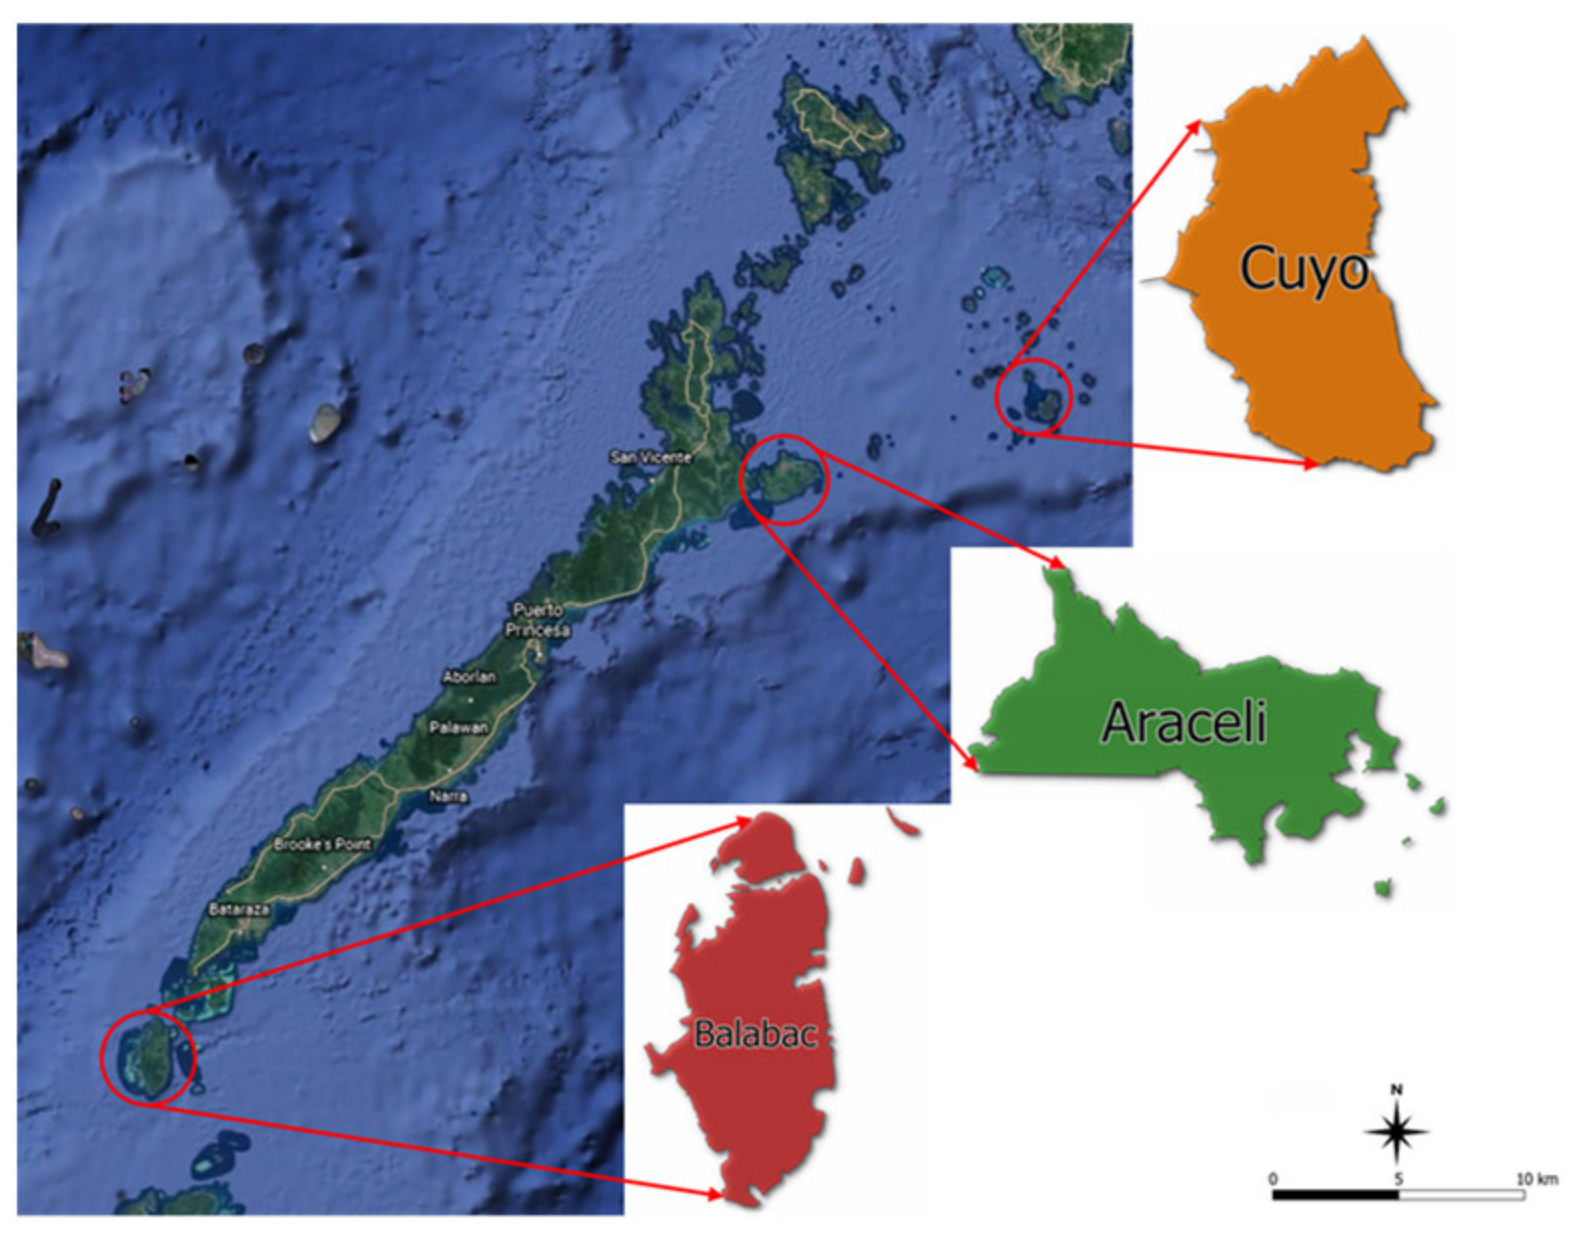
2.1. Study Sites
2.2. Data Collection and Georeferencing
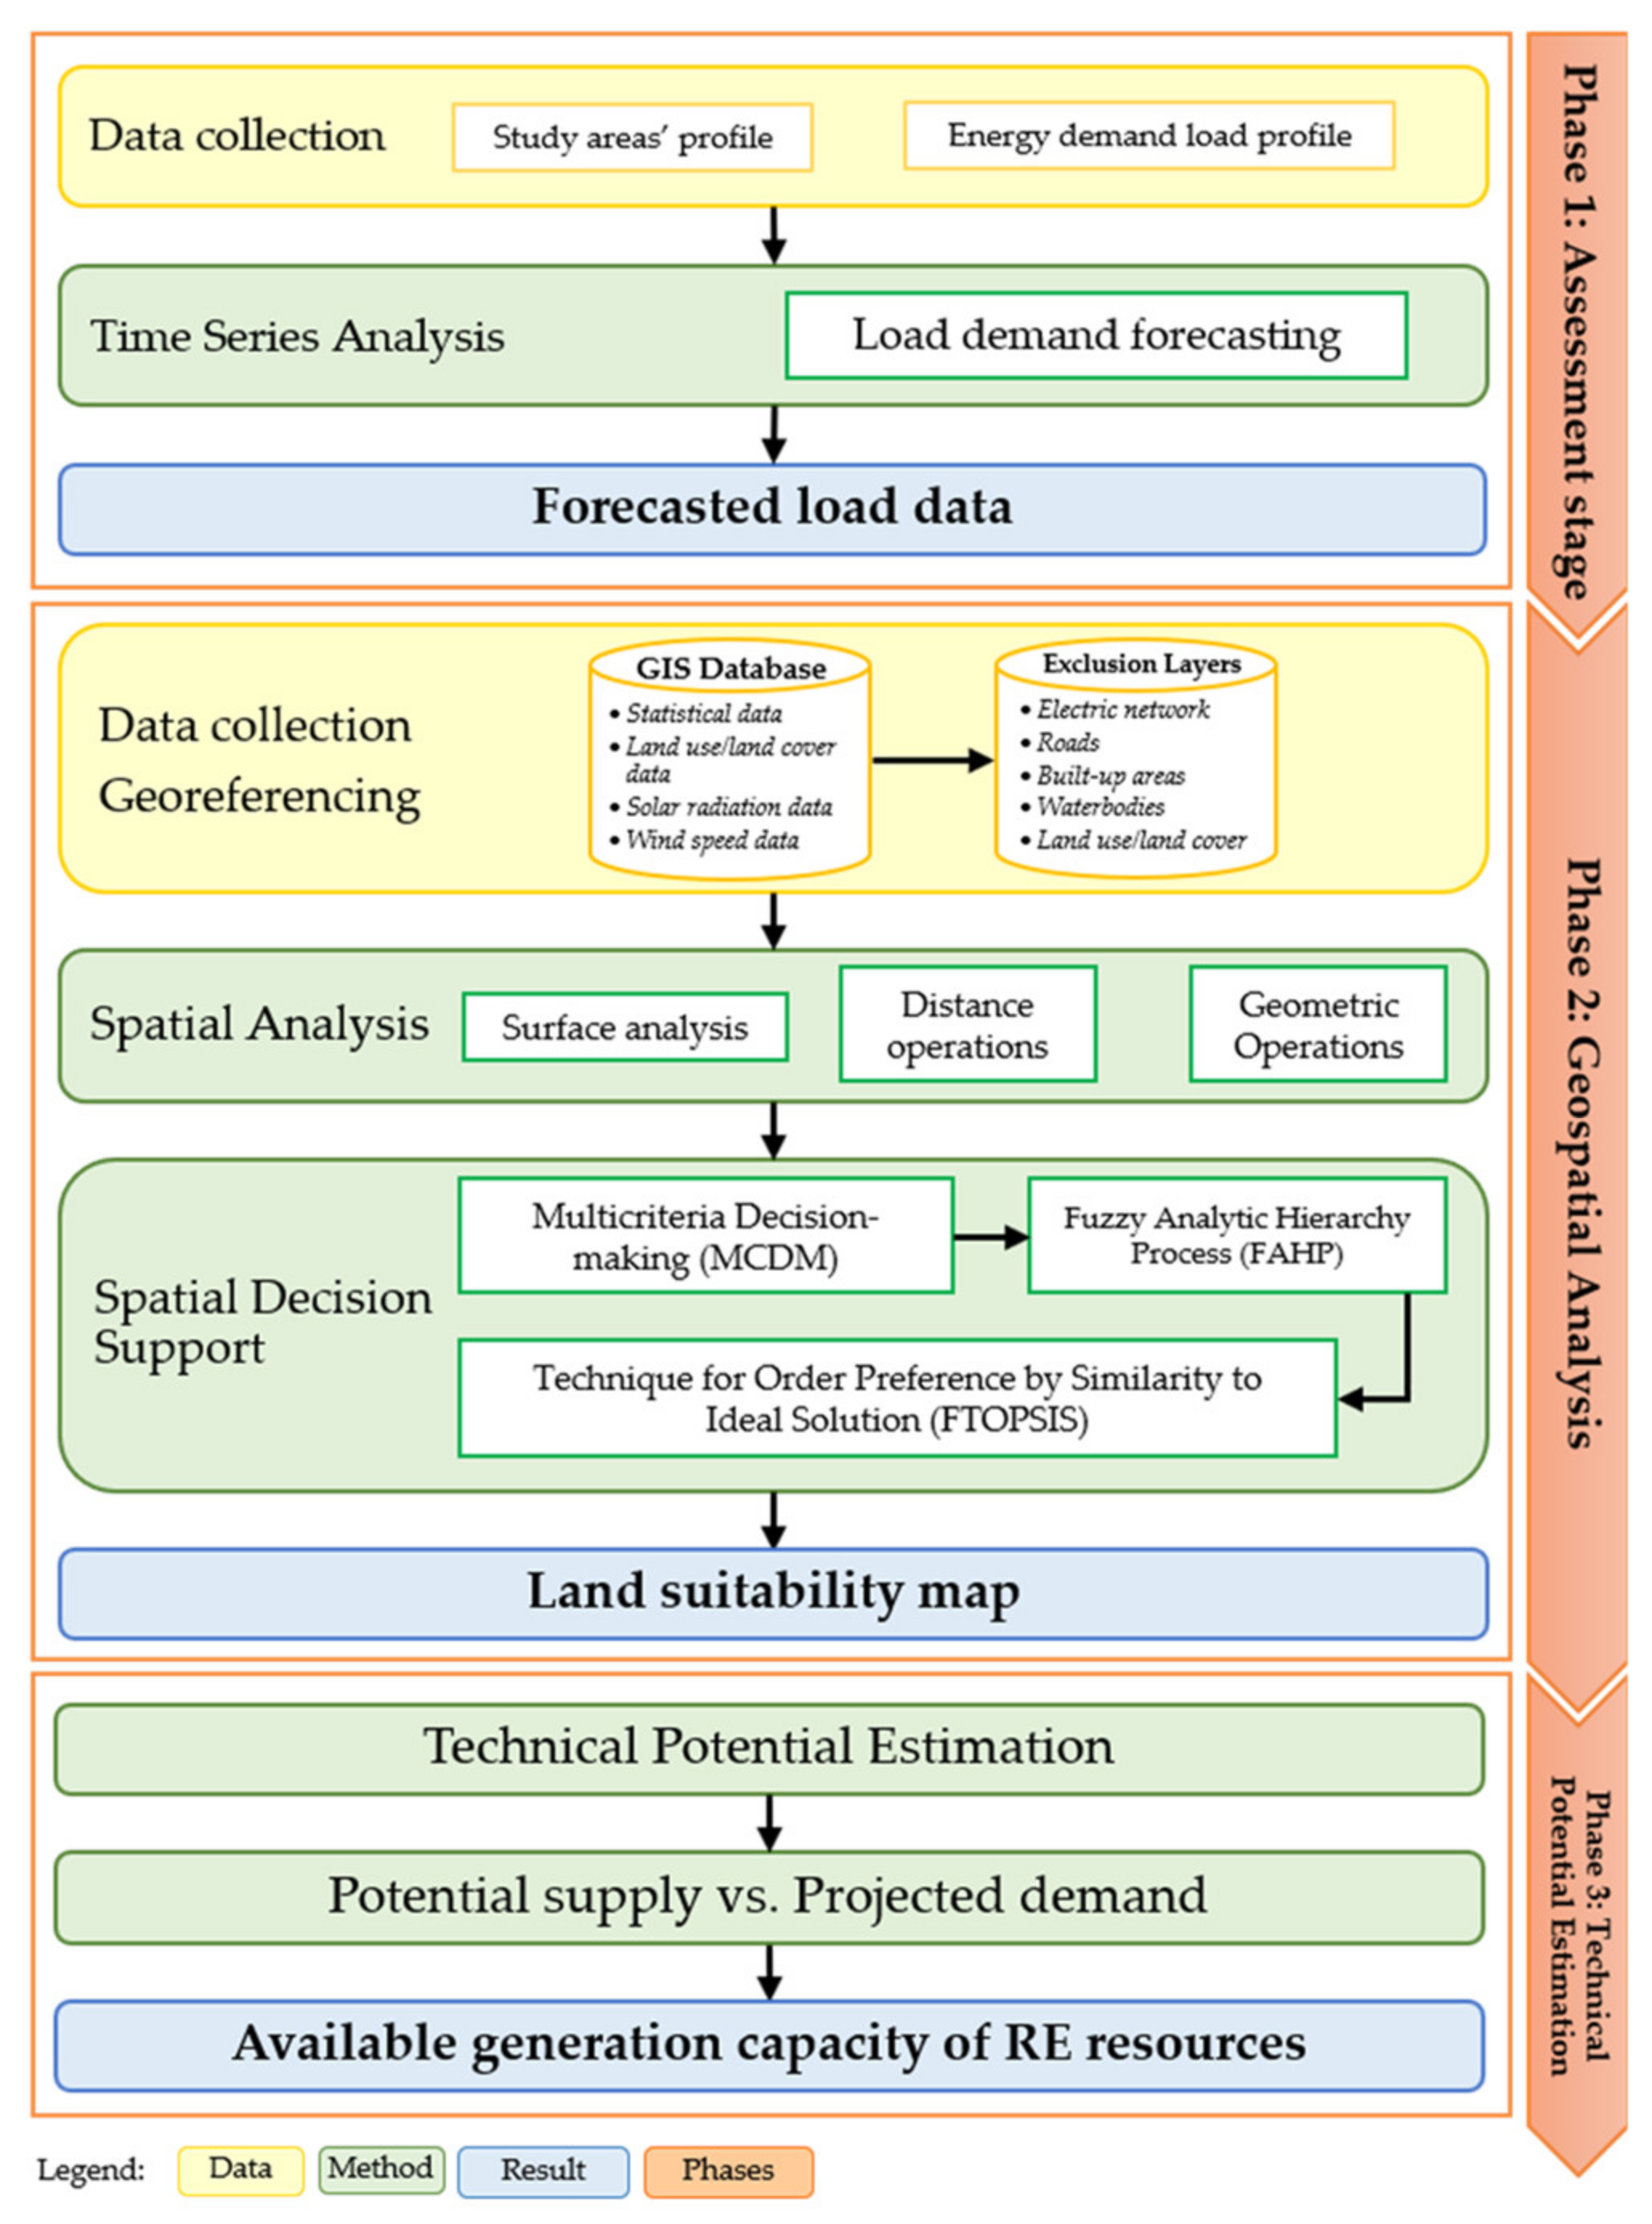
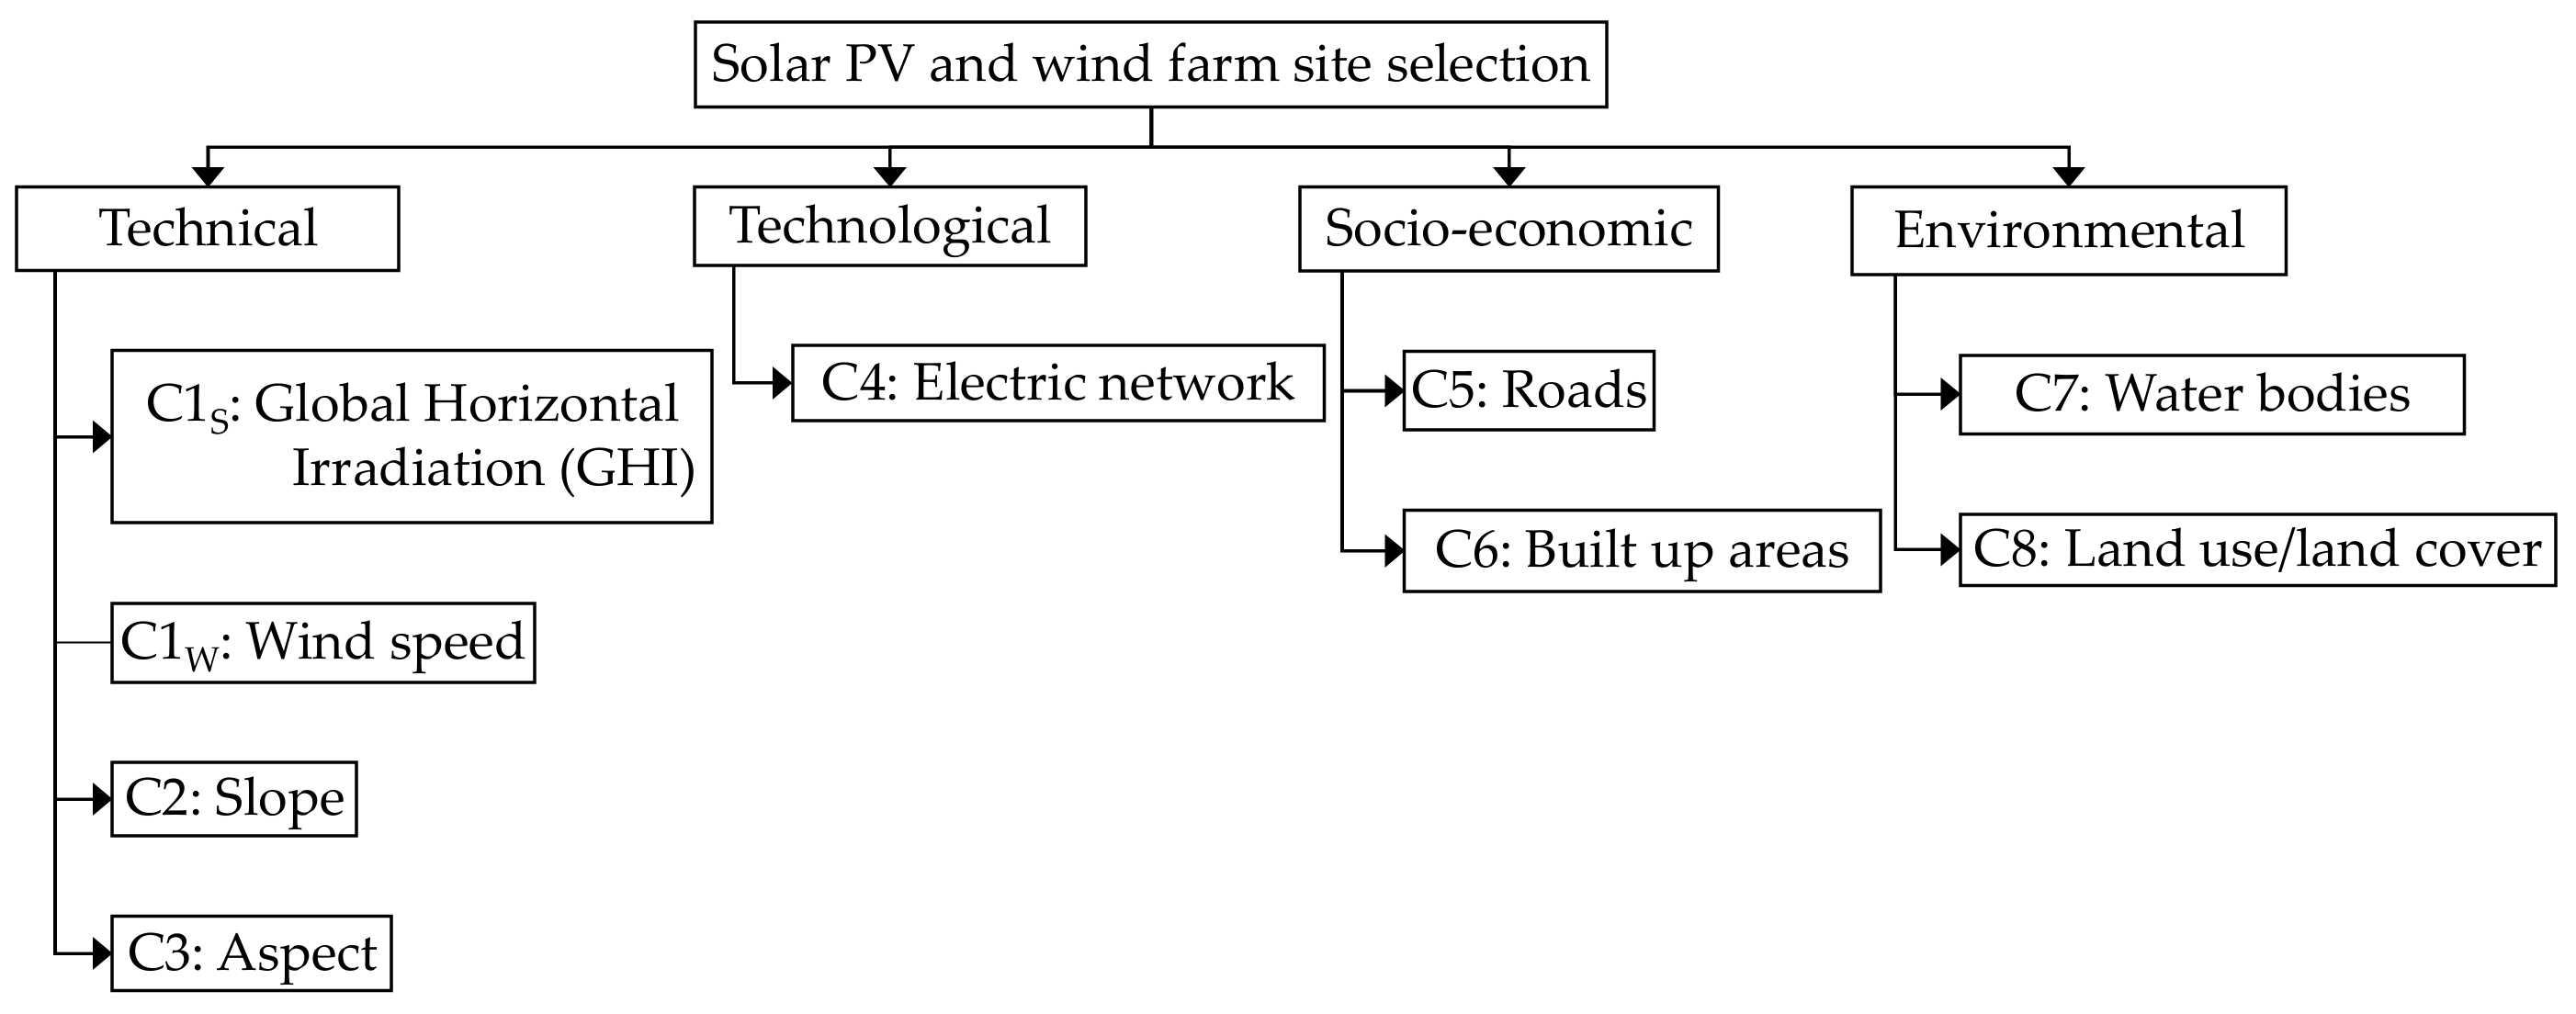
2.3. Research Framework
2.3.1. Assessment Stage
2.3.2. Geospatial Analysis
- Spatial Analysis
- b.
- Spatial Decision Support
- Fuzzy AHP Method
- Step 1.
- Determine the goal, alternatives, and criteria.
- Step 2.
- Create a pairwise comparison matrix (PCM) using Equation (1), where n is the number of criteria, wi denotes the weight for the i criterion, and aij is the ratio of the weight of i and j criteria.where i, j = 1, 2, …, n.
- Step 3.
- Convert Saaty’s numerical scale into a triangular fuzzy number (TFN). The FAHP scale has three values, the lower limit (l), medium limit (m), and the upper limit (u). Table 3 shows the linguistic values and the TFNs.
- Step 4.
- Calculate the geometric mean using Equation (3), where lij, mij, uij are geometric means in the TFN scale, and k is the number of decision-makers. The TFN matrix is consistent if the value of l ≤ m ≤ u.
- Step 5.
- When the AHP numerical scale has been converted to FAHP scale values, calculate the fuzzy synthesis value (Si) given by Equations (4)–(6):
- Step 6.
- The last step is to calculate the crisp weights. It can be obtained through a defuzzification process as defined by:
- Step 7.
- Calculate the eigenvector, maximum eigenvalue, Consistency Index (CI), and the consistency ratio (CR) using Equations (8)–(10), where λmax is the eigenvalue of paired comparison matrix, and RI is for random index (Table 4).
- TOPSIS Method
- Step 1.
- Create a decision matrix (D) containing all the criteria, alternatives, and criteria weights.
- Step 2.
- Calculate the normalized decision matrix (Xij) using the following equation:
- Step 3.
- Calculate the weighted normalized decision matrix (Xij) by multiplying the normalized decision matrix (Xij) by the weight (wj) of the indicator that came from the fuzzy AHP.
- Step 4.
- Determine the positive and negative ideal solution. The positive ideal solution (A+) is the maximum value of Vij, and the negative ideal solution (A−) is the minimum value.
- Step 5.
- Calculate the Euclidean distance of each alternative from positive and negative ideal solutions (A+, A−).
- Step 6.
- Calculate the performance score (CP) of each alternative to the positive ideal solution (A+).
- Step 7.
- Rank the alternatives according to the performance score, where the shortest distance is the positive ideal solution, and the farthest distance is the negative ideal solution.
2.3.3. Technical Potential Estimation
3. Results
3.1. Assessment Stage
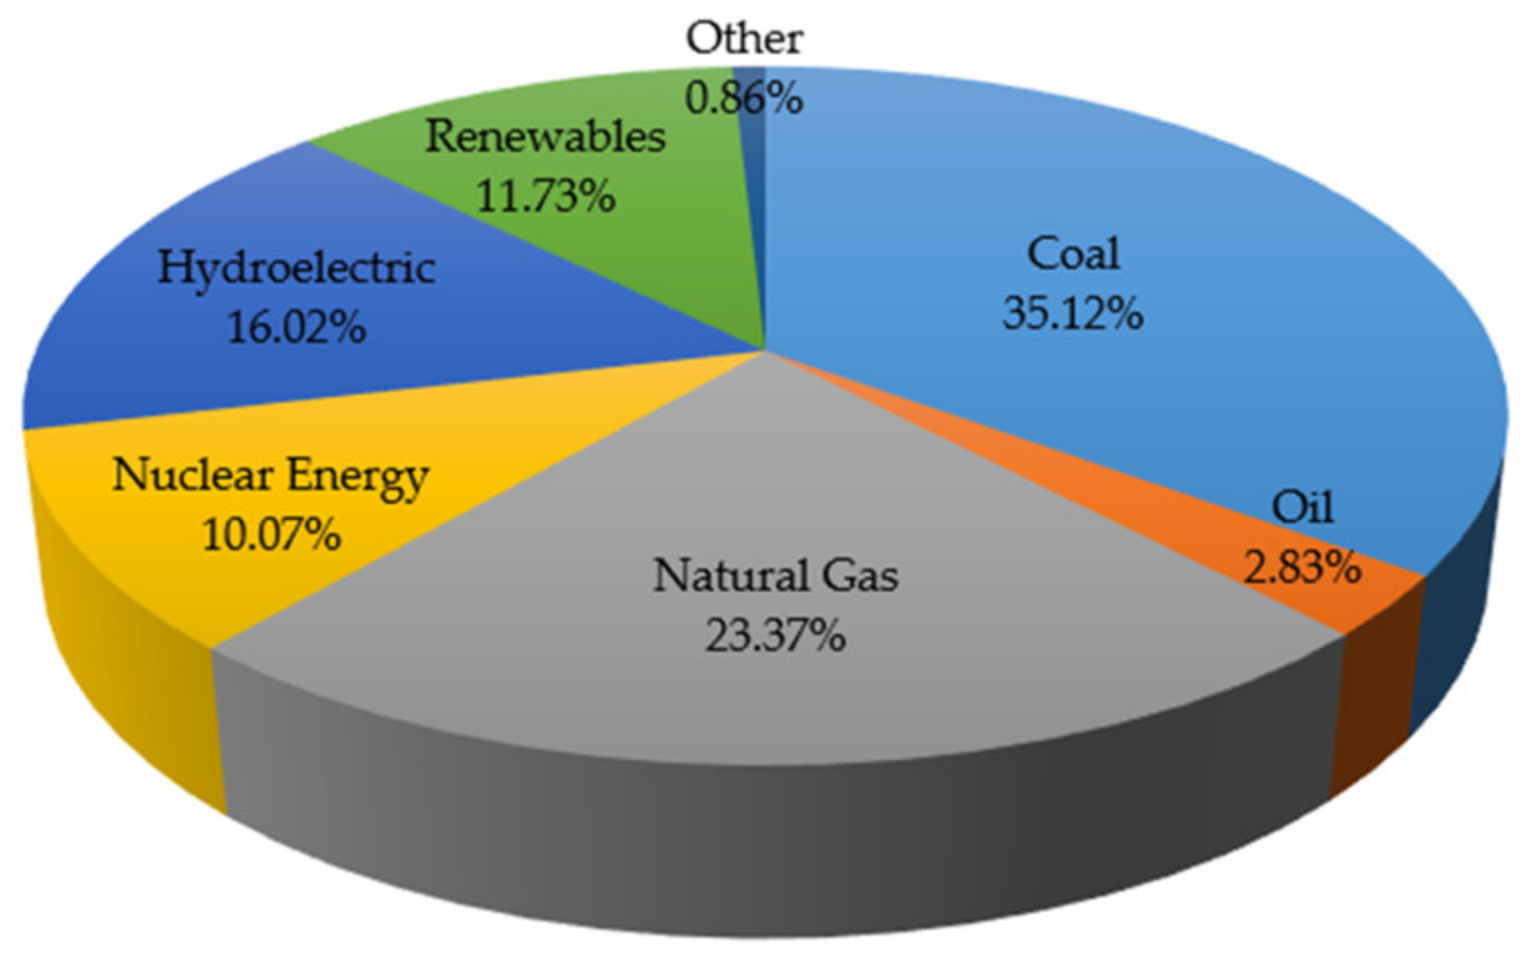
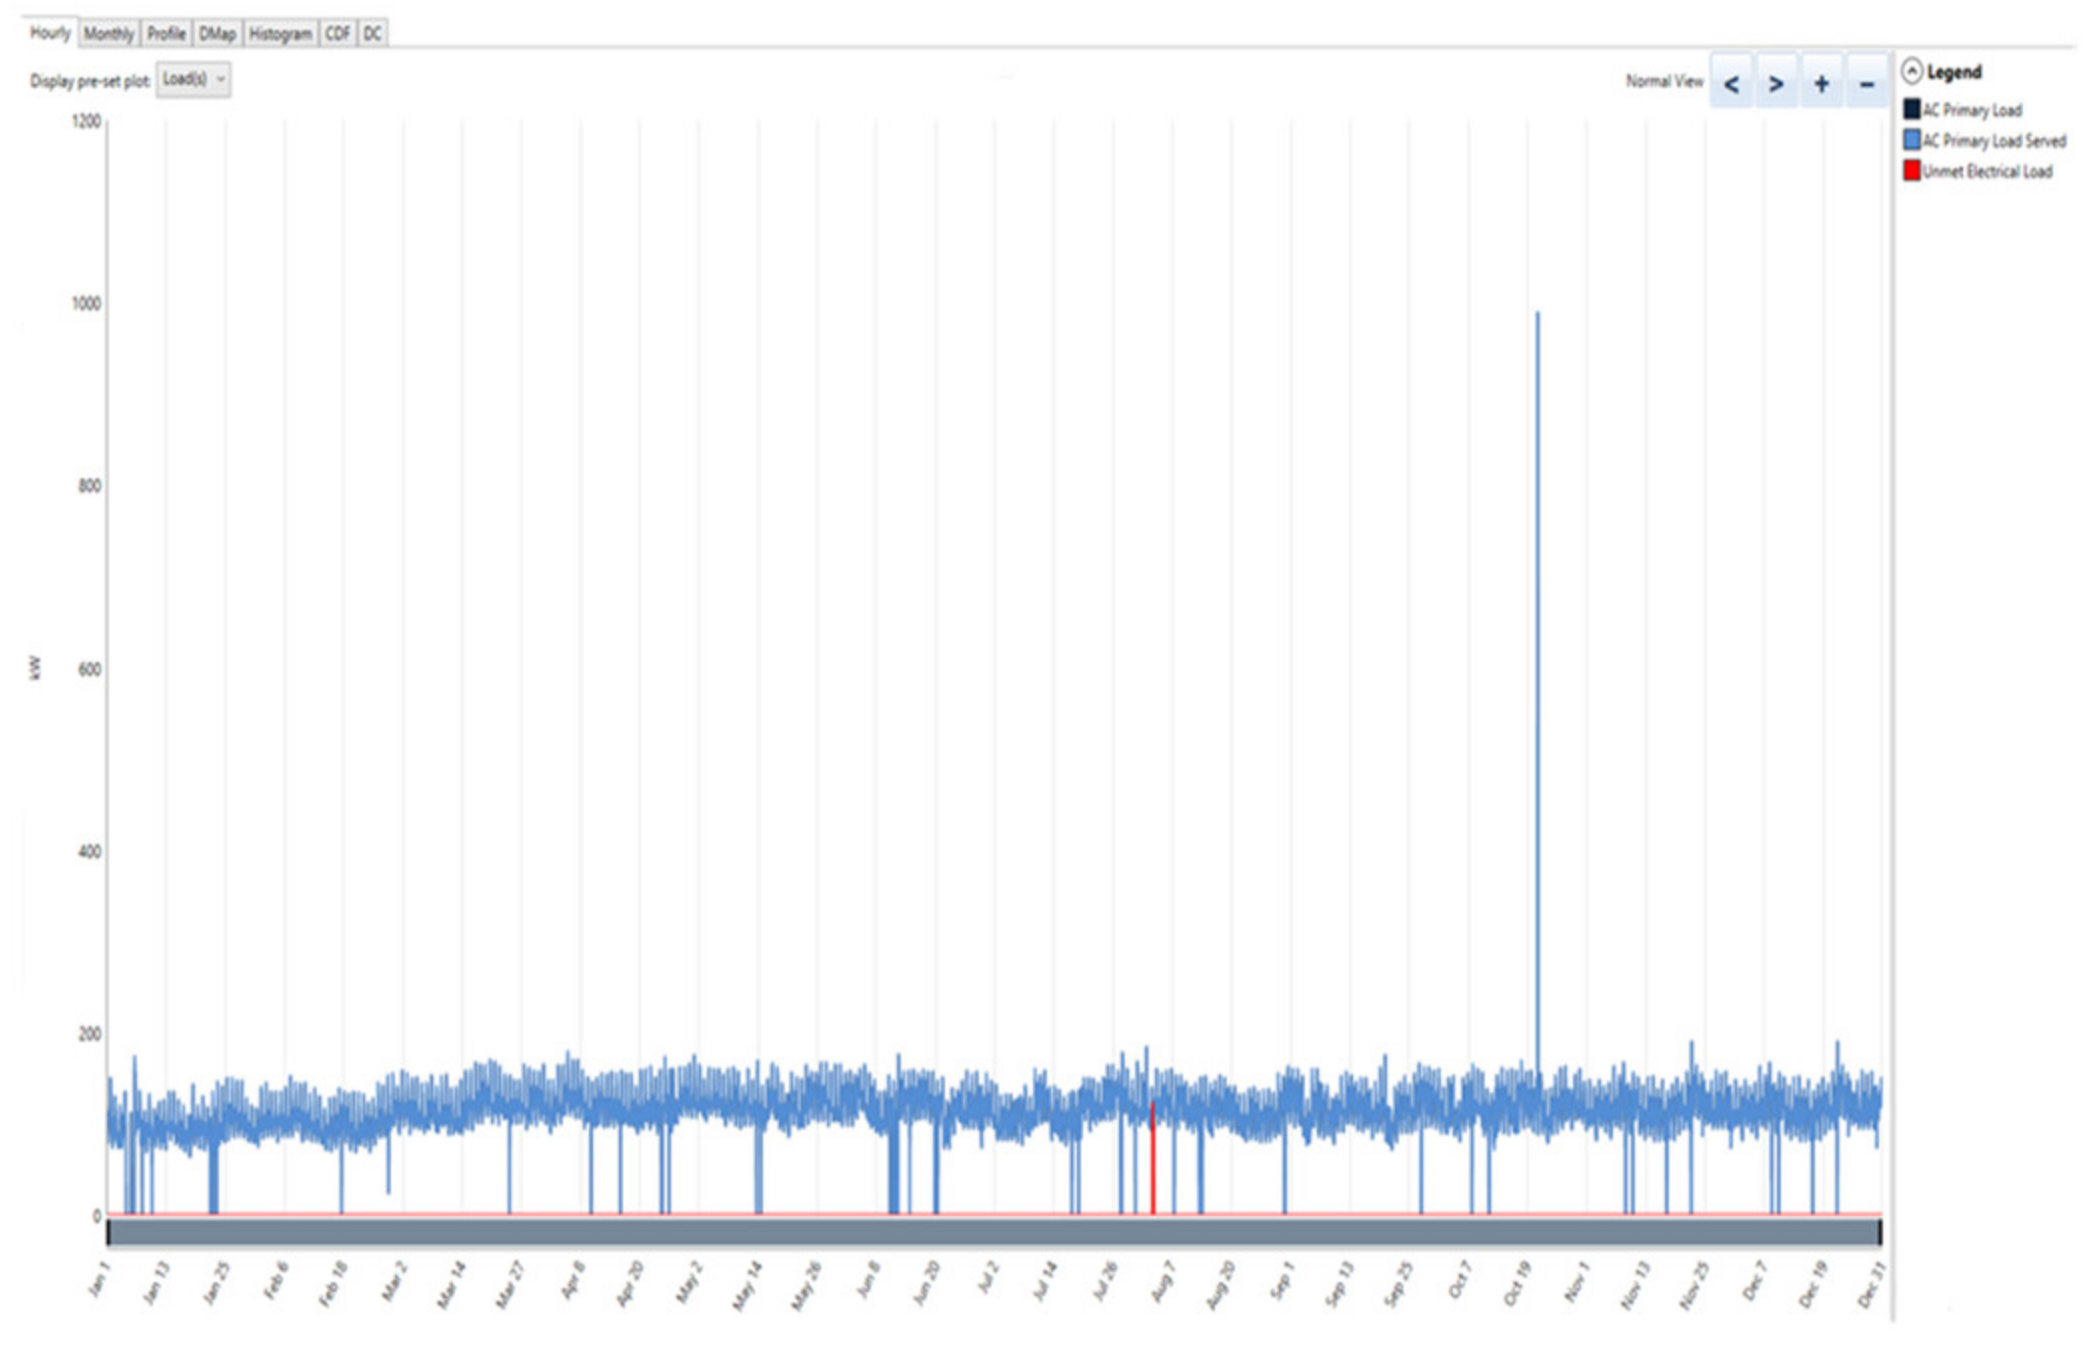
3.1.1. Current Energy Profile of the Case Areas
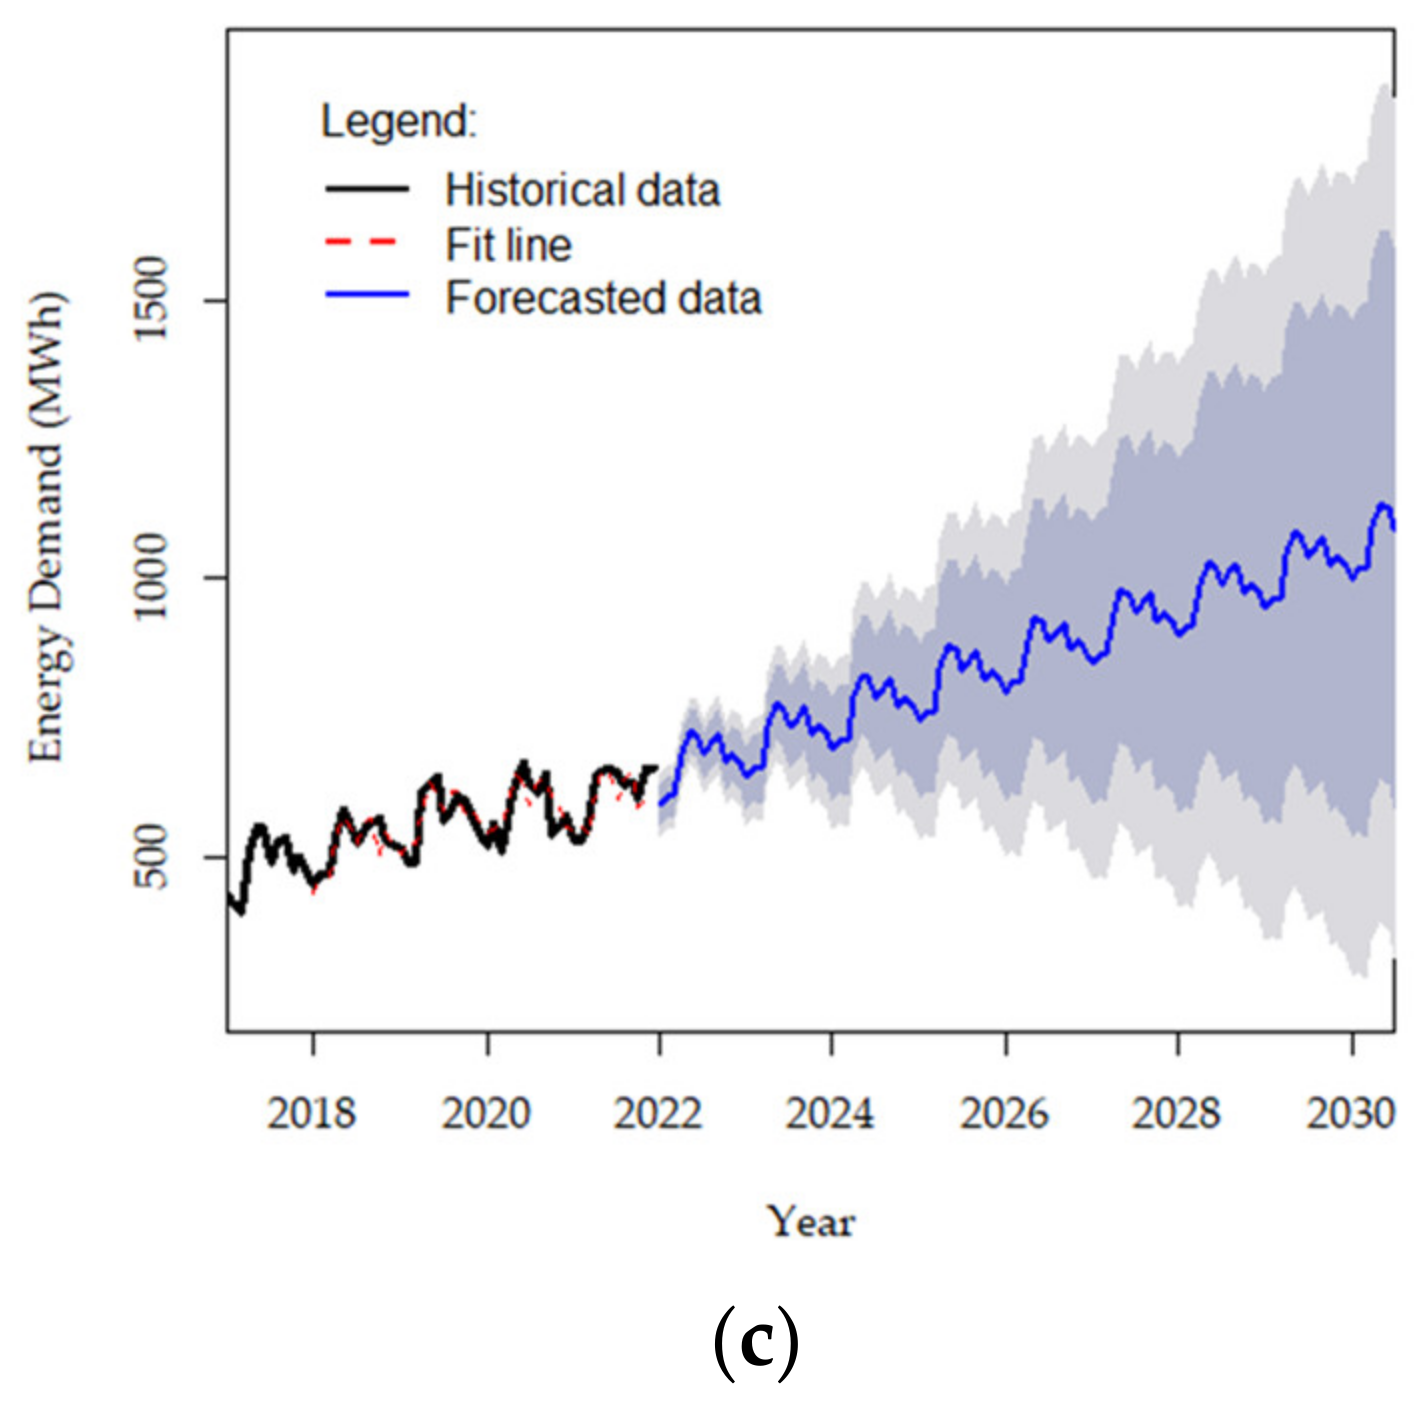
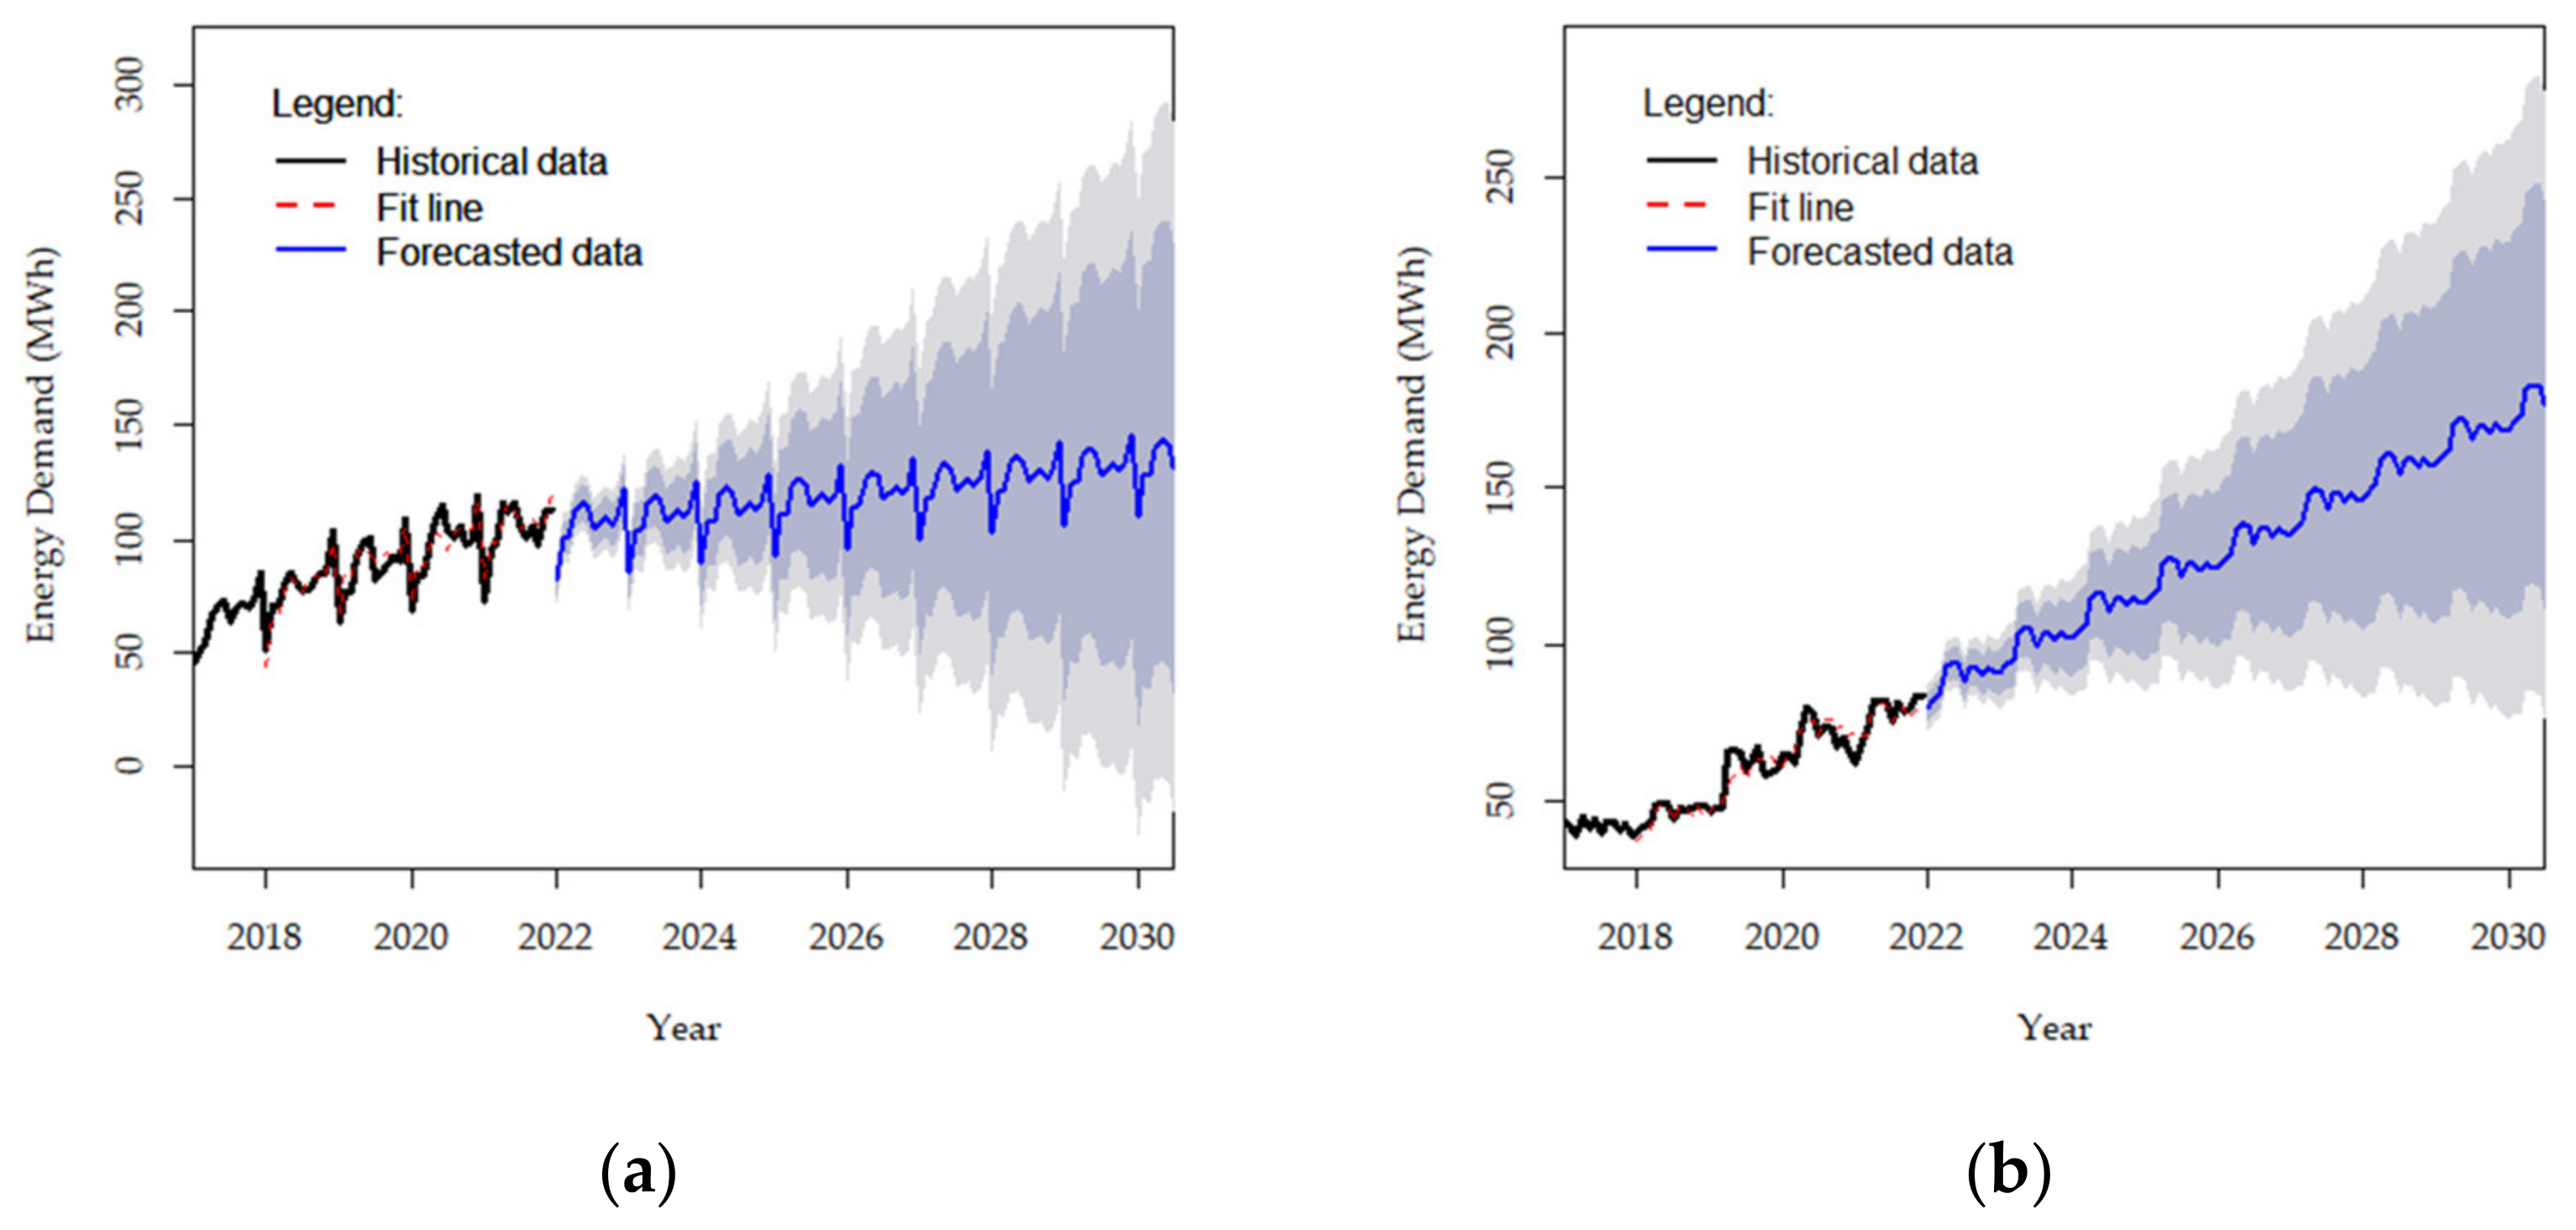
3.1.2. Load Forecasting
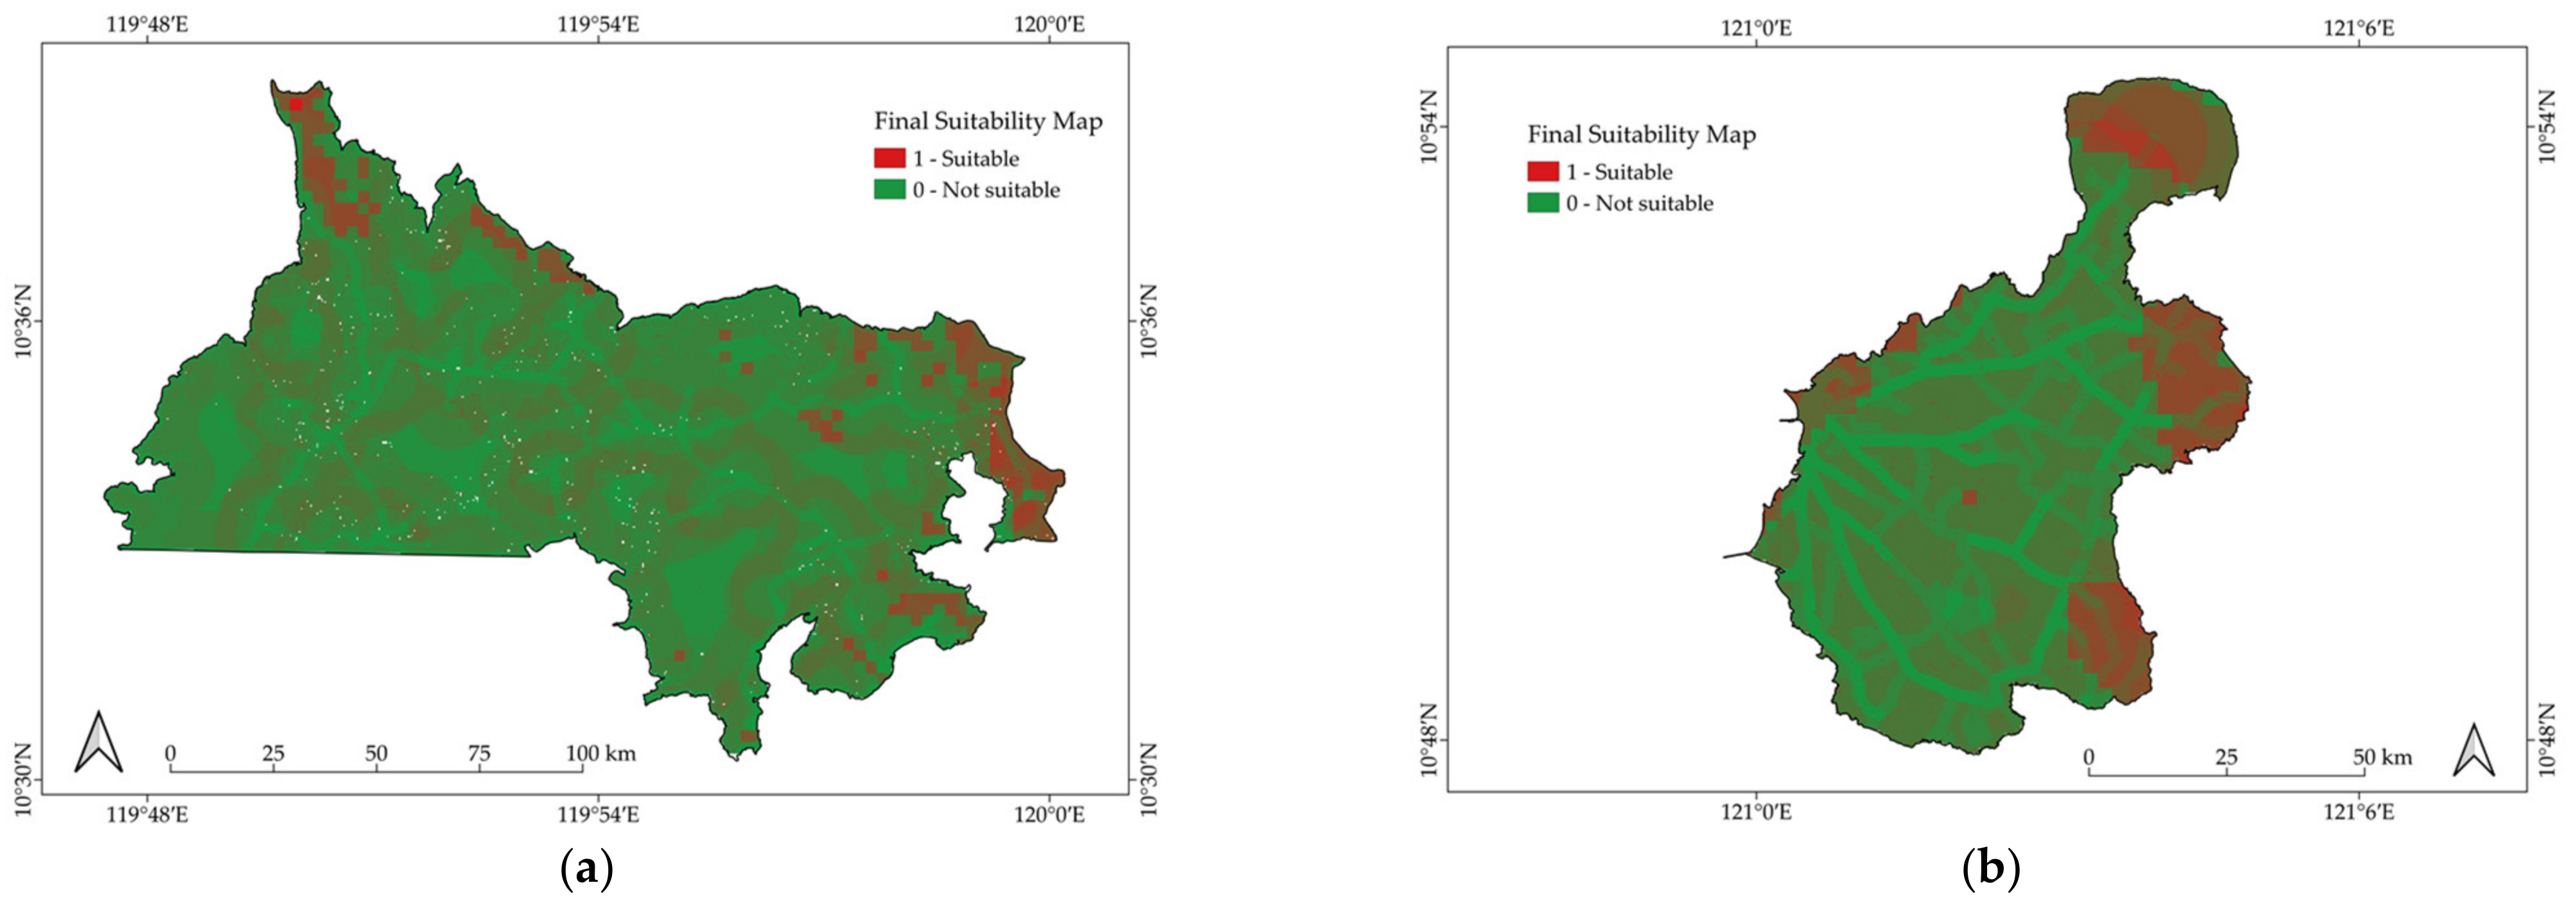
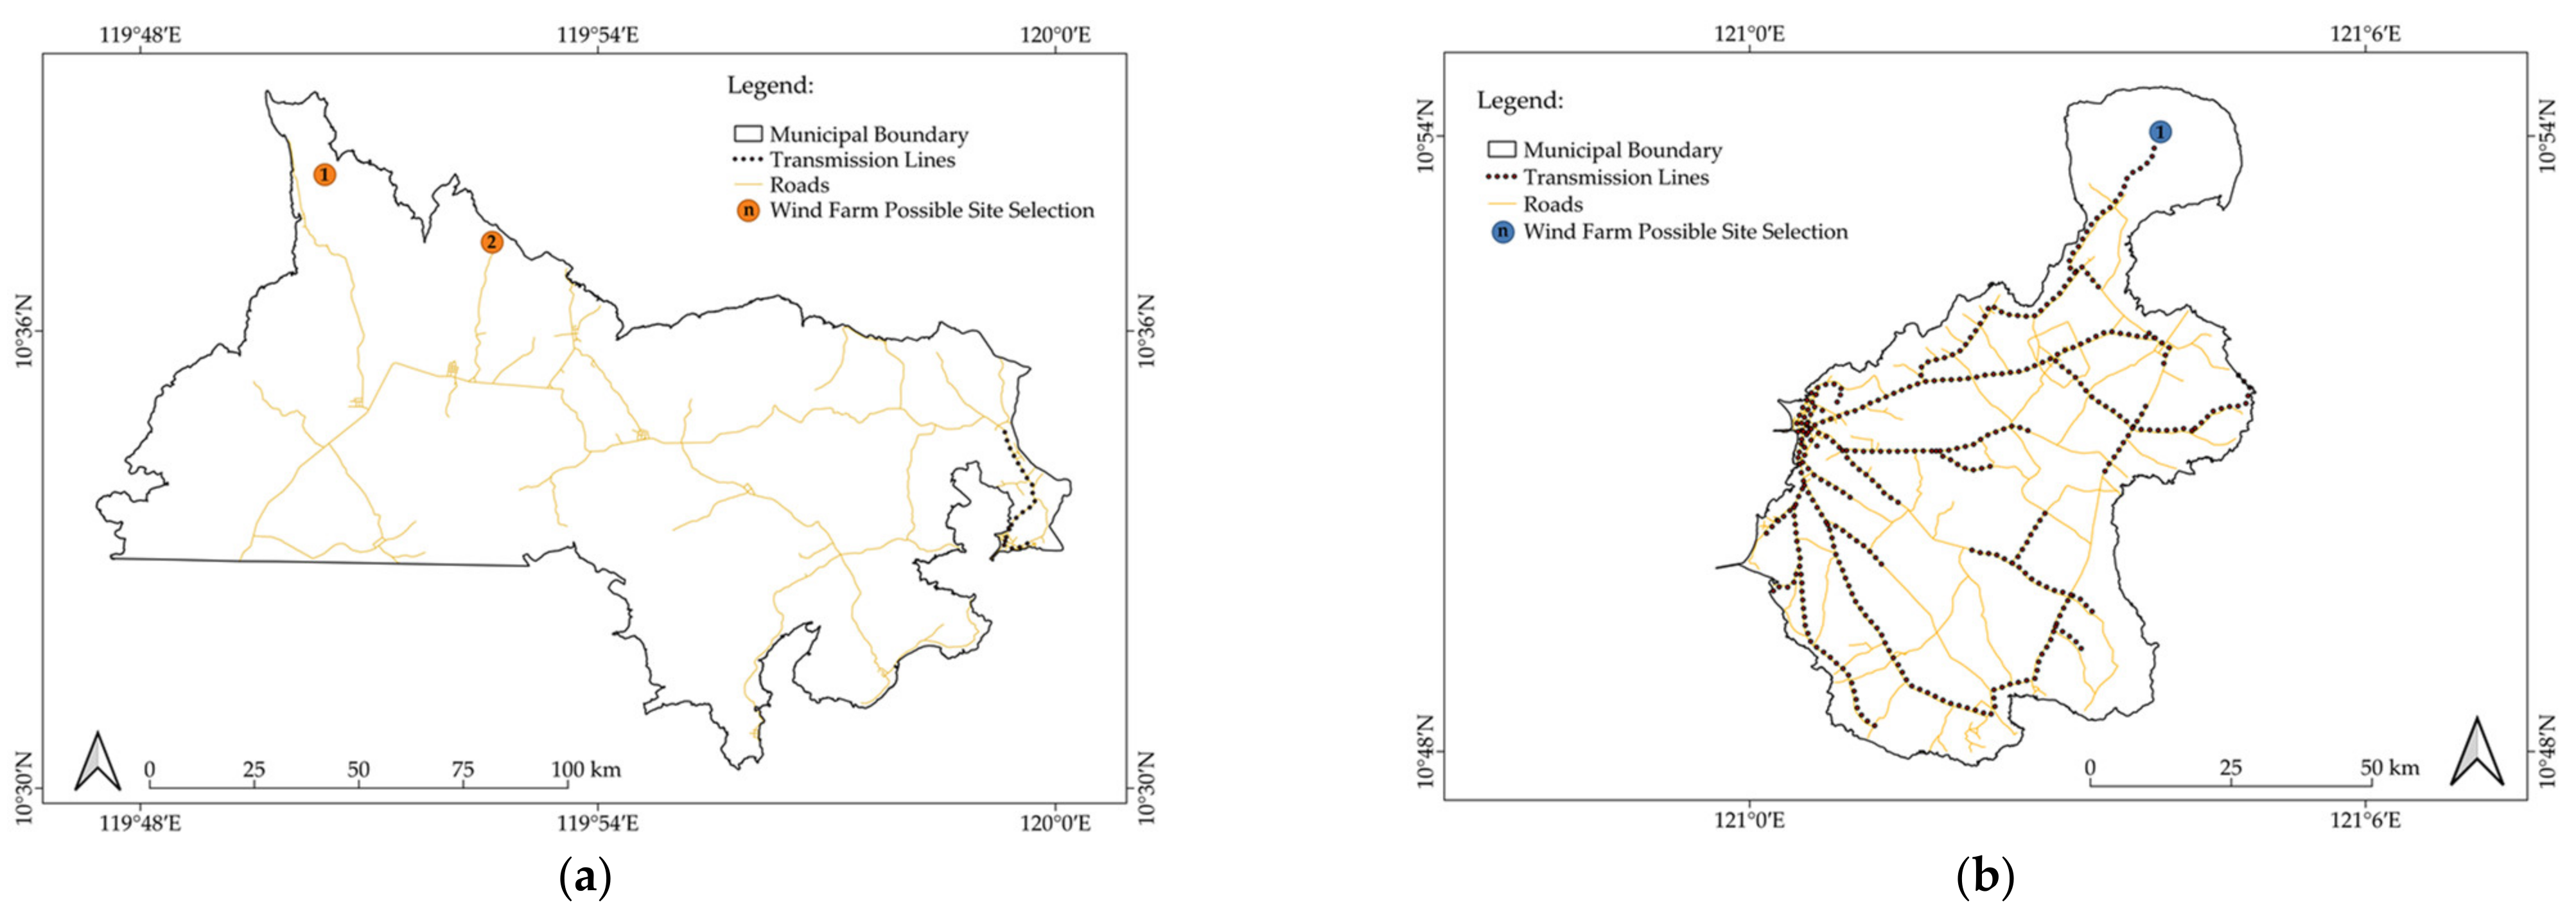
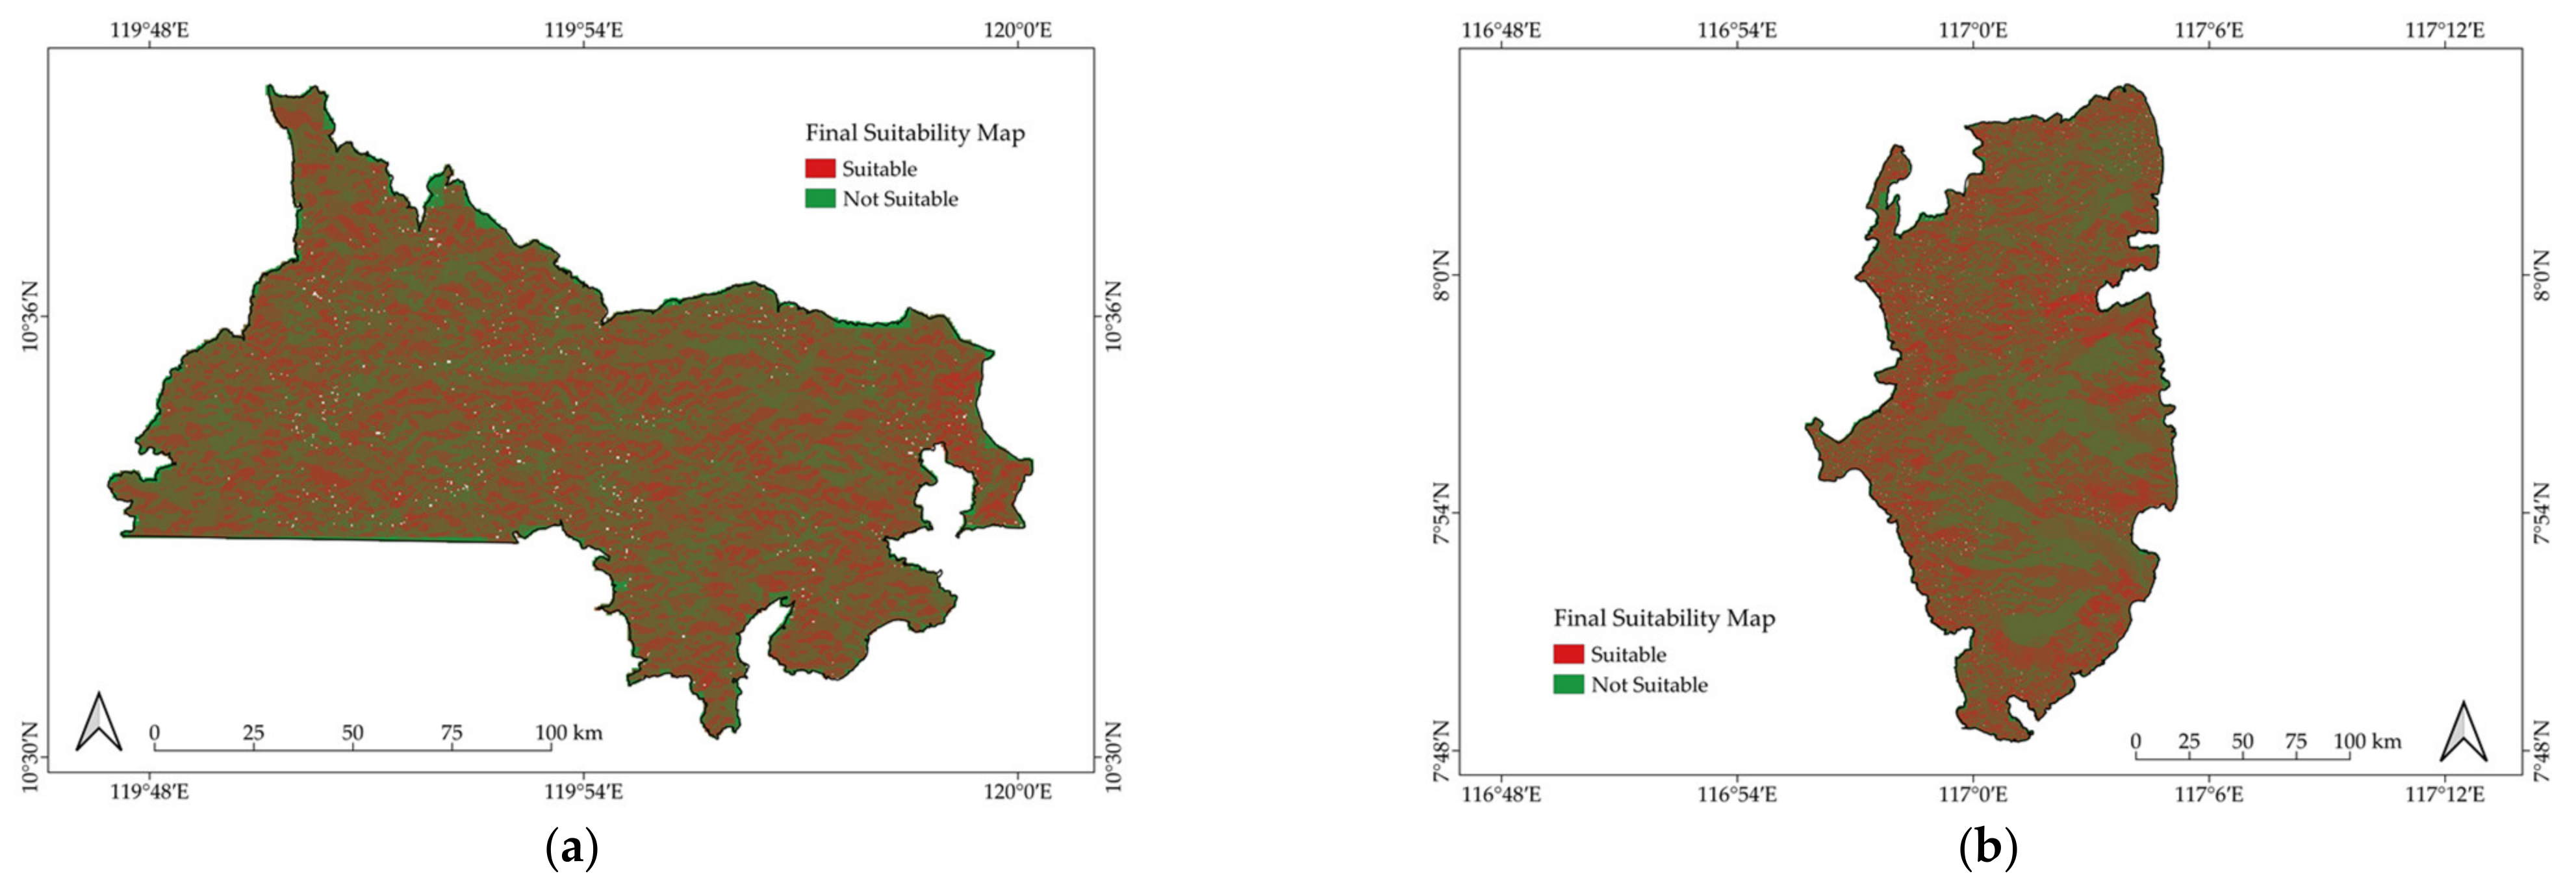
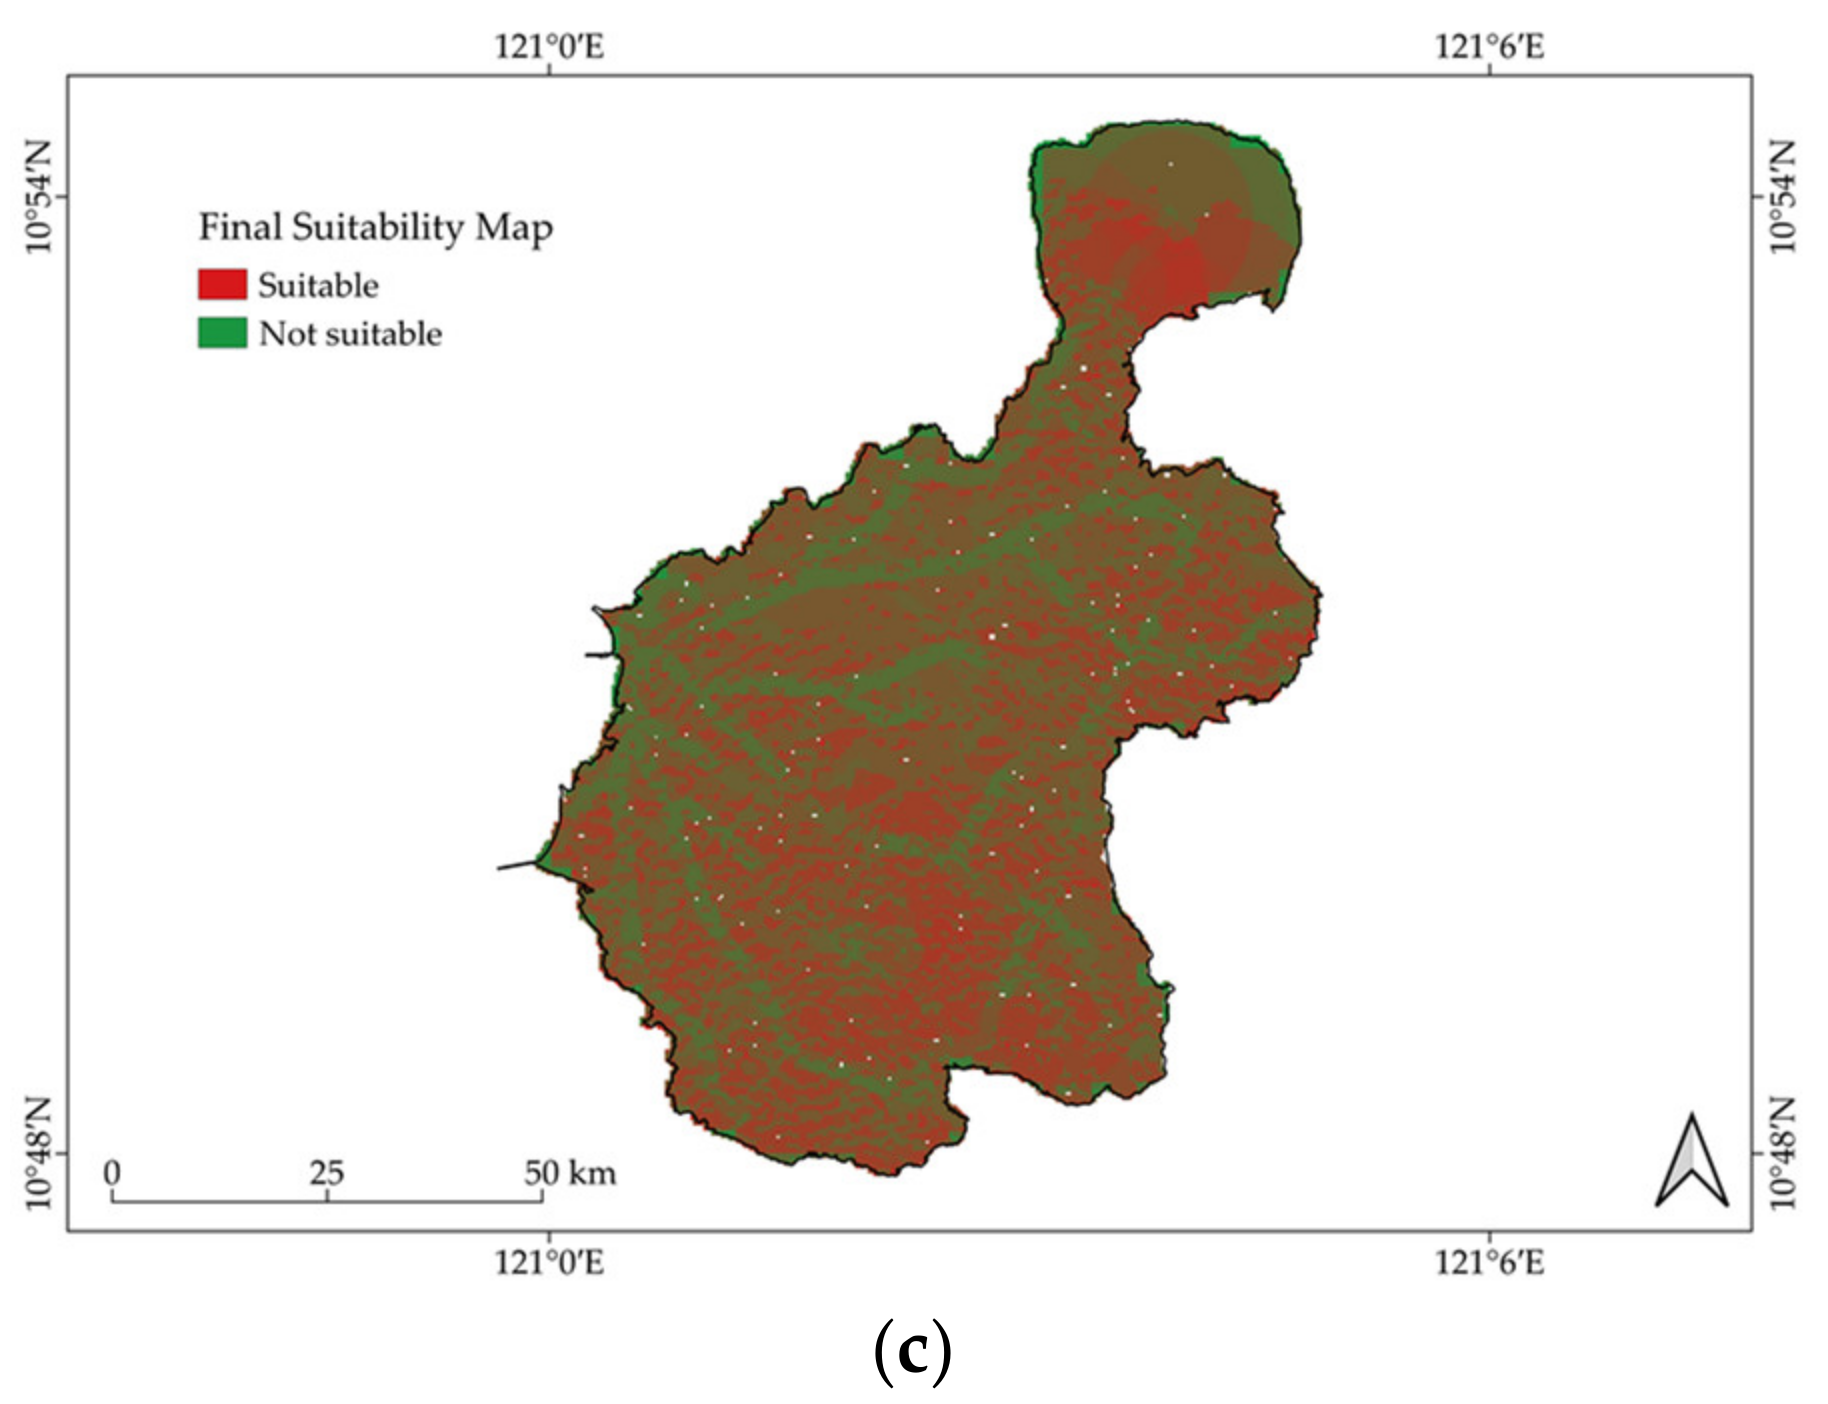
3.2. Geospatial Analysis
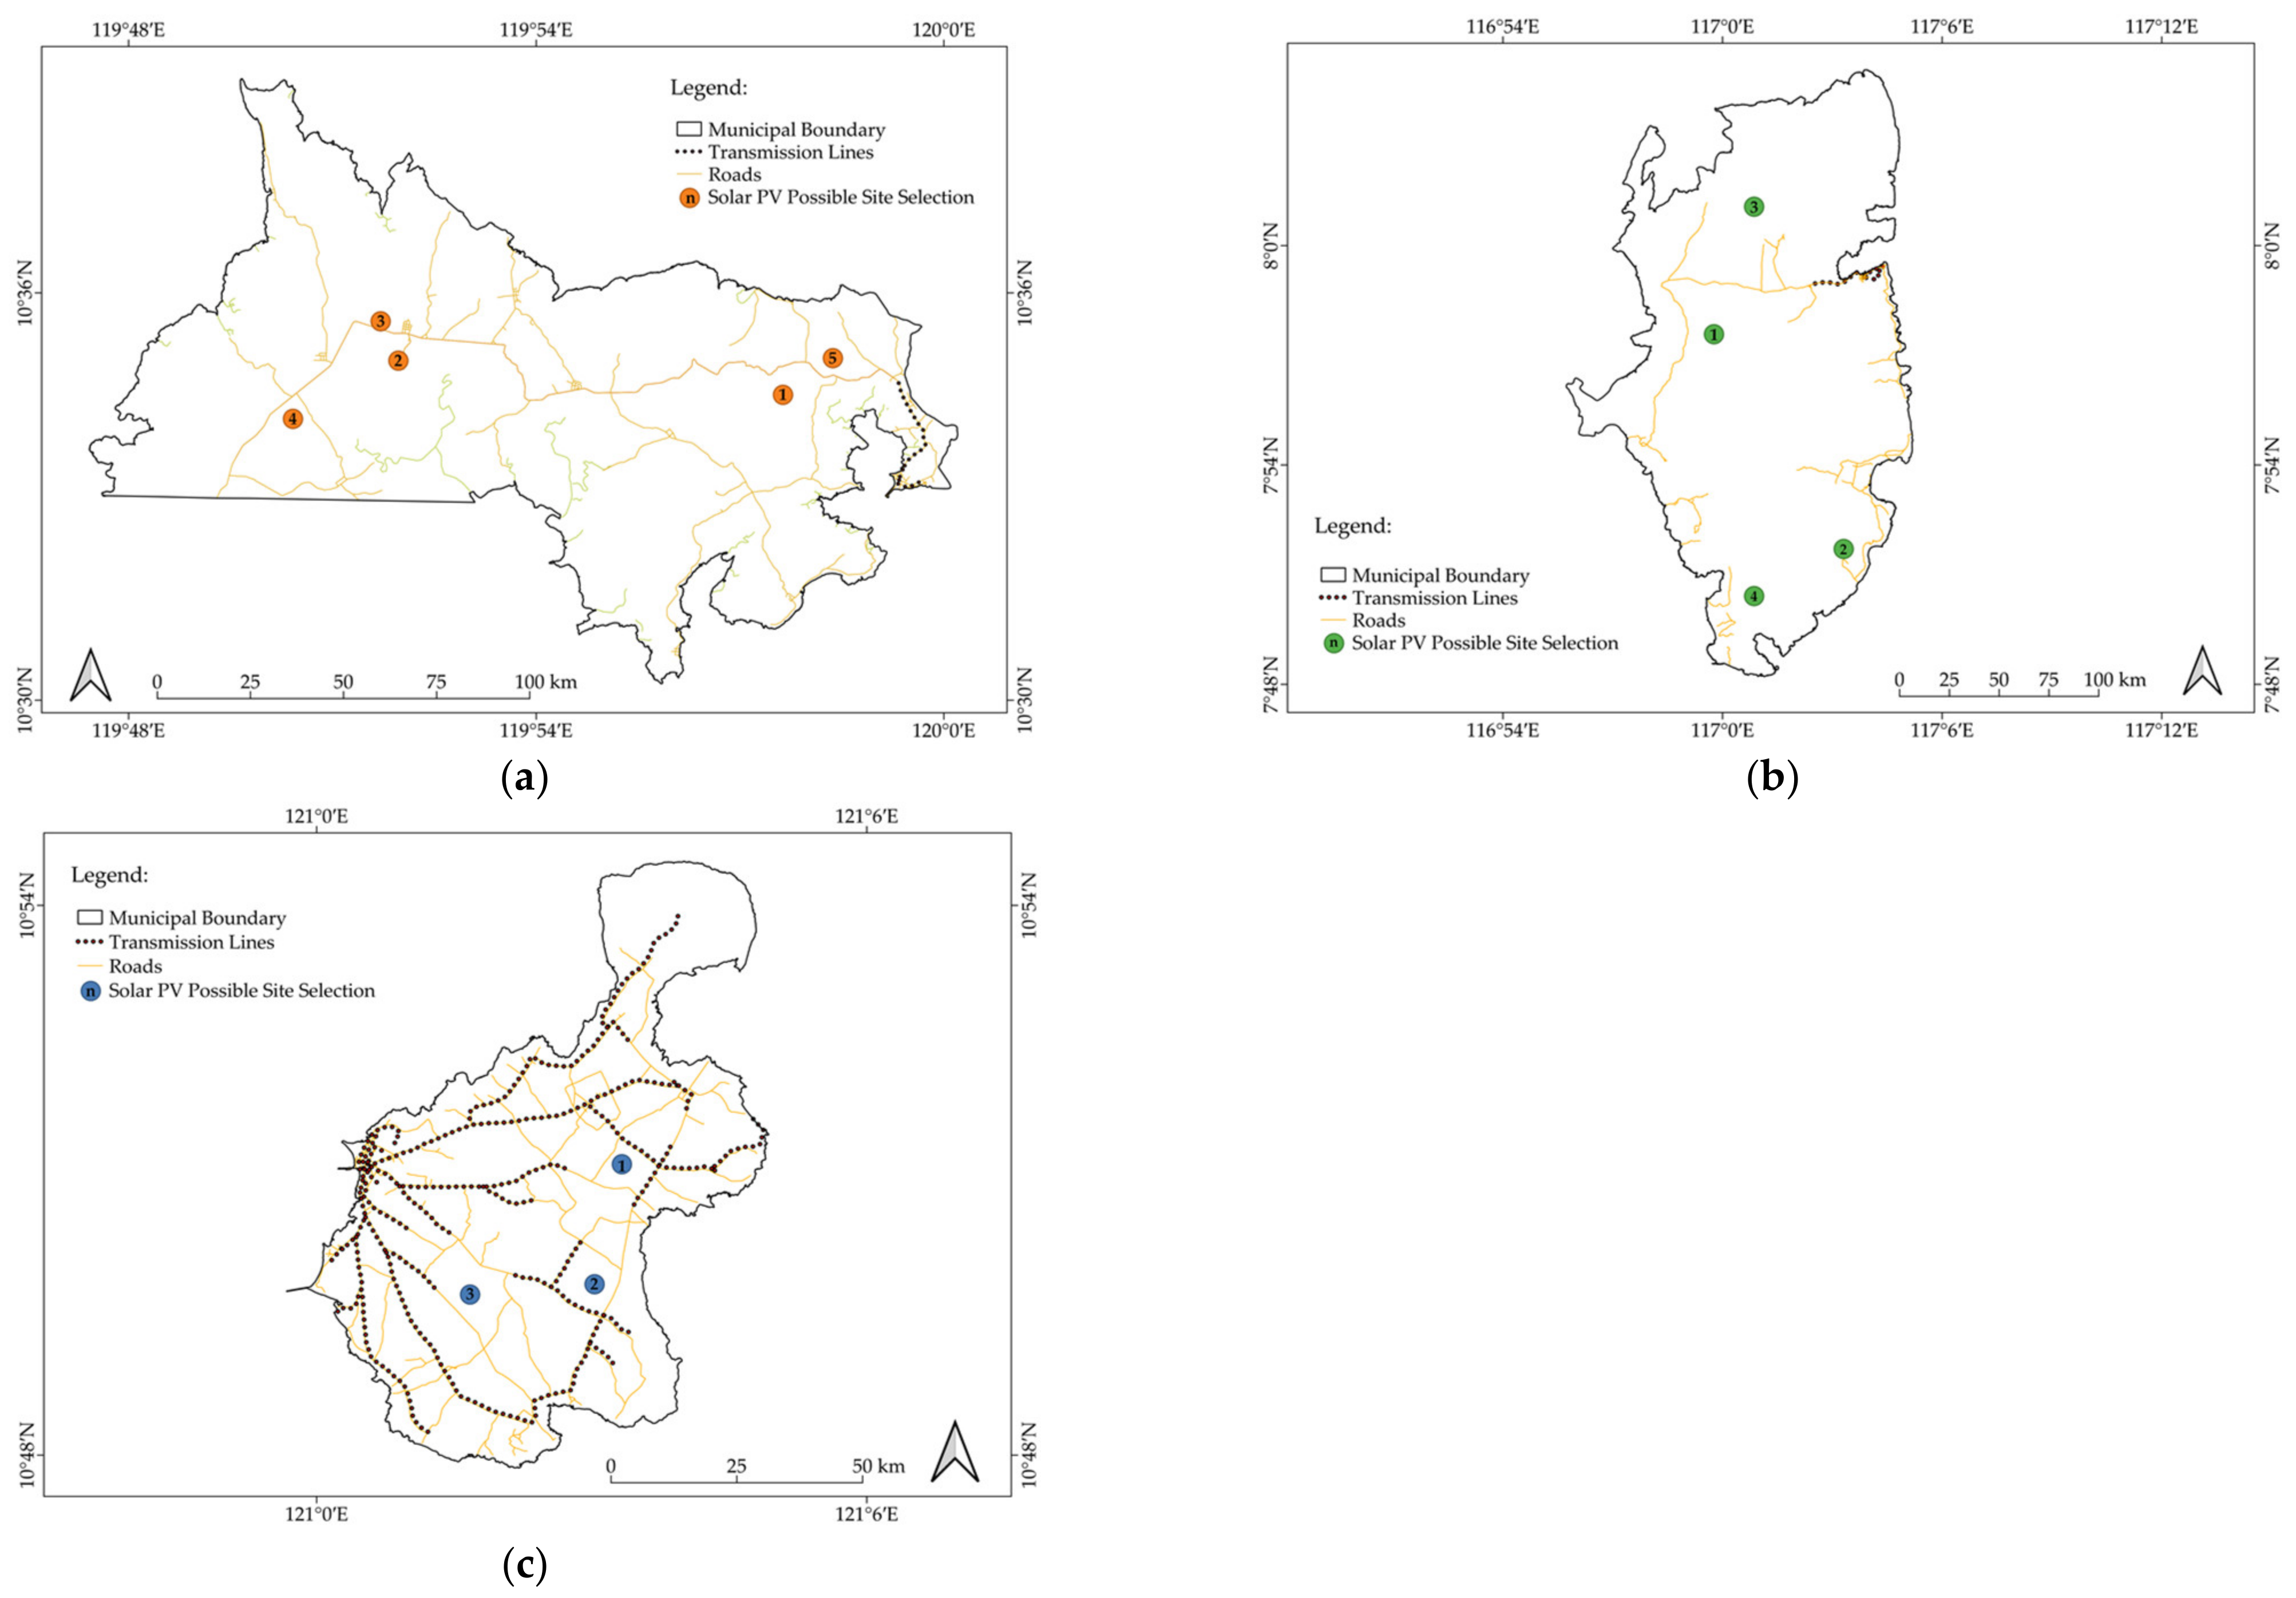
- Spatial Analysis
- b.
- Spatial Decision Support
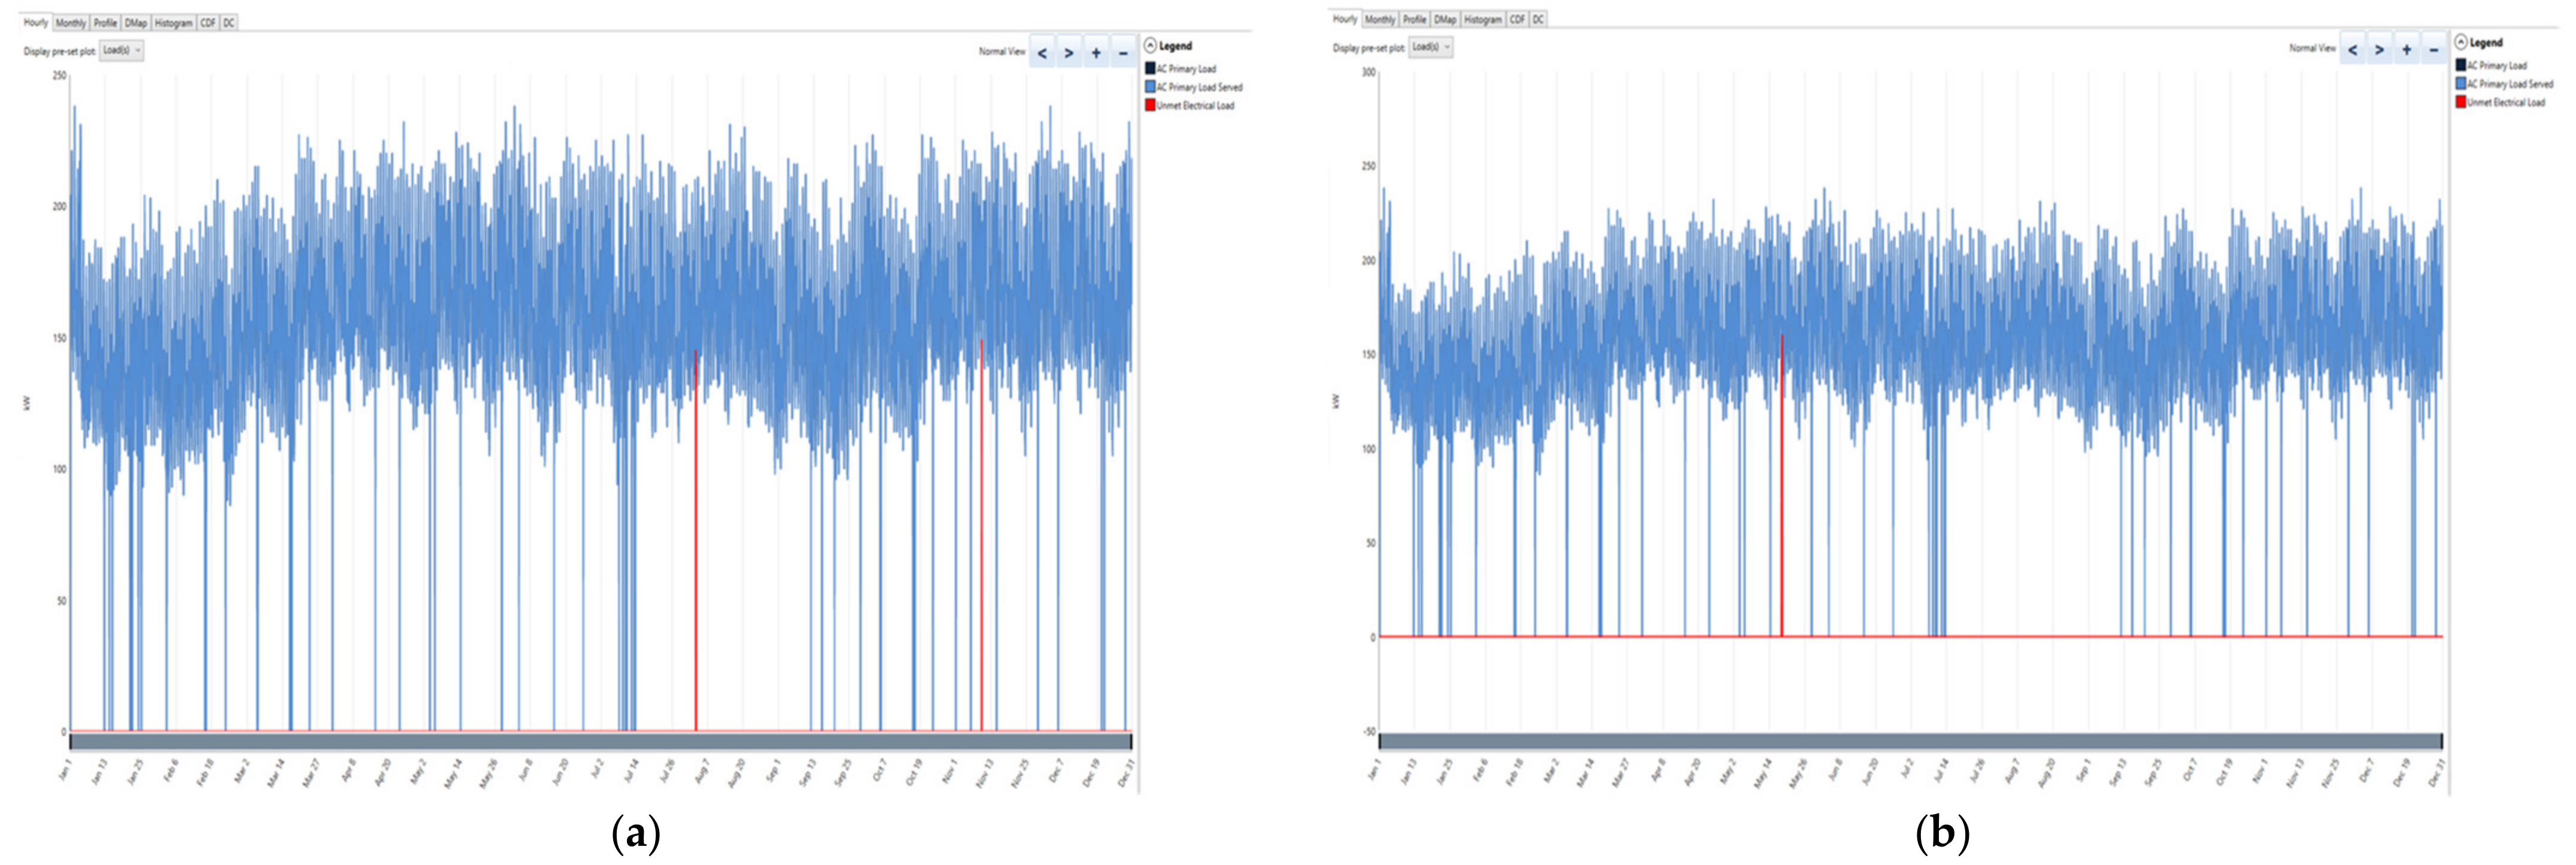
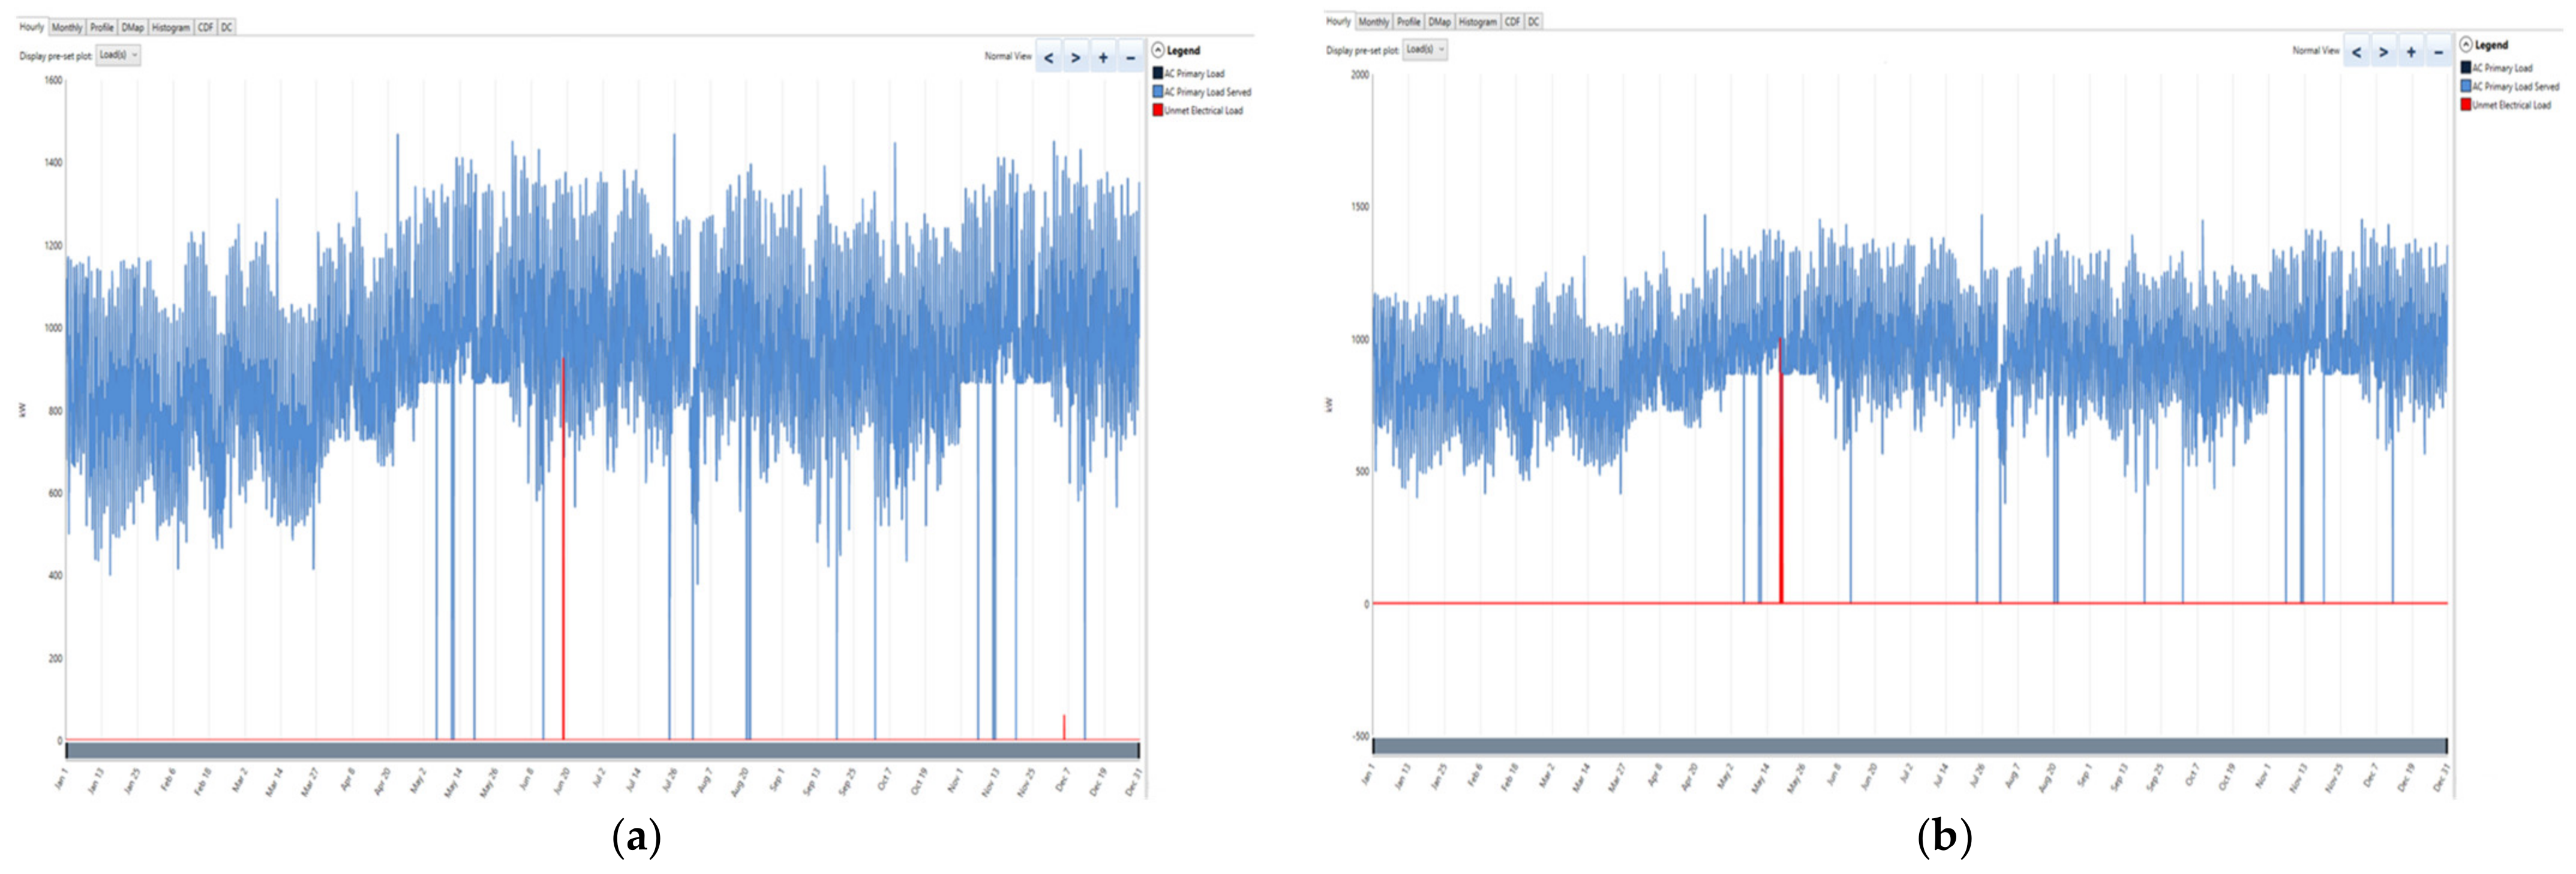
3.3. Technical Potential Estimation
4. Discussions and Conclusions
Supplementary Materials
Author Contributions
Funding
Institutional Review Board Statement
Informed Consent Statement
Data Availability Statement
Acknowledgments
Conflicts of Interest
Abbreviations
| MCDM | Multi-criteria decision-making |
| AHP | Analytic hierarchy process |
| FAHP | Fuzzy analytic hierarchy process |
| TOPSIS | Technique for Order Preference by Similarity to Ideal Solution |
| FTOPSIS | Fuzzy Technique for Order Preference by Similarity to Ideal Solution |
| MW | Megawatt |
| MWh | Megawatt-hour |
| GHI | Global horizontal irradiance |
| DNI | Direct normal radiation |
| DHI | Diffuse horizontal irradiance |
| DEM | Digital elevation model |
| PCM | Pairwise comparison matrix |
| TFN | Triangular fuzzy numbers |
| l, m, u | Lower limit, medium limit, upper limit |
| CI | Consistency index |
| CR | Consistency ratio |
| λmax | Maximum eigenvalue |
| RI | Random index |
References
- BP. Statistical Review of World Energy: 70th Edition. Available online: https://www.bp.com/content/dam/bp/business-sites/en/global/corporate/pdfs/energy-economics/statistical-review/bp-stats-review-2021-full-report.pdf (accessed on 15 October 2021).
- Nunez, C. What Are Fossil Fuels? Available online: https://www.nationalgeographic.com/environment/energy/reference/fossil-fuels/ (accessed on 5 January 2020).
- United Nations. Sustainable Development Goals. Available online: https://www.un.org/sustainabledevelopment/climate-action/ (accessed on 5 January 2020).
- International Energy Agency. Global Energy and CO2 Status Report 2018. Available online: https://webstore.iea.org/global-energy-co2-status-report-2018 (accessed on 10 September 2019).
- International Energy Agency. Global Energy Review 2020: The Impacts of the COVID-19 Crisis on Global Energy Demand and CO2 Emissions. Available online: https://webstore.iea.org/download/direct/2995 (accessed on 3 February 2021).
- Department of Energy. Energy Annual Report 2017. Available online: https://www.doe.gov.ph/sites/default/files/pdf/transparency/annual_report_esar_2017.pdf (accessed on 6 May 2020).
- Asian Development Bank. Philippines Energy Sector Assessment, Strategy, and Road Map. Available online: https://www.adb.org/sites/default/files/publication/463306/philippines-energy-assessment-strategy-road-map.pdf (accessed on 8 September 2019).
- The World Bank. SE4ALL Global Tracking Framework. Available online: https://data.worldbank.org/indicator/EG.ELC.ACCS.ZS?locations=PH (accessed on 5 February 2021).
- International Renewable Energy Agency. Renewable Readiness Assessment: The Philippines. Available online: https://www.irena.org/DocumentDownloads/Publications/IRENA_RRA_Philippines_2017.pdf (accessed on 22 September 2019).
- Amjad, F.; Shah, L.A. Identification and assessment of sites for solar farms development using GIS and density based clustering technique- A case of Pakistan. Renew. Energy 2020, 155, 761–769. [Google Scholar] [CrossRef]
- Pillot, B.; Al-Kurdi, N.; Gervet, C.; Linguet, L. An integrated GIS and robust optimization framework for solar PV plant planning scenarios at utility scale. Appl. Energy 2020, 260, 114257. [Google Scholar] [CrossRef] [Green Version]
- Jeong, J.S.; Ramírez-Gómez, Á. Renewable energy management to identify suitable biomass facility location with GIS-based assessment for sustainable environment. Energy Procedia 2017, 136, 139–144. [Google Scholar] [CrossRef]
- Saha, M.; Eckelman, M.J. Geospatial assessment of regional scale bioenergy production potential on marginal and degraded land. Resour. Conserv. Recycl. 2018, 128, 90–97. [Google Scholar] [CrossRef]
- Castro-Santos, L.; Garcia, G.P.; Simões, T.; Estanqueiro, A. Planning of the installation of offshore renewable energies: A GIS approach of the Portuguese roadmap. Renew. Energy 2019, 132, 1251–1262. [Google Scholar] [CrossRef]
- Díaz, H.; Soares, C.G. An integrated GIS approach for site selection of floating offshore wind farms in the Atlantic continental European coastline. Renew. Sustain. Energy Rev. 2020, 134, 110328. [Google Scholar] [CrossRef]
- Zheng, Y.; Weng, Q. Modeling the effect of climate change on building energy demand in Los Angeles county by using a GIS-based high spatial- and temporal-resolution approach. Energy 2019, 176, 641–655. [Google Scholar] [CrossRef]
- Usman, A.; Shamsi, M.H.; Bohacek, M.; Purcell, K.; Hoare, C.; Mangina, E.; O’Donnell, J. A data-driven approach for multi-scale GIS-based building energy modeling for analysis, planning and support decision making. Appl. Energy 2020, 279, 115834. [Google Scholar] [CrossRef]
- United Nations Development Programme. Sustainable Development Goals. Available online: https://www.undp.org/content/undp/en/home/sustainable-development-goals/goal-7-affordable-and-clean-energy.html (accessed on 19 December 2019).
- REN 21. Renewables 2020 Global Status Report. Available online: https://www.ren21.net/wp-content/uploads/2019/05/gsr_2020_full_report_en.pdf (accessed on 3 February 2021).
- Ayamolowo, O.J.; Manditereza, P.T.; Kusakana, K. Exploring the Gaps in Renewable Energy Integration to Grid. Energy Rep. 2020, 6, 992–999. [Google Scholar] [CrossRef]
- Alberizzi, J.C.; Frigola, J.M.; Rossi, M.; Renzi, M. Optimal sizing of a Hybrid Renewable Energy System: Importance of data selection with highly variable renewable energy sources. Energy Convers. Manag. 2020, 223, 113303. [Google Scholar] [CrossRef]
- Bunodiere, A.; Lee, H.S. Renewable Energy Curtailment: Prediction Using a Logic-Based Forecasting Method and Mitigation Measures in Kyushu, Japan. Energies 2020, 13, 4703. [Google Scholar] [CrossRef]
- Park, J.; Moon, J.; Jung, S.; Hwang, E. Multistep-Ahead Solar Radiation Forecasting Scheme Based on the Light Gradient Boosting Machine: A Case Study of Jeju Island. Remote Sens. 2020, 12, 2271. [Google Scholar] [CrossRef]
- Garni, H.Z.A.; Awasthi, A. Solar PV Power Plants Site Selection: A Review. In Advances in Renewable Energies and Power Technologies; Concordia Institute for Information Systems Engineering, Concordia University: Montreal, QC, Canada, 2018; pp. 57–75. [Google Scholar] [CrossRef]
- Korkovelos, A.; Bazilian, M.; Mentis, D.; Howells, M. A GIS Approach to Planning Electrification in Afghanistan. Available online: https://openknowledge.worldbank.org/handle/10986/29140 (accessed on 18 March 2021).
- Tyralis, H.; Mamassis, N.; Photis, Y.N. Spatial Analysis of Electrical Energy Demand Patterns in Greece: Application of a GIS-based Methodological Framework. Energy Procedia 2016, 97, 262–269. [Google Scholar] [CrossRef] [Green Version]
- Yeo, I.-A.; Yoon, S.-H.; Yee, J.-J. Development of an Urban Energy Demand Forecasting System to Support Environmentally Friendly Urban Planning. Appl. Energy 2013, 110, 304–317. [Google Scholar] [CrossRef]
- Santoli, L.D.; Mancini, F.; Garcia, D.A. A GIS-Based Model to Assess Electric Energy Consumptions and Usable Renewable Energy Potential in Lazio Region at Municipality Scale. Sustain. Cities Soc. 2019, 46, 101413. [Google Scholar] [CrossRef] [Green Version]
- Zhang, Y.; Zhang, Y.; Yu, H.; Li, J.; Xie, Y.; Lei, Z. Geothermal Resource Potential Assessment of Fujian Province, China, Based on Geographic Information System (GIS) -Supported Models. Renew. Energy 2020, 153, 564–579. [Google Scholar] [CrossRef]
- Xu, Y.; Li, Y.; Zheng, L.; Cui, L.; Li, S.; Li, W.; Cai, Y. Site Selection of Wind Farms Using GIS and Multi-Criteria Decision Making Method in Wafangdian, China. Energy 2020, 207, 118222. [Google Scholar] [CrossRef]
- Đurišić, V.; Rogić, S.; Smolović, J.C.; Radonjić, M. Determinants of Household Electrical Energy Consumption: Evidences and Suggestions with Application to Montenegro. Energy Rep. 2020, 6, 209–217. [Google Scholar] [CrossRef]
- Wang, Q.; M’Ikiugu, M.; Kinoshita, I. A GIS-Based Approach in Support of Spatial Planning for Renewable Energy: A Case Study of Fukushima, Japan. Sustainability 2014, 6, 2087–2117. [Google Scholar] [CrossRef] [Green Version]
- Corigliano, S.; Carnovali, T.; Edeme, D.; Merlo, M. Holistic geospatial data-based procedure for electric network design and least-cost energy strategy. Energy Sustain. Dev. 2020, 58, 1–15. [Google Scholar] [CrossRef]
- Bosisio, A.; Berizzi, A.; Amaldi, E.; Bovo, C.; Morotti, A.; Greco, B.; Iannarelli, G. A GIS-based Approach for High-Level Distribution Networks Expansion Planning in Normal and Contingency Operation Considering Reliability. Electr. Power Syst. Res. 2021, 190, 106684. [Google Scholar] [CrossRef]
- Vasileiou, M.; Loukogeorgaki, E.; Vagiona, D.G. GIS-Based Multi-Criteria Decision Analysis for Site Selection of Hybrid Offshore Wind and Wave Energy Systems in Greece. Renew. Sustain. Energy Rev. 2017, 73, 745–757. [Google Scholar] [CrossRef]
- Rogeau, A.; Girard, R.; Kariniotakis, G. A Generic GIS-based Mmethod for Small Pumped Hydro Energy Storage (PHES) Potential Evaluation at Large Scale. Appl. Energy 2017, 197, 241–253. [Google Scholar] [CrossRef] [Green Version]
- Sun, L.; Jiang, Y.; Guo, Q.; Ji, L.; Xie, Y.; Qiao, Q.; Huang, G.; Xiao, K. A GIS-Based Multi-Criteria Decision Making Method for the Potential Assessment and Suitable Sites Selection of PV and CSP Plants. Resour. Conserv. Recycl. 2021, 168, 105306. [Google Scholar] [CrossRef]
- Rikalovic, A.; Cosic, I.; Lazarevic, D. GIS Based Multi-criteria Analysis for Industrial Site Selection. Procedia Eng. 2014, 69, 1054–1063. [Google Scholar] [CrossRef] [Green Version]
- Pojadas, D.J.; Abundo, M.L.S. A Spatial Cost-Benefit-Externality Modelling Framework for Siting of Variable Renewable Energy Farms: A Case in Bohol, Philippines. Renew. Energy 2022, 181, 1177–1187. [Google Scholar] [CrossRef]
- Aly, A.; Jensen, S.S.; Pedersen, A.B. Solar Power Potential of Tanzania: Identifying CSP and PV Hot Spots Through a GIS Multicriteria Decision Making Analysis. Renew. Energy 2017, 113, 159–175. [Google Scholar] [CrossRef]
- Tercan, E.; Eymen, A.; Urfalı, T.; Saracoglu, B.O. A Sustainable Framework for Spatial Planning of Photovoltaic Solar Farms using GIS and Multi-Criteria Assessment Approach in Central Anatolia, Turkey. Land Use Policy 2021, 102, 105272. [Google Scholar] [CrossRef]
- Diemuodeke, E.O.; Addo, A.; Oko, C.O.C.; Mulugetta, Y.; Ojapah, M.M. Optimal Mapping of Hybrid Renewable Energy Systems for Locations Using Multi-Criteria Decision-Making Algorithm. Renew. Energy 2019, 134, 461–477. [Google Scholar] [CrossRef]
- Cunden, T.S.M.; Doorga, J.; Lollchund, M.R.; Rughooputh, S.D.D.V. Multi-level Constraints Wind Farms Siting for a Complex Terrain in a Tropical Region using MCDM Approach Coupled with GIS. Energy 2020, 211, 118533. [Google Scholar] [CrossRef]
- Ilbahar, E.; Cebi, S.; Kahraman, C. A State-of-the-Art Review on Multi-Attribute Renewable Energy Decision Making. Energy Strategy Rev. 2019, 25, 18–33. [Google Scholar] [CrossRef]
- Saaty, T.L. The Analytic Hierarchy Process: Decision Making in Complex Environments. In Quantitative Assessment in Arms Control: Mathematical Modeling and Simulation in the Analysis of Arms Control Problems; Avenhaus, R., Huber, R.K., Eds.; Springer: Boston, MA, USA, 1984; pp. 285–308. [Google Scholar] [CrossRef]
- Colak, H.E.; Memisoglu, T.; Gercek, Y. Optimal site selection for solar photovoltaic (PV) power plants using GIS and AHP: A case study of Malatya Province, Turkey. Renew. Energy 2020, 149, 565–576. [Google Scholar] [CrossRef]
- Chang, H.-K.; Liou, J.-C.; Chen, W.-W. Protection Priority in the Coastal Environment Using a Hybrid AHP-TOPSIS Method on the Miaoli Coast, Taiwan. J. Coast. Res. 2012, 28, 369–374. [Google Scholar] [CrossRef]
- Ramya, S.; Devadas, V. Integration of GIS, AHP and TOPSIS in Evaluating Suitable Locations for Industrial Development: A Case of Tehri Garhwal District, Uttarakhand, India. J. Clean. Prod. 2019, 238, 117872. [Google Scholar] [CrossRef]
- Konstantinos, I.; Georgios, T.; Garyfalos, A. A Decision Support System Methodology for Selecting Wind Farm Installation Locations using AHP and TOPSIS: Case Study in Eastern Macedonia and Thrace Region, Greece. Energy Policy 2019, 132, 232–246. [Google Scholar] [CrossRef]
- Sindhu, S.; Nehra, V.; Luthra, S. Investigation of Feasibility Study of Solar Farms Deployment Using Hybrid AHP-TOPSIS Analysis: Case study of India. Renew. Sustain. Energy Rev. 2017, 73, 496–511. [Google Scholar] [CrossRef]
- Jozaghi, A.; Alizadeh, B.; Hatami, M.; Flood, I.; Khorrami, M.; Khodaei, N.; Tousi, E.G. A Comparative Study of the AHP and TOPSIS Techniques for Dam Site Selection Using GIS: A Case Study of Sistan and Baluchestan Province, Iran. Geosciences 2018, 8, 494. [Google Scholar] [CrossRef] [Green Version]
- Abdel-Basset, M.; Gamal, A.; Chakrabortty, R.K.; Ryan, M. A New Hybrid Multi-Criteria Decision-Making Approach for Location Selection of Sustainable Offshore Wind Energy Stations: A Case Study. J. Clean. Prod. 2021, 280, 124462. [Google Scholar] [CrossRef]
- Lo, H.-W.; Hsu, C.-C.; Chen, B.-C.; Liou, J.J.H. Building a Grey-Based Multi-Criteria Decision-Making Model for Offshore Wind Farm Site Selection. Sustain. Energy Technol. Assess. 2021, 43, 100935. [Google Scholar] [CrossRef]
- Gouareh, A.; Settou, B.; Settou, N. A New Geographical Information System Approach Based on Best Worst Method and Analytic Hierarchy Process for Site Suitability and Technical Potential Evaluation for Large-Scale CSP On-Grid Plant: An Application for Algeria Territory. Energy Convers. Manag. 2021, 235, 113963. [Google Scholar] [CrossRef]
- Shorabeh, S.N.; Argany, M.; Rabiei, J.; Firozjaei, H.K.; Nematollahi, O. Potential Assessment of Multi-Renewable Energy Farms Establishment Using Spatial Multi-Criteria Decision Analysis: A Case Study and Mapping in Iran. J. Clean. Prod. 2021, 295, 126318. [Google Scholar] [CrossRef]
- Şan, M.; Akpınar, A.; Bingölbali, B.; Kankal, M. Geo-Spatial Multi-Criteria Evaluation of Wave Energy Exploitation in a Semi-Enclosed Sea. Energy 2021, 214, 118997. [Google Scholar] [CrossRef]
- Potić, I.; Joksimović, T.; Milinčić, U.; Kićović, D.; Milinčić, M. Wind Energy Potential for the Electricity Production - Knjaževac Municipality Case Study (Serbia). Energy Strategy Rev. 2021, 33, 100589. [Google Scholar] [CrossRef]
- Haddad, B.; Díaz-Cuevas, P.; Ferreira, P.; Djebli, A.; Pérez, J.P. Mapping Concentrated Solar Power Site Suitability in Algeria. Renew. Energy 2021, 168, 838–853. [Google Scholar] [CrossRef]
- Lindberg, O.; Birging, A.; Widén, J.; Lingfors, D. PV Park Site Selection for Utility-Scale Solar Guides Combining GIS and Power Flow Analysis: A Case Study on a Swedish Municipality. Appl. Energy 2021, 282, 116086. [Google Scholar] [CrossRef]
- Gkeka-Serpetsidaki, P.; Tsoutsos, T. 13—Sustainable Site Selection of offshore Wind Farms Using GIS-Based Multi-Criteria Decision Analysis and Analytical Hierarchy process. Case study: Island of Crete (Greece). In Low Carbon Energy Technologies in Sustainable Energy Systems; Kyriakopoulos, G.L., Ed.; Academic Press-Elsevier: Cambridge, MA, USA, 2021; pp. 329–342. [Google Scholar]
- Zambrano-Asanza, S.; Quiros-Tortos, J.; Franco, J.F. Optimal Site Selection for Photovoltaic Power Plants using a GIS-Based Multi-Criteria Decision Making and Spatial Overlay with Electric Load. Renew. Sustain. Energy Rev. 2021, 143, 110853. [Google Scholar] [CrossRef]
- Meng, F.; Liang, X.; Xiao, C.; Wang, G. Geothermal Resource Potential Assessment Utilizing GIS—Based Multi Criteria Decision Analysis Method. Geothermics 2021, 89, 101969. [Google Scholar] [CrossRef]
- Saraswat, S.K.; Digalwar, A.K.; Yadav, S.S.; Kumar, G. MCDM and GIS Based Modelling Technique for Assessment of Solar and Wind Farm Locations in India. Renew. Energy 2021, 169, 865–884. [Google Scholar] [CrossRef]
- Abuzied, S.M.; Kaiser, M.F.; Shendi, E.-A.H.; Abdel-Fattah, M.I. Multi-Criteria Decision Support for Geothermal Resources Exploration Based on Remote Sensing, GIS and Geophysical Techniques Along the Gulf of Suez Coastal Area, Egypt. Geothermics 2020, 88, 101893. [Google Scholar] [CrossRef]
- Dhiman, H.S.; Deb, D. Fuzzy TOPSIS and Fuzzy COPRAS Based Multi-Criteria Decision Making for Hybrid Wind Farms. Energy 2020, 202, 117755. [Google Scholar] [CrossRef]
- Tamm, O.; Tamm, T. Verification of a Robust Method for Sizing and Siting the Small Hydropower Run-Of-River Plant Potential by using GIS. Renew. Energy 2020, 155, 153–159. [Google Scholar] [CrossRef]
- Rezaei, M.; Khalilpour, K.R.; Jahangiri, M. Multi-Criteria Location Identification for Wind/Solar Based Hydrogen Generation: The Case of Capital Cities of a Developing Country. Int. J. Hydrogen Energy 2020, 45, 33151–33168. [Google Scholar] [CrossRef]
- Tian, Y.; Zhang, F.; Yuan, Z.; Che, Z.; Zafetti, N. Assessment Power Generation Potential of Small Hydropower Plants using GIS Software. Energy Rep. 2020, 6, 1393–1404. [Google Scholar] [CrossRef]
- Hassaan, M.A.; Hassan, A.; Al-Dashti, H. GIS-based Suitability Analysis for siting Solar Power Plants in Kuwait. Egypt. J. Remote Sens. Space Sci. 2021, 24, 453–461. [Google Scholar] [CrossRef]
- Feng, J.; Feng, L.; Wang, J.; King, C.W. Evaluation of the onshore Wind Energy Potential in Mainland China—Based on GIS Modeling and EROI Analysis. Resour. Conserv. Recycl. 2020, 152, 104484. [Google Scholar] [CrossRef]
- Fraia, S.D.; Fabozzi, S.; Macaluso, A.; Vanoli, L. Energy Potential of Residual Biomass from Agro-industry in a Mediterranean Region of Southern Italy (Campania). J. Clean. Prod. 2020, 277, 124085. [Google Scholar] [CrossRef]
- Mensour, O.N.; Ghazzani, B.E.; Hlimi, B.; Ihlal, A. A geographical Information System-Based Multi-Criteria Method for the Evaluation of Solar Farms Locations: A Case Study in Souss-Massa Area, Southern Morocco. Energy 2019, 182, 900–919. [Google Scholar] [CrossRef]
- Mutombo, N.M.-A.; Numbi, B.P. Assessment of Renewable Energy Potential in Kwazulu-Natal Province, South Africa. Energy Rep. 2019, 5, 874–881. [Google Scholar] [CrossRef]
- Shorabeh, S.N.; Firozjaei, M.K.; Nematollahi, O.; Firozjaei, H.K.; Jelokhani-Niaraki, M. A Risk-Based Multi-Criteria Spatial Decision Analysis for Solar Power Plant Site Selection in Different Climates: A Case Study in Iran. Renew. Energy 2019, 143, 958–973. [Google Scholar] [CrossRef]
- Sliz-Szkliniarz, B.; Eberbach, J.; Hoffmann, B.; Fortin, M. Assessing the Cost of onshore Wind Development Scenarios: Modelling of Spatial and Temporal Distribution of Wind Power for the Case of Poland. Renew. Sustain. Energy Rev. 2019, 109, 514–531. [Google Scholar] [CrossRef]
- Laasasenaho, K.; Lensu, A.; Lauhanen, R.; Rintala, J. GIS-Data Related Route Optimization, Hierarchical Clustering, Location Optimization, and Kernel Density Methods are Useful for Promoting Distributed Bioenergy Plant Planning in Rural Areas. Sustain. Energy Technol. Assess. 2019, 32, 47–57. [Google Scholar] [CrossRef]
- Vavatsikos, A.P.; Arvanitidou, A.; Petsas, D. Wind Farm Investments Portfolio Formation Using Gis-Based Suitability Analysis and Simulation Procedures. J. Environ. Manag. 2019, 252, 109670. [Google Scholar] [CrossRef]
- Messaoudi, D.; Settou, N.; Negrou, B.; Settou, B. GIS Based Multi-Criteria Decision Making for Solar Hydrogen Production Sites Selection in Algeria. Int. J. Hydrogen Energy 2019, 44, 31808–31831. [Google Scholar] [CrossRef]
- Solangi, Y.A.; Shah, S.A.A.; Zameer, H.; Ikram, M.; Saracoglu, B.O. Assessing the Solar PV Power Project Site Selection in Pakistan: Based on AHP-Fuzzy VIKOR Approach. Environ. Sci. Pollut. Res. 2019, 26, 30286–30302. [Google Scholar] [CrossRef]
- Ghasemi, G.; Noorollahi, Y.; Alavi, H.; Marzband, M.; Shahbazi, M. Theoretical and Technical Potential Evaluation of Solar Power Generation in Iran. Renew. Energy 2019, 138, 1250–1261. [Google Scholar] [CrossRef] [Green Version]
- Nematollahi, O.; Alamdari, P.; Jahangiri, M.; Sedaghat, A.; Alemrajabi, A.A. A Techno-Economical Assessment of Solar/Wind Resources and Hydrogen Production: A Case Study With GIS Maps. Energy 2019, 175, 914–930. [Google Scholar] [CrossRef]
- Ali, S.; Taweekun, J.; Techato, K.; Waewsak, J.; Gyawali, S. GIS Based Site Suitability Assessment for Wind and Solar Farms in Songkhla, Thailand. Renew. Energy 2019, 132, 1360–1372. [Google Scholar] [CrossRef]
- Rezaei, M.; Mostafaeipour, A.; Qolipour, M.; Tavakkoli-Moghaddam, R. Investigation of the Optimal Location Design of a Hybrid Wind-Solar Plant: A Case Study. Int. J. Hydrogen Energy 2018, 43, 100–114. [Google Scholar] [CrossRef]
- Zaidi, A.Z.; Khan, M. Identifying High Potential Locations for Run-of-the-River Hydroelectric Power Plants using GIS and Digital Elevation Models. Renew. Sustain. Energy Rev. 2018, 89, 106–116. [Google Scholar] [CrossRef]
- Ayodele, T.R.; Ogunjuyigbe, A.S.O.; Odigie, O.; Munda, J.L. A Multi-Criteria GIS Based Model for Wind Farm Site Selection Using Interval Type-2 Fuzzy Analytic Hierarchy Process: The Case Study of Nigeria. Appl. Energy 2018, 228, 1853–1869. [Google Scholar] [CrossRef]
- Nie, B.; Li, J. Technical Potential Assessment of Offshore Wind Energy over Shallow Continent Shelf Along China Coast. Renew. Energy 2018, 128, 391–399. [Google Scholar] [CrossRef] [Green Version]
- Garegnani, G.; Sacchelli, S.; Balest, J.; Zambelli, P. GIS-Based Approach for Assessing the Energy Potential and the financial Feasibility of Run-Off-River Hydro-Power in Alpine Valleys. Appl. Energy 2018, 216, 709–723. [Google Scholar] [CrossRef]
- Huang, T.; Wang, S.; Yang, Q.; Li, J. A GIS-Based Assessment of large-Scale PV Potential in China. Energy Procedia 2018, 152, 1079–1084. [Google Scholar] [CrossRef]
- Zaher, M.A.; Elbarbary, S.; El-Shahat, A.; Mesbah, H.; Embaby, A. Geothermal Resources in Egypt Integrated with GIS-Based Analysis. J. Volcanol. Geotherm. Res. 2018, 365, 1–12. [Google Scholar] [CrossRef]
- Yushchenko, A.; Bono, A.D.; Chatenoux, B.; Patel, M.K.; Ray, N. GIS-based Assessment of Photovoltaic (PV) and Concentrated Solar Power (CSP) Generation Potential in West Africa. Renew. Sustain. Energy Rev. 2018, 81, 2088–2103. [Google Scholar] [CrossRef]
- Turk, S.; Sahin, G. Multi-Criteria Decision-Making in the Location Selection for a Solar PV Power Plant using AHP. Measurement 2018, 129, 218–226. [Google Scholar]
- Merrouni, A.A.; Elalaoui, F.E.; Ghennioui, A.; Mezrhab, A.; Mezrhab, A. A GIS-AHP Combination for the Sites Assessment of Large-Scale CSP Plants with Dry and Wet Cooling Systems. Case Study: Eastern Morocco. Sol. Energy 2018, 166, 2–12. [Google Scholar] [CrossRef]
- Zyadin, A.; Natarajan, K.; Latva-Käyrä, P.; Igliński, B.; Iglińska, A.; Trishkin, M.; Pelkonen, P.; Pappinen, A. Estimation of Surplus Biomass Potential in Southern and Central Poland Using GIS Applications. Renew. Sustain. Energy Rev. 2018, 89, 204–215. [Google Scholar] [CrossRef]
- Yousefi, H.; Noorollahi, Y.; Hajinezhad, A.; Alimohammadi, A. GIS-Based Spatially Integrated Bioenergy Resources Assessment in Kurdistan Province-Northwest Iran. Sustain. Energy Technol. Assess. 2017, 23, 11–20. [Google Scholar] [CrossRef]
- Noorollahi, Y.; Arjenaki, H.G.; Ghasempour, R. Thermo-Economic Modeling and GIS-Based Spatial Data Analysis of Ground Source Heat Pump Systems for Regional Shallow Geothermal Mapping. Renew. Sustain. Energy Rev. 2017, 72, 648–660. [Google Scholar] [CrossRef]
- Bayazıt, Y.; Bakış, R.; Koç, C. An Investigation of Small Scale Hydropower Plants Using the Geographic Information System. Renew. Sustain. Energy Rev. 2017, 67, 289–294. [Google Scholar] [CrossRef]
- Kausika, B.B.; Dolla, O.; Sark, W.G.J.H.M.v. Assessment of Policy Based Residential Solar PV Potential Using GIS-based Multicriteria Decision Analysis: A Case Study of Apeldoorn, The Netherlands. Energy Procedia 2017, 134, 110–120. [Google Scholar] [CrossRef]
- Soha, T.; Munkácsy, B.; Harmat, Á.; Csontos, C.; Horváth, G.; Tamás, L.; Csüllög, G.; Daróczi, H.; Sáfián, F.; Szabó, M. GIS-Based Assessment of the Opportunities for small-Scale Pumped Hydro Energy Storage in Middle-Mountain Areas Focusing on Artificial Landscape Features. Energy 2017, 141, 1363–1373. [Google Scholar] [CrossRef]
- Ketzer, D.; Rösch, C.; Haase, M. Assessment of Sustainable Grassland Biomass Potentials for Energy Supply in Northwest Europe. Biomass Bioenergy 2017, 100, 39–51. [Google Scholar] [CrossRef]
- IEA. Solar PV. Available online: https://www.iea.org/reports/solar-pv (accessed on 29 March 2021).
- Schallenberg-Rodríguez, J.; Montesdeoca, N.G. Spatial Planning to Estimate the Offshore Wind Energy Potential in Coastal Regions and Islands. Practical Case: The Canary Islands. Energy 2018, 143, 91–103. [Google Scholar] [CrossRef]
- PhilAtlas. Cuyo: Province of Palawan. Available online: https://www.philatlas.com/luzon/mimaropa/palawan/cuyo.html (accessed on 3 November 2019).
- PhilAtlas. Palawan. Available online: https://www.philatlas.com/luzon/mimaropa/palawan.html (accessed on 3 November 2019).
- Philippine Statistics Authority. Housing Characteristics in the Philippines (Results of the 2015 Census of Population). Available online: https://psa.gov.ph/population-and-housing/node/129804 (accessed on 14 October 2019).
- Majumdar, D.; Pasqualetti, M.J. Analysis of Land Availability for Utility-Scale Power Plants and Assessment of Solar Photovoltaic Development in the State of Arizona, USA. Renew. Energy 2019, 134, 1213–1231. [Google Scholar] [CrossRef]
- Charabi, Y.; Gastli, A. PV Site Suitability Analysis Using Gis-Based Spatial Fuzzy Multi-Criteria Evaluation. Renew. Energy 2011, 36, 2554–2561. [Google Scholar] [CrossRef]
- Al-Shammari, S.; Ko, W.; Ammar, E.A.A.; Alotaibi, M.A.; Choi, H.-J. Optimal Decision-Making in Photovoltaic System Selection in Saudi Arabia. Energies 2021, 14, 357. [Google Scholar] [CrossRef]
- Munkhbat, U.; Choi, Y. GIS-Based Site Suitability Analysis for Solar Power Systems in Mongolia. Appl. Sci. 2021, 11, 3748. [Google Scholar] [CrossRef]
- Global Wind Atlas 3.0. Available online: https://globalwindatlas.info/ (accessed on 3 October 2021).
- Tulang, A.B.; Bello, A.Q. Forecasting Power Load Demand Using Holt-Winters Model. Int. J. Educ. Res. High. Learn. 2018, 24, 115–124. [Google Scholar]
- Albraheem, L.; Alabdulkarim, L. Geospatial Analysis of Solar Energy in Riyadh Using a GIS-AHP-Based Technique. ISPRS Int. J. Geo-Inf. 2021, 10, 291. [Google Scholar] [CrossRef]
- USEPA (United States Environmental Protection Agency). Data Documentation for Mapping and Screening Criteria for Renewable Energy Generation Potential on EPA and State Tracked Sites RE-Powering America’s Land Initiative. Available online: https://www.epa.gov/sites/default/files/2015-04/documents/repowering_mapper_datadocumentation.pdf (accessed on 3 October 2021).
- Nebey, A.H.; Taye, B.Z.; Workineh, T.G. Site Suitability Analysis of Solar PV Power Generation in South Gondar, Amhara Region. J. Energy 2020, 2020, 3519257. [Google Scholar] [CrossRef]
- Anwarzai, M.A.; Nagasaka, K. Utility-Scale Implementable Potential of Wind and Solar Energies for Afghanistan using GIS Multi-Criteria Decision Analysis. Renew. Sustain. Energy Rev. 2017, 71, 150–160. [Google Scholar] [CrossRef]
- Pojadas, D.J.; Abundo, M.L.S. Spatio-Temporal Assessment and Economic Analysis of a Grid-Connected Island Province Toward a 35% or Greater Domestic Renewable Energy Portfolio: A Case in Bohol, Philippines. Int. J. Energy Environ. Eng. 2021, 12, 251–280. [Google Scholar] [CrossRef]
- Bina, S.M.; Jalilinasrabady, S.; Fujii, H.; Farabi-Asl, H. A Comprehensive Approach for Wind Power Plant Potential Assessment, Application to Northwestern Iran. Energy 2018, 164, 344–358. [Google Scholar] [CrossRef]
- Piirisaar, I. A Multi-Criteria GIS Analysis for Siting of Utility-Scale Photovoltaic Solar Plants in County Kilkenny, Ireland. Master’s Thesis, Geographical Information Science, Lund University, Lund, Sweden, 2019. [Google Scholar]
- Lozano-García, D.F.; Santibañez-Aguilar, J.E.; Lozano, F.J.; Flores-Tlacuahuac, A. GIS-based Modeling of Residual Biomass Availability for Energy and Production in Mexico. Renew. Sustain. Energy Rev. 2020, 120, 109610. [Google Scholar] [CrossRef]
- Ghose, D.; Naskar, S.; Shabbiruddin; Sadeghzadeh, M.; Assad, M.E.H.; Nabipour, N. Siting High Solar Potential Areas using Q-GIS in West Bengal, India. Sustain. Energy Technol. Assess. 2020, 42, 100864. [Google Scholar] [CrossRef]
- Díaz-Cuevas, P.; Domínguez-Bravo, J.; Prieto-Campos, A. Integrating MCDM and GIS for Renewable Energy Spatial Models: Assessing the Individual and Combined Potential for Wind, Solar and Biomass Energy in Southern Spain. Clean Technol. Environ. Policy 2019, 21, 1855–1869. [Google Scholar] [CrossRef]
- Gašparović, I.; Gašparović, M. Determining Optimal Solar Power Plant Locations Based on Remote Sensing and GIS Methods: A Case Study from Croatia. Remote Sens. 2019, 11, 1481. [Google Scholar] [CrossRef] [Green Version]
- Messaoudi, D.; Settou, N.; Negrou, B.; Rahmouni, S.; Settou, B.; Mayou, I. Site Selection Methodology for the Wind-Powered Hydrogen Refueling Station Based on AHP-GIS in Adrar, Algeria. Energy Procedia 2019, 162, 67–76. [Google Scholar] [CrossRef]
- Asakereh, A.; Soleymani, M.; Sheikhdavoodi, M.J. A GIS-Based Fuzzy-AHP Method for the Evaluation of Solar Farms Locations: Case Study in Khuzestan Province, Iran. Sol. Energy 2017, 155, 342–353. [Google Scholar] [CrossRef]
- Zahid, F.; Tahir, A.; Khan, H.U.; Naeem, M.A. Wind Farms Selection Using Geospatial Technologies and Energy Generation Capacity in Gwadar. Energy Rep. 2021, 7, 5857–5870. [Google Scholar] [CrossRef]
- Giamalaki, M.; Tsoutsos, T. Sustainable Siting of Solar Power Installations in Mediterranean using a GIS/AHP Approach. Renew. Energy 2019, 141, 64–75. [Google Scholar] [CrossRef]
- Sun, Y.-W.; Hof, A.; Wang, R.; Liu, J.; Lin, Y.-J.; Yang, D.-W. GIS-based Approach for Potential Analysis of Solar PV Generation at the Regional Scale: A Case Study of Fujian Province. Energy Policy 2013, 58, 248–259. [Google Scholar] [CrossRef]
- Aydin, N.Y.; Kentel, E.; Duzgun, H.S. GIS-based Site Selection Methodology for Hybrid Renewable Energy Systems: A Case Study from Western Turkey. Energy Convers. Manag. 2013, 70, 90–106. [Google Scholar] [CrossRef]
- Villacreses, G.; Gaona, G.; Martínez-Gómez, J.; Jijón, D.J. Wind Farms Suitability Location Using Geographical Information System (GIS), Based on Multi-Criteria Decision making (MCDM) methods: The Case of Continental Ecuador. Renew. Energy 2017, 109, 275–286. [Google Scholar] [CrossRef]
- Baseer, M.A.; Rehman, S.; Meyer, J.P.; Alam, M.M. GIS-based site suitability analysis for wind farm development in Saudi Arabia. Energy 2017, 141, 1166–1176. [Google Scholar] [CrossRef] [Green Version]
- Shah, S.A.A.; Solangi, Y.A.; Ikram, M. Analysis of Barriers to the Adoption of Cleaner Energy Technologies in Pakistan using Modified Delphi and Fuzzy Analytical Hierarchy Process. J. Clean. Prod. 2019, 235, 1037–1050. [Google Scholar] [CrossRef]
- Sánchez-Lozano, J.M.; García-Cascales, M.S.; Espinosa, N.; Urbina, A. Application of the AHP and TOPSIS Methods to the Assessment of Photovoltaic Technologies; Cambridge Scholars Publishing: Newcastle upon Tyne, UK, 2016; pp. 58–75. [Google Scholar]
- Zadeh, L.A. Fuzzy sets. Inf. Control 1965, 8, 338–353. [Google Scholar] [CrossRef] [Green Version]
- Putra, M.S.D.; Andryana, S.; Fauziah; Gunaryati, A. Fuzzy Analytical Hierarchy Process Method to Determine the Quality of Gemstones. Adv. Fuzzy Syst. 2018, 2018, 9094380. [Google Scholar] [CrossRef]
- Hapsari, M.A.; Subiyanto, S. Fuzzy AHP Based Optimal Design Building-Attached Photovoltaic System for Academic Campus. Int. J. Photoenergy 2020, 2020, 6508329. [Google Scholar] [CrossRef] [Green Version]
- Hwang, C.L.; Yoon, K. Multiple Attribute Decision Making: Methods and Applications: A State-of-the-Art Survey; Springer: Berlin, Germany; New York, NY, USA, 1981. [Google Scholar]
- Ghorbani, N.; Makian, H.; Breyer, C. A GIS-based Method to Identify Potential Sites for Pumped Hydro Energy Storage—Case of Iran. Energy 2019, 169, 854–867. [Google Scholar] [CrossRef]
- Kengpol, A.; Rontlaong, P.; Tuominen, M. A Decision Support System for Selection of Solar Power Plant Locations by Applying Fuzzy AHP and TOPSIS: An Empirical Study. J. Softw. Eng. Appl. 2013, 6, 470–481. [Google Scholar] [CrossRef] [Green Version]
- Department of Energy. Biomass, Solar, Wind and Ocean. Available online: https://www.doe.gov.ph/biomass-solar-wind-and-ocean (accessed on 30 August 2021).
- The World Bank Group. Global Solar Atlas. Available online: https://globalsolaratlas.info/map (accessed on 19 September 2021).
- Sotiropoulou, K.F.; Vavatsikos, A.P. Onshore Wind Farms GIS-Assisted Suitability Analysis Using PROMETHEE II. Energy Policy 2021, 158, 112531. [Google Scholar] [CrossRef]
- International Finance Corporation: World Bank Group. Utility-Scale Solar Photovoltaic Power Plants: A Projects Developer’s Guide. Available online: https://www.ifc.org/wps/wcm/connect/a1b3dbd3-983e-4ee3-a67b-cdc29ef900cb/IFC+Solar+Report_Web+_08+05.pdf?MOD=AJPERES&CVID=kZePDPG (accessed on 14 October 2021).
- New Zealand Energy Association. Considering a Wind Farm on Your Land? Available online: https://www.windenergy.org.nz/store/doc/Considering_a_wind_farm.pdf (accessed on 9 October 2021).


| Study Area | Location | Area (km2) | Population | No. of Households | Density (Population/km2) | No. of Barangay |
|---|---|---|---|---|---|---|
| Araceli | Latitude: 10°33′32″ N Longitude: 119°59′40″ E | 204.30 | 14,895 | 3294 | 73 | 13 |
| Balabac | Latitude: 07°59′ N Longitude: 117°03′ E | 581.6 | 22,184 | 5103 | 69 | 20 |
| Cuyo | Latitude: 10°51′ N Longitude: 121°01′ E | 84.95 | 39,853 | 8445 | 263 | 17 |
| Code | Data Layer | Criteria | Restriction Factor | Category | Format | Source | Description | References | |
|---|---|---|---|---|---|---|---|---|---|
| Solar PV | Wind | ||||||||
| C1S C1W | Resource potential | GHI > 3.56 kWh/m2 | Wind speed < 5.5 m/s at 50 m | -- | Technical | Raster | SolarGIS, Global Solar Atlas, Global Wind Atlas | GHI: It is the total amount of microwave radiation absorbed by a horizontal surface on the ground. Wind speed: Average annual wind speed at 50 m above ground in off-grid areas. | [112,113,114,115] |
| C2 | Slope | >5° | >15° | Topography | Technical | Raster | Earthdata, NAMRIA | It is the degree of inclination of the surface, usually in degrees or in percent generated from DEM. | [106,107,116] |
| C3 | Aspect | South-facing | -- | Topography | Technical | Raster | Earthdata | The orientation of a surface and is considered as the slope direction. | [106,107,108,117] |
| C4 | Electric networks | <100 m | <100 m | Technology | Technological | Vector | PALECO | Transmission and distribution power lines | [118,119,120] |
| C5 | Roads | <100 m | <500 m | Infrastructure | Socio-economic | Vector | OpenStreet Map, Google Satellite | Proximity to roads, highways, paved paths, unpaved paths, etc. | [43,117,118,119,121,122] |
| C6 | Built-up areas | <500 m | <1000 m | Infrastructure | Socio-economic | Vector | OpenStreet Map, Google Satellite | Residential, parking lots, commercial buildings, parks, gardens, etc. | [123,124] |
| C7 | Water bodies | <100 m | <100 m | Hydrology | Environmental | Vector | OpenStreet Map, Google Satellite | Lakes, rivers, reservoirs, etc. | [115,121,125] |
| C8 | Land use/ land cover | Avoid | Avoid | Land use, Ecology | Environmental | Vector | PhilGIS | Irrigated areas, forests, agricultural lands, mangrove areas, etc. | [123,126,127,128] |
| Linguistic Values | AHP Scale | TFN Scale (l, m, u) | Reciprocal TFN |
|---|---|---|---|
| Equal importance | 1 | (1, 1, 1) | (1, 1, 1) |
| Intermediate value | 2 | (1, 2, 3) | (1/3, 1/2, 1) |
| Moderate importance | 3 | (2, 3, 4) | (1/4, 1/3, 1/2) |
| Intermediate value | 4 | (3, 4, 5) | (1/5, 1/4, 1/3) |
| Strong importance | 5 | (4, 5, 6) | (1/6, 1/5, 1/4) |
| Intermediate value | 6 | (5, 6, 7) | (1/7, 1/6, 1/5) |
| Very strong importance | 7 | (6, 7, 8) | (1/8, 1/7, 1/6) |
| Intermediate value | 8 | (7, 8, 9) | (1/9, 1/8, 1/7) |
| Extreme importance | 9 | (9, 9, 9) | (1/9, 1/9, 1/9) |
| Year | Energy Demand (MWh) | ||
|---|---|---|---|
| Araceli | Balabac | Cuyo | |
| 2017 | 790.850 | 499.404 | 5855.638 |
| 2018 | 949.633 | 552.387 | 6337.064 |
| 2019 | 1054.212 | 705.619 | 6848.156 |
| 2020 | 1186.260 | 843.871 | 7406.970 |
| 2021 | 1242.335 | 931.602 | 7407.427 |
| Year | Energy Demand (MWh) | ||
|---|---|---|---|
| Araceli | Balabac | Cuyo | |
| 2022 | 1285.385 | 1075.364 | 8065.971 |
| 2023 | 1326.303 | 1209.334 | 8677.474 |
| 2024 | 1367.220 | 1343.303 | 9288.978 |
| 2025 | 1408.137 | 1477.273 | 9900.482 |
| 2026 | 1449.055 | 1611.242 | 10,511.986 |
| 2027 | 1489.972 | 1745.212 | 11,123.489 |
| 2028 | 1530.889 | 1879.182 | 11,734.993 |
| 2029 | 1571.807 | 2013.151 | 12,346.497 |
| 2030 | 1612.724 | 2147.121 | 12,958.001 |
| Criteria | Sub-Criteria | FUZZY Weight | Crisp Weight | Normalized Weight | |||
|---|---|---|---|---|---|---|---|
| Solar PV | Wind | Solar PV | Wind | Solar PV | Wind | ||
| Technical | C1s GHI | (0.201, 0.319, 0.490) | - | 0.337 | - | 0.316 | - |
| C1w Wind speed | - | (0.192, 0.333, 0.540) | - | 0.355 | - | 0.327 | |
| C2 Slope | (0.135, 0.204, 0.309) | (0.154, 0.265, 0.453) | 0.216 | 0.291 | 0.203 | 0.267 | |
| C3 Aspect | (0.124, 0.190, 0.291) | - | 0.202 | - | 0.189 | - | |
| Technological | C4 Electric network | (0.064, 0.097, 0.153) | (0.082, 0.122, 0.189) | 0.105 | 0.131 | 0.098 | 0.121 |
| Socio-economic | C5 Roads | (0.046, 0.071, 0.111) | (0.064, 0.104, 0.173) | 0.076 | 0.114 | 0.071 | 0.105 |
| C6 Built up areas | (0.035, 0.055, 0.086) | (0.058, 0.092, 0.142) | 0.059 | 0.097 | 0.055 | 0.089 | |
| Environmetal | C7 Water bodies | (0.021, 0.033, 0.053) | (0.027, 0.042, 0.079) | 0.035 | 0.049 | 0.033 | 0.045 |
| C8 Land use/land cover | (0.020, 0.031, 0.058) | (0.025, 0.042, 0.082) | 0.036 | 0.050 | 0.034 | 0.046 | |
| CR = 0.061 | CR = 0.054 | ||||||
| Study Area and Locations | Total Area (m2) | Performance Score | ||||||||
|---|---|---|---|---|---|---|---|---|---|---|
| Solar PV | Wind | Solar PV | Wind | |||||||
| di+ | di− | CPi | Rank | di+ | di− | CPi | Rank | |||
| Araceli | ||||||||||
| L1 | 131,813 | 4,563,000 | 0.048 | 0.088 | 0.646 | 3rd | 0.110 | 0.133 | 0.546 | 1st |
| L2 | 182,860 | 8178,000 | 0.088 | 0.059 | 0.404 | 5th | 0.133 | 0.110 | 0.454 | 2nd |
| L3 | 181,688 | -- | 0.047 | 0.087 | 0.649 | 2nd | -- | -- | -- | -- |
| L4 | 51,585 | -- | 0.060 | 0.086 | 0.590 | 4th | -- | -- | -- | -- |
| L5 | 238,280 | -- | 0.008 | 0.101 | 0.922 | 1st | -- | -- | -- | -- |
| Balabac | ||||||||||
| L1 | 226,891 | -- | 0.054 | 0.058 | 0.514 | 3rd | -- | -- | -- | -- |
| L2 | 238,558 | -- | 0.025 | 0.065 | 0.723 | 1st | -- | -- | -- | -- |
| L3 | 121,919 | -- | 0.060 | 0.037 | 0.381 | 4th | -- | -- | -- | -- |
| L4 | 133,057 | -- | 0.043 | 0.055 | 0.563 | 2nd | -- | -- | -- | -- |
| Cuyo | ||||||||||
| L1 | 200,565 | 4,330,000 | 0.020 | 0.025 | 0.550 | 2nd | ** | ** | ** | 1st |
| L2 | 54,498 | -- | 0.036 | 0.004 | 0.092 | 3rd | -- | -- | -- | -- |
| L3 | 225,405 | -- | 0.005 | 0.035 | 0.881 | 1st | -- | -- | -- | -- |
| RETs | Current Installed Rated Capacity (MW) | Potential Rated Capacity (MW) | Battery Storage | Annual Generated Potential (MWh) | Load Demand (MWh) | ||
|---|---|---|---|---|---|---|---|
| Qty | Capacity (Ah) | Present | Forecasted (Year 2030) | ||||
| Araceli | |||||||
| Solar PV-battery storage | 1.386 | 2.643 | 437 | 60 | 3911.569 | 1242.335 | 1612.724 |
| Wind-battery storage | 10.560 | 426 | 60 | 34,533.091 | |||
| Balabac | |||||||
| Solar PV-battery storage | 1.086 | 1.397 | 401 | 60 | 2201.624 | 931.602 | 2147.121 |
| Cuyo | |||||||
| Solar PV-battery storage | 3.2 | 11.399 | 3234 | 60 | 17,676.309 | 7407.427 | 12,958.001 |
| Wind-battery storage | 8.7 | 4049 | 60 | 31,947.048 | |||
Publisher’s Note: MDPI stays neutral with regard to jurisdictional claims in published maps and institutional affiliations. |
© 2021 by the authors. Licensee MDPI, Basel, Switzerland. This article is an open access article distributed under the terms and conditions of the Creative Commons Attribution (CC BY) license (https://creativecommons.org/licenses/by/4.0/).
Share and Cite
Supapo, K.R.M.; Lozano, L.; Tabañag, I.D.F.; Querikiol, E.M. A Geospatial Approach to Energy Planning in Aid of Just Energy Transition in Small Island Communities in the Philippines. Appl. Sci. 2021, 11, 11955. https://doi.org/10.3390/app112411955
Supapo KRM, Lozano L, Tabañag IDF, Querikiol EM. A Geospatial Approach to Energy Planning in Aid of Just Energy Transition in Small Island Communities in the Philippines. Applied Sciences. 2021; 11(24):11955. https://doi.org/10.3390/app112411955
Chicago/Turabian StyleSupapo, Khrisydel Rhea M., Lorafe Lozano, Ian Dominic F. Tabañag, and Edward M. Querikiol. 2021. "A Geospatial Approach to Energy Planning in Aid of Just Energy Transition in Small Island Communities in the Philippines" Applied Sciences 11, no. 24: 11955. https://doi.org/10.3390/app112411955