Featured Application
Adsorption of Cu2+ ions from aqueous solution and desorption of Cu2+ from WPET-SiAMPy composite nanofibres.
Abstract
The accumulation of plastic waste products in the environment has adversely affected wildlife and human beings. Common plastics that accumulate in the environment are plastics that are made of polyethylene terephthalate (PET) polymer. PET plastic waste products can be recycled for beneficial use, which would reduce their negative impacts. In this study, modified PET or waste PET (WPET) from plastic bottles was blended with powder commercial 2-(aminomethyl)pyridine (SiAMPy) resin and electrospun into composite nanofibres and applied for Cu2+ adsorption. PET-SiAMPy or WPET-SiAMPy composite nanofibres fibre diameters from the HRSEM images were 90–140 nm and 110–155 nm, respectively. In batch adsorption experiments, PET-SiAMPy or WPET-SiAMPy composite nanofibres achieved Cu2+ adsorption equilibrium within 60 secs of contact time with 0.98 mmol/g (89.87%) or 1.24 mmol/g (96.04%) Cu2+ adsorption capacity. The Cu2+ complex formation rate () with WPET-SiAMPy was 0.0888 with the mole ratio of Cu2+ and WPET-SiAMPy nanofibres 1:2. The complex molecular formula formed was Cu(WPET-SiAMPy)2 with a square planar geometry structure. The WPET-SiAMPy nanofibres’ adsorption was best fitted to the Freundlich isotherm. WPET-SiAMPy composite nanofibres were considered highly efficient for Cu2+ adsorption from aqueous solution and could be regenerated at least five times using 5 M H2SO4.
1. Introduction
Globally, the growth of our economy and modern life depends on industries that use plastic in near-unlimited applications such as packaging, textiles, agriculture, automotive, electronics, building, and construction, or machinery. These applications increase the quantity of plastic waste being discarded into our environment [1]. Common plastics that accumulate in the environment are plastics made of polyethylene terephthalate (PET) polymer, adding to chemical persistence, and their mechanical fragmentation into microplastics promotes their ingestion by even small organisms such as zooplankton, and their entry into the human food chain [2]. These plastic waste products can be recycled for beneficial use which would reduce their negative impacts and help minimize a vast number of organic pollutants reported in water [3]. The organic and inorganic contaminants present in drinking water sources and in industrial waste streams need to be controlled to an acceptable level according to environmental regulations worldwide [4] and this requires the protection of natural resources such as ground water, rivers, oceans, and lakes. Moreover, the inorganic contaminants present in various waste effluents are not only toxic metals, but these effluents also contain some valuable metals that can be extracted and reused. Some of these metal ions are not biodegradable or bio transformable, therefore they exist in the environment for longer periods of time [5]. Thus, this research will report the repurposing of waste PET materials for the recovery of Cu metal ions from aqueous solutions.
Electrospinning is an easy and inexpensive process of forming ultrafine fibres in the range from the nano- to micrometre. The electrospinning process can produce sub-micron-sized polymer fibres with a small interfibrous pore size using the electrostatically driven jets of polymer solutions [6]. When an adequate, high voltage is applied to the solution droplet, the body of the solution becomes charged and electrostatic repulsion counteracts the surface tension. Thus, the droplet is stretched and the jet spurt solidifies into a fibre, which is collected by an aluminium collector [7]. Modified nanofibres’ applications in adsorption are considerably growing and are projected to double by 2040 due to unique properties such as high surface area per unit mass, high porosity, low basis weight, layer thinness, high permeability, superior directional strength, and cost-effectiveness [8,9].
Adsorption depends on a selection of process conditions, for example the pH, metal concentration, adsorbent concentration, and type of metal ions. The adsorption process involves several technical aspects that can be analysed from a process intensification perspective. Van Gerven and Stankiewicz [10] have described the process intensification based on several fundamental principles and approaches. These fundamental principles have been identified to be the adsorbent synthesis, process design, optimization of the operating conditions, modelling of the adsorption process, regeneration, and the life cycle analysis of the adsorbent [11]. Thus, process intensification aims to modify the material while also improving the adsorption binding kinetics, with improved specific adsorbent surface area [12]. The supplied SiAMPy contains 2-(aminomethyl)pyridine groups that are supported on silica [13] and the 2-(aminomethyl)pyridine groups are Lewis base chelating ligands and are also called the complexing agent [14]. The 2-(Aminomethyl)pyridine ligand is an N,N’-bidentate ligand containing aromatic pyridine aliphatic amine donor function. It was postulated that the blended WPET-SiAMPy composite nanofibres can form Lewis’s acid/base bonds with Cu2+ metal ions during the adsorption process. The Cu2+ ions should be desorbed from the WPET-SiAMPy composite nanofibres by a simple regeneration process.
Adsorption is performed with activated carbon as the adsorbent is frequently used for the removal of diverse metals present at trace levels, but this adsorbent is nonselective. Compared to conventional resources, carbon-based materials possess useful properties such as hydrophobic surfaces, a high surface area, large pore volume, chemical inertness, good thermal and mechanical stability, easy handling, and low cost of manufacture. In the context of green chemistry, polyethylene terephthalate (PET), which is versatile, lightweight, flexible, moisture resistant, robust, and relatively inexpensive, is especially attractive for its unique physicochemical properties such as excellent chemical stability [9]. The employment of readily available low-cost materials such as waste PET that are reusable as a substitute for carbon adsorbents is prospective for sustainable contaminated water treatment and offers the potential for environment clean-up [15]. Focusing on developing highly effective nanofibres from waste PET thus could decrease plastic waste pollution. This can be achieved by electrospinning PET nanofibres, and by blending these nanofibres with suitable inorganic metal adsorbents, could enhance their kinetics of adsorption because of the highly enhanced surface area the nanofibres possess.
Repurposing WPET into bead-free nanofibres was studied and compared with commercial PET. This study aimed to report the synthesis, characterization, and incorporation of a commercial SiAMPy resin into PET or WPET nanofibres to increase the adsorption capacity of the nanofibres for the selective recovery of valuable metals such as Cu2+ from metal laden effluents. Several experiments on the adsorption parameters such as contact time, initial concentration, and solution pH, as well as the kinetics of adsorption on the removal of Cu2+ were studied. The adsorption and desorption conditions were investigated to determine the regeneration of the adsorbent for commercial production.
2. Materials and Methods
The reagents such as polyethylene terephthalate (PET), trifluoroacetic acid (TFA), copper (II) nitrate hemi(pentahydrate) and sodium hydroxide (NaOH) were all purchased from Sigma-Aldrich, South Africa, and used without further purification. The functionalized commercial silica supported 2-aminomethylpyridine (SiAMPy) used to improve the nanofibre adsorption capacity was supplied by the collaborating institute Lappeenranta University of Technology, Laboratory of Industrial Chemistry, in sealed glass vials. The electrospinning process of commercial PET was adopted from previously conducted studies by Pereao, 2018 [16] with inconsequential adjustments.
2.1. Preparation of PET and WPET Nanofibres
The PET was electrospun as the reference material for waste PET nanofibres. Waste polyethylene terephthalate (WPET) was obtained from wastewater bottles (500 mL) collected from the same production batch. All bottles were cleaned and rinsed with ethanol and dried at room temperature. The bottles were thinly shredded into 2 × 2 mm2 pieces. The PET or WPET solution was prepared by means of dissolving 1.66 g of PET or WPET with 14.9 g (10 mL) of TFA making a solution with a concentration of 10 wt.%. The 10 wt.% PET was dissolved at room temperature overnight for preparing a homogeneous solution while the dissolution of the WPET bottle pieces was carried out at room temperature for 30 min to ensure a homogeneous solution. The 10 wt.% PET or WPET solutions were electrospun by introducing the PET or WPET polymer solution into two 20 mL syringes, each fitted with a stainless-steel hypodermic needle of gauge 19, respectively. The two syringes were then placed in a pump for controlling the flow rate of the solution which was set at 0.8 mL/h or 0.05 mL/h during electrospinning. An electric field voltage of 17 kV was applied across the needles and the Al foil collector was positioned at a distance of 17 cm or 14 cm. The electrospinning process took place at room temperature to ensure the thorough evaporation of the solvent. The nature of each polymer solution was taken into consideration when electrospinning. The electrospinning lasted for 5 h or 2 h for PET or WPET polymer solution.
2.2. Modification of PET and WPET Nanofibres with SiAMPy
The PET and WPET nanofibres were modified with SiAMPy through a blending process. This process was carried out by grinding using mortar and pestle, then further sieving (63 µm) the SiAMPy to select particles with an average size of 92.95 nm as measured in HRSEM image Figure 1a. The ground up SiAMPy (0.01 wt.%) was blended into the PET or WPET (10 wt.%) polymer solutions with TFA as solvent, and used as the sol–gel precursor, respectively. The solutions were stirred for 30 min at room temperature to ensure the homogeneity of the solution upon electrospinning. The PET-SiAMPy or WPET-SiAMPy solutions were electrospun by introducing 5 mL of the blended polymer solution into a 20 mL syringe fitted with 19 G needle. The syringe was fixed in a pump during electrospinning for monitoring the flow rate of the solution and was set at 0.8 mL/h or 0.05 mL/h, respectively. An electric field voltage of 20 kV was applied across the needle and the Al foil collector, which was positioned at a distance 14 cm.
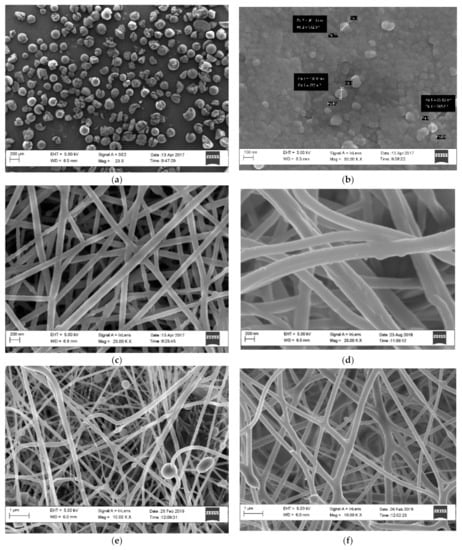
Figure 1.
HRSEM images of (a): supplied SiAMPy; (b): ground and sieved SiAMPy; (c): PET (0.8 mL/h, 17 kV, 17 cm); (d): WPET (0.05 mL/h, 17 kV, 14 cm); (e): PET-SiAMPy (0.8 mL/h, 20 kV, 14 cm) and (f): WPET-SiAMPy (0.05 mL/h, 20 kV, 14 cm) nanofibre morphology.
2.3. Characterization Protocol
Characterization techniques provide the chemical, physical and mechanical properties giving information on every material used in this study. The basic principles of the instrumentation and their application used in this research study are discussed below.
2.3.1. HRSEM Measurement
The surface morphology of the PET, WPET, PET-SiAMPy, and WPET-SiAMPy electrospun nanofibres were determined using a high-resolution field emission gun scanning electron microscope (HRFEGSEM) and an Auriga Gemini FEG SEM (HRSEM). The electrospun nanofibres were coated with conductive carbon using a sputter-coating technique with an electric field and argon gas to prevent the nanofibres charging during analysis. The HRSEM images were taken on various spots of the nanofibre with varying magnification.
2.3.2. ATR-FTIR Measurement
The instrument Perkin Elmer 100 FT-IR spectrometer (ATR-FTIR) was used to determine the functional groups of the surface of electrospun nanofibres (PET and WPET) before and after modification (PET-SiAMPy and WPET-SiAMPy). The samples were individually placed on the diamond crystal of the ATR holder then fixed for the perfect contact of the sample with the crystal. The FTIR instrument wavelength range was set to 4000 cm−1 to 650 cm−1 against transmittance with 2.0 resolution at 64 scanning times. For every analysis, the baseline of the FTIR was corrected using the background spectrum of the blank scan. The FTIR diamond crystal and ATR holder were cleaned with ethanol before every analysis to prevent the cross-contamination of the samples.
2.3.3. TGA Measurement
The TGA 4000 PerkinElmer thermal analyser instrument was used to determine the changes in physical and chemical composition of the PET, WPET, and CS nanofibres by measuring the weight loss due to an increasing temperature profile applied to the nanofibres. The nanofibres’ decomposition was conducted to determine the thermal behaviour of the nanofibres before and after their surface modification. The TGA instrument was calibrated before each analysis to stabilize the instrument baseline. The TGA technique for the PET, WPET, and CS nanofibres was carried out using the TGA 4000 PerkinElmer thermal analyser. The PET, WPET, and SiAMPy (0.05 g) were weighed out in the sample holder and placed in the instrument. The analysis was performed in nitrogen with a flow rate of 20 mL/min and the heating rate was set at 20 °C/min up to 800 °C.
2.3.4. ICP-OES Measurement
The Varian Radial ICP-OES (High Matrix Introduction (HMI) accessory, Collision gas; Ar) instrument was used to determine the concentration of Cu2+ after adsorption and regeneration experiments, respectively. The ICP-OES analysis was carried out to determine the concentration of the adsorbate obtained from the adsorption equilibrium of the metal ion solution.
2.4. Adsorption Process Using the PET-SiAMPy or WPET-SiAMPy Nanofibres
Batch adsorption experiments were carried out to determine the optimum contact time, adsorbent dosage, Cu2+ aqueous solution pH, and the initial concentration of the adsorbate (Cu2+). The batch experiments were performed by immersing 0.01 g of the adsorbent into the Cu2+ aqueous solution of 100 mgL−1 initial concentration. The Cu2+ aqueous solution with the adsorbent was agitated at 190 rpm for 120 min. Thereafter, the Cu2+ aqueous solution concentration was sampled at fixed intervals and determined using ICP-OES. The evolution of the Cu2+ aqueous solution concentration was monitored to equilibrium. The adsorption capacity of the adsorbents was calculated using the following Equation:
where is the equilibrium adsorption capacity per gram of dry weight of the adsorbent (mg/g), is the initial concentration of Cu2+, is the final concentration of Cu2+ (mgL−1), V is the volume of the solution (L) and W is the weight of the dry adsorbent (g) .
The adsorption (R) is defined in Equation (2)
The percentage recovery is defined in Equation (3):
Adsorption experiments were studied using the isotherm and kinetics modelling to know the details about the performance, mechanisms, practical design, and the operation of the adsorption systems.
3. Results and Discussion
3.1. Characterization of Electrospun PET, WPET, PET-SiAMPy, and WPET-SiAMPy Nanofibres
The SiAMPy-modified PET and WPET nanofibres were characterized with HRSEM to visualize the morphology of the composite nanofibres as shown in Figure 1.
The HRSEM image of SiAMPy as supplied is shown in Figure 1a while the ground SiAMPy in Figure 1b demonstrated the agglomerated structure of the powder with a size range from 85 to 103 nm. The supplied SiAMPy initially possessed large, agglomerated units that needed to be ground to powder. This was performed to increase the surface area of the SiAMPy, thus increasing the adsorption capacity by limiting diffusional constraints of large units and making the powder SiAMPy easier to incorporate into the polymer solutions, respectively. The powder SiAMPy was completely dissolved in the electrospinning solvent. Figure 1c,d show the HRSEM images with the nanofibre morphology of PET and WPET, both of which consisted of smooth, uniform, homogeneous, and well-structured nanofibres with varying diameters in the range of 90–130 nm, respectively. The polymer solution flow rate and collecting distance of WPET was varied for possible spinnability conditions, with the PET electrospinning conditions as the reference. The WPET polymer solution was spinnable at 0.05 mL/h flow rate and at a collecting distance of 14 cm. The homogeneous structured PET and WPET nanofibres in Figure 1c,d prove the success of the electrospinning procedure and the optimum conditions under which PET and WPET nanofibre formation occurred (see Table 1). In the HRSEM images of PET-SiAMPy (e) and WPET-SiAMPy (f) composite nanofibres showed bead formation on the PET-SiAMPy nanofibres that were spun using a flow rate of 0.8 mL/h. The formation of beading visible in Figure 1e could be due to the repulsive forces between PET polymer and S–AMPy nanoparticles’ ionic groups that arise due to the application of the high electric field during electrospinning. Figure 1f showed consistent, smooth, and homogeneous nanofibres for WPET-SiAMPy nanofibres that were spun at a flow rate of 0.05 mL/h. The electrospinning flow rate was set according to the polymer solution viscosity. The WPET-SiAMPy polymer solution was more viscous compared to the PET-SiAMPy polymer solution, thus the WPET-SiAMPy polymer solution electrospinning flow rate was observed to be lower than PET-SiAMPy polymer solution. The HRSEM image (f) shows good blending between the SiAMPy and the WPET polymer under the applied electrospinning conditions which were 0.05 mL/h flow rate, 20 kV applied electric field voltage and 14 cm collecting distance. The interconnected nanofibres in the HRSEM image (e) were due to the polymer concentration and the concentration of the solvent TFA. Biazar et al. [17] previously reported that TFA formed interconnected nanofibres with branches and twigs, due to the high TFA concentration that lowered the evaporation rate and caused bonding between nanofibres. The WPET-SiAMPy nanofibres thus had better nanofibre morphology compared to the PET-SiAMPy nanofibres, showing the benefit of reusing WPET for preparing functional nanofibres.

Table 1.
Sample codes and optimum electrospinning conditions for each sample.
The FTIR spectra for PET and WPET nanofibres shown in Figure 2a demonstrate similar FTIR patterns which means that the PET commercial nanofibres and the recycled WPET nanofibres possess the same functional groups.
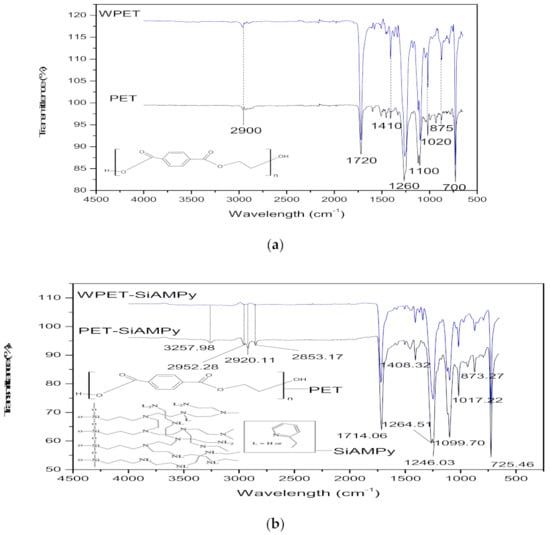
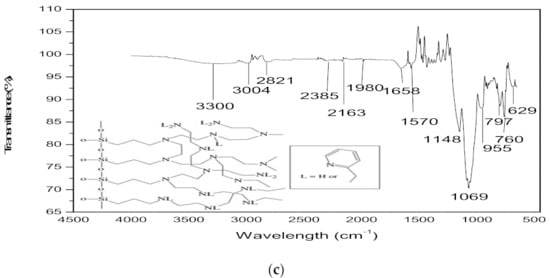
Figure 2.
ATR-FTIR patterns of (a): PET (0.8 mL/h, 17 kV, 17 cm) and WPET (0.05 mL/h, 17 kV, 14 cm) nanofibres; (b): PET-SiAMPy (0.8 mL/h, 20 kV, 14 cm) and WPET-SiAMPy (0.05 mL/h, 20 kV, 14 cm) and (c): SiAMPy.
The spectrum of both PET and WPET in Figure 2a shows a weak band at 2900 cm−1 that corresponds to the C–H functional group [18]. The carbonyl stretch C=O ester functional group was shown by a strong band at 1720 cm−1. The asymmetric C–C–O is present at 1260 cm−1 and the O–C–C stretching at 1100 cm−1 band. The strong peak at 700 cm−1 represents the shifted aromatic functional group C–H wag, which was affected by the presence of the carbonyl functional group [19]. Figure 2c of SiAMPy itself shows relatively weak absorption bands from 3004 to 3300 cm−1 which are indicative of the amine functional group in the functionalized commercial silica supported 2-aminomethylpyridine. The CH functional group vibrations are weakly visible in the wavelength that is between 2821 and 3004 cm−1 absorption band [20]. The fingerprint region ranging from 600 to 1148 cm−1 presents very strong absorption bands that identify amino-methyl(pyridine). This is affirmed by the absorption band at 955 cm−1 which indicates the Si–O functional group stretching modes [21]. The absorption band at 629 cm−1 was assigned to NH2 rocking mode. The region from 600 to 650 cm−1 exhibited the CCN functional group which was also present in the functionalized commercial silica supported 2-aminomethylpyridine ring [22].
The FTIR patterns for the PET-SiAMPy and WPET-SiAMPy composite nanofibres formed through the blending process via electrospinning is shown in Figure 2b. The spectra demonstrated the weak band intensity that corresponds to the N–H functional group attributed to the SiAMPy at 3258 cm−1. The carbonyl stretch C=O ester functional group was shown at 1714 cm−1 with a strong intensity band. The asymmetric C–C–O was present at 1265 cm−1 and 1246 cm−1 with a strong intensity band, while the O–C–C stretching was visible with a strong band at 1100 cm−1. The strong peak at 725 cm−1 represents the shifted aromatic functional group C–H wag, which was affected by the presence of the carbonyl functional group present in polyethylene terephthalate [19]. The relatively weak absorption band at 3258 cm−1 is indicative of the amine functional group which relates to NH vibrations in the functionalized commercial silica supported 2-aminomethylpyridine (SiAMPy). The CH functional group vibrations are weakly visible in the wavelengths between 2952 cm−1 and 2853 cm−1 absorption bands. The fingerprint region, ranging from 725 cm−1 to 1100 cm−1, presents very strong absorption bands that possess the characteristics of aminomethylpyridine, which was also present in the functionalized commercial silica supported 2-aminomethylpyridine ring [22].
The TGA and first derivative weight loss plots obtained under N2 inert atmosphere are shown in Figure 3. The thermal decomposition of the PET nanofibres under pyrolytic inert conditions with a N2 flow rate of 20 mL/min started with the gradual 8.12% increase in weight from 15 °C to ~380 °C. The initial 8.12% weight increase in the PET nanofibres was related to the expansion of the PET nanofibres, which was due to an endothermic reaction occurring. The successive thermal degradation of the PET nanofibres begins at ~380 °C and ends at ~450 °C, where 70.40% weight of the PET nanofibres was lost. The depolymerization of the PET nanofibres was occurring at this second stage, forming a carbon black residue. The last stage of the thermal decomposition in the range of ~450 °C to 900 °C, (8.63% weight) is ascribed to the loss of the carbon by-products that formed [23].
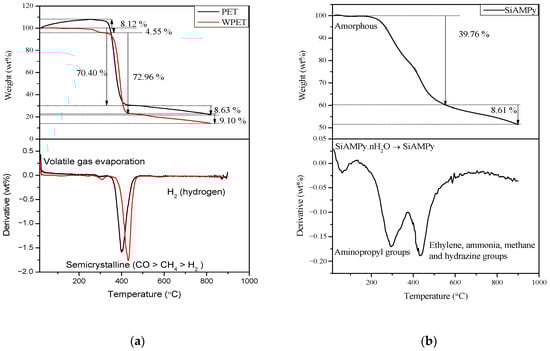
Figure 3.
TGA and first derivative pattern of (a) PET, WPET nanofibres (0.8 mL/h, 17 kV, 17 cm) and (b) SiAMPy.
The first stage of the thermal decomposition for the WPET nanofibres started at approximately 290 °C to ~350 °C, which may be the result of the evaporation of volatile gases in the WPET nanofibres. The WPET nanofibres lost approximately 4.55% of their weight in the first stage. Then, the weight of the WPET nanofibres was constant until a successive degradation occurred from 400 °C to ~460 °C. At this stage, the WPET weight loss was approximately 72.96%. The gradual weight loss of 9.10% from ~460 °C to 900 °C in the last stage of thermal decomposition was the loss of carbon by-products that formed during the degradation of the WPET nanofibres [23].
The shape of the TGA profiles of PET and WPET nanofibres were found to be consistent with the increase in temperature. The first derivative plots corresponds with the TGA plots as the PET and WPET nanofibres pyrolysis at ~380 °C to ~460 °C are shown with the endothermic peak degradation in the first derivative plot. Finally, the PET and WPET nanofibres thermal decomposition ended with a residue accumulation of ~9%. This corresponds with the thermal degradation investigation of waste polyethylene terephthalate (PET) under inert and oxidative environments [24].
Figure 3b the thermal decomposition of the SiAMPy starts with the dehydration process from 15 °C to ~200 °C, the weight loss is quite insignificant. The SiAMPy weight loss was due to loss of moisture. Thereafter, the successive thermal decomposition of the SiAMPy occurred in sequential stages over a temperature range from 200 °C to 580 °C, where a sharp weight loss of approximately 39.76% was evident. Subsequently, the thermal decomposition rate slowed down with the weight loss of 8.61% between 500 °C and 900 °C as the SiAMPy reached its thermal decomposition end point [24]. The first derivative peaks present the three decomposition stages exhibited by SiAMPy. The first stage represents the elimination of adsorbed moisture as
followed by the decomposition of aminopropyl groups which slowly occurred at approximately 300 °C that led to the rapid degradation that occurred at ~440 °C yielding H2O, HNO3 and ethylene groups. The final stage was the formation of residue containing ethylene, ammonia, methane, and hydrazine. Shafqat et al. reported similar data for the amino-functionalized silica nanoparticles used in an investigation of efficient and rapid removal of COD from pre-treated palm oil effluent [25].
SiAMPy·nH2O → SiAMPy
3.2. Adsorption Studies of Cu2+ Metal Ion
The aim of this section was the optimization of the recovery of the valuable metal Cu2+ by the modified chelating adsorbents nanofibres, as described in Section 2.3. The experiment determined the adsorption efficiency of the modified chelating adsorbent nanofibres for Cu2+ recovery from aqueous solution by varying parameters in the Cu2+ aqueous solution such as pH, initial concentration, contact time, and mass loading.
3.2.1. Effect of Cu2+ Aqueous Solution pH Using Modified WPET-SiAMPy Composite Nanofibres
The effect of aqueous solution pH on Cu2+ recovery was studied using PET, WPET, and modified nanofibres (WPET-SiAMPy composite nanofibres). The Cu2+ aqueous solution pH experiments were made up to pH 6 in order to prevent the precipitation of the Cu2+ (see Figure 4). The experiments were carried out in 100 mL of 100 mgL−1 of Cu2+ aqueous solution using 0.01 g of the nanofibres dosage by manually adjusting the Cu2+ aqueous solution with 0.1 M of HNO3 or NaOH solution to the desired pH value (1, 2, 3, 4, 5 and 6). The equilibrium data shown in Figure 4 were correlated using adsorption capacity (qe) Equation (1).
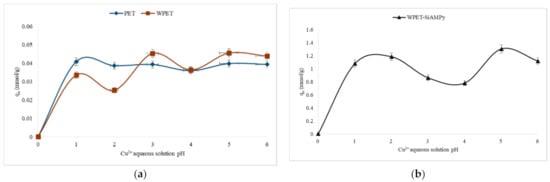
Figure 4.
Adsorption capacity of Cu2+ from aqueous solution pH using (a) PET, WPET, and (b) WPET-SiAMPy nanofibres (Cu2+ concentration 100 mgL−1, 120 min, dosage average, 0.01 g).
Figure 4 shows the pH for optimum adsorption when the modified nanofibres (WPET-SiAMPy) were exposed to 100 mgL−1 of Cu2+ metal ions in the solution at pH 1 to 6. The results show that the adsorption capacity increased as the pH was increased from 1 to 2. The adsorption capacity started to decline after pH 2 until pH 4 and increased at pH 5 achieving 1.30 mmol/g using WPET-SiAMPy nanofibres. The decline in the Cu2+ binding capacity may be due to the hydrogen (H+) ions being more dominant than Cu2+ ions in an aqueous solution [26]. The adsorption capacity gradually increased as the pH of the Cu2+ aqueous solution increased from 5 to 6 with the adsorption capacity for Cu2+ of 0.04 mmol/g (PET) or 0.046 mmol/g (WPET) at pH 5. Above pH 7, the Cu2+ aqueous solution is more alkaline, thus, Cu2+ ions start to precipitate and form hydroxides (Cu(OH)2) [27]. Thus, pH 5 was confirmed as the optimum pH for further adsorption studies in this research.
3.2.2. Effect of Cu2+ Contact Time Using the Modified PET-SiAMPy or WPET-SiAMPy Composite Nanofibres
The effect of contact time on Cu2+ recovery by the modified chelating adsorbent nanofibres (PET-SiAMPy or WPET-SiAMPy) was studied over different contact times of 1, 5, 10, 20, 30, 60, 90, and 120 min. The main objective in the recovery of Cu2+ using the modified chelating adsorbents is the improved adsorption rate at shorter period of adsorption time to reach equilibrium. The adsorption capacity (qe) calculated according to Equation (1) of the modified chelating adsorbent nanofibres was analysed as shown in Figure 5. The adsorbate results of this experiment were used for comparison in further adsorption experiments.
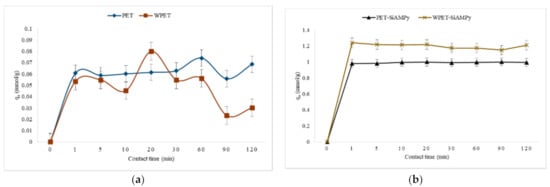
Figure 5.
Effect of contact time on the recovery of Cu2+ from aqueous solution using (a) PET, WPET; and (b) PET-SiAMPy and WPET-SiAMPy nanofibres (Cu2+ concentration 100 mgL−1, pH 5, dosage 0.01 g).
The effect of contact time on the recovery of Cu2+ metal ions by the PET, WPET, PET-SiAMPy, and WPET-SiAMPy nanofibres is shown in Figure 5—showing that low adsorption occurred over time for PET or WPET but high adsorption was attained within the first minute using the modified WPET-SiAMPy composite nanofibre adsorbent. It was found that the adsorption of Cu2+ ions achieved equilibrium at 1 min. In the first 1 min, the Cu2+ quantity adsorbed was 1.24 mmol/g (96.04%) of the metal ion concentration present in the Cu2+ aqueous solution using the chelating adsorbent WPET-SiAMPy composite nanofibres. WPET-SiAMPy composite nanofibres had the fastest adsorption attributed to the amount of the SiAMPy (0.01 wt%) incorporated in WPET-SiAMPy when compared with the unmodified WPET that achieved 0.05 mmol/g adsorption capacity, which is 35.45% Cu2+ recovery efficiency. The PET-SiAMPy nanofibres achieved 0.98 mmol/g in the first minute of adsorption. The adsorption capacity of the unmodified PET nanofibres reached equilibrium from the first minute of adsorption contact time until the adsorption experiment reached 30 min, where slight fluctuations started. The adsorption capacity fluctuated for the unmodified nanofibres adsorbent (WPET), the Cu2+ recovery declined from 5 to 10 min of adsorption and increased from 10 to 20 min, only to further decline from 20 to 90 min and slightly increased from 90 to 120 min. The adsorption capacity using all the material, respectively, reached the adsorption equilibrium at 1 min, with the fluctuation of the copper binding capacity of the unmodified nanofibres. The PET and WPET nanofibres achieved only 0.06 mmol/g and 0.05 mmol/g in the first minute with a low adsorption capacity of 0.07 mmol/g noticed at 60 min for PET and 0.08 mmol/g noticed at 20 min for WPET. The 1 min was set as the necessary time needed to attain equilibrium for the modified nanofibre adsorbents. The fast adsorption during the first minute was related to the large amount of active vacant adsorption sites of the SiAMPy incorporated into the nanofibres (see kinetic study in Section 3.4).
The obtained average adsorption efficiency results in Figure 6 showed that the modified WPET using the chelating ligand SiAMPy had the highest Cu2+ metal ion binding capacity compared to that of the PET-SiAMPy because the WPET nanofibres had more SiAMPy compared to PET nanofibre as seen in Figure 1e,f, indicating that the WPET-SiAMPy had an enlarged surface area compared to PET-SiAMPy and therefore more Cu2+ adsorption sites. The adsorption performance occurred rapidly when the number of available sites was greater than the number of Cu2+ ions to be adsorbed. In the initial stage of adsorption, there is excess active adsorption sites vacant on the adsorbent surface for Cu2+ recovery. Thereafter, the adsorption rate dropped slightly due to the aggregation of Cu2+ metal ions on adsorbent nanofibres or more likely on excess adsorption sites. Thus, the active sites of WPET-SiAMPy nanofibres were fully exposed to Cu2+ ions in aqueous solution, causing the rapid saturation of the surface and yielding high adsorption capacity as seen in Figure 6. The Cu2+ recovery rate demonstrated the high rate of binding kinetics, thus suggests that the WPET-SiAMPy composite nanofibres has very high adsorption efficiency and thus has high potential in Cu2+ recovery. The modification of WPET polymers using the SiAMPy was beneficial in Cu2+ adsorption efficiency, as the SiAMPy was previously proven to be selective for Cu2+ [28]. The WPET-SiAMPy composite nanofibres showed high Cu2+ uptake of 1.24 mmol/g (96.04%). This research agrees with the efficient activity of the 2-aminomethylpyridine resin (AMPy) which could only achieve 0.22 mmol/g Cu uptake on its own [29]. Incorporating it into nanofibres significantly improved the Cu2+ adsorption capacity, which is in agreement with the adsorption capacity achieved using the fixed-bed column adsorption process for the deep removal of Cu2+ from simulated cobalt electrolyte with polystyrene-supported 2-aminomethylpyridine chelating resin [30].
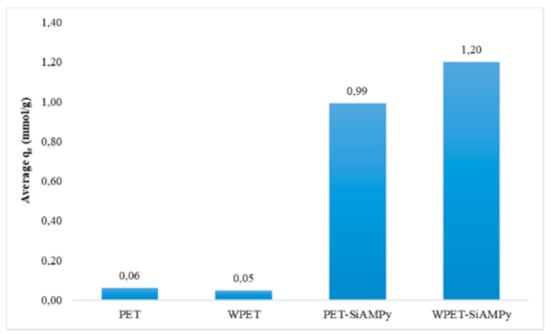
Figure 6.
Average adsorption capacity of Cu2+ from aqueous solution using PET, WPET, PET-SiAMPy, and WPET-SiAMPy nanofibres (Cu2+ concentration 100 mgL−1, pH 5, dosage 0.01 g, 120 min).
3.2.3. Effect of the WPET-SiAMPy Composite Nanofibres Dosage on Cu2+ Binding Capacity
The effect of mass loading on the adsorption of Cu2+ was carried out using different doses of chelating adsorbents WPET-SiAMPy nanofibres (0.001, 0.005, 0.01 and 0.025 g). The effect of chelating adsorbent dosages were investigated in order to determine the optimum dosage of the modified nanofibres. The effect of PET-SiAMPy as the adsorbent was not investigated because studies in Section 3.2.1 and Section 3.2.2 already proved that WPET-SiAMPy was more effective than PET-SiAMPy. The adsorption capacity (qe) of the resultant solution are shown in Figure 7.

Figure 7.
Adsorption capacity of Cu2+ from aqueous solution using different WPET-SiAMPy nanofibres dosages (Cu2+ concentration 100 mgL−1, 1 min, pH 5).
The adsorption pattern of the Cu2+ adsorption against the dosage conducted over a range of masses for WPET-SiAMPy nanofibres of 0.001–0.025 g is illustrated in Figure 7. The adsorption capacity and the percentage of Cu2+ adsorbed on the WPET-SiAMPy composite nanofibres at different doses shows that the adsorption capacity decreased with an increase in dosages. The adsorption capacity decreased from 1.29 to 0.06 mmol/g by increasing the WPET-SiAMPy nanofibres dosage from 0.001 to 0.025 g per adsorption process of 10 mL (100 mgL−1 Cu2+). The decrease in Cu2+ adsorption capacity may be due to the aggregation of WPET-SiAMPy nanofibres or more likely due to the increase in excess adsorption sites as the dosage increased [31]. Thus, the active sites of WPET-SiAMPy nanofibres were fully exposed to Cu2+ ions in aqueous solution even at the lowest dosage, causing the rapid saturation of the surface and yielding high adsorption capacity, as seen in Figure 7. The increase in WPET-SiAMPy composite nanofibres dosage increased the availability of adsorption sites resulting in a high WPET-SiAMPy nanofibres active sites-to-Cu2+ ions ratio; thus, the availability of Cu2+ ions was insufficient to occupy all adsorbent active sites, hence the decrease in adsorption capacity. Increasing the WPET-SiAMPy nanofibre dosage enhanced the active adsorption sites’ availability. As seen in Figure 7, the high Cu2+ binding capacity was achieved using 0.001 g dosage of the chelating adsorbents (WPET-SiAMPy nanofibres) if all fixed parameters (100 mgL−1 Cu2+ (10 mL) at pH 5 for 1 min) are maintained.
3.2.4. Effect of Cu2+ Aqueous Solution Initial Concentration Using WPET-SiAMPy Nanofibres
The effect of the Cu2+ metal ion concentration was investigated to determine the optimum Cu2+ concentration using the modified nanofibres (WPET-SiAMPy nanofibres) as the adsorbent. The Cu2+ adsorption from the 100 mL of different concentrations (10, 50, 100 and 200 mgL−1 Cu2+) were carried out using the WPET-SiAMPy nanofibres (0.001 g) (see Figure 7) with the pH of the Cu2+ aqueous concentrations held at 5 (see Figure 4). The obtained experimental results of the effect of initial concentration of Cu2+ on WPET-SiAMPy nanofibres are shown in Figure 8.
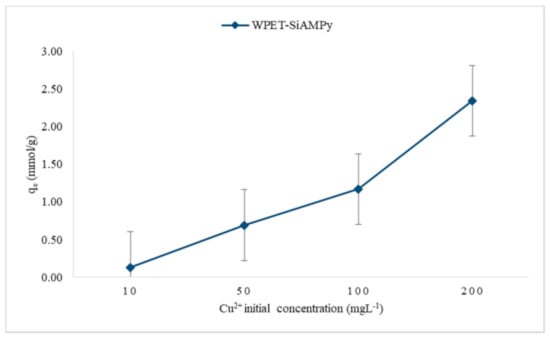
Figure 8.
Effect of initial Cu2+ concentration on WPET-SiAMPy nanofibres (contact time 1 min, pH 5, dosage 0.001 g, 10 mL).
Figure 8 presents the binding capacity of Cu2+ based on Cu2+ adsorbed on WPET-SiAMPy nanofibres at different Cu2+ initial concentrations. The results obtained show that the binding capacity directly increased with an increase in initial concentration of Cu2+. The effect of the initial concentration of Cu2+ provides the necessary experimental data to understand the resistance, if any, to the adsorption of Cu2+ ions transferred between the aqueous solution and WPET-SiAMPy nanofibres. The increase in the initial concentration of Cu2+ improved the uptake of Cu2+ adsorption as the Cu2+ concentration increased from 10 mgL−1 with a binding capacity of 0.13 mmol/g, to 200 mgL−1, in which case the binding capacity was 2.34 mmol/g. The saturation point was not observed for even the highest Cu2+ initial concentration, showing a very high number of Cu2+ binding sites available on the dosed adsorbent. The availability of sufficient Cu2+ ions and adsorption sites increased the Cu2+ ions binding capacity onto the chelating adsorbent nanofibres [20].
3.3. Adsorption Isotherm Models
The modelling of the adsorption equilibrium data is useful in describing and comparing the interaction between the adsorbate and adsorbent during the adsorption experiments, and is also essential for the design of the adsorption process systems. The adsorption models that are most frequently studied are the Langmuir or Freundlich adsorption isotherms, which have been adopted in this study to describe the adsorption characteristics of chelating adsorbents (WPET-SiAMPy nanofibres). In addition, the Jovanovic–Freundlich adsorption isotherm was also reviewed in this study for the close proximation of adsorption data. All the equilibrium adsorption isotherms were used to draw relationships between the Cu2+ concentration in the aqueous solution and the quantity adsorbed onto the WPET-SiAMPy nanofibres. In the adsorption process, the adsorbate is adsorbed on the adsorbent until the adsorbent reaches equilibrium. The WPET-SiAMPy nanofibres’ adsorption isotherms were determined using the initial concentration experimental data outcomes to predict the best fitting isotherm.
The effect of the Cu2+ aqueous solution initial concentration plot followed the Type II of the five types of adsorption isotherms [32]. Type II adsorption isotherms occur when there is more than one type of adsorption active site on the adsorbent surface [33]. Then, the adsorption of the adsorbate molecules to the macroporous adsorbents takes place when multilayer adsorbed molecules are formed after the coverage of the adsorbent surface with a monolayer of adsorbed molecules [34]. The active adsorption sites initiate rapid initial adsorption and these sites saturate when the first site is filled [35]. Then, adsorption rises for the second time when the second active adsorption site is filled. The second site could be a second monolayer, or in porous materials it can also be a second type of pore [36]. Type II adsorption isotherms do not display any saturation point [37], as seen in Figure 7. The plots of Langmuir (1/qe vs. 1/Ce), Freundlich (logqe vs. logCe) and Jovanovic–Freundlich (lnqe vs. Ce) are illustrated in Figure 9, Figure 10 and Figure 11, which were used for the calculation of isotherm parameters in the adsorption of Cu2+ ions using WPET-SiAMPy nanofibres as adsorbents. The obtained values of these parameters are summarized in Table 2.
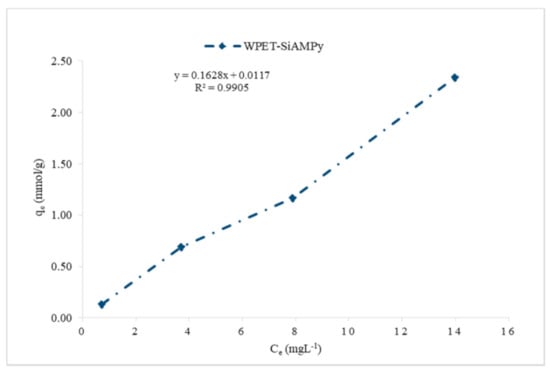
Figure 9.
Langmuir model isotherm of Cu2+ ions on WPET-SiAMPy nanofibres.
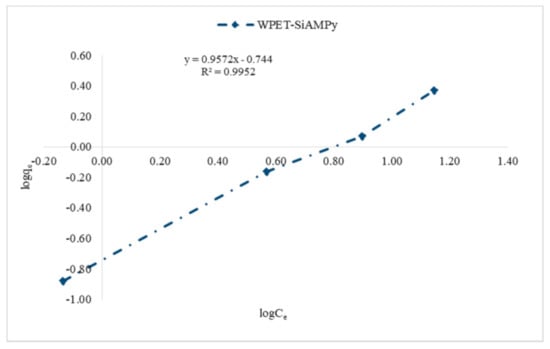
Figure 10.
Freundlich model isotherm of Cu2+ ion on WPET-SiAMPy nanofibres.
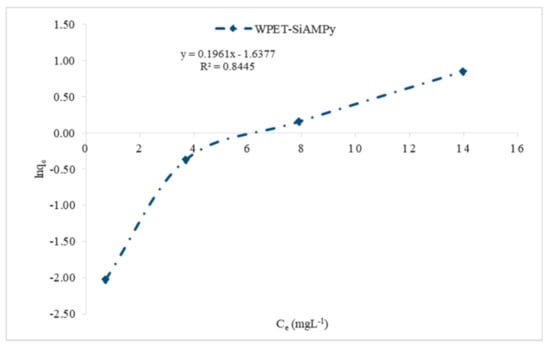
Figure 11.
Jovanovic–Freundlich model isotherm of Cu2+ ion on WPET-SiAMPy nanofibres.
Table 2.
Parameters obtained from the plot of Langmuir, Freundlich isotherms, and Jovanovic–Freundlich for Cu2+ adsorption using modified chelating adsorbents WPET-SiAMPy nanofibres.
In order to choose the best fit between the isotherm model parameters and the experimental outcomes, the statistical function was examined and in each case a set of isotherm parameters were determined by minimizing the respective error function across the concentration range studied [38]. The quality of the isotherm model fit was achieved by the reduced chi-square statistics [39]. The reduced chi-square statistics can be determined by dividing the variance of the isotherm fit by the average variance of the experimental outcome, which should result in the chi-square statistics being less than unity if the isotherm model is in close proximation of the experimental outcome [40]. However, if the reduced chi-square statistics have a larger value, this indicates that the isotherm model fitting is poor or the experimental data are out of approximation [41]. The non-linear chi-square test (X2) employed in this study was presented as follows:
3.3.1. Langmuir Model Isotherm for WPET-SiAMPy Composite Nanofibres
Langmuir adsorption, specifically designed to describe gas–solid adsorption, is additionally used to quantify and distinguish between the adsorptive ability of more than a few adsorbents [42]. The Langmuir isotherm balances the relative costs of adsorption and desorption (dynamic equilibrium). Adsorption is proportional to the fraction of the sites of the adsorbent that are open whilst desorption is proportional to the fraction of the adsorbent sites that are blanketed [43]. The Langmuir adsorption isotherm describes the adsorption of the adsorbate on the surface of the adsorbent in three ways. First, the Langmuir adsorption isotherm states that the surface of the adsorbent is in contact with a solution containing the adsorbate which is strongly attracted to the surface. Secondly, this isotherm states that the surface has a specific number of sites where the adsorbate molecules can be adsorbed. Lastly, the Langmuir adsorption isotherm states that the adsorption involves the attachment of only one layer of molecules to the surface [32]. The Langmuir adsorption isotherm proves that a dynamic equilibrium exists between the adsorbed molecules and free molecules. This isotherm describes the isothermal variation of the free adsorbate and the vacancies on the surface of the adsorbent [44].
The adsorbent and the adsorbate are in dynamic equilibrium, and the fractional coverage of the surface depends on the concentration of the adsorbate. The extent of surface coverage is normally expressed as the fractional coverage, θ. The Langmuir isotherm was used to calculate the monolayer adsorption, which was represented by the following linearized form presented as Equation (5):
The Langmuir Equation presents qe as the amount of metal ion adsorbed on adsorbents (mg/g), and are the monolayer adsorption capacity (mg/g) and Langmuir equilibrium constant (L/mg) which indicates the nature of adsorption, respectively. The values of and were graphically determined with a plot of, qe against that gives a straight line of slope and the intercept is , which corresponds to the complete monolayer coverage [45].
The essential calculation of the Langmuir isotherm is expressed in terms of a dimensionless constant separation factor, [46], which is expressed as Equation (6):
where is the equilibrium adsorption uptake of Cu2+ ions, is the maximum adsorption capacity corresponding to the complete monolayer coverage, KL is the Langmuir adsorption, = 1 indicating linear adsorption; = 0 indicating irreversible adsorption and 0 < < 1 indicating optimum/favourable adsorption.
The Langmuir isotherm for the adsorption of Cu2+ using WPET-SiAMPy nanofibres is indicated in Figure 9. The correlation coefficient of R2 = 0.9905 indicated that the adsorption of Cu2+ from aqueous solution using WPET-SiAMPy nanofibres as adsorbent was optimum and favourable, supported by the separation factor 0 < RL < 1. WPET-SiAMPy nanofibres have shown an equilibrium trend of the Type II isotherm which represents unrestricted monolayer–multilayer adsorption, as demonstrated by IUPAC classification of isotherms [47]. The accumulation of Cu2+ ion on the surface of the WPET-SiAMPy nanofibres suggests that the Cu2+ ions partially saturated the sites and followed the L3 type classification proposed by Da̧browski, 2001 [48]. The L3 curve presented in Figure 9 indicates that the Cu2+ ions, as the adsorbate, have a high affinity such that in diluted solutions, Cu2+ is completely adsorbed, or at least no measurable amount of Cu2+ remained in the solution that could be further adsorbed. The initial part of the adsorption isotherm is conclusively vertical. The adsorbed single Cu2+ ions could be exchanging with the H+ ions which have a lower affinity for the WPET-SiAMPy nanofibres surface. This model indicates that both the active adsorption sites and nanofibres’ surface area contributed equally. The Langmuir isotherm model was also investigated for the study of adsorption from theory to practice and the reported adsorption of Cu2+ metal ions on Si–AMP–M–H as a selective adsorbent, with the adsorption equilibrium fitting the Langmuir isotherm model [48].
3.3.2. Freundlich Model Isotherm for WPET-SiAMPy Composite Nanofibres
The Freundlich isotherm is generally applicable to the adsorption that occurs on heterogeneous surfaces [49]. This isotherm gives an expression which defines the surface heterogeneity and the exponential distribution of active sites and their energies [50]. The Freundlich adsorption isotherm represents the relationship between the amount of metal adsorbed per unit mass of the adsorbent and the concentration of the metal in solution at equilibrium. The Freundlich Equation can be described by the linearized form:
where and n are Freundlich constants. The values of and n were graphically determined. A plot of against gives a straight line of slope n and the intercept is [51].
The results of the Freundlich isotherm of Cu2+ ion adsorbed by WPET-SiAMPy nanofibres is presented in Figure 10. The Freundlich constants related to adsorption capacity KF = 0.18 (L/mg), and adsorption intensity = 0.9572 indicated the optimum adsorption characteristics of the WPET-SiAMPy composite nanofibres in Cu2+ aqueous solution. This is due to the correlation of KF that indicated that the high KF coefficient increased with an increase in the initial concentration as a result of an increase in the activated surface characteristics after monolayer adsorption and with high WPET-SiAMPy composite nanofibres’ adsorption intensity. Thus, the correlation coefficient R2 values for the WPET-SiAMPy nanofibres, which was 0.9952 for Cu2+, indicated a favourable adsorption process.
3.3.3. Jovanovic–Freundlich Model Isotherm for WPET-SiAMPy Composite Nanofibres
The Jovanovic model isotherm adopts the same theories as the Langmuir model isotherms and further considers the mechanism between the adsorbate and adsorbent contact [52]. For heterogeneous surfaces, the Jovanovic model extends a semiempirical model named Jovanovic–Freundlich model. The Jovanovic–Freundlich model isotherm was derived from a differential relationship relating the surface coverage and the bulk concentration of the adsorbate for a single component adsorption. The Jovanovic–Freundlich model is reduced to the Jovanovic model when the surface is homogenous, and at high concentrations, it is reduced to a monolayer; however, it does not obey Henry’s law [53]. The Jovanovic–Freundlich model isotherm is expressed as follows:
where is the maximum monolayer coverage capacity, is the equilibrium constant, and is the Jovanovic–Freundlich model isotherm exponent.
Figure 11 shows the Jovanovic–Freundlich isotherm calculated for WPET-SiAMPy nanofibres. The three parameters of the semi-empirical model isotherm were applied to evaluate the Jovanovic–Freundlich model isotherm fit for Cu2+ adsorption. The Jovanovic–Freundlich model isotherm exponent = 0.47 indicated that the Cu2+ ion binding adsorption occurred at a heterogeneous surface as the value of parameter is far greater than unity 1, which means the Jovanovic–Freundlich equation was reduced to the Freundlich isotherm. The correlation coefficient was R2 = 0.8445, which indicated a favourable adsorption process. Khakpay et al. [54] reported the derivation and application of a Jovanovic–Freundlich isotherm model for single component adsorption on heterogeneous surfaces.
The calculated results of all the isotherms modelled for WPET-SiAMPy nanofibres are presented in Table 2.
The Langmuir, Freundlich, and Jovanovic–Freundlich isotherm models were applied to describe the Cu2+ ions’ adsorption mechanism on the WPET-SiAMPy nanofibres surface using a range of Cu2+ aqueous concentrations. The experimental data obtained for adsorption of Cu2+ using WPET-SiAMPy nanofibres were compared to the theoretical data obtained from the Langmuir, Freundlich, and Jovanovic–Freundlich isotherm models, and determined that the three isotherms showed the correlation coefficient (R2) following this sequence: Freundlich > Langmuir > Jovanovic–Freundlich [55]. Thus, the Freundlich isotherm model with the highest correlation coefficient R2 = 0.9952 was the best fit for Cu2+ adsorption experimental outcomes. The Freundlich isotherm model had a good agreement with the experimental data obtained, based on the reduced chi-square X2 that was far less than unity, good correlation coefficient R2, and the close approximation of the theoretical maximum uptake of adsorbate to the experimental adsorption uptake of adsorbate . Thus, among the three important compatible applicable isotherm models about adsorption, the Freundlich isotherm model had the best fit to experimental outcomes of Cu2+ ions adsorption from aqueous solution using the WPET-SiAMPy nanofibres. This indicated that the WPET-SiAMPy nanofibres’ adsorption sites for Cu2+ ions were uneven and not restricted to a particular adsorption site. These results proposed that more than one type of WPET-SiAMPy active site took part in Cu2+ ion adsorption [56].
3.4. Kinetic Study of WPET-SiAMPy Chelating Adsorbent Nanofibres
The adsorption kinetics focused on the adsorption rate of the adsorbate upon the adsorbent. The experiments of Cu2+ binding kinetics using the WPET-SiAMPy chelating adsorbent was conducted to investigate the adsorption mechanism of Cu2+ in aqueous solution. The formation of complexes between Cu2+ and WPET-SiAMPy chelating adsorbent nanofibres was studied to understand the Cu2+ adsorption dynamics, assuming a homogenous system for WPET-SiAMPy chelating adsorbent nanofibres. The kinetic of the Cu2+ uptake was illustrated by the effect of contact time on Cu2+ ions’ adsorption onto WPET-SiAMPy nanofibres, which was previously performed, and the results are shown in Figure 4.
3.4.1. Relative Rates and Stoichiometry of Cu2+ Adsorption Based on the WPET-SiAMPy Nanofibres
The general aim of this kinetic study was to determine the form of the reaction rate equations. The reaction rate equations in this study were determined using the differential method. In adsorption kinetics, it is important to relate the reaction rates for the adsorption of the reactant, Cu2+, and the formation of the complex compounds Cu-WPET-SiAMPy nanofibres. This was performed by varying the Cu2+ concentration or the average rate of reaction against the contact time as seen in Figure 11. The average rate of the reaction is the change in the concentration per unit time expressed as
with the consideration that the Cu2+ ions in the aqueous solution are adsorbed by WPET-SiAMPy nanofibres. These reactions occur according to the following Equations:
Cu + WPET-SiAMPy → Cu-WPET-SiAMPy
Figure 12 demonstrated the Cu2+ uptake by the WPET-SiAMPy nanofibres. During adsorption, a chemical reaction occurred. The quantities of the Cu2+ ions taken up from aqueous solution decreased with an increase in time, forming compound complexes. The Cu2+ ion concentration after the adsorption experiment with WPET-SiAMPy nanofibres showed three reactions. The average rate of reactions for the equilibria-specified time intervals are tabulated below:
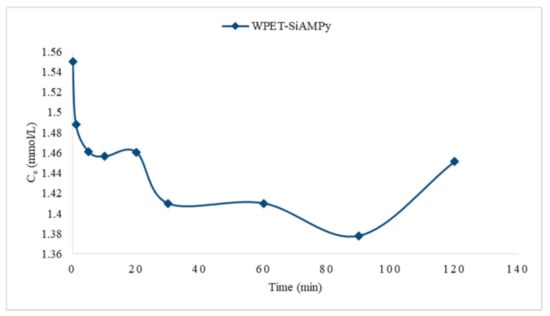
Figure 12.
Cu2+ metal uptake against contact time using WPET-SiAMPy nanofibres.
The rate expression relating all these rates can be determined by dividing each rate expression by the stoichiometric coefficient of the Cu2+ ions in the balanced chemical equation, which is assumed to be 1 in these balanced equations. As seen in Table 3, the rate of reaction decreases as the concentration of Cu2+ ions in solution decreases. This illustrated that the rate of reaction is related to the concentration of Cu2+ ions. This can also be qualitatively deduced from the fact that the graphing of the average reaction rate against time gave a curved line, as can be seen in Figure 13.
Table 3.
Average rate of reactions between Cu2+ and WPET-SiAMPy nanofibres.
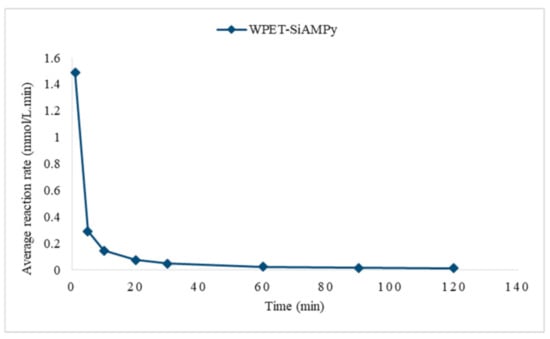
Figure 13.
Average reaction rate against contact time using WPET-SiAMPy nanofibres.
Figure 13 illustrates the average reaction rate against time, where a measure of the rate of the reaction at any point in time is found by measuring the slope of the graph through tangent. As seen in Figure 5, the initial adsorption was steep for WPET-SiAMPy nanofibres, as supported by the steep initial metal uptake in Figure 12, which means that the rate of reaction was fast. Hence, the determination of the initial rate of reaction is important in this study, as the slope at the beginning of the reaction is used.
3.4.2. Kinetic Study of Reaction Formation Compound Cu-WPET-SiAMPy Complex
The relationship between Cu2+ ion concentration and reaction rate is expressed by an equation called a rate equation. The rate equation of Cu-WPET-SiAMPy complex can be written mathematically as
where k is the reaction rate constant, [A] is the concentration of Cu2+, [B] is the concentration of the WPET-SiAMPy nanofibres, m and n are the order of the reaction. The determination of the reaction order is determined by finding the initial formation rate of the Cu2+ ions binding to the WPET-SiAMPy chelating ligand nanofibres. The graph of the concentration versus time is obtained from the experimental data to determine the initial rate of reaction (see Table 2). The graph of the concentration versus time is obtained from the experimental data to determine the initial rate, which can be expressed as
where the Cu2+ aqueous solution concentration is represented by c calculated from:
Rate = k[A]m[B]n
Figure 14 presents the Cu2+ complexation formation rate with WPET-SiAMPy nanofibres in aqueous solution. The equilibrium uptake of the Cu2+ on WPET-SiAMPy nanofibres was attained within the first minute of contact time, as seen in Figure 5. The fast Cu2+ adsorption on the WPET-SiAMPy nanofibres was attributed to the high Cu2+ concentration in aqueous solution around the high surface area of the WPET-SiAMPy nanofibres with a high number of active vacant adsorbent sites. The Cu2+ complex formation rate (k) with WPET-SiAMPy was k = 0.0888, which was the adsorption rate constant.
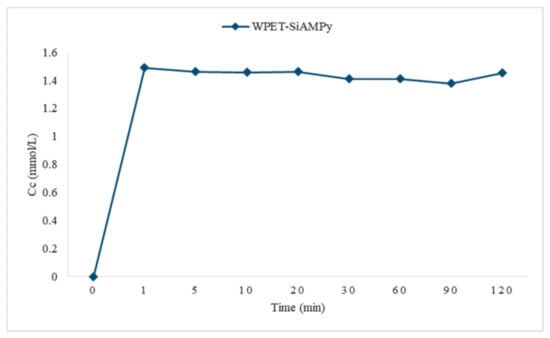
Figure 14.
Cu2+ complexation with the WPET-SiAMPy nanofibres in aqueous solution.
3.4.3. The Mechanism of Cu-WPET-SiAMPy Complex Formation Reaction
The theoretical study on the mechanism of reaction of the Cu-WPET-SiAMPy complex formation was based on three things: the data of the reaction kinetics, of the obtained value of coordination number n and from the value of the rate constant k. The mole ratio of Cu2+ and WPET-SiAMPy nanofibres was 1:2 based on the overall equation. Based on this comparison, then the complex molecular formula formed was Cu(WPET-SiAMPy)2 with a square planar geometry structure. The mechanism of formation for complex compounds Cu(WPET-SiAMPy)2 is:
Cu2+ + WPET-SiAMPy− → [Cu(WPET-SiAMPy]+
[Cu(WPET-SiAMPy]+ + WPET-SiAMPy− → Cu(WPET-SiAMPy)2
Then, the overall reaction is:
Cu2+ + 2WPET-SiAMPy− → Cu(WPET-SiAMPy)2
Based on the results, it can be determined that the complex molecular formula is Cu(WPET-SiAMPy)2 and this is in accordance with the kinetic data. Another fact that supports the above reaction mechanism is the value of k, which is 0.0888:
Rate = k[Cu2+][WPET-SiAMPy−]
The Cu(WPET-SiAMPy)2 complex compound is theoretically expected to have four coordination numbers based on the valence bond theory. This was previously proven by Bai et al. when analysing the Cu2+ loaded Si–AMP–M–H with X-ray photoelectron spectroscopy (XPS), compared with the unloaded Si–AMP–M–H [30]. The XPS survey scan spectra showed major peaks in Si–AMP–M–H which were Si2p, O1s, C1s, and N1s. The XPS analysis simultaneously demonstrated the Cu2p and S2p peaks in Cu2+ loaded Si–AMP–M–H. This proves the legitimacy of the Cu2+ ions adsorbed onto the Si–AMP–M–H surface which was accompanied by SO42- ions, indicating that the neutral ligands form charged chelates with metal ions while anions are co-adsorbed as counter-ions to maintain electro-neutrality in both the Cu2+ aqueous phase and the WPET-SiAMPy solid phase [57]. This study was supported by research showing that the Cu2+ ion has an electron configuration of 1s2 2s2 2p6 3s2 3p6 3d9; thus, it is possible to form the coordination bond between the bidentate ligand and the central atom and obtain sp3 tetrahedron orbitals [58]. The Cu2+ ion consists of a d9 configuration and is known to form 1:1 and 1:2 complexes with the AMP chelating ligands [59]. This was supported by Li et al. who reported the silica-based 2-aminomethylpyridine functionalized adsorbent for the hydrometallurgical extraction of low-grade copper ore and formed a 2:1 AMPy–Cu(II) complex ratio [60]. In this research, the Cu2+ ions formed 1:2 complexes as seen in the overall reactions; however, Sirola et al. reported that the Cu2+ complex CuWRAM was closer to a 1:1 ratio than a 1:2 complex because of the steric hindrances and mobility limitations of AMP incorporated in the silica matrix [59].. Theoretically, it can be expected that the Cu complex species will have a Cu molecular formula (WPET-SiAMPy)2 with square planar dsp2 hybridization.
3.5. Regeneration of the WPET-SiAMPy Nanofibres
The regeneration of the WPET-SiAMPy nanofibres was carried out by treating the previously used WPET-SiAMPy nanofibres with 5 M H2SO4 for 60 min, respectively. This procedure was carried out to determine the reusability and lifecycle of the adsorbents. The regeneration experiments were carried out to regenerate the sample used as the 0.01 g dose of WPET-SiAMPy nanofibres. After the application of 0.01 g WPET-SiAMPy to adsorb 1.24 mmol/g of Cu2+ under constant conditions of pH 5, with an initial Cu2+ concentration of 100 mgL−1, with a contact time varying from 1 to 120 min, the acid regenerated WPET-SiAMPy nanofibres were reused for 100 mgL−1 Cu2+ adsorption at pH 5 with the contact time held constant at 1 min due to the fast kinetics. This regeneration and reuse cycle was repeated five times to determine the regenerability of the nanofibres. After each of the adsorption–desorption regeneration cycles, the solution was analysed and the recovery efficiency for Cu2+ was calculated according to Equation (1).
Figure 15 shows five adsorption–desorption regeneration cycles of previously used WPET-SiAMPy nanofibres. After acid regeneration, the desorbed WPET-SiAMPy nanofibres were reused for the first cycle adsorption and achieved 1.04 mmol/g adsorption capacity of Cu2+ ions, with a 15.98% decrease in adsorption capacity. Thereafter, the Cu2+ adsorption of the desorbed WPET-SiAMPy nanofibres gradually decreased to 1.01 mmol/g binding capacity at the fifth cycle, with a 18.48% decrease in adsorption capacity. The decrease in Cu2+ adsorption on WPET-SiAMPy nanofibres could be due to the gradual accumulation of Cu2+ traces that were not desorbed from the adsorbent, or to the limited contact time used in the readsorption cycles, or to loss of fibre [61]. Nevertheless, the modified WPET-SiAMPy nanofibres could be regenerated using 5 M H2SO4 after previous use for Cu2+ adsorption and could be successively reused for at least five adsorption–desorption cycles. This adsorption–desorption regeneration method was successful because after five cycles, the adsorption capacity only decreased by 18.48% compared to the initial adsorption seen in Figure 4. Therefore, the highly replicable Cu2+ reabsorptions upon regenerated WPET-SiAMPy blended nanofibres proved the reusability of the WPET-SiAMPy blended nanofibres compared to the parent silica supported 2-aminomethylpyridine resin (AMPy) that had slow desorption and kinetics [30], which limited the operational recycling of the resin [14]. The desorption mechanism occurred with the consideration that the Cu2+ ions fully desorbed from the Cu(WPET-SiAMPy)2 complex. This reaction was assumed to occur according to the following Equation:
Cu(WPET-SiAMPy)2 + H2SO4 → WPET-SiAMPy + CuSO4 + SO2 + H2O
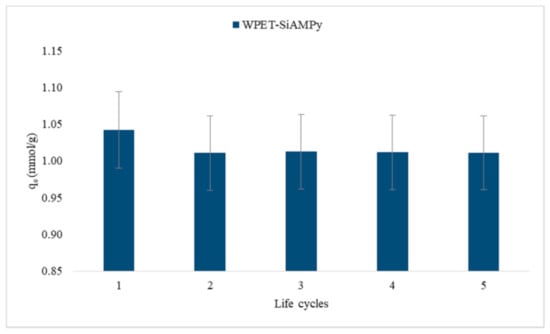
Figure 15.
Five adsorption–desorption/regeneration cycles of Cu2+ using WPET-SiAMPy nanofibres.
4. Conclusions
This study reported the use of the electrospinning technique to combine and incorporate silica-supported 2-aminomethylpyridine (SiAMPy) into polyethylene terephthalate (PET) and waste plastic bottles (WPET) polymer solutions to produce composite nanofibres (PET-SiAMPy and WPET-SiAMPy) for the first time to our knowledge. The PET and WPET nanofibres were robust with very fine dimensions and a high surface area-to-volume ratio, which makes them ideal for active adsorbent support. In batch adsorption experiments, PET-SiAMPy or WPET-SiAMPy composite nanofibres achieved Cu2+ adsorption equilibrium within 60 s of contact time with 0.98 mmol/g (89.87%) or 1.24 mmol/g (96.04%) Cu2+ adsorption capacity. WPET-SiAMPy composite nanofibres were found to be effective adsorbents for the recovery of Cu2+ ion from aqueous solution, as the WPET-SiAMPy composite nanofibres carried sufficient Cu2+ adsorption active sites. The rapid kinetics and high Cu2+ recovery was credited to the high surface area and the porosity of the PET-SiAMPy or WPET-SiAMPy composite nanofibres, which resulted in more adsorption sites being available for the Cu metal ion adsorption from the solution. The application of the WPET-SiAMPy composite electrospun nanofibres for Cu2+ adsorption with very fast kinetic provides high-performance Cu2+ adsorbent that is distinctive to this research. The regeneration of WPET-SiAMPy composite nanofibres allowed replicable high Cu2+ readsorption proving the reusability of the WPET-SiAMPy composite nanofibres, compared to the silica-supported 2-aminomethylpyridine resin (AMPy). The deteriorating limit of the WPET-SiAMPy composite nanofibres should be studied to establish the extent of the regeneration of WPET-SiAMPy composite nanofibres in future studies.
Author Contributions
L.P., K.L. and T.C.T. conceptualized, validated, and formally analysed the manuscript. T.C.T. drafted the methodology, investigated, performed the data curation, and prepared the original draft. O.P. and C.B.-A. reviewed and edited the manuscript. L.P. administered the project, organized resources, reviewed, edited, visualized, supervised, and acquired funding for the research project. All authors have read and agreed to the published version of the manuscript.
Funding
The study was supported by Environmental and Nano Sciences Research Group, University of the Western Cape, South Africa; Research Foundation of the Lappeenranta-Lahti University of Technology LUT; and Academy of Finland.
Institutional Review Board Statement
Not applicable.
Informed Consent Statement
Not applicable.
Data Availability Statement
The data presented in this study are available within the article.
Acknowledgments
A. Josephs in the Physics department for HRSEM and K. Yunus in the Pharmacy department of UWC for TGA and FTIR.
Conflicts of Interest
The authors declare no conflict of interest. The funders had no role in the design of the study; in the collection, analyses, or interpretation of data; in the writing of the manuscript, or in the decision to publish the results.
References
- Annadurai, G.; Juang, R.-S.; Lee, D. Adsorption of heavy metals from water using banana and orange peels. Water Sci. Technol. 2003, 47, 185–190. [Google Scholar] [CrossRef]
- Ayawei, N.; Angaye, S.S.; Wankasi, D.; Dikio, E.D. Synthesis, characterization and application of Mg/Al layered double hydroxide for the degradation of congo red in aqueous solution. Open J. Phys. Chem. 2015, 5, 56–70. [Google Scholar] [CrossRef] [Green Version]
- Ayawei, N.; Ebelegi, A.N.; Wankasi, D. Modelling and interpretation of adsorption isotherms. J. Chem. 2017, 2017, 1–11. [Google Scholar] [CrossRef]
- Ayawei, N.; Ekubo, A.T.; Wankasi, D.; Dikio, E.D. Adsorption of congo red by Ni/Al-CO3: Equilibrium, thermodynamic and kinetic studies. Orient. J. Chem. 2015, 31, 1307–1318. [Google Scholar] [CrossRef]
- Bai, L.; Hu, H.; Zhang, W.; Fu, J.; Lu, Z.; Liu, M.; Jiang, H.; Zhang, L.; Chen, Q.; Tan, P. Amine/acid catalyzed synthesis of a new silica-aminomethyl pyridine material as a selective adsorbent of copper. J. Mater. Chem. 2012, 22, 17293–17301. [Google Scholar] [CrossRef]
- Biazar, E.; Ahmadian, M.; Heidari, S.; Gazmeh, A.; Mohammadi, S.F.; Lashay, A.; Heideri, M.; Eslami, H.; Sahebalzamani, M.; Hashemi, H. Electro-spun polyethylene terephthalate (PET) mat as a keratoprosthesis skirt and its cellular study. Fibers Polym. 2017, 18, 1545–1553. [Google Scholar] [CrossRef]
- Bode-Aluko, C.A.; Laatikainen, K.; Pereao, O.; Nechaev, A.; Kochnev, I.; Rossouw, A.; Dobretsov, S.; Branger, C.; Sarbu, A.; Petrik, L. Fabrication and characterisation of novel nanofiltration polymeric membrane. Mater. Today Commun. 2019, 20, 100580. [Google Scholar] [CrossRef]
- Bode-Aluko, C.A.; Pereao, O.; Ndayambaje, G.; Petrik, L. Adsorption of toxic metals on modified polyacrylonitrile nanofibres: A review. Water Air Soil Pollut. 2017, 228, 35. [Google Scholar] [CrossRef]
- Bonilla-Petriciolet, A.; Mendoza-Castillo, D.I.; Reynel-Ávila, H.E. Adsorption processes for water treatment and purification. Adsorpt. Process. Water Treat. Purif. 2017, 1–256. [Google Scholar] [CrossRef]
- Cai, Y.; Ke, H.; Zhang, T.; Dong, J.; Qiao, H.; Wang, H.; Xu, Z.; Wei, Q.; Zhao, Y.; Fong, H. Preparation, morphology and properties of electrospun lauric acid/pet form-stable phase change ultrafine composite fibres. Polym. Polym. Compos. 2011, 19, 773–780. [Google Scholar] [CrossRef]
- Colmenares, J.C.; Varma, R.S.; Lisowski, P. Sustainable hybrid photocatalysts: Titania immobilized on carbon materials derived from renewable and biodegradable resources. Green Chem. 2016, 18, 5736–5750. [Google Scholar] [CrossRef] [Green Version]
- Cuppett, J.D.; Duncan, S.E.; Dietrich, A.M. Evaluation of copper speciation and water quality factors that affect aqueous copper tasting response. Chem. Senses 2006, 31, 689–697. [Google Scholar] [CrossRef] [PubMed] [Green Version]
- Dąbrowski, A. Adsorption—From theory to practice. Adv. Colloid Interface Sci. 2001, 93, 135–224. [Google Scholar] [CrossRef]
- Das, P.; Tiwari, P. Thermal degradation study of waste polyethylene terephthalate (PET) under inert and oxidative environments. Thermochim. Acta 2019, 679, 178340. [Google Scholar] [CrossRef]
- Elmorsi, T.M. Equilibrium isotherms and kinetic studies of removal of methylene blue dye by adsorption onto Miswak leaves as a natural adsorbent. J. Environ. Prot. 2011, 2, 817–827. [Google Scholar] [CrossRef] [Green Version]
- Van Emmerik, T.; Schwarz, A. Plastic debris in rivers. Wiley Interdiscip. Rev. Water 2020, 7, e1398. [Google Scholar] [CrossRef] [Green Version]
- Van Gerven, T.; Stankiewicz, A. Structure, energy, synergy, time—The fundamentals of process intensification. Ind. Eng. Chem. Res. 2009, 48, 2465–2474. [Google Scholar] [CrossRef]
- Günay, A.; Arslankaya, E.; Tosun, I. Lead removal from aqueous solution by natural and pretreated clinoptilolite: Adsorption equilibrium and kinetics. J. Hazard. Mater. 2007, 146, 362–371. [Google Scholar] [CrossRef]
- Gupta, V.K.; Ali, I.; Saleh, T.A.; Siddiqui, M.N.; Agarwal, S. Chromium removal from water by activated carbon developed from waste rubber tires. Environ. Sci. Pollut. Res. 2013, 20, 1261–1268. [Google Scholar] [CrossRef]
- Haider, S.; Park, S.-Y. Preparation of the electrospun chitosan nanofibers and their applications to the adsorption of Cu (II) and Pb (II) ions from an aqueous solution. J. Membr. Sci. 2009, 328, 90–96. [Google Scholar] [CrossRef]
- Haryani, S.; Kurniawan, C. Kasmui Kinetic and mechanism formation reaction of complex compound Cu with di-n-buthildithiocarbamate (dbdtc) ligand. IOP Conf. Ser. Mater. Sci. Eng. 2018, 349, 012060. [Google Scholar] [CrossRef]
- Hurt, A.P.; Kotha, A.K.; Trivedi, V.; Coleman, N.J. Bioactivity, biocompatibility and antimicrobial properties of a chitosan-mineral composite for periodontal tissue regeneration. Polímeros 2015, 25, 311–316. [Google Scholar] [CrossRef]
- Kaneko, K. Determination of pore size and pore size distribution: 1. Adsorbents and catalysts. J. Membr. Sci. 1994, 96, 59–89. [Google Scholar] [CrossRef]
- Kecili, R.; Hussain, C.M. Mechanism of adsorption on nanomaterials. Nanomater. Chromatogr. Curr. Trends Chromatogr. Res. Technol. Tech. 2018, 89–115. [Google Scholar] [CrossRef]
- Khakpay, A.; Ghorbanian, S.A.; Bagheri, N. Investigation of adsorption isotherms of benzoic acid on activated carbon. In Proceedings of the 1st National Conference on Industrial Water and Wastewater Treatment, Mahshahr, Iran, 29 November 2012. [Google Scholar]
- Kumar, K.V.; Porkodi, K.; Rocha, F. Isotherms and thermodynamics by linear and non-linear regression analysis for the sorption of methylene blue onto activated carbon: Comparison of various error functions. J. Hazard. Mater. 2008, 151, 794–804. [Google Scholar] [CrossRef]
- Laatikainen, M.; Sirola, K.; Paatero, E. Binding of transition metals by soluble and silica-bound branched poly(ethyleneimine): Part I: Competitive binding equilibria. Colloids Surfaces A Physicochem. Eng. Asp. 2007, 296, 191–205. [Google Scholar] [CrossRef]
- Lee, A.Y.W.; Lim, S.F.; Chua, S.N.D.; Sanaullah, K.; Baini, R.; Abdullah, M.O. Adsorption equilibrium for heavy metal divalent ions (Cu2+, Zn2+, and Cd2+) into zirconium-based ferromagnetic sorbent. Adv. Mater. Sci. Eng. 2017, 2017, 1–13. [Google Scholar] [CrossRef] [Green Version]
- Letcher, T.M. Introduction to plastic waste and recycling. Plast. Waste Recycl. 2020, 3–12, 3–12. [Google Scholar] [CrossRef]
- Li, X.; Li, B.; Wu, S.; Li, J.; Xu, Q.; Yang, Z.; Liu, Y.; Wang, S.; Chen, D. Silica-based 2-aminomethylpyridine functionalized adsorbent for hydrometallurgical extraction of low-grade copper ore. Ind. Eng. Chem. Res. 2012, 51, 15224–15232. [Google Scholar] [CrossRef]
- Lim, J.H.; Kang, H.M.; Kim, L.H.; Ko, S.O. Removal of heavy metals by sawdust adsorption: Equilibrium and kinetic studies. Environ. Eng. Res. 2008, 13, 79–84. [Google Scholar] [CrossRef]
- Lowell, S.; Shields, J.E.; Thomas, M.A.; Thommes, M. Adsorption isotherms. In Characterization of Porous Solids and Powders: Surface Area, Pore Size and Density; Particle Technology Series; Springer: Dordrecht, The Netherlands, 2004; pp. 11–14. [Google Scholar] [CrossRef]
- Mahmoud, A.M.; Ibrahim, F.A.; Shaban, S.; Youssef, N.A. Adsorption of heavy metal ion from aqueous solution by nickel oxide nano catalyst prepared by different methods. Egypt. J. Pet. 2015, 24, 27–35. [Google Scholar] [CrossRef] [Green Version]
- Mohammad, N.; Atassi, Y. Adsorption of methylene blue onto electrospun nanofibrous membranes of polylactic acid and polyacrylonitrile coated with chloride doped polyaniline. Sci. Rep. 2020, 10, 1–19. [Google Scholar] [CrossRef]
- Morillo Martín, D.; Magdi Ahmed, M.; Rodríguez, M.; García, M.A.; Faccini, M. Aminated polyethylene terephthalate (PET) nanofibers for the selective removal of Pb (II) from polluted water. Materials 2017, 10, 1352. [Google Scholar] [CrossRef] [Green Version]
- Mousavi, S.; Shahraki, F.; Aliabadi, M.; Haji, A.; Deuber, F.; Adlhart, C. Surface enriched nanofiber mats for efficient adsorption of Cr (VI) inspired by nature. J. Environ. Chem. Eng. 2019, 7, 102817. [Google Scholar] [CrossRef]
- Strain, I.N.; Wu, Q.; Pourrahimi, A.M.; Hedenqvist, M.S.; Olsson, R.T.; Andersson, R.L. Electrospinning of recycled PET to generate tough mesomorphic fibre membranes for smoke filtration. J. Mater. Chem. A 2015, 3, 1632–1640. [Google Scholar] [CrossRef] [Green Version]
- Ndayambaje, G.; Laatikainen, K.; Laatikainen, M.; Beukes, E.; Fatoba, O.O.; van der Walt, N.; Petrik, L.; Sainio, T. Adsorption of nickel (II) on polyacrylonitrile nanofiber modified with 2-(2′-pyridyl) imidazole. Chem. Eng. J. 2016, 284, 1106–1116. [Google Scholar] [CrossRef]
- Nordin, N.A.; Rahman, N.A.; Abdullah, A.H. Effective removal of Pb(II) ions by electrospun PAN/Sago lignin-based activated carbon nanofibers. Molecules 2020, 25, 3081. [Google Scholar] [CrossRef]
- Ouyang, D.; Zhuo, Y.; Hu, L.; Zeng, Q.; Hu, Y.; He, Z. Research on the adsorption behavior of heavy metal ions by porous material prepared with silicate tailings. Minerals 2019, 9, 291. [Google Scholar] [CrossRef] [Green Version]
- Parker, G.R. Optimum isotherm equation and thermodynamic interpretation for aqueous 1,1,2-trichloroethene adsorption isotherms on three adsorbents. Adsorption 1995, 1, 113–132. [Google Scholar] [CrossRef]
- Pereao, O.; Laatikainen, K.; Bode-Aluko, C.; Fatoba, O.; Omoniyi, E.; Kochnev, Y.; Nechaev, A.; Apel, P.; Petrik, L. Synthesis and characterisation of diglycolic acid functionalised polyethylene terephthalate nanofibers for rare earth elements recovery. J. Environ. Chem. Eng. 2021, 9, 105902. [Google Scholar] [CrossRef]
- Pereao, O.; Opeolu, B.; Fatoki, O. Microplastics in aquatic environment: Characterization, ecotoxicological effect, implications for ecosystems and developments in South Africa. Environ. Sci. Pollut. Res. 2020, 27, 22271–22291. [Google Scholar] [CrossRef] [PubMed]
- Pereao, O.K. Functionalisation of Electrospun Nanofibre for Lanthanide Ion Adsorption from Aqueous Solution. Ph.D. Thesis, University of the Western Cape, Cape Town, South Africa, 2018. Available online: https://etd.uwc.ac.za/handle/11394/6393 (accessed on 11 November 2021).
- Quiñones, I.; Guiochon, G. Derivation and application of a jovanovic–freundlich isotherm model for single-component adsorption on heterogeneous surfaces. J. Colloid Interface Sci. 1996, 183, 57–67. [Google Scholar] [CrossRef]
- Sen, T.; Kawajiri, Y.; Realff, M.J. Adsorption process intensification through structured packing: A modeling study using zeolite 13X and a mixture of propylene and propane in hollow-fiber and packed beds. Ind. Eng. Chem. Res. 2018, 58, 5750–5767. [Google Scholar] [CrossRef]
- Shafqat, S.S.; Khan, A.A.; Zafar, M.N.; Alhaji, M.H.; Sanaullah, K.; Shafqat, S.R.; Murtaza, S.; Pang, S.C. Development of amino-functionalized silica nanoparticles for efficient and rapid removal of COD from pre-treated palm oil effluent. J. Mater. Res. Technol. 2019, 8, 385–395. [Google Scholar] [CrossRef]
- El Sikaily, A.; Khaled, A.; Nemr, A.E.; Abdelwahab, O. Removal of methylene blue from aqueous solution by marine green algaUlva lactuca. Chem. Ecol. 2006, 22, 149–157. [Google Scholar] [CrossRef]
- Sing, K.S. Reporting physisorption data for gas/solid systems with special reference to the determination of surface area and porosity. Pure Appl. Chem. 1985, 57, 603–619. [Google Scholar] [CrossRef]
- Sirola, K.; Laatikainen, K.; Lahtinen, M.; Paatero, E. Removal of copper and nickel from concentrated ZnSO4 solutions with silica-supported chelating adsorbents. Sep. Purif. Technol. 2008, 64, 88–100. [Google Scholar] [CrossRef]
- Sirola, K.; Laatikainen, M.; Paatero, E. Effect of temperature on sorption of metals by silica-supported 2-(aminomethyl)pyridine. Part I: Binding equilibria. React. Funct. Polym. 2010, 70, 48–55. [Google Scholar] [CrossRef]
- De Smedt, C.; Ferrer, F.; Leus, K.; Spanoghe, P. Removal of pesticides from aqueous solutions by adsorption on zeolites as solid adsorbents. Adsorpt. Sci. Technol. 2015, 33, 457–485. [Google Scholar] [CrossRef] [Green Version]
- Thommes, M.; Kaneko, K.; Neimark, A.V.; Olivier, J.P.; Rodriguez-Reinoso, F.; Rouquerol, J.; Sing, K.S.W. Physisorption of gases, with special reference to the evaluation of surface area and pore size distribution (IUPAC Technical Report). Pure Appl. Chem. 2015, 87, 1051–1069. [Google Scholar] [CrossRef] [Green Version]
- Tolentino, R.; Knaebel, K.S. Adsorbent Selection; International Journal of Trend in Research and Development: Dublin, OH, USA, 2004; p. 43016. [Google Scholar]
- Ungureanu, O.I.; Bulgariu, D.; Mocanu, A.M.; Bulgariu, L. Functionalized PET waste based low-cost adsorbents for adsorptive removal of Cu (II) ions from aqueous media. Water 2020, 12, 2624. [Google Scholar] [CrossRef]
- Veleirinho, B.; Rei, M.F.; Lopes-Da-Silva, J.A. Solvent and concentration effects on the properties of electrospun poly (ethylene terephthalate) nanofiber mats. J. Polym. Sci. Part B Polym. Phys. 2008, 46, 460–471. [Google Scholar] [CrossRef]
- Wang, Y.H.; Hu, H.P.; Qiu, X.J. Fixed-bed column study for deep removal of copper (II) from simulated cobalt electrolyte using polystyrene-supported 2-aminomethylpyridine chelating resin. J. Central South Univ. 2019, 26, 1374–1384. [Google Scholar] [CrossRef]
- Ben Yahia, M.; Ben Torkia, Y.; Knani, S.; Hachicha, M.A.; Khalfaoui, M.; Ben Lamine, A. Models for type VI adsorption isotherms from a statistical mechanical formulation. Adsorpt. Sci. Technol. 2013, 31, 341–357. [Google Scholar] [CrossRef]
- Yilmaz, V.T.; Caglar, S.; Harrison, W.T.A. A one-dimensional lead (II) coordination polymer with bridging saccharinate and 2-aminomethylpyridine ligands: Synthesis, IR spectra, and crystal structure of [Pb(ampy)(μ-sac)2]n. Z. Für Anorg. Und Allg. Chem. 2004, 630, 948–951. [Google Scholar] [CrossRef]
- Zhang, Y.; Wang, F.; Wang, Y. Recent developments of electrospun nanofibrous materials as novel adsorbents for water treatment. Mater. Today Commun. 2021, 27, 102272. [Google Scholar] [CrossRef]
- Zhu, Y.; Millan, E.; Sengupta, A.K. Toward separation of toxic metal (II) cations by chelating polymers: Some noteworthy observations. React. Polym. 1990, 13, 241–253. [Google Scholar] [CrossRef]
Publisher’s Note: MDPI stays neutral with regard to jurisdictional claims in published maps and institutional affiliations. |
© 2021 by the authors. Licensee MDPI, Basel, Switzerland. This article is an open access article distributed under the terms and conditions of the Creative Commons Attribution (CC BY) license (https://creativecommons.org/licenses/by/4.0/).