Abstract
Robust calibration and validation (Cal and Val) should guarantee the accuracy of the retrieved information, make the remote sensing data consistent and traceable, and maintain the sensor performance during the operational phase. The DRAGON program has set up many remote sensing research topics on various application domains. In order to promote the effectiveness of data modeling and interpretation, it is necessary to solve various challenges in Cal and Val for quantitative RS applications. This project in the DRAGON 4 program aims to promote the cooperation of the Cal and Val experts from European and Chinese institutes in Cal and Val activities, and several achievements have been obtained in the advanced on-orbit optical sensor calibration, as well as microwave remote sensor calibration and product generation. The outcomes of the project have benefited the related remote sensing modeling and product retrieval, and promoted the radiometric calibration network (RadCalNet) as an international operational network for calibration, intercalibration, and validation. Moreover, this project provided local governments with a more accurate OMI NO2 data in China, which were used to study the air quality control during APEC period, Parade period and G20 period. This will be of ongoing be value for monitoring atmospheric environmental quality and formulating pollution control strategies.
1. Introduction
In recent years, observation of the Earth by remote sensing (RS) has evolved from the relatively simple image interpretation phase into one of quantitative analysis. A phase where we can use RS technology to numerically model the natural ecosystem to investigate a variety of complex problems such as global climate change, the carbon cycle, and dynamic monitoring of the environment. As the number of Earth-observation satellites continues to increase, one of the major challenges for the scientific community is to ensure that the measurements are consistent and thus the absolute radiometric calibration of these spaceborne sensors is tied to the same SI-traceable scale. Postlaunch radiometric performance of each sensor is typically assessed on a case-by-case basis by individual teams by simulating TOA signals from in situ surface and atmosphere measurements based on a single geographical location, “site”, and set of instrumentation. When different satellite sensors are independently calibrated/validated in this way, biases are often observed between the radiometry of the satellite sensors. The lack of consistency of remote sensing data from different satellites and countries limits the value and scope of RS applications. Therefore, addressing these quality issues is an urgent and critical endeavor for the international science community.
Postlaunch calibration and validation (Cal and Val) is the primary means to provide quality assurance for satellite payload performance and delivered data quality. Robust and regular Cal and Val makes RS data radiometrically consistent and traceable, and ensuring that the sensor’s performance is maintained during the operational phase. In recent years, there are many excellent studies in the Cal and Val of satellite instrument and data [,,,,]. For optical sensor calibration, the ground-based automatic radiometric calibration was initiated and implemented by the Radiometric Calibration Network (RadCalNet). It provides SI-traceable top-of-atmosphere (TOA) spectrally-resolved reflectances to aid in the postlaunch radiometric calibration and validation of optical imaging sensor data []. Cross-calibration is still a main way to evaluate the radiometric performance of the optical sensors []. For microwave sensor, postlaunch calibration is very important to determine radiometric characteristics of the sensor before the launch []. Evaluation of the performance of microwave sensors is also important to ensure the accuracy of derived sensor brightness temperature data records (SDR) [,]. For the retrieval and validation of atmosphere remote sensing product, the concentration and distribution of the atmospheric trace gases could be retrieved from OMI measurement, which was an important satellite measurement. Ground-based MAX-DOAS method has been extensively used for trace gas and aerosol measurements in the past decade []. Meanwhile, China has also made great progress in the manufacture of remote sensing payloads and in the development of derived RS applications, however, there are still gaps in the Cal and Val process which need to be addressed to further improve data quality. The challenges include the lack of consistent RS assessment standards, the uncertainties introduced by transmission through the atmosphere and its correction, as well as issues resulting from insufficient simultaneous measurements between satellite observation and field observations used for Cal and Val.
The DRAGON program has set up many research topics on various remote sensing application domains, and several specific projects focused on improving consistency, more rigorous traceability, and ultimately to overcome various Cal and Val challenges impacting quantitative RS applications. The DRAGON 4 project “Calibration and data quality assurance for quantitative remote sensing” aims to promote the cooperation of the Cal and Val experts from European and Chinese institutes. In addition to the promotion, the other aim of this project is drawing on the experience of European partners in Cal and Val activities, which has already been implemented in the ESA missions, and to carry out cooperative research on the solar reflective optical and microwave calibration methods, especially through the Committee on Earth Observation Satellites (CEOS) RadCalNet activities and other permanent reference targets. This project also provides cooperation in cross-calibration and product validation of Chinese high spatial resolution spaceborne sensors with similar ESA and other “third party missions” (TPM)’s high-resolution EO data. Moreover, the project has focused on improving the availability of robust quality indicators in remote sensing products in China, under the framework of the Quality Assurance for Earth Observation (QA4EO), by carrying out research on remote sensing data and product assurance. The proposed in situ metrology station is a new concept based on the joint efforts of Chinese and European experts skilled in payload manufacture, on-orbit calibration, data processing, and product service.
The research content involved in this project got funding from research projects such as the National High Technology Research and Development Program of China. The title of this project is “Calibration and data quality assurance for quantitative remote sensing” and the corresponding project ID is 32426 in the DRAGON4 program. The project is divided into four subprojects: (a) Advanced On-orbit Optical Sensor Calibration; (b) Microwave Remote Sensor Calibration and Product Generation; (c) MAXDOAS Fiducial Reference Measurements in Eastern China; and (d) Joint Optimization of Chinese ground-based FTIR Reference Measurements. The outcome of the project can be applied to other remote sensing modeling and product retrieval projects within the framework of the DRAGON program. It demonstrated the feasibility of the concept of global calibration traceable to SI and promoted the applications of RadCalNet [] and QA4EO (http://qa4eo.org/, accessed on 15 November 2021). It also promoted RadCalNet as an operational network which can be used for radiometric calibration, intercalibration, and validation for the benefit of the Global Earth Observation System of Systems (GEOSS).
2. Project, Subprojects, EO and Other Data Utilization
2.1. List of Subprojects and Teaming
The project consists of four subprojects. Each subproject established a Chinese and EU cooperation team and set up their own PIs. These subprojects have carried out cooperative research in the fields of optical remote sensing calibration, microwave remote sensing calibration, ground-based MAX-DOAS measurements and satellite data retrieval, and joint optimization of Chinese ground-based FTIR reference measurements. The composition of the subproject team is shown in the Table 1 below.

Table 1.
The detail of subprojects and team composition.
2.2. Description and Summary Table of EO and Other Data Utilized
Since the start of this project, a wide range of sources of earth observation (EO) satellite data have been used, including ESA third party missions, ESA explorers and sensors data, and Chinese EO data. These data play a great role in the algorithm research and the validation of inversion results in the project. Table 2 shows the summary of EO and other data utilized in this project.
Table 2.
Summary of EO and other data utilized.
3. Subprojects’ Research Aim and Approach
3.1. Advanced On-Orbit Optical Sensor Calibration and Product Quality Traceability
3.1.1. Research Aims
This subproject is devoted to exploring new technology and methods for high accuracy on-orbit radiometric calibration which can be used by Chinese and European remote sensing satellites. Through studies on spaceborne radiometric measurement benchmarking techniques, consistent calibration techniques based on matching observations of pixels, transferring values from one sensor to another, were established. This was further extended through use of networked ground automated radiometric calibration techniques.
The Chinese and European partners cooperated on different calibration methods and joint experiments based on stable earth surface targets, satellite-to-satellite spatial-temporal matching, and on celestial object observation. Research aims of this subproject are:
- building a broad-dynamic-range, high-stability, automated radiometric calibration demo-site as a cooperative experiment,
- exploring core technical problems in quantitative remote sensing and product validation,
- demonstrating product validation on some parameters derived from Chinese satellite data.
3.1.2. Research Approach
Vicarious Automatic Radiometric Calibration Technology
- Reflected spectral radiance automatic observation system
As one of the demonstration sites of CEOS RadCalNet [], the Baotou site was equipped with automatic observation systems to collect the ground reflected radiances of the artificial targets (BTCN) and the sandy target (BSCN). While the multispectral radiometers were used at the other three RadCalNet sites, a spectrometer was used at the Baotou site to provide operational reflected spectral radiance from the automatic observation systems []. The system consists of three units including the spectrometer unit, system control and data transfer unit, and system protection unit. The spectrometer covers the spectrum from 380 to 1080 nm with 2 nm spectral sampling intervals, with a 3° field of view. The spectrometer was mounted at a height of 2.5 m. Ground reflected radiances of the targets at nadir can be collected directly every two minutes controlled by the system control unit. The advantage of the system designed for Baotou is that it avoids introducing errors from extrapolating and interpolating data from the smaller number of spectral bands of the more traditional multispectral radiometer. Table 3 lists the detailed specifications of the spectrometer. Figure 1 shows the operational reflected spectral radiance automatic observation systems deployed at the Baotou site.
Table 3.
Specifications of the spectrometer.
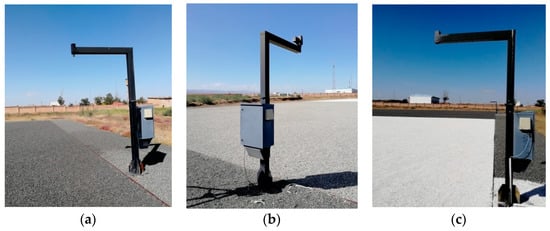
Figure 1.
The operational reflected spectral radiance automatic observation systems above the black, grey, and white artificial targets at the Baotou site. (a) above the black target, (b) above the grey target, and (c) above the white target.
- Temperature correction model for collected spectral radiance in the field
The spectrometers used in our automatic observation systems are calibrated at the National Institute of Metrology of China (NIM) each year. These calibrations are done in laboratory conditions at an indoor temperature at 25 °C and therefore, the calibration coefficients cannot directly be used for the field-collected datasets due to environmental temperature changes in the field conditions at the Baotou site. To evaluate a temperature-sensitivity correction to the calibration coefficients, temperature sensitivity tests were conducted using a thermal chamber while the spectrometer viewed a stable source. The calibration results were obtained in the laboratory using a stable source while the environment temperature was changed from 10 to 40 °C. The calibration results compared to the calibration results at 25 °C are shown as the scatter points in Figure 2. In order to correct for the temperature influence, an empirical model was established to characterize the calibration coefficient changes of the spectrometer as a function of wavelength and temperature []. The fitted temperature correction model was expressed as Equation (1) and shown in Figure 2 with solid lines.
where and (i = 1, 2, 3) are the coefficients, which were determined by fitting those test datasets collected in the laboratory. After considering the temperature correction, the uncertainty of the field radiance measured by the spectrometer is between 1.5 and 2% in most wavelengths [].
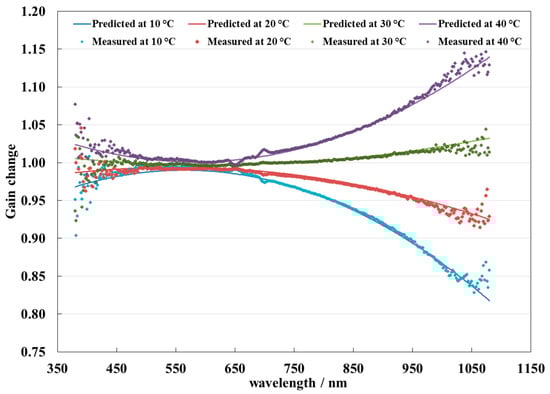
Figure 2.
Empirically fitted temperature corrections as a function of wavelength [].
- Adjacency effect correction of automatic radiometric calibration for high resolution optical sensors
Based on the temperature-corrected spectral radiance, the surface spectral reflectance can be retrieved and be used to predict the top of atmosphere (TOA) radiance for radiometric calibration of high-resolution optical sensors. However, the adjacency effect must be considered carefully during the vicarious automatic radiometric calibration when using the high contrast artificial targets at the Baotou site. The observed signal by the sensor is affected by adjacent pixels due to scattering from the atmosphere scattering and the point spread function of a sensor. In the Baotou case, where the site has a significantly different radiance level than its surrounding area, this “adjacency effect” must be analyzed and corrected for. To evaluate the adjacency effect at the Baotou site caused by the contrast of the artificial targets and atmospheric scattering, an atmospheric point spread function was modeled based on long time series satellite and ground synchronous observation datasets. The atmospheric point spread function was then used to extract the background reflectance over the Baotou site. Following this research, an adjacency effects simulation model, which accounted for these effects, was developed for the radiometric calibration of high-resolution optical sensors [].
Uncertainty Analysis for Automatic Radiometric Calibration at the Baotou Site
As a reference site for the Committee on Earth Observation Satellites (CEOS) radiometric calibration network (RadCalNet), the Baotou site requires a complete uncertainty analysis and documentation of traceability to the international system of units (the SI). A metrological approach was adopted to determine the uncertainties associated with the RadCalNet TOA reflectance product of the Baotou site. The metrological traceability chain for the radiometric calibration of the measurements at the Baotou sites was first given in the form of an “uncertainty tree diagram”. The uncertainty sources at each step of the whole chain from the laboratory to the field and then to the satellite were then quantified item by item. The overall uncertainty budget is fully documented and justified in the published paper, which also acts as a guide for other RadCalNet sites in their uncertainty analyses []. The paper has also been used as an example in other ESA fiducial reference measurement activities.
A Method for Determining a Comprehensive Value from Multi-Site Calibration of At-Sensor Radiance
Vicarious calibration of at-sensor radiance is a systematic technique that makes use of natural or artificial sites on the surface of the Earth for the postlaunch calibration of sensors. Due to the different inputs and data production and current lack of robust uncertainty analysis, there are often inconsistencies in calibration results between different vicarious calibration sites. These inconsistencies bring about challenges for time series analysis, and it can be difficult to determine which vicarious calibration result is the most reliable. In view of this, a method to achieve a comprehensive consistent “reference value” with lower uncertainty derived from all data should be determined.
In this project, under the assumption that the 12 validation samples are independent of each other, a novel method for determining the weighting coefficient for each validation result was proposed based on strategies used in key comparisons from Consultative Committee of Photometry and Radiometry (CCPR), the committee of national metrology institutes (NMIs) []. The weighting coefficient assigned to each sample was estimated according to its cut-off uncertainty, so as to avoid too large a weighting from those measurements assigned with relatively small uncertainties. The “comprehensive value” was then calculated as a weighted mean value.
3.2. Microwave RS Sensor Calibration and Product Generation (MIRSS-CAP)
3.2.1. Research Aims
The aims of this subproject are: (1) Determining radiometric characteristics of the sensor before the launch (calibration in lab). (2) Analyzing performance of MWHS II (confirming whether MWHS II works well in orbit). (3) Confirming whether NEDT satisfied the design requirements with two independent methods.
On 15 November 2017, the fourth satellite, Feng Yun-3D (FY-3D), of the new generation of Chinese polar orbit meteorological satellites was successfully launched into orbit. As one of the key payloads, the second-generation microwave humidity sounder (MWHS II) has 15 channels for observing atmospheric temperature and moisture. Compared to the microwave humidity sounder (MWHS) onboard FY-3B, MWHS II improves channel characteristics by adding 8 horizontal polarized channels near 118.75 GHz, which is the first operational polar orbiting satellite-based sensor to observe the atmosphere in earth-scanning mode in the 118 GHz oxygen band. Furthermore, MWHS II has 5 channels at 183 GHz [].
To determine the radiometric characteristics, the T/V tests were completed before the launch of the satellite []. Figure 3 shows the schematic of T/V calibration in a vacuum chamber. The significance of thermal vacuum calibration lies in: comprehensively measuring the system response characteristics of the microwave sounder, establishing the quantitative relationship of the influence of various parameters on the parameters that cannot be measured once the instrument is in orbit.
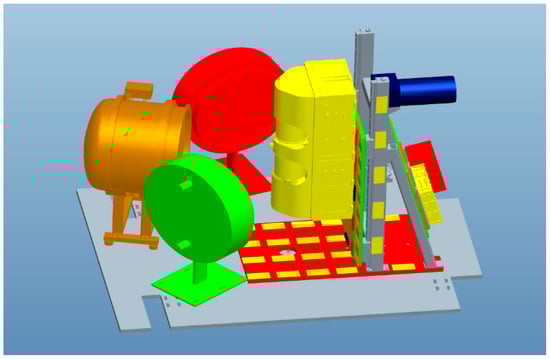
Figure 3.
The assignment photo of T/V experiment.
In order to analyze the performance of MWHS II, one year of in-orbit data are used to monitor the trend of internal blackbody target temperature, instrument temperature, calibration counts, and automatic gain control (AGC), and the results indicate whether the instrument is working well. The instrument noise equivalent differential temperature (NEDT) was calculated, and the value satisfies the design requirements. Two methods are used to validate FY-3D MWHS II measurements. One is the SNO (simultaneous nadir overpasses) [] approach: in this method, ATMS was chosen as the reference sensor, and the standard deviations for five humidity sounding channels were all less than 1.3 K. In the alternate approach, a comparison of the observed and simulated brightness temperature of MWHS II was carried out between FY-3C and FY-3D. The results also demonstrate a consistent performance between the two instruments.
3.2.2. Research Approach
T/V Calibration for Passive Microwave Sounders
The main content includes performance testing before vacuum calibration, vacuum calibration experiment, calibration uncertainty, and determining the prime technical specification in different environment temperatures such as system nonlinearity correction coefficients and will be demonstrated by the on-orbit calibration. The instrument worked at temperatures of 278 K, 288 K, and 298 K, and the temperature of the variable temperature target was changed from 95 to 335 K, and the target was observed by the 89/118 GHz and 150/183 GHz receivers, respectively. In the T/V tests, we first set the instrument at 278 K, then changed the temperature of the variable temperature target from 95 to 335 K, then back to 95 K, and for every temperature set point we held the temperature of the variable temperature target stably for 20 min, before moving to the next temperature. After T/V tests, the basic parameters such as receiver nonlinearity, sensitivity, and calibration accuracy were obtained considering data quality control, cold and warm calibration target bias, variable temperature target bias, and bandwidth correction. In this subproject, the scientists mainly focused on the channels near 118 GHz which are to be used for the first time for satellite instruments and will provide reference for designing of other sounders in future.
On-Orbit Calibration and Evaluation
Based on T/V calibration, postlaunch calibration plays a vital role in many scientific applications and data assimilation []. Figure 4 shows the calibration flow of on-orbit operation. First, the radiometric calibration is performed as a linear calibration using the radiometric counts measuring a hot target (whose temperature is determined with platinum resistance thermometers (PRTs)) and cold space as the two references and based on preflight calibration coefficients, instrument and surrounding temperatures, and location data. Corrections are then applied to remove contamination from any moon radiation, to correct for biases in the hot target and to correct for nonlinear effects.
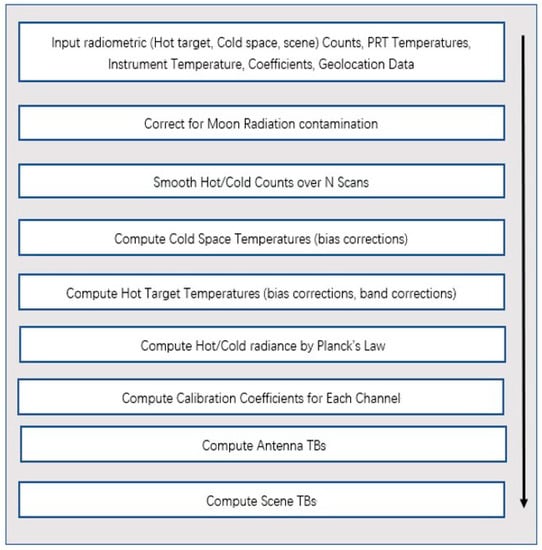
Figure 4.
On-orbit radiometric calibration flow chart.
The calibration accuracy is defined as the difference between the “measured” brightness temperature and the actual calculated brightness temperature of a target determined from PRTs on the target and a priori knowledge of the target emissivity. Thanks to the internal calibration system, the bias can be estimated with confidence. The bias can only be estimated with confidence for the internal target calibration point. The standard deviation of the 400 scan line averages, which is the randomly varying component of the bias, was also computed.
3.3. An Improved OMI NO2 Retrieval over China
3.3.1. Research Aims
In order to provide support for society’s aim to reach climate carbon neutrality, it is necessary to further promote the collaborative governance of air pollution and strengthen regional scale monitoring and control []. Satellite remote sensing can provide regional and global air pollution monitoring and research data to provide evidence to policy makers to support air quality improvements. The ozone monitoring instrument (OMI) is an ultraviolet/visible passive spectrometer onboard the National Aeronautics and Space Administration (NASA) Earth Observing System’s (EOS) Aura satellite, which was launched on 15 July 2004. OMI has high spatial (up to 13 km × 24 km at nadir) and temporal (global daily coverage) resolution []. To obtain high-accuracy OMI data over China, an improved OMI NO2 vertical column densities (VCDs) retrieval algorithm was presented in this subproject. This retrieval is more suitable for atmospheric conditions in China than the previous operational product, and can be used for quantitative analysis and research of air pollution at regional scale, so as to assess the impact of regional and inter-city transport of air pollutants.
3.3.2. Research Approach
OMI NO2 VCDs retrieval consists of three steps []: (1) using the OMI Level 1B VIS Global Radiances Data Product (OML1BRVG) (https://disc.gsfc.nasa.gov/Aura/data-holdings/OMI/oml1brvg_v003.shtml, accessed on 15 November 2021) to fit the slant column densities (SCDs) by the differential optical absorption spectroscopy (DOAS) method []; (2) calculating the air mass factor (AMF) by using the prior profiles of Weather Research and Forecasting model coupled with Chemistry (WRF-Chem version 3.7, with measured meteorological data [] and the newest emission inventory []) simulations; and (3) obtaining vertical column densities (VCDs) by dividing SCDs and AMF. As for tropospheric VCDs, the stratospheric contribution should be subtracted from the SCDs after step (1) to obtain tropospheric SCDs, and then divided by tropospheric AMF []. Ground-based validations [,] reported that NASA’s operational algorithm underestimates NO2 pollution level by about 50% in polluted regions or seasons, and proved that NO2 AMF calculations are the dominant error sources. Thus, we used a high resolution NO2 a priori profile simulated by regional chemical model, and performed pixel-by-pixel online AMF calculations by vectorized radiative transfer model [].
The ground-based MAX-DOAS site in Beijing, China (40°N, 116°22′48″E) and NASA’s operational OMI NO2 products (http://disc.sci.gsfc.nasa.gov/Aura/, accessed on 15 November 2021) were used to verify the retrieved OMI NO2, and the time series and correlation of the daily averaged tropospheric NO2 VCDs in the three independent data sets were then analyzed. In order to reduce the spatio-temporal differences between satellite data and ground-based site data, we select MAX-DOAS data temporally averaged for the OMI overpass time and OMI data spatially averaged on the grid cells within 30 km around Beijing urban area []. Details of the retrieval and validation information can be found in Liu et al. (2016) [].
4. Research Results and Conclusions
4.1. Advanced On-Orbit Optical Sensor Calibration and Product Quality Traceability
4.1.1. Results
Through cooperation with ESA and NPL, the uncertainty analysis for RadCalNet instrumented test sites using the Baotou site as example was completed. The uncertainty transfer chain (shown in Figure 5) of automatic radiometric calibration for the Baotou site was constructed, and the uncertainties of RadCalNet products at all levels were determined. Considering the influence of adjacency effect and site uniformity, the total uncertainty analysis of automatic radiometric calibration of the Baotou site was completed.
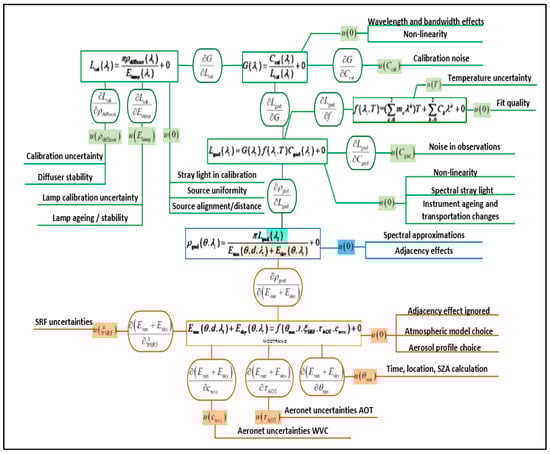
Figure 5.
Uncertainty transfer chain in form of uncertainty tree diagram for the Baotou site [].
Based on the uncertainty transfer chain, the uncertainty sources were determined, and the uncertainties associated with these sources were analyzed. According to the analysis results, the total uncertainties associated with the BOA reflectance and TOA reflectance for the Baotou site, are given in Figure 6a,b, respectively. The analysis results show that the uncertainties of the RadCalNet TOA product (which does not correct the adjacency effect) for the Baotou site, and the uncertainties are estimated to be approximately 7% (BTCN) and 4–5% (BSCN), respectively. The uncertainties of BTCN are larger than BSCN, which is mainly caused by large uniformity of artificial grey target, and the adjacency effect [].
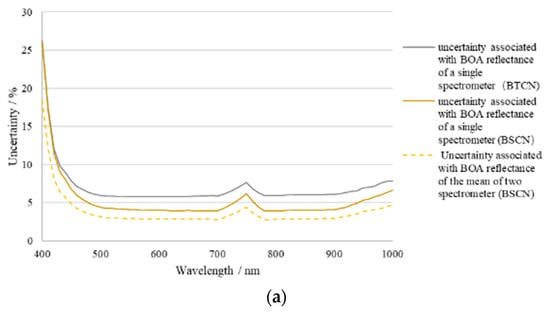
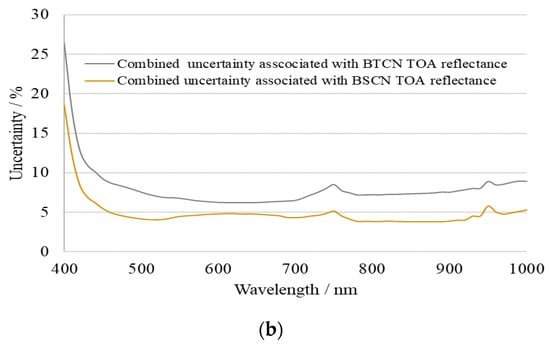
Figure 6.
The uncertainty associated with RadCalNet BOA and TOA reflectance products for Baotou site (Ma et al., 2020). (a) BOA reflectance, and (b) TOA reflectance.
Under the framework of the CEOS RadCalNet, the Baotou site participated in two user tests led by ESA. The RadCalNet products of the Baotou site have been validated in these two user tests. The Baotou RadCalNet provides TOA reflectance product in the spectral region from 400 to 1000 nm at a 10 nm spectral sampling interval. The products have been released and shared on the website of the RadCalNet data center (www.radcalnet.org, accessed on 15 November 2021). RadCalNet also officially entered the operational stage in October 2018, which is the first time such a network of four independent automatic field radiometric calibration sites has been realized. Furthermore, the Baotou site has been successfully applied to the radiometric calibration and radiometric performance evaluation of sensors of China’s high-resolution land satellites, such as ZiYuan series, GaoFen series, and SuperView series. As a proof of the site’s usefulness, Figure 7 shows examples of radiometric calibration of several satellites using the Baotou site, including some satellite images and partial calibration results. Further tests on Worldview-3 and Sentinel-2A imagery overpassing the Baotou site demonstrated that the proposed adjacency effect correction method can effectively reduce the influence of the adjacency effects in vicarious calibration. Uncertainties of the calibration result were estimated to be less than 7% [].
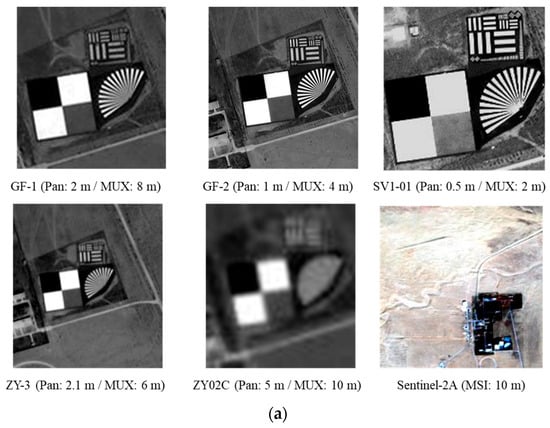
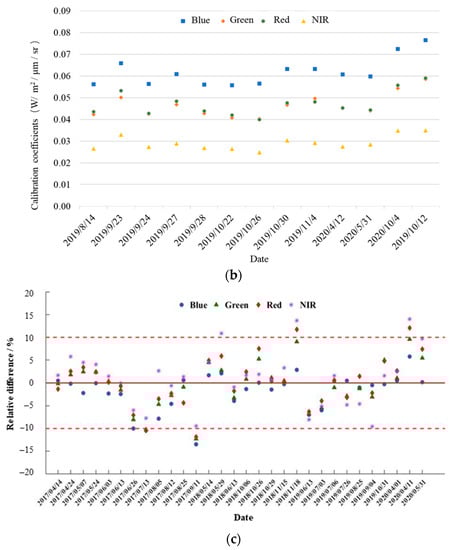
Figure 7.
Examples of radiometric calibration of several satellites based on the Baotou site. (a) images of several satellites over Baotou site, (b) calibration results of GF-6/WFI (from August, 2019), and (c) calibration results for Sentinel-2A/MSI (from April, 2017).
4.1.2. Conclusions
This subproject has been devoted to cooperative research on establishing a global radiometric calibration network with consistent quality and a demonstration of some of its applications. The RadCalNet data portal, built through joint efforts and mutual cooperation of CEOS agencies, has yielded a multi-site calibration product of consistent quality, with 10 nm spectral interval at 30 min time intervals, operating operationally and collaboratively. It has been successfully used in radiometric calibration of multi-series Chinese remote sensing satellites (e.g., ZY, GF, SV, TH) in recent years. Moreover, efforts have been made on the mutual validation between Sentinel-2A/2B satellite data and RadCalNet reflectance product. In addition, through cooperation with the European partners, the first optical remote sensing radiometric calibration transfer chain was successfully constructed, which can be traced to SI.
4.2. Microwave RS Sensor Calibration and Product Generation (MIRSS-CAP)
4.2.1. Results
T/V Calibration for Passive Microwave Sounders
According to the theory and previous experience of MWHS onboard FY-3A/B, MWHS II onboard FY-3C, as well as AMSU-A/B [,], and so on, prelaunch T/V calibration of FY-3D MWHS II can provide a thorough investigation of the instrument performance. In addition, there are many studies related to the analyses in this subsection, e.g., the O-B bias analysis (global distribution, histogram, angle dependency, etc.), NEDT calculation, and temperature dependency of NEDT [].
More importantly, this subproject presented a more suitable method to realize calibration at multi-incident angles for FY-3C MWHS II, especially for the channels around 118 GHz, which are introduced first for the meteorological satellite in FY-3C. Previous calibration methods have not provided measurement data on the cross-polarization difference caused by different incident angles for polar orbiting satellite-based sensors to observe the atmosphere in earth-scanning mode for the 118 GHz oxygen band, but the improved T/V calibration design provides the necessary experimental data.
The basic procedure for data analysis and processing of the MWHS II prelaunch calibration was developed after finishing the T/V calibration procedure, and follows the same process as for the FY-3C satellite. The main requirement is to compute an effective blackbody temperature with a linear correction to the originally determined correction. The effective blackbody temperature is derived from the use of the Rayleigh–Jeans approximation and the spectral bandwidth of the radiometer channel. However, this method was demonstrated to cause non-negligible errors [], and the general method is to provide uncertainty. After removing the known biases in the temperatures of the hot and cold black-bodies, then a two-point calibration equation is used to calculate the calibration bias, nonlinearity parameter, sensitivity, calibration accuracy, and so on. They are key parameters to demonstrate meeting the design requirements and thus will play an important role in correction and analysis of in-flight performance.
The sources of uncertainties in the calibration process are summarized in Table 4. In Table 4, ΔTw means uncertainty of warm target, ΔTc means uncertainty of cold target, ΔTNL means uncertainty of nonlinearity of system, ΔTSYS means system noise, and ΔTCAL means calibration accuracy.
Table 4.
Prelaunch calibration uncertainties for MWHS II.
On-Orbit Calibration and Evaluation
Figure 8 and Figure 9 show a summary of the mean and standard deviations of background departures for MWHS II, which is named O-B. These statistics are for clear-sky data (after filtering for cloud using the scattering index for ECMWF and using the cloud detection adapted from other microwave sounders for the met office) over ocean only and for latitudes between 60°N and 60°S.
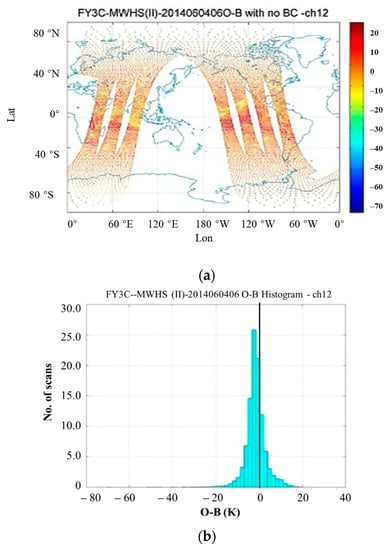
Figure 8.
Analysis of O-B for channel No. 12. (a) FY3C-MWHS (II)-2014060406 O-B with no BC—ch12, and (b) FY3C—MWHS (II)-2014060406 O-B Histogram—ch12.
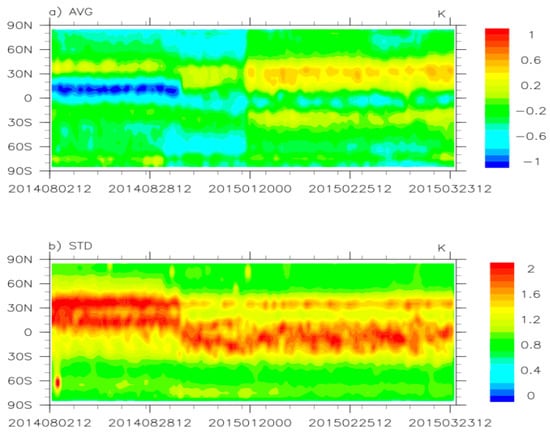
Figure 9.
O-B varied with the latitude.
Comparisons with other instruments in the same system nevertheless give us a good idea of the data quality, and the different treatment in the two systems does not affect the overall conclusions drawn from this.
A rapid change in O-B at the scan edge (around 5 unaveraged scan positions) (see Figure 10) is present in some channels. The bias correction scheme is able to remove the broad scan angle biases but not the small-scale variation. Currently, the method for the bias correction of each scan angle is found using the model and the small-scale variation will be individually removed, which will be helpful in the process of using the scan edge.
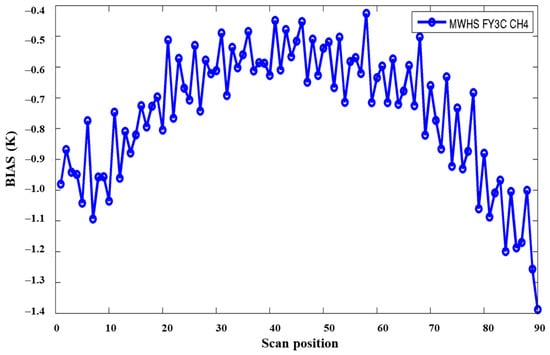
Figure 10.
A rapid change in O-B at the scan edge.
Figure 11 compares the NEDT values of FY-3C and FY-3D MWHS II. The NEDT values of both satellites are smaller than the design requirements. On the whole, the sensitivity of FY-3D MWHS II is consistent with FY-3C.
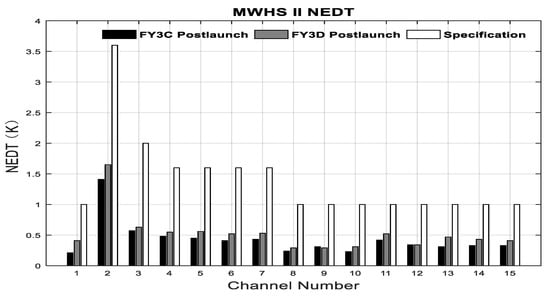
Figure 11.
The NEDT for MWHS II channels 1–15. In this figure: FY-3C MWHS II (black bar); FY-3D MWHS II (grey bar); specification (white bar).
4.2.2. Conclusions
This subproject has been devoted to cooperative research on the microwave RS sensor calibration and product generation. In this project, a prelaunch T/V calibration method of FY-3D MWHS II has been provided, and a two-point calibration equation is used to calculate the calibration bias, nonlinearity parameter, sensitivity, calibration accuracy, and so on, which are demonstrated to meet the design requirements and will play an important role in correction and analysis of in-flight performance. The results show that NEDT values of FY-3C and FY-3D MWHS II are smaller than the design requirements. On the whole, the sensitivity of FY-3D MWHS II is consistent with FY-3C.
4.3. An Improved OMI NO2 Retrieval over China
4.3.1. Results
Figure 12 [] shows the verification results of the retrieved OMI NO2 data, operational OMI NO2 data, and ground-based MAX-DOAS NO2 data, all of which are in good agreement. Since the use of the regional chemical transport model WRF-Chem and the addition of measured trace gas profiles at the local site in the AMF calculation, the retrieved OMI tropospheric NO2 VCDs (R2 = 0.79) show better correlation with the ground-based MAX-DOAS compared to the operational product (R2 = 0.71). The bias between the proposed retrieval and MAX-DOAS observations is 17% smaller than that between the ground-based measurements and the operational product.
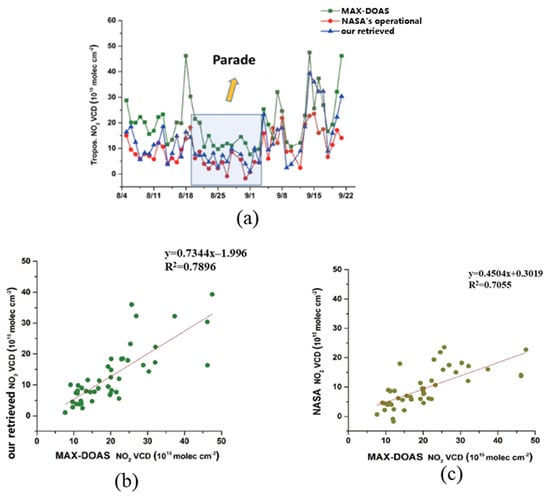
Figure 12.
Time series (a) and correlation (b,c) of daily averaged tropospheric NO2 VCDs in Beijing urban area during the periods around the Grand Military Parade (Parade). The blue square area represents the Parade period.
In addition, the retrieved OMI NO2 was used for air quality monitoring during major events [,] and ship-based MAX-DOAS data verification [,]. Liu et al. (2016) [] studied the variation of NO2 concentration in Beijing during the 2014 Asia-Pacific Economic Cooperation (APEC) summit and 2015 Parade, and found that NO2 decreased significantly []. The remarkable emission reduction during these two events shows China’s strict pollution control strategy was highly effective. However, the decrease of NO2 during the Parade is relatively more obvious, which indicates that the pollution control during APEC may not be strict enough or less effective []. Su et al. [] used the retrieved NO2 to study the effect of air pollution control during the conference for the Group of Twenty Finance Ministers and Central Bank Governors (G20) in Hangzhou (the capital of Zhejiang Province). It was found that NO2 decreased rapidly to the trough during G20 period, and increased with the end of the conference. This indicates that the impact of pollution control on tropospheric NO2 is both significant and rapid []. Hong et al. (2018) [] and Tan et al. (2018) [] verified the ship-based MAX-DOAS observations over the Yangtze River Delta and the East China Sea by using OMI NO2 retrieval, and found that the tropospheric NO2 VCDs between these two observation methods are both in good agreement, and the correlation coefficients are 0.82 and 0.83, respectively [,].
4.3.2. Conclusions
An improved OMI NO2 VCDs retrieval algorithm was presented and AMF was obtained by using regional chemical transport model WRF-Chem to make the algorithm more suitable for atmospheric conditions in China. The retrieved and the operational OMI NO2 VCDs were compared to MAX-DOAS observations in Beijing. The retrieved OMI tropospheric NO2 VCDs show better correlation and smaller bias with the ground-based MAX-DOAS compared to the operational product. The retrieved OMI NO2 VCDs were used to study the air quality control during APEC period, Parade period, and G20 period. It is found that strict pollution control has a rapid and significant impact on the tropospheric NO2 concentration. In addition, the retrieved OMI NO2 VCDs were used to verify the accuracy of ship-based MAX-DOAS observations in China. The two data sets are in good agreement. These studies provided local governments with a more accurate OMI NO2 data in China, which can be used to monitor atmospheric environmental quality and formulate pollution control strategies. Some relevant papers have been published.
5. Overall Discussion
Through an in-depth cooperation between Chinese and European scientists in the Cal and Val community, a high-stability automated radiometric calibration demo-site, namely, the Baotou site, was established. This site complies to globally consistent observation standards on surface/atmospheric parameters. It has been successfully used in radiometric calibration of multi-series Chinese remote sensing satellites (e.g., ZY, GF, SV, TH) in recent years. A rigorous uncertainty analysis for the Baotou RadCalNet sites has been completed through establishing a full SI-traceability chain following the principles of “Metrology”. According to the analysis results, several areas of potential improvement have been identified. For example, stray light is identified to be the dominant source of uncertainty for the shorter wavelength channels. Therefore, it is necessary to perform a more thorough investigation and develop a correction algorithm, which will lead to an improved uncertainty in the future. Moreover, the automated radiometric calibration is currently only available to sensors operating in the region 380–1000 nm. Effort is therefore required to extend the operational range to the increasingly important region to 2500 nm.
For the microwave RS sensor calibration and product generation, a prelaunch T/V calibration method for FY-3D MWHS II was provided for a thorough investigation of its instrument performance, and a two-point calibration equation is used to calculate the calibration bias, nonlinearity parameter, sensitivity, calibration accuracy, and so on, which indicate that it meets the design requirements and will play an important role in correction and analysis of in-flight performance. The results show that NEDT values of FY-3C and FY-3D MWHS II are smaller than the design requirements. On the whole, the sensitivity of FY-3D MWHS II is consistent with FY-3C.
In terms of atmospheric NO2 remote sensing monitoring, a new OMI NO2 retrieval algorithm was presented which is more suitable for atmospheric conditions in China. The retrieved NO2 VCDs were validated by comparing it to the ground-based MAX-DOAS measurements. These two results are quite consistent. Comparing the retrieved data set with operational OMI NO2 product over China, the former is closer to the ground-based data set. The retrieved NO2 contents were used to monitor the regional air quality during APEC period, Parade period, and G20 period, and to verify the accuracy of ship-based MAX-DOAS NO2 measurements. Several relevant papers were published in the past few years. The retrieved NO2 is applied by the Satellite Application Center under China’s Ecology and Environment Ministry, which provides scientific support for the government’s emission reduction effect evaluation and near-real-time monitoring. Recently, the NO2 retrieval algorithm is planned to be applied to the current most advanced satellite mission TROPOspheric Monitoring Instrument (TROPOMI)), and the related paper has been in preparation.
6. Main Conclusions
The DRAGON 4 program has provided an opportunity for scientists from China’s remote sensing community to work closely in collaboration with their European counterparts. This collaboration has led to the development of new capable ground reference sites for optical radiometric sensors, improved prelaunch calibration of microwave radiometers and an improved OMI NO2 retrieval. These significant technical advancements were achieved through the building of a strong partnership between the scientists, which will be built up in future work.
International collaboration requires strong communication and benefits from co-working arrangements. For example, the Baotou uncertainty budget development included a visit of the European scientists to Baotou and then a subsequent period of co-working with Chinese scientists visiting their European colleagues for two weeks. In addition, through a visit of the Chinese scientists to European partner’s institute, issues on the calibration accuracy and retrieval algorithm of the microwave sensor were discussed in depth, and comparison on Chinese and European satellite microwave products was collaboratively investigated. The European and Chinese scientists also worked closely on the topic of algorithm development and ground-based validation of satellite trace gas retrievals within the DRAGON 4 framework. While the COVID-19 pandemic has prevented follow-up visits, the relationships built during mutual visits have made teleconferences more straightforward. The DRAGON 4 program was valuable in creating opportunities for such collaborations.
The main results of this project mainly focus on the new methods and approaches of on-orbit optical satellite radiometric calibration, satellite microwave instrument and data calibration, and atmospheric product validation. On this basis, in the future, we will focus on the analysis of error sources and uncertainty of different methods and models. It will be very important to further optimize the methods and models by determining the uncertainty sources in calibration and validation methods, so as to improve the accuracy of satellite data and products.
Author Contributions
Conceptualization, L.M. and C.L. (Chuanrong Li); formal analysis, Y.Z.; methodology, L.M., Y.Z., R.Z., C.L. (Cheng Liu), J.H., N.W., Y.L., P.W., M.B. and C.G.; writing–original draft, L.M., Y.Z., R.Z., C.L. (Cheng Liu), J.H, Y.L., P.W. and C.G.; writing—review and editing, L.M., P.G., B.D., C.Z., K.L.C., Y.Z. and X.W. All authors have read and agreed to the published version of the manuscript.
Funding
AIR’s work was supported partly by the National Key Research and Development Program of China under Grant 2018YFB0504800 (2018YFB0504801), the Bureau of International Co-operation Chinese Academy of Sciences (Grant No. 181811KYSB20160040, and the DRAGON 4 ESA-MOST Cooperation program (Grant No. 32426_1).
Institutional Review Board Statement
Not applicable.
Informed Consent Statement
Not applicable.
Data Availability Statement
Not applicable.
Acknowledgments
The authors would like to thank the support of Emma R. Woolliams and Nigel P. Fox from NPL. They participated in the uncertainty analysis of BOA and TOA reflectance products in Baotou site, and Emma who helped to revise the full text in English.
Conflicts of Interest
The authors declare no conflict of interest.
References
- Tian, M.; Zou, X.; Weng, F. Use of Allan Deviation for Characterizing Satellite Microwave Sounder Noise Equivalent Differential Temperature (NEDT). IEEE Geosci. Remote Sens. Lett. 2015, 12, 2477–2480. [Google Scholar] [CrossRef]
- Weng, F.; Zou, X. Errors from Rayleigh–Jeans approximation in satellite microwave radiometer calibration systems. Appl. Opt. 2013, 52, 505–508. [Google Scholar] [CrossRef] [PubMed]
- Yan, B.; Ahmad, K. Derivation and Validation of Sensor Brightness Temperatures for Advanced Microwave Sounding Unit-A Instruments. IEEE Trans. Geosci. Remote Sens. 2020, 99, 1–11. [Google Scholar] [CrossRef]
- Yan, B.; Chen, J.; Zou, C.-Z.; Ahmad, K.; Qian, H.; Garrett, K.; Zhu, T.; Han, D.; Green, J. Calibration and Validation of Antenna and Brightness Temperatures from Metop-C Advanced Microwave Sounding Unit-A (AMSU-A). Remote Sens. 2020, 12, 2978. [Google Scholar] [CrossRef]
- Zou, C.; Qian, H. Prelaunch Calibration of the Advanced Microwave Sounding Unit-A Radiometer for MetOp-C. In NOAA/STAR Technical Report; National Environmental Satellite, Data, and Information Service, NOAA: Washington, DC, USA, 2018. [Google Scholar]
- Bouvet, M.; Thome, K.; Berthelot, B.; Bialek, A.; Czapla-Myers, J.; Fox, N.P.; Goryl, P.; Henry, P.; Ma, L.; Marcq, S.; et al. RadCalNet: A Radiometric Calibration Network for Earth Observing Imagers Operating in the Visible to Shortwave Infrared Spectral Range. Remote Sens. 2019, 11, 2401. [Google Scholar] [CrossRef]
- Chander, G.; Hewison, T.; Fox, N.; Wu, X.; Xiong, X.; Blackwell, W. Overview of Intercalibration of Satellite Instruments. IEEE Trans. Geosci. Remote Sens. 2013, 51, 1056–1080. [Google Scholar] [CrossRef]
- Mo, T. Postlaunch calibration of the MetOp-A Advanced Microwave Sounding Unit-A. IEEE Trans. Geosci. Remote Sens. 2008, 46, 3581–3600. [Google Scholar] [CrossRef]
- Honninger, G.; Platt, U. Observations of BrO and its vertical distribution during surface ozone depletion at Alert. Atmos. Environ. 2002, 36, 2481–2489. [Google Scholar] [CrossRef]
- Wang, N.; Li, C.; Ma, L.; Liu, Y.; Meng, F.; Zhao, Y.; Pang, B.; Qian, Y.; Li, W.; Tang, L.; et al. Ground-based automated radiometric calibration system in Baotou site, China. In Proceedings of the image & Signal Processing for Remote Sensing XXIII Image and Signal Processing for Remote Sensing XXIII, Warsaw, Poland, 11–14 September 2017; Volume 10427. [Google Scholar]
- Ma, L.; Zhao, Y.; Woolliams, E.R.; Dai, C.; Wang, N.; Liu, Y.; Li, L.; Wang, X.; Gao, C.; Li, C.; et al. Uncertainty Analysis for RadCalNet Instrumented Test Sites Using the Baotou Sites BTCN and BSCN as Examples. Remote Sens. 2020, 12, 1696. [Google Scholar] [CrossRef]
- Ma, L.; Wang, N.; Liu, Y.; Zhao, Y.; Han, Q.; Wang, X.; Woolliams, E.R.; Bouvet, M.; Gao, C.; Li, C.; et al. An in-flight radiometric calibration method considering adjacency effects for high-resolution optical sensors over artificial targets. IEEE Trans. Geosci. Remote Sens. 2021, 99, 1–13. [Google Scholar] [CrossRef]
- Gao, C.; Liu, Y.; Liu, J.; Ma, L.; Wu, Z.; Qiu, S.; Li, C.; Zhao, Y.; Han, Q.; Zhao, E.; et al. Determination of the Key Comparison Reference Value from Multiple Field Calibration of Sentinel-2B/MSI over the Baotou Site. Remote Sens. 2020, 12, 2404. [Google Scholar] [CrossRef]
- He, J.Y.; Zhang, S.W. Regional Profiles and Precipitation Retrievals and Analysis Using FY-3C MWHTS. Atmos. Clim. Sci. 2016, 6, 273–284. [Google Scholar] [CrossRef][Green Version]
- He, J.Y.; Zhang, S.W.; Wang, Z.Z. Advanced Microwave Atmospheric Sounder (AMAS) Channel Specifications and T/V Calibration Results on FY-3C Satellite. IEEE Trans. Geosci. Remote Sens. 2014, 53, 481–493. [Google Scholar]
- Cao, C.; Weinreb, M.; Xu, H. Predicting Simultaneous Nadir Overpasses among Polar-Orbiting Meteorological Satellites for the Intersatellite Calibration of Radiometers. J. Atmos. Ocean. Technol. 2004, 21, 537–542. [Google Scholar] [CrossRef]
- He, J.Y.; Zhang, S.W. Research on calibration, validation and retrievals on FY-3D MWHTS. In Proceedings of the 2017 Progress in Electromagnetics Research Symposium—Fall (PIERS—FALL), Singapore, 19–22 November 2017; pp. 1853–1856. [Google Scholar]
- Monjardino, J.; Dias, L.; Fortes, P.; Tente, H.; Ferreira, F.; Seixas, J. Carbon Neutrality Pathways Effects on Air Pollutant Emissions: The Portuguese Case. Atmosphere 2021, 12, 324. [Google Scholar] [CrossRef]
- Levelt, P.F.; Van Den Oord, G.H.; Dobber, M.R.; Malkki, A.; Visser, H.; De Vries, J.; Stammes, P.; Lundell, J.O.; Saari, H. The ozone monitoring instrument. IEEE Trans. Geosci Remote 2006, 44, 1093–1101. [Google Scholar] [CrossRef]
- Liu, H.; Liu, C.; Xie, Z.; Li, Y.; Huang, X.; Wang, S.; Xu, J.; Xie, P. A paradox for air pollution controlling in China revealed by “APEC Blue” and “Parade Blue”. Sci. Rep. 2016, 6, 4408. [Google Scholar] [CrossRef]
- Grell, G.A.; Dezs, A. generalized approach to parameterizing convection combining ensemble and data assimilation techniques. Geophys. Res. Lett. 2002, 29, 38-1–38-4. [Google Scholar] [CrossRef]
- Li, M.; Zhang, Q.; Kurokawa, J.I.; Woo, J.H.; He, K.B.; Lu, Z.; Ohara, T.; Song, Y.; Streets, D.G.; Carmichael, G.R.; et al. Mix: A mosaic asian anthropogenic emission inventory for the mics-asia and the htap projects. Atmos. Chem. Phys. Discuss. 2015, 15, 34813–34869. [Google Scholar]
- Krotkov, N.A.; Lamsal, L.N.; Celarier, E.A.; Swartz, W.H.; Marchenko, S.V.; Bucsela, E.J.; Chan, K.L.; Wenig, M.; Zara, M. The version 3 OMI NO2 standard product. Atmos. Meas. Tech. 2017, 10, 3133–3149. [Google Scholar] [CrossRef]
- Xing, C.; Liu, C.; Wang, S.; Chan, K.L.; Gao, Y.; Huang, X.; Su, W.; Zhang, C.; Dong, Y.; Fan, G.; et al. Observations of the vertical distributions of summertime atmospheric pollutants and the corresponding ozone production in Shanghai, China. Atmos. Chem. Phys. 2017, 17, 14275–14289. [Google Scholar] [CrossRef]
- Wang, Y.; Lampel, J.; Xie, P.; Beirle, S.; Li, A.; Wu, D.; Wagner, T. Ground-based MAX-DOAS observations of tropospheric aerosols, NO2, SO2 and HCHO in Wuxi, China, from 2011 to 2014. Atmos. Chem. Phys. 2017, 17, 2189–2215. [Google Scholar] [CrossRef]
- Zhang, C.; Liu, C.; Chan, K.L.; Hu, Q.; Liu, H.; Li, B.; Xing, C.; Tan, W.; Zhou, H.; Si, F.; et al. First observation of tropospheric nitrogen dioxide from the Environmental Trace Gases Monitoring Instrument onboard the GaoFen-5 satellite. Light Sci. Appl. 2020, 9, 66. [Google Scholar] [CrossRef]
- Zou, C.Z.; Wang, W. Intersatellite calibration of AMSU-A observations for weather and climate applications. J. Geophys. Res. Atmos. 2011, 116. [Google Scholar] [CrossRef]
- Weng, F.; Zou, X.; Sun, N.; Yang, H.; Tian, M.; Blackwell, W.J.; Wang, X.; Lin, L.; Anderson, K. Calibration of Suomi national polar-orbiting partnership advanced technology microwave sounder. J. Geophys. Res. 2013, 118, 1–14. [Google Scholar] [CrossRef]
- Su, W.; Liu, C.; Hu, Q.; Fan, G.; Xie, Z.; Huang, X.; Zhang, T.; Chen, Z.; Dong, Y.; Ji, X.; et al. Characterization of ozone in the lower troposphere during the 2016 G20 conference in Hangzhou. Sci. Rep. 2017, 7, 17368. [Google Scholar] [CrossRef]
- Hong, Q.; Liu, C.; Chan, K.L.; Hu, Q.; Xie, Z.; Liu, H.; Si, F.; Liu, J. Ship-based MAX-DOAS measurements of tropospheric NO2, SO2, and HCHO distribution along the Yangtze River. Atmos. Chem. Phys. 2018, 18, 5931–5951. [Google Scholar] [CrossRef]
- Tan, W.; Liu, C.; Wang, S.; Xing, C.; Su, W.; Zhang, C.; Xia, C.; Liu, H.; Cai, Z.; Liu, J. Tropospheric NO2, SO2, and HCHO over the East China Sea, using ship-based MAX-DOAS observations and comparison with OMI and OMPS satellite data. Atmos. Chem. Phys. 2018, 18, 15387–15402. [Google Scholar] [CrossRef]
Publisher’s Note: MDPI stays neutral with regard to jurisdictional claims in published maps and institutional affiliations. |
© 2021 by the authors. Licensee MDPI, Basel, Switzerland. This article is an open access article distributed under the terms and conditions of the Creative Commons Attribution (CC BY) license (https://creativecommons.org/licenses/by/4.0/).