Article

Drainage Conditions Influence Corn-Nitrogen Management in the US Upper Midwest

by
Gabriel Dias Paiao
1,*,
Fabián G. Fernández
1,* and
Seth L. Naeve
2
1
Department of Soil, Water, and Climate, University of Minnesota, Saint Paul, MN 55108, USA
2
Department of Agronomy and Plant Genetics, University of Minnesota, Saint Paul, MN 55108, USA
*
Authors to whom correspondence should be addressed.
Agronomy 2021, 11(12), 2491; https://doi.org/10.3390/agronomy11122491
Submission received: 9 November 2021 / Revised: 4 December 2021 / Accepted: 5 December 2021 / Published: 8 December 2021

Abstract

:
Soil drainage is not considered in the N fertilizer guidelines for corn (Zea mays L.) in the US Midwest. This study investigated the influence of soil drainage on corn grain yield, N requirement, and residual soil N, and evaluated the utility of in-season soil N measurements to guide N application. This 6-year study in Minnesota, US on a corn–soybean (Glycine max [L.] Merr.) rotation had drained and undrained conditions and six at planting (PL) (0–225 in 45 kg N ha−1 increments) and four split (SP) N fertilizer rates (at planting/V6-V8—45/45, 45/90, 45/135, 45/179 kg N ha−1). The drained compared to undrained soil produced 8% more grain yield (12.8 vs. 11.9 Mg ha−1), 12% more N uptake (169 vs. 151 kg N ha−1), 16% lower optimal N rate (ONR) (160 vs. 193 kg N ha−1), 3.1% greater grain yield at ONR (13.5 vs. 13.1 Mg ha−1), and similar in season and residual soil N. Compared to SP, PL lowered ONR (151 vs. 168 kg N ha−1) in drained soils, and the opposite occurred for undrained soils (206 vs. 189 kg N ha−1). These results substantiate the agronomic benefits of artificial drainage and the need to incorporate drainage conditions into N management guidelines.

1. Introduction

Much of the US Midwest agricultural land is artificially drained because the soils are poorly drained and would remain waterlogged during large portions of the crop season [1]. Due to various complicating factors, such as topographic locations, many fields or portions of fields that could benefit from artificial drainage remain in cultivation with inadequate drainage [2]. A survey with Minnesota growers, for instance, estimated that 19% of the cropland in the state could still benefit from artificial drainage [2].
The negative effects of poor soil drainage for corn production have long been documented and include reduced root development and water uptake, decreased photosynthetic rates, generalized nutrient deficiency, and yield losses [3,4,5,6]. The soil N cycle is also largely affected by waterlogging. With insufficient O2 availability, denitrifying bacteria utilize NO3 as an electron acceptor and release NO, N2O, and N2 gas [7]. In poorly drained agricultural soils in the US Midwest, substantial N losses through denitrification have been documented [8]. Further, drainage conditions interact with N fertilizer, crop residue, and weather conditions to make N mineralization highly variable and difficult to predict [9]. The combination of these issues creates variability in the crop’s N demand and the soil’s N supply, adding complexity to N fertilizer management in poorly drained fields [10,11].
Despite the substantial evidence that soil drainage affects the soil–crop N dynamics, little has been done to quantify the direct effect of drainage conditions on optimal N fertilizer rates (ONR) for corn production. In fact, state guidelines for N fertilizer management in the US Midwest follow the maximum return to N (MRTN) approach, which does not account for differences in drainage conditions when prescribing N rates [12]. Similarly, while it is plausible to think that undrained soils would benefit from split N applications to reduce the likelihood of denitrification losses early in the season, no field studies have been conducted to evaluate this hypothesis. The pre-sidedress NO3 test (PSNT) is another tool commonly utilized by corn growers to manage N. This tool indicates the probability of obtaining a yield increase with sidedress N application based on soil NO3-N value [13]. Similar to the MRTN, the PSNT does not take drainage intensity into consideration.
Without a foundation to guide their N management in undrained fields, growers need to arbitrarily define their fertilizer rates, therefore increasing the risks of fertilizer misapplication and environmental degradation. Nitrogen fertilizer not taken up by crops during the growing season is prone to environmental losses, which raises concerns about public health and environmental degradation [14]. Because the frequency of extreme precipitation events in the US Midwest is expected to increase in the future in response to global warming [15], waterlogging conditions in agricultural fields may also become increasingly more common. Therefore, it is crucial to understand how soil drainage influences the corn response to N fertilizer application, so improved N management guidelines can be developed to increase N use efficiency and crop production.
The objectives of this study were (1) to investigate the influence of soil drainage conditions on corn grain yield, N requirement, and residual soil N, and (2) to evaluate the utility of in-season soil N measurements to guide N applications. We hypothesize that artificial drainage will improve overall corn production and that in-season soil N measurements will be useful to guide N application.

2. Materials and Methods

The study was conducted from 2014 to 2019 on a 5 ha field near Wells, MN, (43°51′15.76″ N; 93°43′47.28″ W) with two major soils: a poorly drained Marna clay loam (fine, smectitic, mesic Vertic Endoaquolls, 0 to 2 percent slopes), present in approximately 60% of the field; and a somewhat poorly drained Nicollet clay loam (fine-loamy, mixed, superactive, mesic Aquic Hapludolls, 1 to 3 percent slopes), present in approximately 40% of the field. Tile drainage (1.2 m depth and 9 m tile spacing) with control drainage structures was installed in the field in 2011 to create eight blocks of drained and undrained conditions (four replications). The undrained blocks had closed control drainage structures, while the drained blocks had fully open control drainage structures. A corn–soybean rotation was established starting in 2012 by dividing the drainage blocks in half and randomly assigning either corn or soybean to each half.
Management of nutrients other than N and agronomic practices for weed, pest, and disease control followed University guidelines to maximize productivity. Selected soil properties for the top 15 cm of the soil are presented in Table 1. Every year the field was chisel plowed to 15 cm depth and field cultivated during the spring. Additional agronomic information is presented in Table 2. Target corn plant population ranged from 84,000 to 86,600 plants ha−1. While optimal planting dates may change based on drainage conditions, planting was done on the same day to mimic farmer practices where an entire field is planted regardless of within-field differences in soil moisture conditions.
The study followed a randomized complete block design with a split-plot treatment structure replicated four times. The main plot was drainage condition (drained and undrained), and the subplot was a combination of N fertilizer rates and application timings. The subplots were 9 m long and 3.5 m wide, with four corn rows (0.76 m row spacing). There were six at planting (PL) N fertilizer rates (0, 45, 90, 135, 179, and 224 kg N ha−1) and four split (SP) N fertilizer rates (45 kg N ha–1 applied at planting and the remaining N during the V6 to V8 development stage to match the total N in PL treatments). In 2014, only one SP treatment was applied (total application of 135 kg N ha–1), and in 2015 and 2016 only two SP treatments were applied (total application of 135 and 179 kg N ha−1). All treatments were broadcast applications of urea-N (46-0-0) plus Agrotain (urea with N-(n-butyl) thiophosphoric triamide (NBPT)), (Koch Fertilizer LLC, Wichita, KS, USA), except for the at-planting applications from 2014 to 2016 where urea without Agrotain was incorporated to a depth of 8 cm with a field cultivator within 24 h of fertilizer application. All at-planting applications were done within 15 days of planting (Table 2).
Daily and 30 yr normal (1984–2013) air temperature and precipitation were retrieved from a weather station within 10 km of the site [16]. Growing degree days (GDD) (°C) were calculated as the average daily temperature minus 10 °C.
Soil bulk density was determined for all soil sampling depths (i.e., 0 to 30 cm, 30 to 60 cm, and 60 to 90 cm) using the intact core method [17]. Soil porosity was calculated as one minus the ratio of soil bulk density (1320 kg m−3) and the density of silica (2650 kg m−3). Soil volumetric water content (VWC) and temperature at 0 to 15 cm soil depth was monitored continuously for each drainage condition in the PL-135 kg N ha−1 plots with 5TM soil moisture and temperature sensors and Em50 digital data loggers (Decagon Devices Inc., Pullman, WA, USA). Soil water-filled pore-space (WFPS) was calculated by dividing the VWC by the soil porosity.
Plant population was determined by counting the number of emerged plants at the V4 development stage from 12.2 m of the middle two rows of each subplot. Whole-plant above-ground N uptake minus the ear (grain and cob) was measured at R6 development stage (NUPStover), grain N removal was measured at harvest (NUPGrain) and the two combined represented total N uptake (NUPGrain+Stover). Tissue N concentration was determined by combustion analysis [18]. Grain harvest was done by harvesting 6 m of the middle two rows of each subplot. Corn grain yield was determined as the summation of the harvest grain and the R6 grain previously collected from the harvest rows, adjusted to 155 g kg−1 moisture. A severe windstorm with wind speeds as high as 80 km h−1 snapped up to 70% of the corn stalks just above the ear leaf (greensnap) on 20 July 2019. Damaged and undamaged plants were harvest separately in 2019, and corn grain yield was determined by extrapolating the yield of undamaged plants to the entire plot area (90% of the subplots had greensnap damage in less than 43% of the plants). Grain N recovery (GNR) was calculated as the difference between NUPGrain for a given treatment and NUPGrain in the PL-0 kg N ha−1 treatment, divided by the N fertilizer rate applied to the given treatment.
Soil samples were collected in season at the V6 stage, in the fall after grain harvest, and next spring before soybean planting (Table 2). For in season, all the PL treatments were sampled except from 2014 to 2016 when only the PL-0 and PL-135 kg N ha−1 treatments were sampled. For next spring, only the PL-0, PL-135, PL-225, SP-135, and SP-225 kg N ha−1 treatments were sampled. A two-core composite soil sample was collected per subplot with a hydraulic probe (5 cm diameter) at 0 to 30 cm, 30 to 60 cm, and 60 to 90 cm depths, except for the V6 sampling, where four-core composite soil samples were collected with a manual soil probe (1.8 cm) at 0 to 30 cm and 30 to 60 cm depths. Soil NH4+-N was extracted with a 2M KCl extraction [19] and analyzed with a TL-2800 Ammonium N analyzer (Timberline Instruments, Boulder, CO), and NO3-N was extracted with a 0.01 M KCl extraction and analyzed by the cadmium reduction method [20]. Total inorganic N (TIN) was determined as the summation of soil NH4+-N and NO3-N measured in season at V6 corn development state (TINV6), in the fall (TINFall), and next spring (TINNextSpring). The difference between TINFall and TINNextSpring was also calculated (TINDiff). Soil bulk density was used to transform soil N measurements assessed in mg kg−1 into kg ha−1.
All statistical analyses were done with R software [21] and considered significant at p < 0.1. Mixed effects models were fitted using restricted maximum likelihood with the nlme package [22] for each year. Drainage and N rate/timing were fixed effects, while block and block by drainage were random effects. Model assumptions of homogeneous variance and normal distribution of the residuals were checked by examining the residual plots. Drainage often produced heterogenous variance (undrained plots were more variable), which was accounted for by allowing the estimation of different variances for each level of drainage with the varIdent function [22] of the nlme package. Pairwise mean comparisons for the response variables grain yield, NUPGrain+Stover, GNR, and residual TINFall and TINDiff were performed by calculating the Tukey honest significant difference (HSD) test with the emmeans package [23].
Crop response to N fertilizer, and critical in-season soil N values were also determined for each year, with drainage and N rate as fixed effects and block and block by drainage as random terms. Grain yield response to N rate was determined according to the type of regression model that presented the best goodness of fit for each drainage condition. Linear and quadratic-plateau (QP) models were fitted and model selection was performed by refitting the models with maximum likelihood and comparing the Akaike information criterion (AIC), where lower numbers indicate better fit [24]. For linear responses, the optimal N rate (ONR) was the highest N rate applied. For QP responses, the ONR was the last increment of N that returned a yield increase large enough to pay for the additional cost of N, assuming corn prices of USD 157 Mg−1 grain (USD 4 bushel−1) and fertilizer prices of USD 0.88 kg−1 N fertilizer (USD 0.4 pound−1). The N rate differential from ONR (dONR) was calculated as the difference between the applied N rate and the ONR.
The relationship between residual soil N and dONR was determined for each combination of drainage conditions and fertilizer application timings. Box-Cox transformations [25] indicated the use of log-transformed soil N values as has also been done by others [26]. Critical in-season soil N was determined as the estimated soil N value to achieve grain yield at ONR. Standard errors for the estimates were determined with the deltaMethod procedure from the car package [27]. Critical in-season soil N value for different soil N measurements (NO3-N or TIN) and sampling depths (0–30 or 0–60 cm) were calculated, and their utility to predict grain yield was determined by comparing the AIC values. The soil N measurement and sampling depth that provided the best trade-off between predictive power and practicality for implementation in commercial fields was considered the best method.
The amount of grain yield loss caused by N deficiency in undrained soils was estimated by comparing the grain yield at ONR in drained and undrained soils with the grain yield that would be obtained in undrained soils if the ONR for drained soils was applied. Profit margins were calculated as the difference between the income generated with corn production and the cost of fertilizer application. For the SP fertilizer application timing, USD 25 ha−1 was deducted from the margins to account for the cost of an additional field operation to apply N fertilizer in season, using market costs during the study. Average results for comparisons between drainage conditions considered all the 6 years of data, but average results between the fertilizer application timings considered only the 2015–2019 growing seasons that had both PL and SP response curves.

3. Results

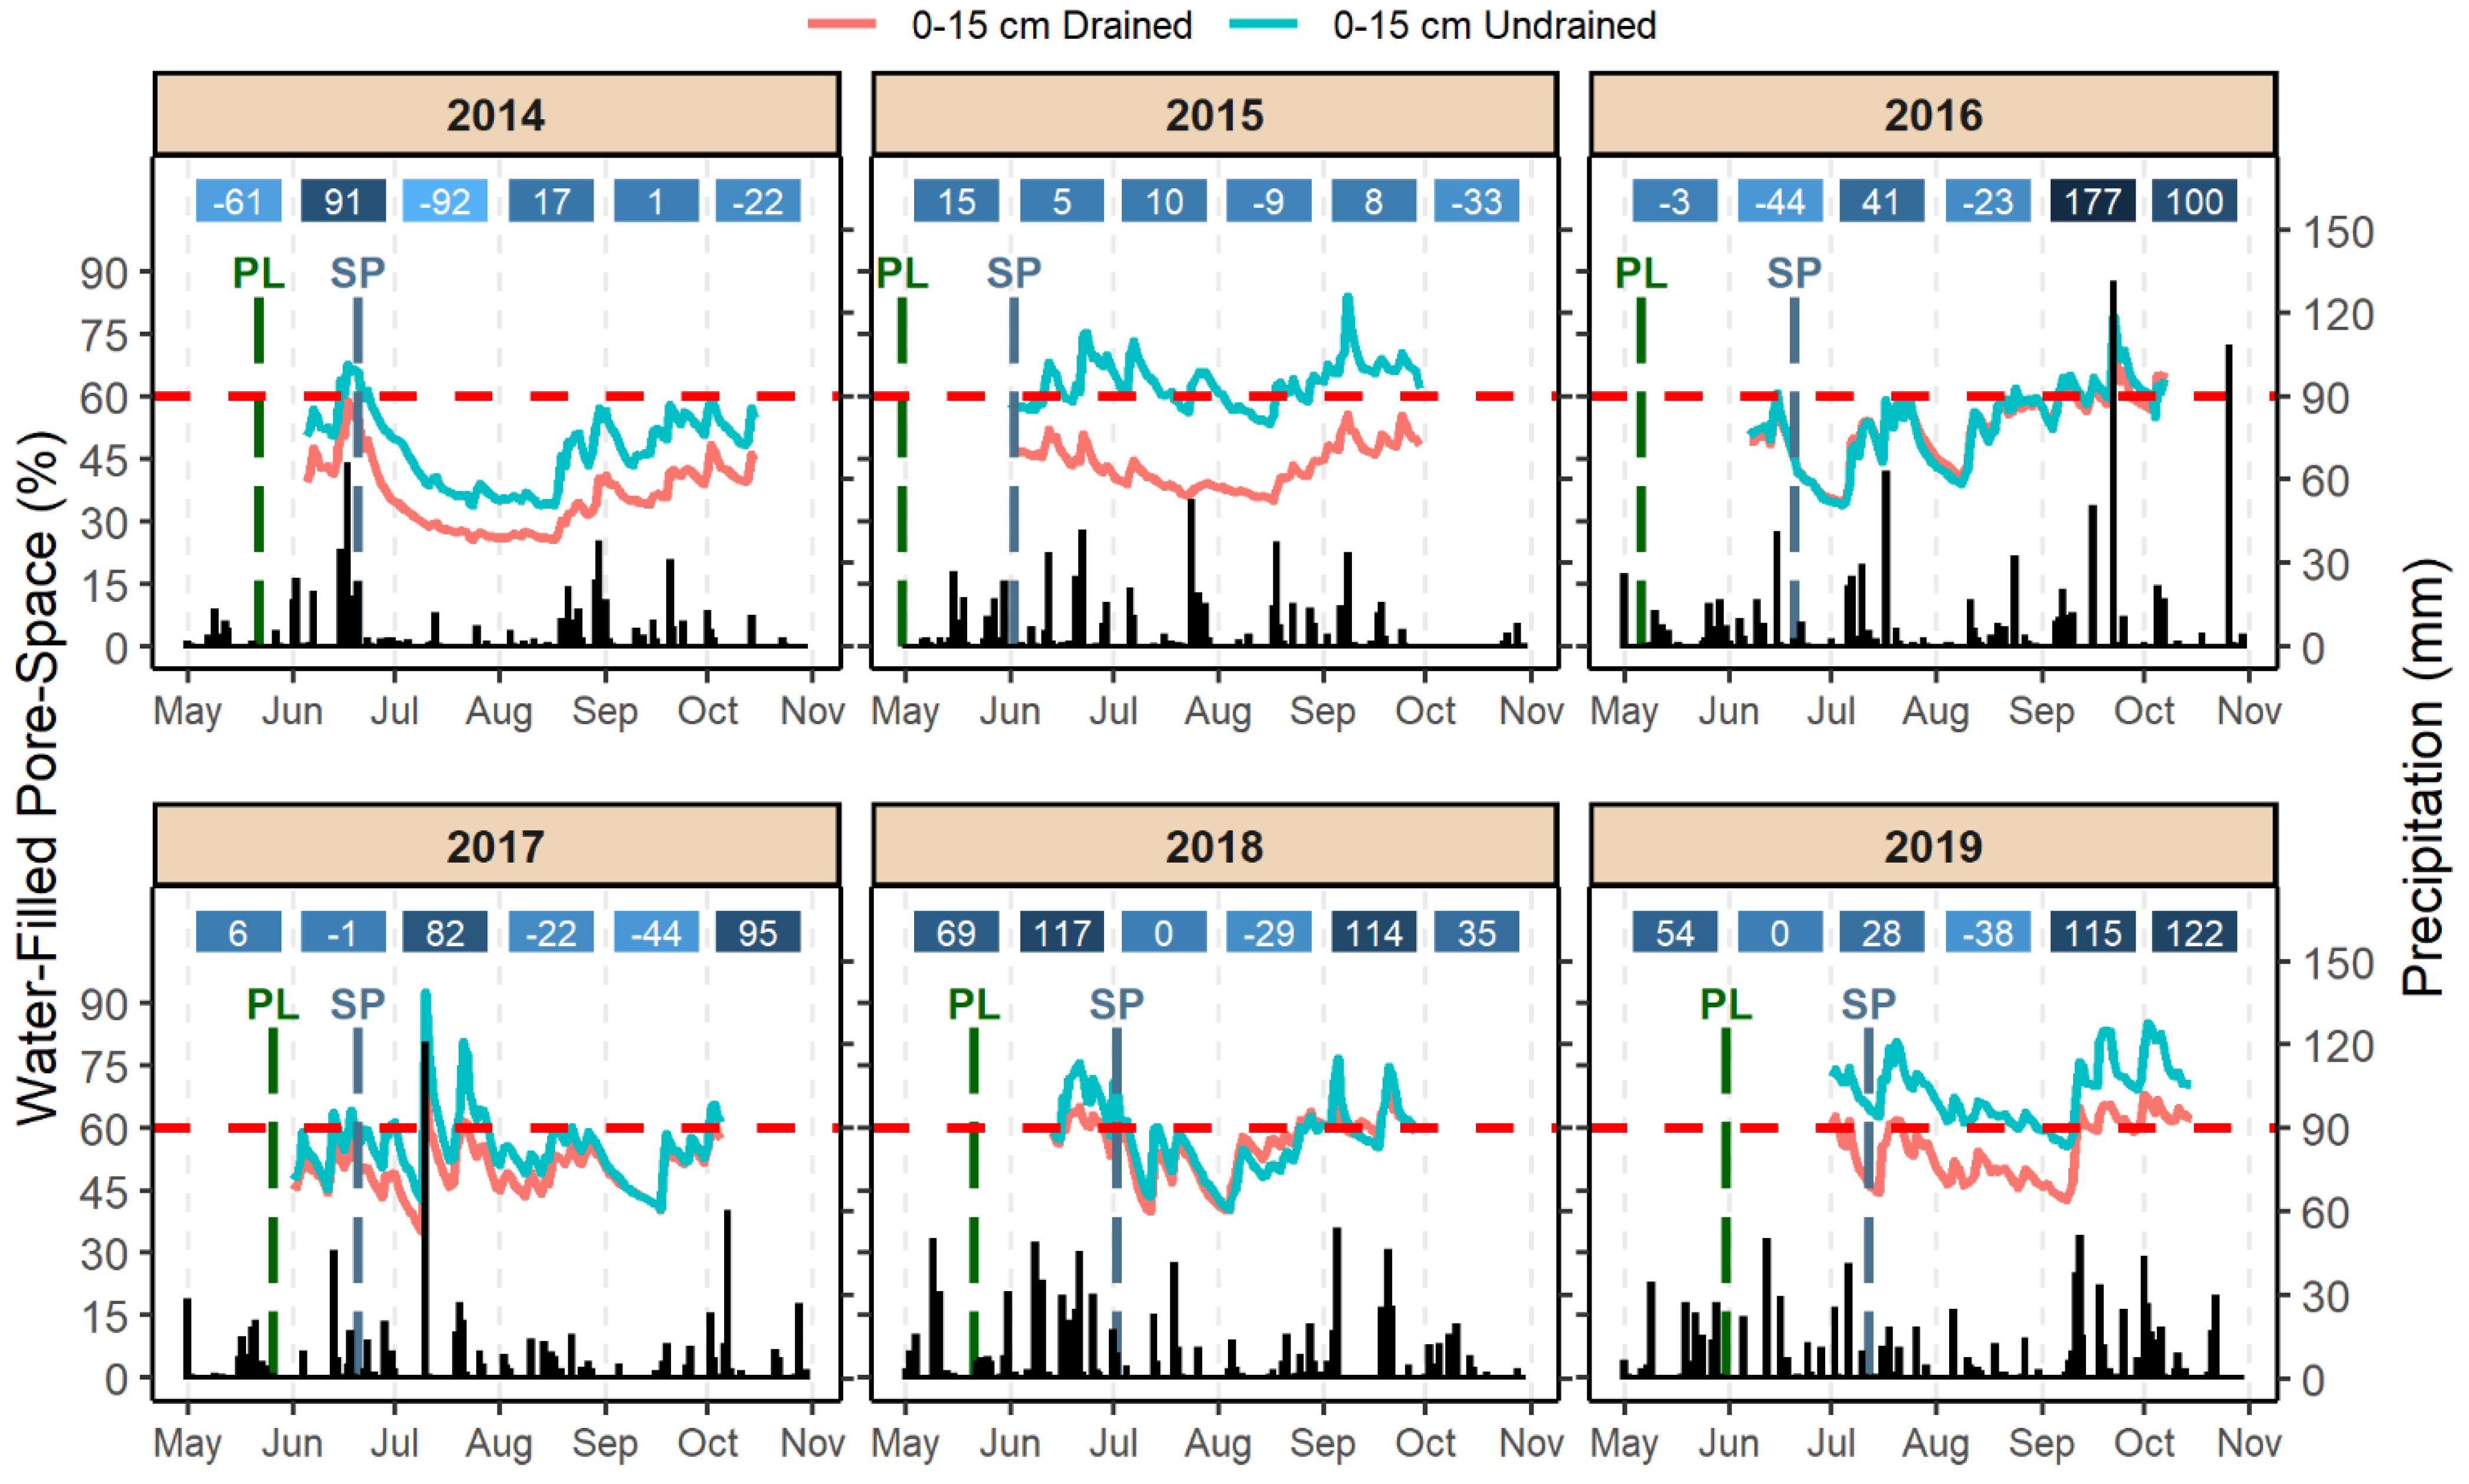
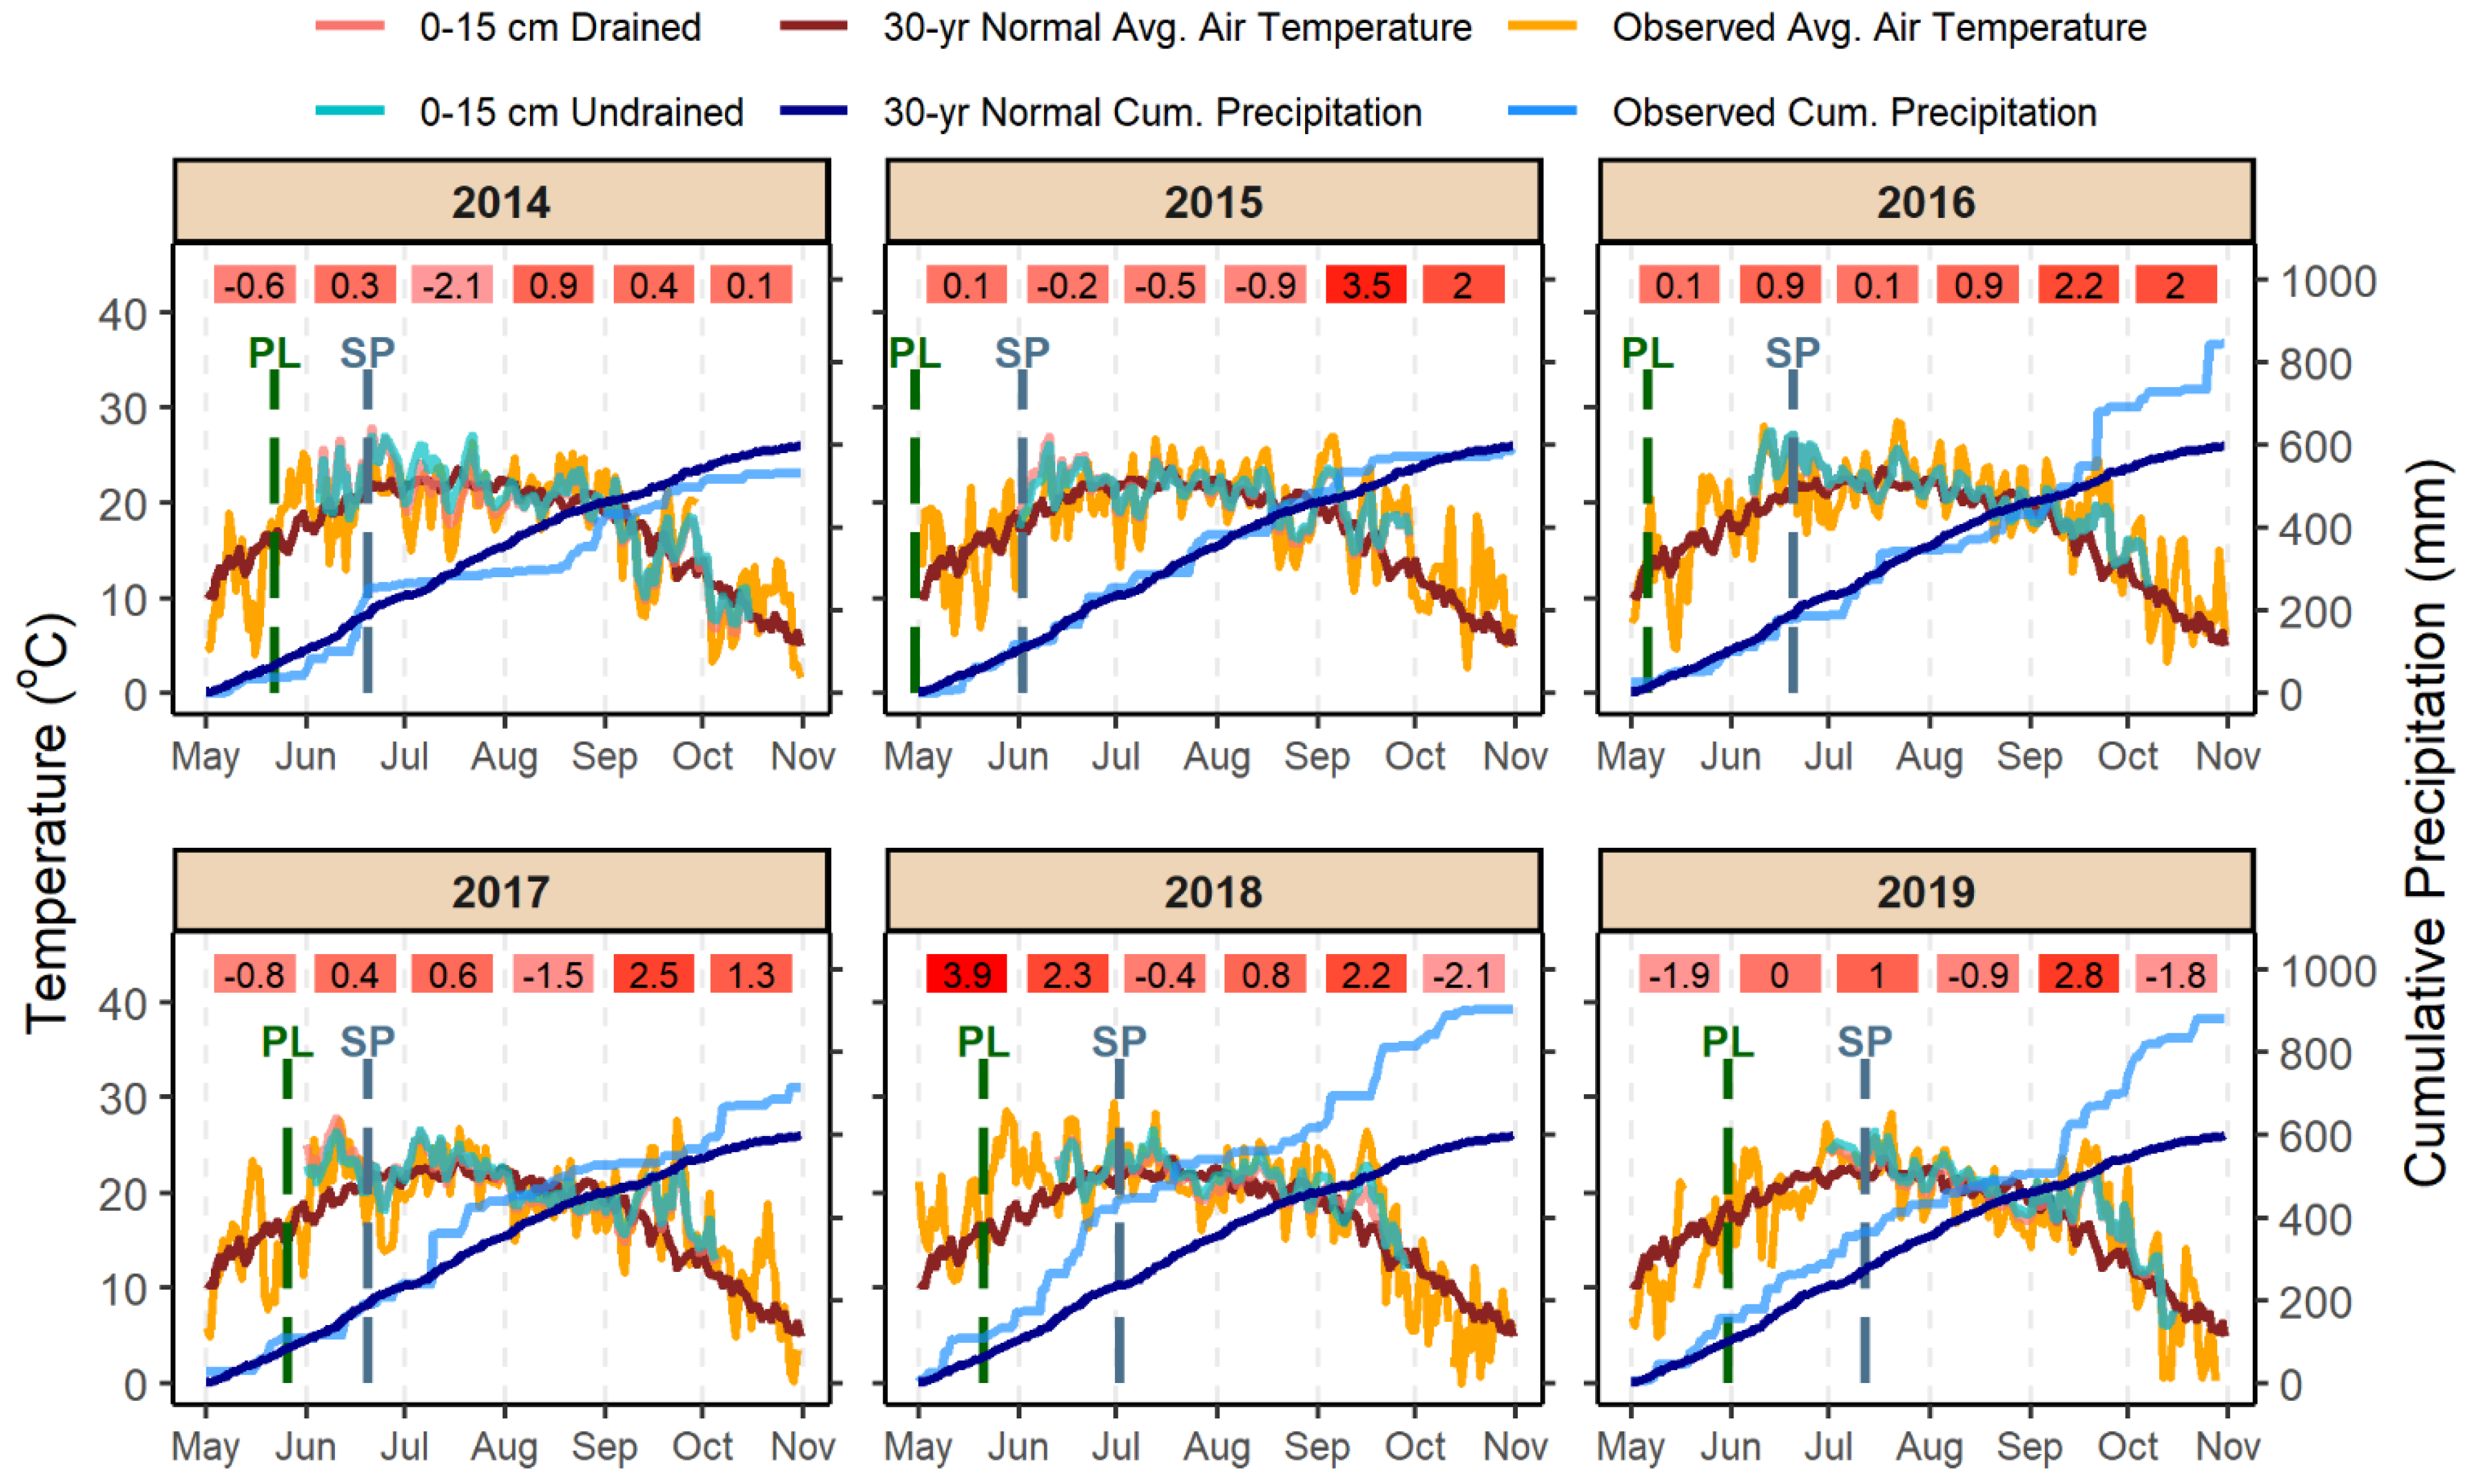
3.1. Weather and Soil Conditions

The 2014 growing season was characterized by a dry summer with only 59 mm of precipitation recorded between 21 June and 20 August, and irregularly distributed precipitation with excessive precipitation at times, such as 153 mm between the 15 and 20 of June (Figure 1). Air temperature in 2014 was near normal during the entire growing season, except for July when it was 2.1 °C below normal (Figure 2). The entire 2015 growing season was characterized by near normal air temperatures and precipitation, except for September when it was 3.5 °C above normal (Figure 2). Precipitation was well distributed in 2015 and resulted in undrained soils with considerably greater soil WFPS than drained soils during most of the season (Figure 1).
The 2016 growing season had an average air temperature 0.1 to 2.2 °C above normal and precipitation was 44 mm below normal in June (Figure 2). Soil WFPS in 2016 was similar in drained and undrained soils and remained near FC during most of the summer, indicating overall uniform distribution without excessive precipitation (Figure 1). In 2017, soil WFPS was similar for drained and undrained soils at the start and end of the growing season but was greater in undrained soils from the middle of June (around the time of SP application) through August (Figure 1). Excessive precipitation events occurred in July, with 120 mm recorded on 10 July and another 65 mm the following week, making soil WFPS in undrained soils reach 92.4%, the highest of any year in the study (Figure 1). The monthly average air temperatures in 2017 ranged from 1.5 °C below normal in August to 2.5 °C above normal in September (Figure 2).
The 2018 growing season had the warmest and wettest spring of the study. In May and June, the monthly average air temperature was 3.9 and 2.3 °C above normal and precipitation was 69 and 117 mm above normal, respectively (Figure 2). Excessive precipitation in the spring was associated with soil WFPS above FC from 13 June (when WFPS data started being collected) to 5 July in undrained soils (Figure 1). The WFPS in drained and undrained soils was above FC in September, due to 114 mm above-normal precipitation (Figure 1). The most important weather event in 2019 was a windstorm that caused severe greensnap damage. Generally, corn with high N fertilizer rates in drained soil were affected the most (average plant breakage of 33% for drained PL 224 kg N ha−1), while corn with zero N fertilizer in undrained soil had the least damage (average plant breakage of 1.7%). The 2019 season was wetter than normal in most months and temperatures ranged from 1.9 °C below normal to 2.8 °C above normal (Figure 2).
Soil temperature followed air temperature closely, but drained soils were 0.26 °C cooler on average than undrained, with most of the difference occurring in July of 2014 and 2018 (Figure 2).

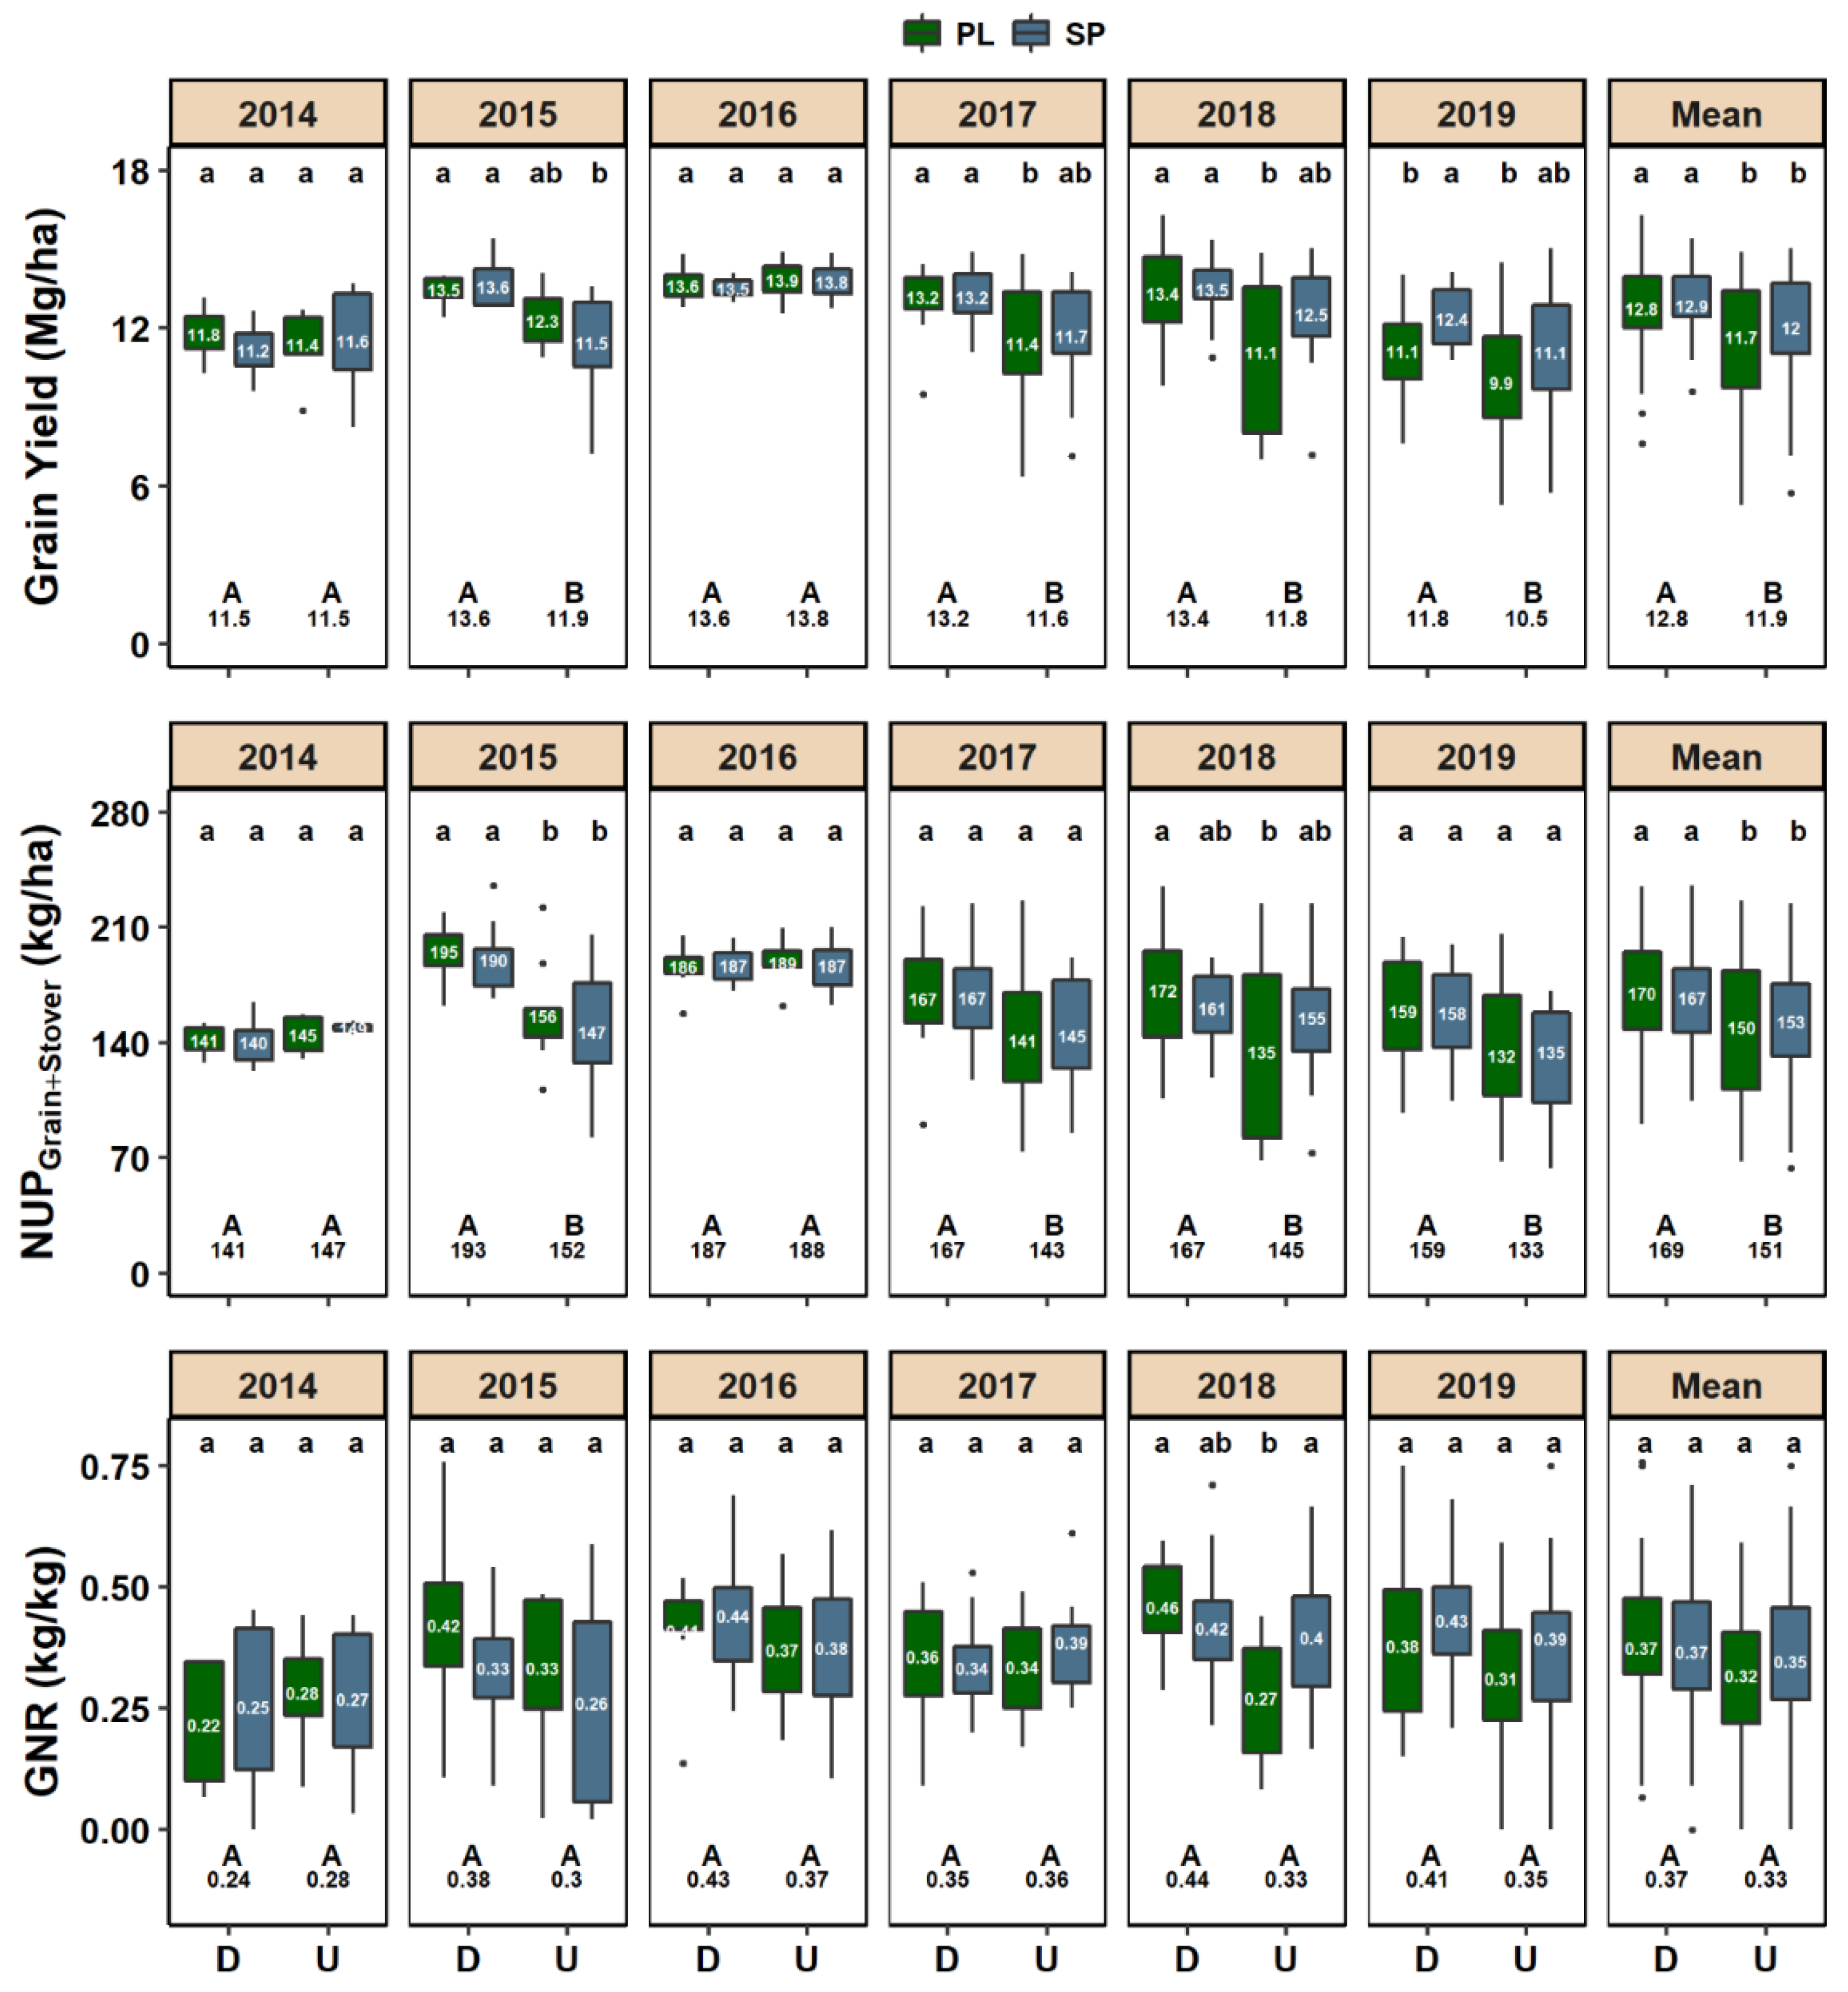
3.2. Grain Yield and Grain Nitrogen Recovery

The drainage conditions interacted with N application timing to affect grain yield in four of the six years (2015, 2017, 2018, and 2019) (Figure 3). The largest grain yield response to drainage was observed in 2018, which also had the warmest and wettest spring, with the drained treatment producing 1.21 times more grain than the undrained for the PL timing (13.4 vs. 11.1 Mg grain ha−1) (Figure 3). Within drainage conditions, fertilizer application timing affected grain yield only for drained soils in 2019, that had greensnap damage during the summer and produced more grain with the SP treatments than with the PL (12.4 vs. 11.1 Mg grain ha−1) (Figure 3). While not significant, the SP timing in undrained soils tended to produce more grain yield than the PL (Figure 3). Averaged across years and fertilizer application timings, the drained treatment produced 1.08 times more grain than the undrained (12.8 vs. 11.9 Mg grain ha−1) (Figure 3). Grain yield variability in the undrained treatment was 1.44 times greater than in the drained (coefficient of variation of 27 vs. 19%). Averaged across years, the PL-0 kg N ha−1 treatment (check plot) in drained soils produced 1.18 times more grain than in undrained (8.5 vs. 7.2 Mg grain ha−1), but on a yearly basis the difference was significant only in 2015 (Supplemental Figure S1).
The results for NUPGrain+Stover were similar to grain yield, as the two variables were highly correlated (r = 0.76, p < 0.01 for drained, and r = 0.89, p < 0.01 for undrained). Drained soils had greater NUPGrain+Stover than undrained in four of the six years (2015, 2017, 2018, and 2019) and there was no NUPGrain+Stover response to fertilizer application timing, regardless of drainage condition (Figure 3). Averaged across years and fertilizer application timings, drained soils had NUPGrain+Stover 1.12 times greater than undrained (169 vs. 151 kg N ha−1). There were no significant differences in GNR related to drainage conditions or fertilizer application timings, except for 2018 in undrained soils, where the SP timing had greater GNR than the PL (0.40 vs. 0.27 kg kg−1) (Figure 3). While only a trend, drained soils tended to have greater GNR than undrained, and the SP fertilizer application timing in undrained soils tended to have greater GNR than the PL, especially in 2018 and 2019 (Figure 3).

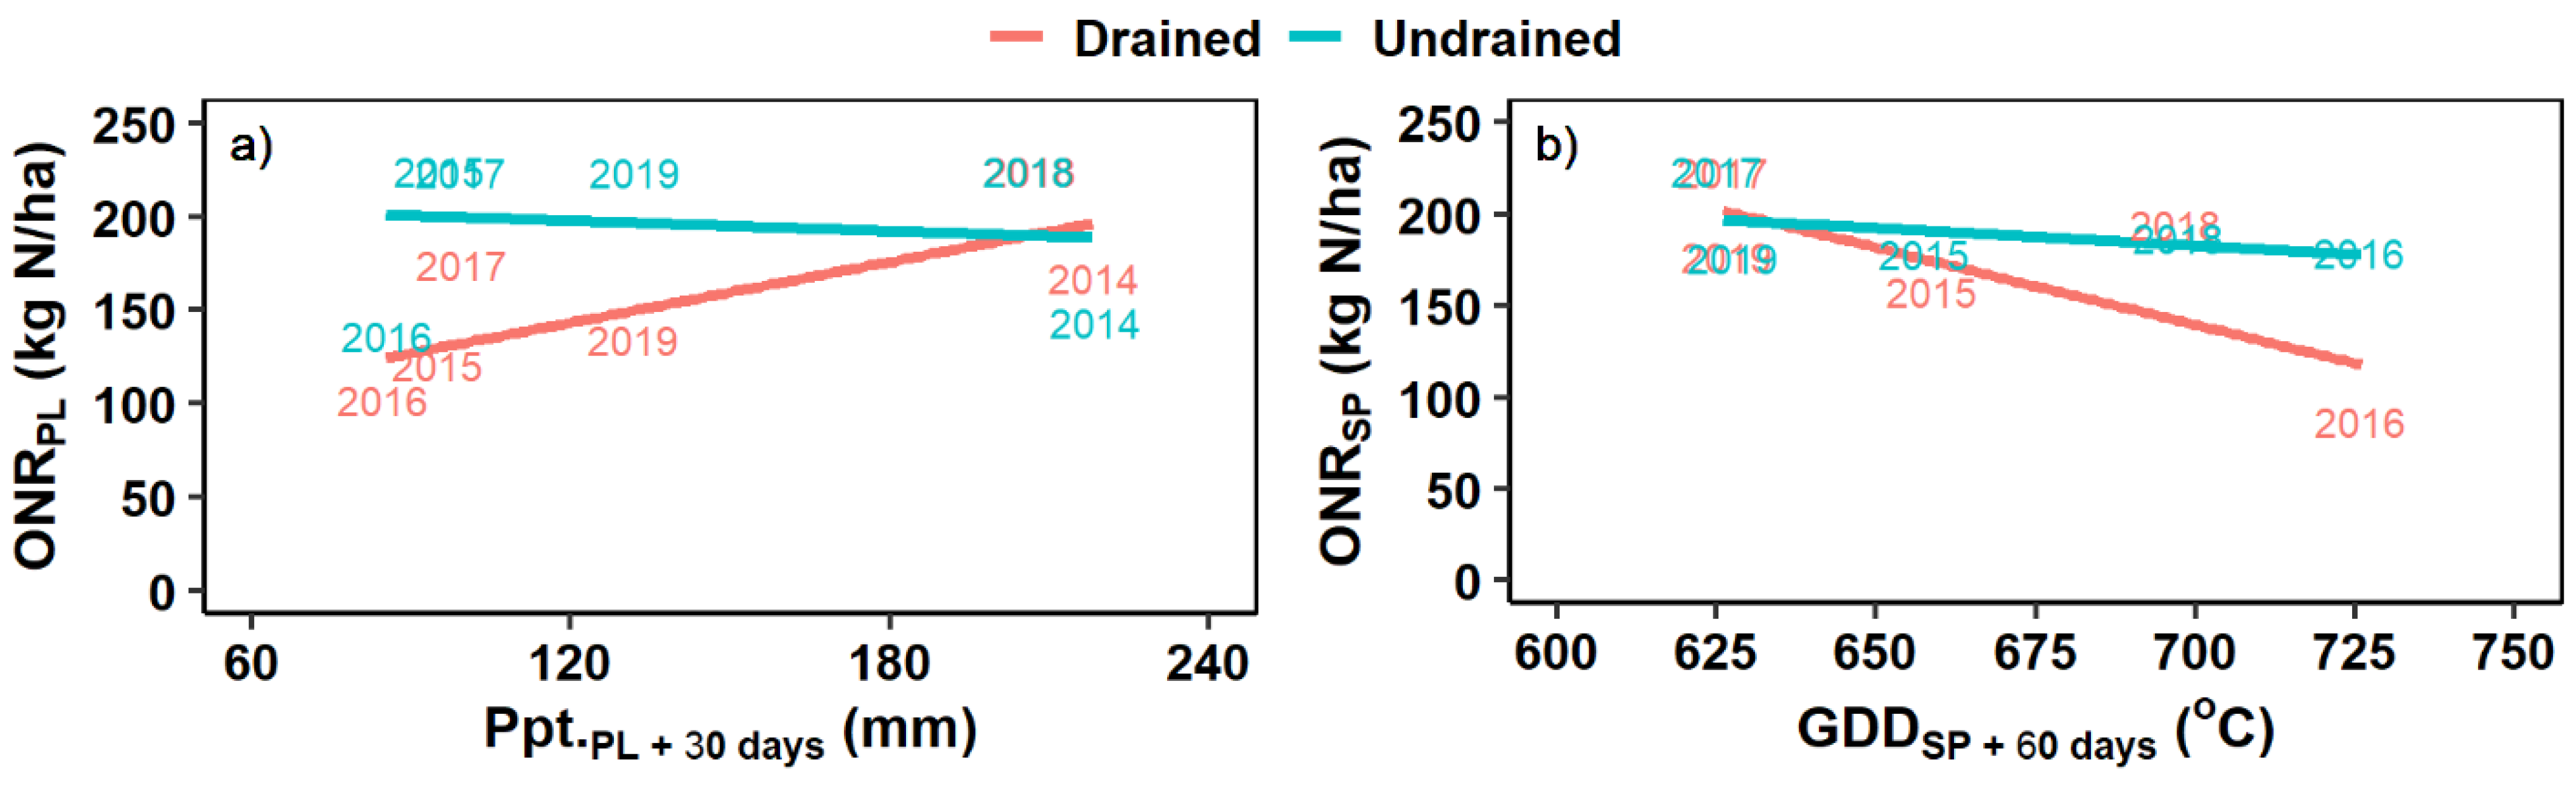
3.3. Nitrogen Requirement

The optimal N rate in drained soils was equal to or lower than in undrained every year except in 2014 for PL and in 2018 for SP (Table 3). Averaged across years and fertilizer application timings, ONR in undrained soils was 1.20 times greater than in drained (193 vs. 160 kg N ha−1).
For the PL timing, grain yield in undrained soils was not optimized (i.e., the estimated ONR was 224 kg N ha−1, the highest N rate applied) in four of the six years (2015, 2017, 2018, and 2019), while grain yield in drained soils was not optimized only in 2018, which had the wettest and warmest spring (Table 3; Figure 1 and Figure 2). For the SP timing, grain yield in undrained soils was not optimized in three of the five years (2015, 2016, and 2017), and in drained soils only in 2017 (Table 3). Averaged across years (2015–2019), compared to PL, the SP timing required 17 kg N ha−1 more in drained (PL vs. SP was 151 vs. 168 kg N ha−1) and 17 kg N ha−1 less in undrained (PL vs. SP was 206 vs. 189 kg N ha−1) (Table 3).
Grain yield at ONR in drained soils was greater than in undrained in four of the six years for PL (2014, 2015, 2017, and 2018), and in four of the five years for SP (2015, 2017, 2018, and 2019) (Table 3). Averaged across years, grain yield at ONR in drained soils was only 1.01 and 1.05 times greater than in undrained for PL and SP, respectively (13.1 vs. 12.9 and 13.7 vs. 13.0 Mg grain ha−1). Comparing the yield that would be obtained in undrained soils if the ONR for drained soils was applied, it was estimated that N deficiency accounted for 91 and 60% of the grain yield losses in undrained soils for the PL and SP timings, respectively. The profit margin at ONR was most frequently greater for the PL application timing than for the SP both in drained (2015, 2016, and 2018) and undrained soils (2015, 2016, 2017, and 2019) (Table 3). Grain yield and profit margin at MRTN [28] followed a similar trend. Averaged across years and fertilizer application timings, compared to undrained, drained soils produced USD 97 ha−1 greater profit margins at the ONR and USD 176 ha−1 at the MRTN (Table 3).
In drained soils, for PL there was a positive linear relationship between ONR and the amount of precipitation accumulated within 30 days of PL fertilizer application (Figure 4a), and for SP there was a negative linear relationship between ONR and the amount of GDD accumulated within 60 days of SP fertilizer application (Figure 4b). The ONR in undrained soils, however, was not closely related to either weather parameter, regardless of fertilizer application timing (Figure 4). There was also no relationship between grain yield at ONR and precipitation or GDD, regardless of drainage conditions and fertilizer application timing (data not shown).

3.4. Residual Soil Nitrogen

Averaged across the years and drainage conditions, 65% of the residual TINFall was NH4+-N and 35% was NO3-N (Supplemental Figure S3). Similarly, 59% of the residual TINNextSpring was NH4+-N and 41% was NO3-N. About 50% of the residual TINFall and TINNextSpring was in the top 0 to 30 cm, and the 30 to 60 and 60 to 90 cm depths contained approximately 25% each. These proportions were consistent across most years and drainage conditions (Supplemental Figure S3).
There was no drainage effect on residual TINFall in four of the six years (2014, 2017, 2018, and 2019) (Table 4). Averaged across the years and fertilizer application timings, there was a trend for greater residual TINFall in drained than in undrained soils (90 vs. 84 kg N ha−1). There was no significant effect of fertilizer application timing on residual TINFall except in 2016 in undrained soils, where the SP timing had residual TINFall 1.33 times greater than the PL (116 vs. 87 kg N ha−1) (Table 4). Averaged across the years and drainage conditions, residual TINFall for SP was 1.07 times greater than for PL (90 vs. 84 kg N ha−1). Most of the N rate treatments (including the PL-0 kg N ha−1) did not produce a significant difference in residual TINFall related to drainage condition (Supplemental Figure S2). Treatment differences for residual TINDiff (i.e., TINFall minus TINNextSpring) were similar to those observed for TINFall (Table 4). While only trends, drained soils had TINDiff 1.11 times greater than undrained (24.6 vs. 22.2 kg N ha−1), and the SP timing had TINDiff 1.17 times greater than the PL (25.2 vs. 21.5 kg N ha−1) (Table 4).
There was a positive exponential relationship between residual TINFall and dONR, with similar intercepts and slopes for the different combinations of drainage conditions and fertilizer application timings (Figure 5). Only the main effect for dONR was significant (y = e(4.48 + 0.0015x); p < 0.01). Residual TINNextSpring had a weak positive relationship with dONR, also only with a significant main effect for dONR (y = e(4.09 + 0.0007x); p < 0.01) (Figure 5).

3.5. In-Season Soil Nitrogen

Averaged across years and drainage conditions, 53% of the TINV6 was NH4+-N and 47% was NO3-N. The 0 to 30 cm depth had 65% of the TINV6 and the 30 to 60 cm depth had 35% (Supplemental Figure S4).
The in-season TINV6 measured at 0 to 60 cm soil depth resulted in negligible improvements for the predictions of grain yield compared with NO3-N measured at 0 to 30 cm (AIC, 103 vs. 104; RMSE, 1.7 vs. 1.7 Mg grain ha−1; and R2, 0.63 vs. 0.63) (data not shown). Because of that, further analyses were done only for NO3-N measured at 0 to 30 cm, hereafter referred to as soil N30V6. The drainage conditions affected the soil N30V6 only in 2018, with drained soils measuring 1.38 times more than undrained (11 vs. 8 kg NO3-N ha−1; averaged across the PL-0 and PL-135 kg N ha−1 treatments, the only treatments measured every growing season from 2014 to 2019) (Table 5).
The optimal soil N30V6 to reach grain yield at ONR ranged from 15 to 23 mg kg−1 in drained soils (average of 18 mg kg−1), and from 6 to 25 mg kg−1 in undrained soils (average of 16 mg kg−1) (Table 5). It is worth noting, however, that the estimates for the optimal soil N30V6 to reach grain yield at ONR in undrained soils are conservative, as grain yield was not maximized with the applied N rates during the 2017–2019 growing seasons.

4. Discussion

The lack of difference in grain yield due to drainage conditions in 2014 and 2016 (Figure 3) may be reflective of growing season conditions. The dry conditions during the summer in 2014 were likely more yield limiting than the drainage conditions (Figure 1). Others have also observed a lack of a grain yield response to artificial drainage with dry weather conditions [29]. In 2016, the even distribution of precipitation resulted in soil that was consistently moist (similar soil WFPS regardless of drainage) throughout the growing season (Figure 1). The combination of a warm and wet spring in 2018 likely compromised root development and increased the potential for denitrification losses in undrained soils, leading to the greatest grain yield response to artificial drainage of the six years (Figure 1, Figure 2 and Figure 3). These results agree with [30] who associated a grain yield response to artificial drainage with wet spring conditions.
While the results for individual years were weather-dependent, across the years the overall trend of 8% (0.9 Mg grain ha−1) grain yield improvement in drained soils highlights the value of artificial drainage in naturally poorly drained soils in the US Midwest. A similar long-term trend for greater grain yield in drained soils was observed by [31], who reported an average 7% grain yield improvement in drained soils (0.6 Mg grain ha−1) relative to undrained over a 10-year period. These values contrast the 1.9 Mg grain ha−1 grain yield improvements commonly reported by growers in south Minnesota due to artificial drainage (Carlson, 2020 personal communication).
Undrained soils produced more variability in grain yield than drained soils (Figure 3). Large within-field variation in grain yield and N requirement has long been documented in undrained soils [32] and is not only challenging in financial planning for farmers but also increases the risks of fertilizer misapplication and environmental degradation [33]. Compelling evidence that grain yield variability is related to soil moisture conditions was noted for 2016, when the WFPS was similar in drained and undrained soils and remained near or below FC during most of the growing season. The variability in grain yield was low and similar in both drainage conditions in this year (Figure 1 and Figure 3).
Grain yield at zero N is generally a robust indicator of mineralized soil N [34]. Compared to undrained soil, drainage enhanced the crop N uptake as was evident by greater grain yield and NUPGrain+Stover for the PL-0 kg N ha−1 treatment (Supplemental Figures S1 and S2). Related studies in this site showed more net N mineralization in the top 15 cm soil depth [9] but greater loss through denitrification in undrained than drained soils for the PL-0 kg N ha−1 treatment [8]. In addition, it is likely that compared to drained, the undrained soils had less N mineralization below the 15 cm depth and restricted root development, which reduced N uptake. This highlights the challenge to accurately estimate the season-long soil N supply and the related implications for crop model-based N recommendations that rely on these estimates to determine N fertilizer rates.
With the dry summer conditions of 2014, greater soil WFPS in undrained soils likely contributed to reduce the ONR relative to drained soils by promoting more mineralization of SOM and root development (Table 3; Figure 1). In fact, the N mineralization study conducted by [9] in this study site found that undrained soils mineralized 13 to 125 kg N ha−1 more than drained in 2014. These results indicate that artificial drainage may be disadvantageous for corn production in dry years like 2014. While this was beyond the objectives of this study, a potential solution would be to use controlled drainage systems to retain water in the soil profile during dry periods [35].
Nitrogen loss via denitrification increases with soil moisture, especially when soil WFPS is greater than FC [36]. The 2015, 2017, 2018, and 2019 growing seasons had periods between May and July that resulted in soil WFPS greater than FC in undrained soils (Figure 1). These wet soil conditions likely promoted denitrification losses that contributed to the linear grain yield response to N rate for the PL timing in undrained soils (Table 3). In fact, season-long N2O emissions measured at the study site in a related study showed episodic increases in N2O flux that were closely associated with increases in soil moisture, especially in undrained soils [8]. Denitrification losses were probably the largest in undrained soils in the June of 2018 when soil WFPS was continuously above FC and peaked at 82% (Figure 1). This could have resulted in substantial denitrification as shown by an incubation study where at 80% WFPS denitrification was 10 times larger than when WFPS was near FC [37]. Further evidence that soil N availability in undrained soils was reduced because of excess soil moisture is that drained soils, with a lower soil WFPS in those years (rarely exceeding FC), tended to produce lower ONR and greater grain yield than undrained soils (Table 3; Figure 1).
In 2016, soil WFPS was similar in drained and undrained soils and remained near FC during most of the growing season, which is optimal for mineralization of SOM [36]. This resulted in the lowest ONR of this study for the PL timing on both drainage conditions and similar profit margins in drained and undrained soils regardless of fertilizer application timing (Table 3). This indicates that corn production in undrained soils can be as profitable as in drained soils under favorable weather conditions.
Various US Midwest studies have indicated that excessive precipitation after PL fertilizer application enhances early season N loss, while lack of precipitation after SP makes N fertilizer positionally unavailable for crop uptake [38,39,40]. Similarly, weather conditions in this study affected crop response to N fertilizer application timing. Near normal precipitation during the spring in 2015, 2016, and 2017 tended to produce greater profit margins and lower ONR with the PL timing compared to the SP in drained soils (Table 3; Figure 2). The 2018 growing season had wet conditions after PL fertilizer application (207 mm of precipitation within 30 days) and dry conditions after SP (no considerable amount of precipitation for 11 days) (Figure 1). Greater grain yield and profit margins in drained soils with PL relative to SP in 2018, indicate that insufficient N supply during rapid crop N uptake was more influential than the N losses that potentially occurred early in the season with excessive precipitation. Only in 2019 was there greater grain yield and profit margin with the SP than the PL timing in drained soils. This is likely a result of the windstorm that caused disproportionately greater greensnap damage in PL subplots, where plants were taller in the PL than SP. Weather conditions in undrained soils had less effect on corn response to N application timing. Grain yield in undrained soils was not maximized in four of the six years for the PL treatments, regardless of the varying yearly weather conditions. For instance, grain yield was not maximized with the PL timing in 2018 under a warm and wet spring or in 2015 under season-long near normal precipitation. These findings suggest that undrained soils are inherently more prone to early-season denitrification losses, and SP timing may be more beneficial (Table 3; Figure 1 and Figure 2).
Though analysis of the individual year’s weather and crop performance may be useful to optimize management practices in retrospect, the accuracy of season-long weather forecasts is low, rarely exceeding 50% for three-month precipitation outlooks [41]. This uncertainty limits the ability of growers to preemptively adjust their management decisions to consistently maximize input efficiency in response to weather conditions. It follows that a more general probabilistic approach may be more practical. For drained soils, making an SP application with most of the N applied around V6 to V8 increased the ONR on average by 10.9% with a mere 0.7% improvement in profit margins relative to PL (Table 3). These results agree with [42], who reported that there is usually no benefit for SP fertilizer applications relative to a single PL in fine-textured soils in the US Midwest. In fact, the only year that the SP timing produced substantially greater profit margins than PL in drained soils was in 2019, when greensnap damage disproportionately affected the PL subplots. Conversely, for undrained soils, the SP timing decreased the ONR by 8.4% with a slight 1.6% reduction in profit margins relative to PL (Table 3; Figure 1). It is worth noting that the largest improvement in profit margins with PL relative to SP in undrained soils was in 2017, when there were excessive precipitation events soon after SP fertilizer application and WFPS was substantially above FC in undrained soils (Table 3; Figure 1). Nonetheless, SP fertilizer applications are overall better for undrained soils that are more likely to have early-season denitrification N loss. In fact, a related study conducted at the study area in 2014 and 2015 showed a 34% reduction in denitrification losses with the SP timing relative to the PL [8]. This difference in optimal timing for N fertilizer application represents an opportunity for precision agriculture technologies to target N applications within a field, based on soil drainage attributes.
Relative to undrained conditions, the overall lower ONR for drained soils (160 vs. 193 kg N ha−1) but similar grain yield at ONR (13.3 vs. 13.1 Mg grain ha−1) suggests that the grain yield loss in undrained soils was related to N deficiency (Table 3). While it is possible to maintain yield levels in undrained soils, regardless of the time of N application, undrained compared to drained soils reduced N use efficiency since the N rates were 24% greater for PL and 37% greater for SP. Using the Agricultural Production Systems Simulator (APSIM) model, similar findings were reported where drained soils lowered ONR and had a slight positive effect on grain yield relative to undrained soils [11].
The increase in fall residual TIN with N rate, especially above the ONR, is problematic as this N is lost by the following spring, which had no differences in residual TIN due to N rate (Figure 5). Other studies across the US Midwest have reported similar results [43,44]. These findings highlight that the overapplication of N fertilizer is a lose-lose situation as N above the ONR does not increase grain yield and promotes greater N losses.
While an absolute assessment of the effect of drainage conditions on environmental losses of N is complex, measurements like NUPGrain+Stover, GNR, ONR, and residual TIN allow relative comparisons to be made. A trend for lower ONR and greater NUPGrain+Stover and GNR in drained soils but similar residual TIN, regardless of drainage conditions, suggests lower environmental losses of N in drained than in undrained soils (Table 4; Figure 3). These results are unique because, to date, no long-term field study has been conducted to compare the potential environmental impacts of corn production in drained and undrained soils. While artificial drainage enhances NO3-N leaching [45,46], those losses are likely smaller than the denitrification losses that occur in undrained soils. It is also possible that greater soil N mineralization in drained soils decreases the N fertilizer requirement relative to undrained soils [11], since soil N mineralization, rather than N fertilizer or N rate, is the main source of N for crop uptake [47]. These findings highlight the potential benefits of artificial drainage to decrease the total amount of N losses compared with undrained systems. It is beyond the scope of this study to determine the sustainability of crop production under different drainage conditions, but while artificial drainage may increase downstream NO3-N losses, it also creates unique opportunities to reduce downstream losses via riparian buffers, bioreactors, etc. [11]. In contrast, N losses in undrained soils are less manageable as they are diffused across the entire field.
The effects of fertilizer application timing on the potential environmental losses of N were less evident. While the PL and SP timings did not produce different GNR, NUPGrain+Stover, or residual TIN within the drainage condition, the ONRs were largely affected (Table 3; Figure 3 and Figure 4). The ONR and environmental losses of N were lower with the PL timing compared to the SP in drained soils while the opposite occurred in undrained soils. These results, however, were weather dependent, especially for drained soils.
The negligible grain yield prediction improvement obtained with TINV6 measured at 0 to 60 cm soil depth compared with soil N30V6 was likely because NH4+-N was present in the soil at similar intensities at the different drainage conditions and N rate treatments (Supplemental Figure S4). The low utility of NH4+-N to improve grain yield predictions may also be because of competition with soil microbes that can assimilate NH4+-N more efficiently than plants [48]. Other studies conducted across the US Midwest have also reported no improvements in grain yield predictive power by including in-season NH4+-N [49,50]. In addition, including the 30 to 60 cm depth did not improve the predictive power for grain yield because soil N was consistently uniform across treatment variables.
Although undrained soils required more N fertilizer to obtain the ONR, similar soil N30V6 intensity and optimal soil N30V6 to reach grain yield at ONR, regardless of the drainage conditions (Table 5), highlight that regardless of total soil N, the NO3-N pool is small during active uptake by soil microbes and plants [48]. The fact that soil N30V6 is not a reliable predictor for season-long N availability or grain yield and subsequently N fertilizer requirement was further illustrated in 2018 where grain yield at ONR for drained soils was greatest but had the lowest critical soil N30V6 (Table 5).

5. Conclusions

Although artificial drainage has been linked to greater risk for nitrate leaching and surface water contamination, this study showed indirectly that drained soils may produce less total N loss to the environment than undrained soils. Overall, soil drainage improved N use efficiency, reduced the amount of N fertilizer needed, and increased grain yield relative to undrained soils, especially in wet and warm springs. Further, artificial drainage stabilized productivity by reducing the grain yield variation both within and across years, which is important for farmers’ risk management.
Soil N measurements are often used to determine N needs during the season or to assess the effectiveness of N management after the growing season. Neither approach showed value in this study as the drainage conditions and fertilizer application timing did not affect residual TINFall in most years and in-season soil N information had little utility to guide N fertilizer recommendations, regardless of drainage condition. However, weather and soil drainage conditions influenced the crop response to N fertilizer rate and application timing, indicating that drainage conditions need to be considered when making N management decisions.
Specific weather events after fertilizer application also influence outcomes but there is little that can be done to accurately forecast weather. Therefore, farmers should explore their options considering what the prevailing weather conditions are for their region. In the region of this study, overall, the PL timing produces lower ONR and greater profit margins than the SP in drained soils, but the SP timing is a better option in undrained soils since it produces lower ONR and maintains similar profit margins. This is because under the typical wet springs in the region, PL applications in undrained soils are more susceptible to waterlogged conditions and denitrification. Precision agriculture tools that allow for variable rate fertilizer application may be especially useful to guide SP fertilizer application in fields with poorly drained conditions, as variability in crop N requirement may increase considerably in those conditions.

Supplementary Materials

The following are available online at https://www.mdpi.com/article/10.3390/agronomy11122491/s1, Figure S1: Distribution of grain yield as related to nitrogen treatment for drained and undrained conditions for different years. The nitrogen treatments consist of nitrogen rate (from 0 to 224 kg N ha−1) and application timing (at planting (PL) or split (SP) 45 kg N ha−1 at planting and the remainder of the rate at V6 to V8 stage). Numbers inside the boxplots indicate the means. Black letters on top denote significant differences in grain yield (p < 0.1) between nitrogen treatments within drainage conditions. Colored letters in the bottom denote significant differences in grain yield (p < 0.1) between drainage conditions within nitrogen treatment. Figure S2: Grain and stover (all above ground vegetative tissues) nitrogen uptake, and residual total inorganic nitrogen (TIN [NO3-N plus NH4+-N]) measured from 0 to 90 cm soil depth during the fall as related to nitrogen fertilizer treatment and drained (D) and undrained (U) condition for the different years. The nitrogen treatments consist of nitrogen rates (from 0 to 224 kg N ha−1) and application timings (at planting (PL) or split (SP) 45 kg N ha−1 at planting and the remainder of the rate at V6 to V8 stage). Different letters indicate difference (p < 0.1) within groups and measurement. Figure S3: Postharvest soil nitrogen measured as nitrate or ammonium at the different soils depths in 30 cm increments as related to nitrogen fertilizer treatment and drained (D) and undrained (U) conditions for the different years. The nitrogen treatments consist of nitrogen rates (from 0 to 224 kg N ha−1) and application timing (at planting (PL) or split (SP) 45 kg N ha−1 at planting and the remainder of the rate at V6 to V8 stage). Different letters indicate difference (p < 0.1) within groups and measurement. Figure S4: In-season soil nitrogen measured as nitrate or ammonium at 0 to 60 cm soil depth as related to nitrogen fertilizer treatment and drained (D) and undrained (U) conditions in the different years. The nitrogen treatments consist of nitrogen rates (from 0 to 224 kg N ha−1) and applied at planting (PL). Different letters indicate difference (p < 0.1) within groups and measurement.

Author Contributions

Conceptualization, F.G.F. and S.L.N.; methodology, G.D.P., F.G.F. and S.L.N.; data analysis, G.D.P.; investigation, G.D.P., F.G.F. and S.L.N.; resources, G.D.P., F.G.F. and S.L.N.; data curation, G.D.P.; writing—original draft preparation, G.D.P.; writing—review and editing, G.D.P., F.G.F. and S.L.N.; visualization, G.D.P., F.G.F. and S.L.N.; supervision, F.G.F. and S.L.N.; project administration, F.G.F. and S.L.N.; funding acquisition, F.G.F. and S.L.N. All authors have read and agreed to the published version of the manuscript.

Funding

This research was funded by the Minnesota Soybean Research and Promotion Council, grant number CON000000072902.

Data Availability Statement

Data is available from the authors upon request.

Acknowledgments

We thank the University of Minnesota Field Crew personnel, Thor Sellie, Andrew Scobbie, Nicholas Severson, Darby Martin, and Erik Joerres for their support in field activities and sample collection and processing. We also thank Gary W. Oehlert from the University of Minnesota School of Statistics for assistance with data analysis.

Conflicts of Interest

The authors declare no conflict of interest. The funders had no role in the design of the study; in the collection, analyses, or interpretation of data; in the writing of the manuscript, or in the decision to publish the results.

References

  1. Beauchamp, K.H. A history of drainage and drainage methods. In Farm Drainage in the United States. History, Status, and Prospects; Miscellaneous Publication Number 1455; Pavelis, G.A., Ed.; Economic Research Service (DOA): Washington, DC, USA, 1987. [Google Scholar]
  2. Carlson, B.M. Defining programming directions and priorities with respect to water quality and row crop production. J. NACAA 2014, 7. Available online: https://www.nacaa.com/journal/4445b911-0870-4232-85b0-11a98f7fbf1d (accessed on 7 December 2021).
  3. Sutton, J.G. Drainage as an aid to increased food production. Agr. Eng. 1943, 24, 327–331. [Google Scholar]
  4. Mukhtar, S.; Baker, J.L.; Kanwar, R.S. Corn growth as affected by excess soil water. Trans. Am. Soc. Agric. Eng. 1990, 33, 437–442. [Google Scholar] [CrossRef] [Green Version]
  5. Geigenberger, P. Response of plant metabolism to too little oxygen. Curr. Opin. Plant Biol. 2003, 6, 247–256. [Google Scholar] [CrossRef]
  6. Kaur, G.; Singh, G.; Motavalli, P.P.; Nelson, K.A.; Orlowski, J.M.; Golden, B.R. Impacts and Management Strategies for Crop Production in Waterlogged or Flooded Soils: A Review. Agron. J. 2020, 112, 1475–1501. [Google Scholar] [CrossRef] [Green Version]
  7. Reddy, K.R.; Patrick, W.H.; Broadbent, F.E. Nitrogen transformations and loss in flooded soils and sediments. CRC Crit. Rev. Environ. Control. 1984, 13, 273–309. [Google Scholar] [CrossRef]
  8. Fernández, F.G.; Venterea, R.T.; Fabrizzi, K.P. Corn Nitrogen Management Influences Nitrous Oxide Emissions in Drained and Undrained Soils. J. Environ. Qual. 2016, 45, 1847–1855. [Google Scholar] [CrossRef]
  9. Fernandez, F.G.; Fabrizzi, K.P.; Naeve, S.L. Corn and Soybean’s Season-Long in-Situ Nitrogen Mineralization in Drained and Undrained Soils. Nutr. Cycl. Agroecosystems 2017, 107, 33–47. [Google Scholar] [CrossRef]
  10. Xiong, X.; Wilson, E.; Fernández, F.G. How Variable Is Nitrogen in Production Agriculture Fields? Crops Soils 2016, 49, 38–42. [Google Scholar] [CrossRef]
  11. Castellano, M.J.; Archontoulis, S.V.; Helmers, M.J.; Poffenbarger, H.J.; Six, J. Sustainable Intensification of Agricultural Drainage. Nat. Sustain. 2019, 2, 914–921. [Google Scholar] [CrossRef]
  12. Sawyer, J.; Nafziger, E.; Randall, G.; Bundy, L.; Rehm, G.; Joern, B. Concepts and Rationale for Regional Nitrogen Rate Guidelines for Corn; Iowa State University-University Extension: Ames, IA, USA, 2006; pp. 1–28. Available online: https://store.extension.iastate.edu/Product/Concepts-and-Rationale-for-Regional-Nitrogen-Rate-Guidelines-for-Corn-pdf (accessed on 7 December 2021).
  13. Magdoff, F.R. Understanding the Magdoff pre-sidedress nitrate test for corn. J. Prod. Agric. 1991, 4, 297–305. [Google Scholar] [CrossRef]
  14. Erisman, J.W.; Galloway, J.N.; Seitzinger, S.; Bleeker, A.; Dise, N.B.; Roxana Petrescu, A.M.; Leach, A.M.; de Vries, W. Consequences of Human Modification of the Global Nitrogen Cycle. Philos. Trans. R. Soc. B Biol. Sci. 2013, 368, 20130116. [Google Scholar] [CrossRef] [Green Version]
  15. Harding, K.J.; Snyder, P.K. Examining Future Changes in the Character of Central U.S. Warm-Season Precipitation Using Dynamical Downscaling. J. Geophys. Res. Atmospheres 2014, 119, 116–136. [Google Scholar] [CrossRef] [Green Version]
  16. NOAA. NOWData–NOAA Online Weather Data; National Weather Service Forecast Office (Twin Cities): Chanhassen, MN, USA, 2018. Available online: https://w2.weather.gov/climate/xmacis.php?wfo=mpx (accessed on 2 December 2020).
  17. Blake, G.R.; Hartge, K.H. Bulk density. In Methods of Soil Analysis, 2nd ed.; Part 1. Agronomy Monograph 9; Klute, A., Ed.; ASA and SSSA: Madison, WI, USA, 1986; pp. 363–375. [Google Scholar]
  18. Horneck, D.A.; Miller, R.O. Determination of total nitrogen in plant tissue. In Handbook of Reference Methods for Plant Analysis; Kalra, Y.P., Ed.; CRC Press: New York, USA, 1998; pp. 75–83. [Google Scholar]
  19. Mulvaney, R.L. Nitrogen: Inorganic forms. In Methods of Soil Analysis; Part 3. Chemical methods; SSSA Book Ser. 5; Sparks, D.L., Ed.; SSSA: Madison, WI, USA, 1996; pp. 1123–1200. [Google Scholar]
  20. Gelderman, R.H.; Beegle, D. Nitrate-nitrogen. In Recommended Chemical Soil Test Procedures for the North Central Region; North Central Reg. Publ. 221; Nathan, M.V., Gelderman, R., Eds.; University of Missouri: Columbia, MI, USA, 1998; pp. 5.1–5.4. [Google Scholar]
  21. R Core Team. R: A Language and Environment for STATISTICAL Computing; R Foundation for Statistical Computing: Vienna, Austria, 2020; Available online: https://www.R-project.org/ (accessed on 10 July 2021).
  22. Bates, D.; Maechler, M.; Bolker, B.; Walker, S. Lme4: Linear Mixed-Effects Models Using Eigen and S4. R Package Version 1.1-7. Available online: https://cran.r-project.org/web/packages/lme4/index.html (accessed on 10 July 2021).
  23. Russell, L. Emmeans: Estimated Marginal Means, Aka Least-Squares Means. R Package Version 1.5.2-1. 2020. Available online: https://CRAN.R-project.org/package=emmeans (accessed on 10 August 2021).
  24. Weisberg, S. Variable selection. In Applied Linear Regression, 4th ed.; Balding, D.J., Cressie, N.A.C., Fitzmaurice, G.M., Goldstein, H., Johnstone, I.M., Molenberghs, G., Scott, D.W., Smith, A.F.M., Tsay, R.S., Weisberg, S., Eds.; Wiley: Hoboken, NJ, USA, 2014. [Google Scholar]
  25. Box, G.E.P.; Cox, D.R. An analysis of transformations. J. R. Stat. Soc. 1964, 26, 211–252. [Google Scholar] [CrossRef]
  26. Paiao, G.D.; Fernández, F.G.; Spackman, J.A.; Kaiser, D.E.; Weisberg, S. Integrating canopy sensing and soil nitrogen for improved corn nitrogen management. Agron. J. 2021, 113, 1996–2005. [Google Scholar] [CrossRef]
  27. Fox, J.; Weisberg, S. An R Companion to Applied Regression, 3rd ed.; Sage: Thousand Oaks, CA, USA, 2019; Available online: https://socialsciences.mcmaster.ca/jfox/Books/Companion/ (accessed on 20 September 2021).
  28. Kaiser, D.; Fernandez, F.G.; Wilson, M.; Coulter, J.; Barber, B. Fertilizing Corn in Minnesota; University of Minnesota: St. Paul, MN, USA, 2020; Available online: https://extension.umn.edu/crop-specific-needs/fertilizing-corn-minnesota (accessed on 15 August 2021).
  29. Awale, R.; Chatterjee, A.; Kandel, H.; Ransom, J.K. Tile Drainage and Nitrogen Fertilizer Management Influences on Nitrogen Availability, Losses, and Crop Yields. Open J. Soil Sci. 2015, 5, 211–226. [Google Scholar] [CrossRef] [Green Version]
  30. Van Es, H.M.; Yang, C.L.; Geohring, L.D. Maize Nitrogen Response as Affected by Soil Type and Drainage Variability. Precis. Agric. 2005, 6, 281–295. [Google Scholar] [CrossRef]
  31. Kladivko, E.J.; Willoughby, G.L.; Santini, J.B. Corn Growth and Yield Response to Subsurface Drain Spacing on Clermont Silt Loam Soil. Agron. J. 2005, 97, 1419–1428. [Google Scholar] [CrossRef]
  32. Triplett, G.B., Jr.; Van Doren, D.M., Jr. Development of a drainage variable facility for soil and crop management studies on a lakebed clay soil. Ohio Agr. Res. Devel. Cent. Res. Circ. 1963, 117. Available online: https://core.ac.uk/download/pdf/159577945.pdf (accessed on 7 December 2021).
  33. Mamo, M.; Malzer, G.L.; Mulla, D.J.; Huggins, D.R.; Strock, J. Spatial and Temporal Variation in Economically Optimum Nitrogen Rate for Corn. Agron. J. 2003, 95, 958–964. [Google Scholar] [CrossRef] [Green Version]
  34. Cassman, K.G.; Walters, D.T.; Dobermann, A.R.; Walters, D.T. Agroecosystems, Nitrogen-Use Efficiency, and Nitrogen Management. Ambio 2002, 31, 132–140. [Google Scholar] [CrossRef] [PubMed]
  35. Ghane, E.; Fausey, N.R.; Shedekar, V.S.; Piepho, H.P.; Shang, Y.; Brown, L.C. Crop Yield Evaluation under Controlled Drainage in Ohio, United States. J. Soil Water Conserv. 2012, 67, 465–473. [Google Scholar] [CrossRef]
  36. Robertson, G.P.; Groffman, P.M. Nitrogen transformations. In Soil Microbiology, Ecology and Biochemistry, 4th ed.; Paul, E.A., Ed.; Academic Press: Burlington, MA, USA, 2015; pp. 421–446. [Google Scholar]
  37. Wu, D.; Cárdenas, L.M.; Calvet, S.; Brüggemann, N.; Loick, N.; Liu, S.; Bol, R. The Effect of Nitrification Inhibitor on N2O, NO and N2 Emissions under Different Soil Moisture Levels in a Permanent Grassland Soil. Soil Biol. Biochem. 2017, 113, 153–160. [Google Scholar] [CrossRef]
  38. Struffert, A.M.; Rubin, J.C.; Fernández, F.G.; Lamb, J.A. Nitrogen Management for Corn and Groundwater Quality in Upper Midwest Irrigated Sands. J. Environ. Qual. 2016, 45, 1557–1564. [Google Scholar] [CrossRef] [PubMed]
  39. Spackman, J.A.; Fernandez, F.G.; Coulter, J.A.; Kaiser, D.E.; Paiao, G. Soil Texture and Precipitation Influence Optimal Time of Nitrogen Fertilization for Corn. Agron. J. 2019, 111, 2018–2030. [Google Scholar] [CrossRef]
  40. Kitchen, N.R.; Shanahan, J.F.; Ransom, C.J.; Bandura, C.J.; Bean, G.M.; Camberato, J.J.; Carter, P.R.; Clark, J.D.; Ferguson, R.B.; Fernández, F.G. A Public–Industry Partnership for Enhancing Corn Nitrogen Research and Datasets: Project Description, Methodology, and Outcomes. Agron. J. 2017, 109, 2371–2388. [Google Scholar] [CrossRef] [Green Version]
  41. Kusunose, Y.; Mahmood, R. Imperfect Forecasts and Decision Making in Agriculture. Agric. Syst. 2016, 146, 103–110. [Google Scholar] [CrossRef] [Green Version]
  42. Clark, J.D.; Fernández, F.G.; Camberato, J.J.; Carter, P.R.; Ferguson, R.B.; Franzen, D.W.; Kitchen, N.R.; Laboski, C.A.M.; Nafziger, E.D.; Sawyer, J.E.; et al. Weather and Soil in the US Midwest Influence the Effectiveness of Single- and Split-Nitrogen Applications in Corn Production. Agron. J. 2020, 112, 5288–5299. [Google Scholar] [CrossRef]
  43. Hong, N.; Scharf, P.C.; Davis, J.G.; Kitchen, N.R.; Sudduth, K.A. Economically Optimal Nitrogen Rate Reduces Soil Residual Nitrate. J. Environ. Qual. 2007, 36, 354–362. [Google Scholar] [CrossRef] [Green Version]
  44. Laboski, C.A.M.; Bandura, C.; Camberato, J.J.; Carter, P.R.; Ferguson, R.B.; Fernández, F.G.; Franzen, D.W.; Kitchen, N.R.; Nafziger, E.D.; Sawyer, J.E.; et al. Is NUE a useful metric of sustainability? In Annual Meetings Abstracts; ASA, CSSA, and SSSA: Madison, WI, USA, 2019. [Google Scholar]
  45. Basu, N.B.; Thompson, S.E.; Rao, P.S.C. Hydrologic and Biogeochemical Functioning of Intensively Managed Catchments: A Synthesis of Top-down Analyses. Water Resour. Res. 2011, 47, 1–12. [Google Scholar] [CrossRef] [Green Version]
  46. Randall, G.W.; Huggins, D.R.; Russelle, M.P.; Fuchs, D.J.; Nelson, W.W.; Anderson, J.L. Nitrate Losses through Subsurface Tile Drainage in Conservation Reserve Program, Alfalfa, and Row Crop Systems. J. Environ. Qual. 1997, 26, 1240–1247. [Google Scholar] [CrossRef]
  47. Spackman, J.A. Fate of Pre-Plant and Split-Applied 15Nitrogen Enriched Urea in Corn. Doctoral Dissertation, University of Minnesota, St. Paul, MN, USA, August 2020. [Google Scholar]
  48. Robertson, G.P. Nitrogen use efficiency in row crop agriculture: Crop nitrogen use and soil nitrogen loss. In Ecology in Agriculture; Jackson, L.E., Ed.; Academic Press: New York, NY, USA, 1997; pp. 347–365. [Google Scholar]
  49. Binford, G.D.; Blackmer, A.M.; Cerrato, M.E. Relationships between Corn Yields and Soil Nitrate in Late Spring. Agron. J. 1992, 84, 53–59. [Google Scholar] [CrossRef]
  50. Spackman, J.A. Nitrogen Fertilizer Rate, Source, and Application Timing Effects on Soil Nitrogen and Corn Yield. Master’s Thesis, University of Minnesota, St. Paul, MN, USA, 2018. [Google Scholar]
Figure 1. Daily mean water filled pore space (WFPS) at 0–15 cm soil depth for drained and undrained soils, and cumulative daily precipitation (black bars) for the 2014 to 2019 growing seasons. Red dashed lines show the WFPS at field capacity. Nitrogen fertilizer applications are noted with dashed lines, green for at-planting (PL) and grey for the split (SP). Blue-shaded boxes represent the monthly departure from normal for average precipitation (mm).
Agronomy 11 02491 g001
Figure 2. Observed daily average soil temperature at 0–15 cm for drained and undrained soils, mean daily air temperature (°C), 30-yr normal daily mean air temperature (°C), and cumulative and 30-yr normal cumulative precipitation (mm) for the 2014 to 2019 growing seasons. Nitrogen fertilizer applications are noted with dashed lines, green for at-planting (PL) and grey for the split (SP). Red-shaded boxes represent the monthly departure from normal for air temperature (°C).
Agronomy 11 02491 g002
Figure 3. Distribution of grain yield, nitrogen uptake in the grain and stover (NUPGrain+Stover), and grain nitrogen recovery (GNR) in drained (D) and undrained (U) conditions averaged across nitrogen fertilizer rates (90, 135, 179, and 224 kg N ha−1) applied at planting (PL) or split applied (SP) (45 kg N ha−1 at planting and the remaining at V6 to V8) for different years and across years. Numbers inside the boxplots indicate the means for PL and SP within drainage condition and year. Numbers in the bottom indicate the overall mean for D and U within year. Lower case letters on top denote significant differences (p < 0.1) between application timing and drainage condition within year. Upper case letters in the bottom denote significant differences (p < 0.1) between drainage condition within year.
Agronomy 11 02491 g003
Figure 4. (a) Optimal nitrogen rate (ONR) for fertilizer applied entirely at planting (PL) (ONRPL) as related to cumulative precipitation (Ppt.) from the date of PL fertilizer application plus 30 days (Ppt.PL+30 days) from 2014 to 2019; and (b) ONR for fertilizer split applied (SP) 45 kg N ha−1 at planting and the remainder of the rate at V6 to V8 (ONRSP) as related to cumulative growing degree days (GDD) from the date of SP fertilizer application plus 60 days (GDDSP+60 days) from 2014 to 2019.
Agronomy 11 02491 g004
Figure 5. Residual total inorganic nitrogen (TIN (NO3-N plus NH4+-N)) measured from 0 to 90 cm soil depth in the fall or the next spring from 2014 to 2019, as related to nitrogen rate differential from ONR (dONR) in drained and undrained soils for the at-planting (PL) and split (SP) fertilizer application timings and mean regression equation. The regression equations for the different combinations of drainage conditions and fertilizer application timings are not statistically different from one another (p > 0.1).
Agronomy 11 02491 g005
Table 1. Selected mean soil chemical and physical properties 1 in the top 15 cm. Soil test values for individual years and drainage conditions are similar to the overall mean.
CECpHPKCaMgSO4-SOMSandSiltClayFC 2
(meq 100 g−1) (mg kg−1)(g kg−1)
216.12421535716239.349.5360290350302
1 For details on methodology, see [9]. 2 FC = soil moisture (v/v) at field capacity (0.33 bar).
Table 2. Corn hybrid, and dates for planting, harvest, fertilizer application and soil sampling from 2014 to 2019.
YearHybridPlantingHarvestFert. Application 1Soil Sampling
PLSPIn SeasonPostharvestNext Spring 2
2014DK 53-78 RIB24-May21-October22-May20-June20-June30-October30-April
2015DK 48-12 RIB4-May12-October30-April2-June9-June6-November4-May
2016DK 48-12 RIB16-May17-October6-May20-June20-June20-October8-May
2017P9929 AMXT12-May25-October26-May20-June20-June3-November21-May
2018P9929 AMXT17-May24-October21-May2-July25-June31-October31-May
2019P9929 AMXT16-May29-October31-May12-July1-July20-November13-May
1 Date of fertilizer application for at-planting (PL) and split (SP) N fertilizer treatments. 2 Soil samples to measure residual N collected in the spring of the following year.
Table 3. Estimated optimal nitrogen rate (ONR), grain yield at ONR and at maximum return to N (MRTN) (University guideline for N application), and profit margins as related to year, fertilizer application timing, and drainage conditions.
YearTiming 1ONRGrain Yield at ONRGrain Yield at MRTNMargin at ONR 2Margin at MRTN
kg N ha−1Mg grain ha−1USD ha−1
DUDUDUDUDU
2014PL16714311.811.711.611.81706171116941725
2015PL12122413.413.313.411.61997189119761694
2016PL10313613.614.013.314.02045207819612070
2017PL17422413.613.413.311.11982190719611615
2018PL22422414.912.813.010.82142181219131568
2019PL13422411.112.311.19.71625173416151395
2014SP----------
2015SP157179 313.613.113.511.31972187419671622
2016SP87179 313.514.212.313.82018204717792014
2017SP22422414.112.912.811.21992180318571606
2018SP19418714.313.213.612.72049188319831841
2019SP17617612.811.712.411.31830165717941622
1 At-planting (PL) fertilization was done within 14 days of planting and split (SP) fertilization was 45 kg N ha−1 at planting and the remainder at V6 to V8 development stage. 2 Profit margin at ONR is the income generated with the estimated yield (USD 157 Mg−1 grain) at ONR minus the cost of nitrogen (USD 0.88 kg−1 N) at ONR. Similar calculations were used for the MRTN rate (145 kg N ha−1). Profit margins for SP was reduced by USD 25 ha−1 to account for the additional cost to apply nitrogen in season. 3 Highest nitrogen rate applied for SP in 2015 and 2016.
Table 4. Residual total inorganic nitrogen (TIN (NO3-N plus NH4+-N)) measured from 0 to 90 cm soil depth in the fall (residual TINFall) and difference between residual TIN between fall and next spring (residual TINDiff) as related to year, drainage condition, and fertilizer application timing. Means followed by the same letter are not different (p < 0.1) within year and sampling time.
YearResidual TINFall (kg N ha−1)Residual TINDiff (kg N ha−1)
DrainedUndrainedDrainedUndrained
PL 1SP 2PLSPPLSPPLSP
201463a58a63a52a4a3a10a−10a
2015105ab110a74c79bc35a35a39a19a
201685b101ab87b116a23a18a13a40a
201789a98a86a95a13a19a2a21a
201888a81a82a93a28a37a32a44a
201999a98a90a93a23a27a36a49a
Mean88a91a80a88a21a23a22a27a
1 At-planting (PL) fertilizer application was done within 14 days of planting. 2 Split (SP) fertilizer applications were done by applying 45 kg N ha−1 at planting and the remainder of the rate at V6 to V8 development stage.
Table 5. In-season soil NO3-N intensity measured at 0 to 30 cm soil depth at the V6 corn development stage (soil N30V6) averaged across the PL-0 and PL-135 kg N ha−1 treatments (only treatments that were measured for N30V6 every growing season), and soil N concentrations at the ONR (optimal soil N30V6).
YearSoil N30V6 IntensityOptimal Soil N30V6
kg N ha−1mg kg−1
DrainedUndrainedDrainedUndrained
201428a 134a--
201556a59a--
201641a49a--
201737a30a23 (13.6) 225 (13.4)
201811a8b15 (14.9)6 (12.8)
201920a25a17 (11.1)18 (12.3)
Mean28a29a18 (13.2)16 (12.8)
1 Letters denote statistically different means within years. 2 Numbers in parenthesis indicate grain yield at ONR (Mg grain ha−1) for the PL timing.
Publisher’s Note: MDPI stays neutral with regard to jurisdictional claims in published maps and institutional affiliations.

