Simple Summary
The PAM50 risk of recurrence (ROR) score is predictive of the risk of distant recurrence and the benefits of adjuvant therapy in early breast cancer. The Prosigna assay utilizes RNA from tumor cells selected via macrodissection of formalin-fixed, paraffin-embedded (FFPE) tissue sections to measure the activity of the PAM50 genes. An alternative and widely used extraction method is RNA purification from fresh-frozen (FF) bulk tissue without enriching the tumor cellularity. However, the impact of the RNA preparation approach on ROR scores and subsequent treatment selection has not been systematically evaluated. We compared the different approaches and found high correlation between risk of recurrence scores estimated from macrodissected FFPE tissue and scores estimated from bulk FF tumor tissue. However, important discrepancies were revealed for luminal tumors, which may have consequences for treatment recommendations for these patients.
Abstract
The PAM50 gene expression subtypes and the associated risk of recurrence (ROR) score are used to predict the risk of recurrence and the benefits of adjuvant therapy in early-stage breast cancer. The Prosigna assay includes the PAM50 subtypes along with their clinicopathological features, and is approved for treatment recommendations for adjuvant hormonal therapy and chemotherapy in hormone-receptor-positive early breast cancer. The Prosigna test utilizes RNA extracted from macrodissected tumor cells obtained from formalin-fixed, paraffin-embedded (FFPE) tissue sections. However, RNA extracted from fresh-frozen (FF) bulk tissue without macrodissection is widely used for research purposes, and yields high-quality RNA for downstream analyses. To investigate the impact of the sample preparation approach on ROR scores, we analyzed 94 breast carcinomas included in an observational study that had available gene expression data from macrodissected FFPE tissue and FF bulk tumor tissue, along with the clinically approved Prosigna scores for the node-negative, hormone-receptor-positive, HER2-negative cases (n = 54). ROR scores were calculated in R; the resulting two sets of scores from FFPE and FF samples were compared, and treatment recommendations were evaluated. Overall, ROR scores calculated based on the macrodissected FFPE tissue were consistent with the Prosigna scores. However, analyses from bulk tissue yielded a higher proportion of cases classified as normal-like; these were samples with relatively low tumor cellularity, leading to lower ROR scores. When comparing ROR scores (low, intermediate, and high), discordant cases between the two preparation approaches were revealed among the luminal tumors; the recommended treatment would have changed in a minority of cases.
Keywords:
Prosigna; risk of recurrence score; PAM50; FFPE; macrodissection; bulk; fresh-frozen; breast cancer 1. Introduction
Molecular classification of breast cancer as a basis for more precise treatment is increasingly used in clinical practice. In early breast cancer, the FDA-approved and CE-marked Prosigna assay provides a risk of recurrence (ROR) score that predicts the prognosis for patients with hormone-receptor-positive, HER2-negative tumors. This score refines patient stratification for improved treatment decisions, leading to alleviation of chemotherapy for some patients [1,2,3,4]. Prosigna uses gene expression measurements of a panel of 50 genes (PAM50) [5,6] obtained from RNA extracted from formalin-fixed, paraffin-embedded (FFPE) tumor tissue.
Collection of FFPE tissue for molecular analysis is the standard procedure in clinical routine diagnostics. Even though the RNA often is highly fragmented, it has been shown for targeted gene panels that the data obtained from FFPE specimens are comparable with those obtained from fresh-frozen (FF) tissue [7]. However, with the increasing number of biomarkers and gene signatures in clinical use, high RNA quality for next-generation sequencing (NGS) purposes is warranted [8], but which can be difficult to obtain from FFPE tissue. For whole-exome sequencing, fresh-frozen tumor tissue is preferred.
Another critical aspect in molecular cancer diagnostics is tumor cellularity and the possible influence of normal cell infiltration. In NanoString’s pipeline for the Prosigna assay, macrodissection of the tumor area is performed on each preselected FFPE tissue section. A trained pathologist outlines the tumor area, avoiding pre-invasive foci and non-tumor tissue, before the macrodissected tumor tissue is collected and used for RNA extraction. In the case of extracting RNA from FF tissue, most protocols entail small biopsies obtained prior to routine pathological assessment, and without enrichment of tumor cells. It is therefore of interest to compare ROR scores obtained from FFPE vs. FF specimens with respect to tumor cellularity, and to evaluate their potential impact on treatment decisions.
The ROR score takes into consideration the correlation to four of the five molecular intrinsic subtypes: basal-like, HER2-enriched, luminal A, and luminal B. The fifth subtype—the normal-like—is characterized by low expression of proliferation-associated genes, along with a gene expression pattern reminiscent of normal epithelial cells [6,9]; it is still unclear as to what extent this represents a real tumor subtype, or merely the degree of infiltrating non-tumor cells.
In this study, we analyzed tumor tissue from 94 early breast cancer patients, and compared the ROR scores obtained from macrodissected FFPE tissue with the ROR scores obtained from fresh-frozen bulk tissue. In addition, the approved Prosigna scores were available for all patients, yielding a unique dataset for comparing differences in risk assessments. Overall, the concordance between scores from FFPE and FF tissue was high; however, higher normal cell infiltration in the fresh-frozen, non-macrodissected tissue may have implications for the ROR score.
2. Materials and Methods
2.1. Ethics Statement
Ethical approval (number 29668) was obtained from the Norwegian Regional Committee for Medical Research Ethics. Before participating in the study, we obtained a written informed consent form from all participants to collect and study molecular and clinical data.
2.2. Patient and Tumor Characteristics
Tumors from 94 patients were obtained from the Oslo2 breast cancer cohort [10], which was an observational study collecting material from breast cancer patients with primary operable disease from several hospitals in South-Eastern Norway between 2007 and 2019. Patients included in this study were diagnosed in 2015 and 2016. An overview of clinical characteristics is given in Table 1. A complete overview of the clinical annotation for all 94 patients is found in Table S1.

Table 1.
Clinical overview of all 94 samples, and the subset of 54 that were ER+HER2-pN0.
2.3. RNA Extraction and Gene Expression Analysis from FFPE Tissue
From FFPE tissue, RNA purification was performed using the Roche® FFPET RNA Isolation Kit, Roche-025 (NanoString Technologies, Seattle, WA, USA): 1–6 FFPE slides depending on the tumor area, (4–19 : 6 slides, 20–99 : 3 slides, and ≥100 : 1 slide). The recommended RNA input was 250 ng for the hybridizations on the nCounter Analysis System. Two assays were employed: first the Prosigna assay (reporting the final ROR and subtype of each sample, i.e., not the correlation to the subtypes), and second the PAM50 assay (reporting the raw gene expression counts for the 50 breast-cancer-related genes). The raw counts were then normalized using all housekeeping genes and, finally, log2-transformed. The normalized RNA-Seq data from the PAM50 genes can be found in Table S2.
2.4. RNA Extraction and Gene Expression Analysis from FF Tissue
RNA extraction from FF tissue and subsequent sequencing using Illumina NextSeq500 has previously been described in detail [11]. The raw counts were processed as described in [12], and the resulting FPKM (fragments per kilobase per million) gene expression values were log2-transformed prior to selecting the PAM50 genes for further analysis. Tumor vs. normal cell content in all FF tissue specimens used for RNA extraction was evaluated by a pathologist. The normalized log 2-transformed nCounter counts for the PAM50 genes can be found in Table S3.
2.5. Gene Centering and Subtype Classification
On gene expression data, we performed subtype classification as follows, separately for the FFPE and FF datasets: Expression values were first centered across all tumors for each gene. To account for the relatively higher number of ER-positive patients in our cohort (~80%) compared to the training dataset from Parker et al. [5] (60%), we first found the mean expression value for each gene among ER-positive and ER-negative tumors separately. The bimodal distribution of ERS1 gene expression was used to determine the ER status; then, a weighted average of the two means was found, with 60% weight on the ER-positive mean and 40% on the ER-negative mean. From the gene-centered dataset, we calculated the Pearson’s correlation of the expression vector to each of the five subtype centroids (including the normal-like centroid) for each sample, as described by Parker et al. We assigned a sample to the subtype with the highest Pearson’s correlation coefficient; all cases were given a subtype. For the Prosigna assay, it has previously been shown that only 46 of the original 50 genes are needed, excluding the genes BIRC5, CCNB1, GRB7, and MYBL2 [1]; we therefore also excluded these genes in the above subtype classification.
2.6. Proliferation Score
The proliferation score was calculated according to Wallden et al. [2], using the arithmetic mean of the expression of 18 proliferation genes: ANLN, CEP55, ORC6L, CCNE1, EXO1, PTTG1, CDC20, KIF2C, RRM2, CDC6, KNTC2, TYMS, CDCA1, MELK, UBE2C, CENPF, MKI67 and UBE2T.
2.7. Risk of Recurrence Score
The research-based ROR score, which incorporated correlation with the four main subtypes (excluding the normal-like subtype) as well as the proliferation score and tumor size, was calculated as follows [1]:
where Basal, HER2, LumA, and LumB denote the Pearson correlations to the respective subtypes, T represents the tumor size (T = 1 if tumor size > 2 cm, T = 0 otherwise), and prolif is the proliferation score, as described above. The score ranges from 0 to 100, where a high value means high risk. This continuous score can be categorized into three groups (low, intermediate, and high risk), with individual cutoffs depending on node status. If no nodes are involved, the cutoffs for low, intermediate, and high risk are 40 and 60; when 1–3 nodes are involved, the cutoffs are 15 and 40; and with 4 or more nodes involved, the tumor is automatically assigned to the high-risk category [1].
ROR = 54.7690·(−0.0067⋅Basal + 0.4317⋅HER2 − 0.3172⋅LumA
+ 0.4894⋅LumB + 0.1981⋅prolif + 0.1133⋅T + 0.8826)
2.8. Treatment Recommendation
A potential change in systemic treatment recommendation was independently evaluated by two oncologists, based on the Norwegian national guidelines, including use of the risk of recurrence score [13].
3. Results
The complete workflow of this study is presented in Figure 1. The output from the approved Prosigna test, based on the macrodissected FFPE tumor tissue, is termed Subtype-Prosigna and ROR-Prosigna; the research-based subtypes and risk scores calculated from the macrodissected FFPE tumor tissue are termed Subtype-Macro and ROR-Macro; and finally, the subtypes and scores calculated based on FF bulk tumor tissue are termed Subtype-Bulk and ROR-Bulk.
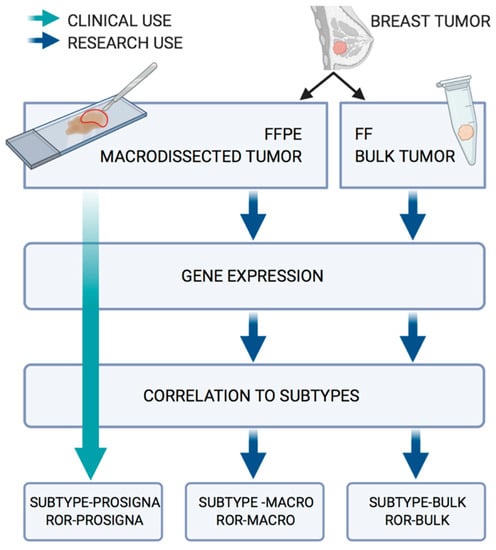
Figure 1.
Workflow for the analysis of the 94 paired FFPE/FF samples.
3.1. The Research-Based ROR-Macro Recapitulates the Approved ROR-Prosigna in FFPE Tumor Tissue
To assess our ability to classify breast tumors using the raw gene expression counts from the nCounter platform, we compared our calculated research-based subtypes (Subtype-Macro) to the approved subtypes from the Prosigna assay (Figure 2A and Table S4). There was a high degree of overlap in the subtype classification, with 80/94 (85%) concordant cases between the two approaches. Importantly, for each of the 14 tumors with a mismatch in subtype call, the second-highest subtype in the research-based Subtype-Macro was identical to Subtype-Prosigna (the subtypes called by the Prosigna algorithm) in all but one case (see Table S5 for details). For the discordant cases, the distance between the highest and second-highest correlations was relatively small (marked by black lines in Figure 2A). We also compared our subtyping approach to open-source PAM50 subtyping in the R/Bioconductor package genefu [14], and obtained a high level of concordance (Table S6). Most importantly, the risk scores ROR-Prosigna and ROR-Macro were highly correlated, with an r2 = 0.958 (Figure 2B). Overall, these results show that a research-based approach using the same gene expression counts is able to recapitulate the prognostic score from the Prosigna assay.
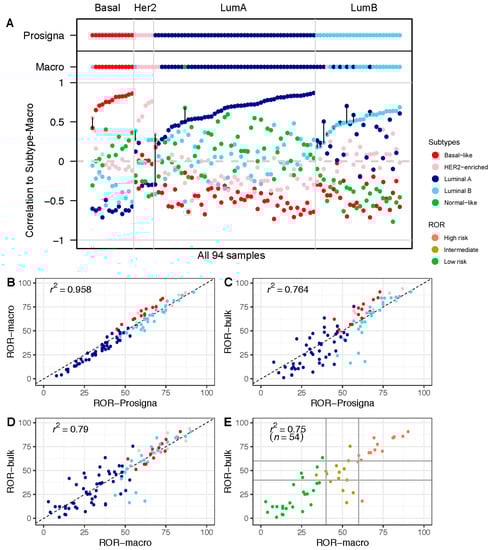
Figure 2.
Risk of Recurrence (ROR) in macrodissected FFPE vs. FF bulk tumor tissue: (A) Correlation to each of the five PAM50 subtype centroids calculated based on the research-based Subtype-Macro from FFPE tumor tissue. PAM50 subtype calls from Subtype-Prosigna and Subtype-Macro are shown on top for comparison. Correlation coefficients on the y-axis, and the 94 breast tumor samples along the x-axis, are sorted by increasing correlation with Subtype-Prosigna. Discordant cases between Subtype-Prosigna and Subtype-Macro are marked with black vertical lines. Samples are colored according to subtype (red = basal-like; pink = HER2-enriched; dark blue = luminal A; light blue = luminal B; green = normal-like). (B) ROR-Prosigna plotted against ROR-Macro for all 94 patients. (C) ROR-Prosigna plotted against ROR-Bulk for all 94 patients. (D) ROR-Macro plotted against ROR-Bulk for all 94 patients. (E) ROR-Macro plotted against ROR-Bulk for the subgroup of 54 node-negative, ER+, and HER2− breast tumors eligible for the Prosigna test. In panels (B–D), samples are color-coded by subtype according to Subtype-Prosigna, and in panel (E) by ROR-Prosigna (red = high risk; brown = intermediate risk; green = low risk). Horizontal and vertical lines indicate the clinically used thresholds for ROR.
3.2. Comparison of ROR Scores Obtained from Macrodissected FFPE and FF Bulk Tumor Tissue
In a similar approach using the RNA sequencing data from FF bulk tumor tissue, the risk score ROR-Bulk was calculated and compared with ROR-Prosigna (Figure 2C). The results show a wider spread and, thus, a smaller r2 = 0.764. We observed the largest differences in the middle range of the ROR scale, which was dominated by luminal tumors. The cause of this variation between the two approaches may be differences in the formulae (research-based versus Prosigna algorithm) and/or variation in the gene expression in the samples (macrodissected FFPE versus FF bulk tissue). As shown in Figure 2B, when only the formulae differed, a small subtype-specific variation was observed, wherein the basal-like tumors obtained slightly higher ROR scores with the research-based approach compared to ROR-Prosigna. This is not observed in Figure 2D, where only the research-based formula is used (Subtype-Macro versus Subtype-Bulk). Therefore, the observed variation between ROR-Bulk and ROR-Prosigna (Figure 2C) must also include differences in gene expression measured in macrodissected FFPE tumor tissue and in FF-bulk tumor tissue.
To investigate the potential impact of tissue selection and analytical formulae on treatment decisions, we focused on the subgroup of 54 node-negative patients eligible for the Prosigna test in the clinical routine, i.e., the patients with estrogen-receptor-positive (ER+), human epidermal growth factor receptor 2 (HER2)-negative disease. We adopted the clinical thresholds for the Prosigna test and divided the patients into three groups, labeled high, intermediate, or low risk. When comparing the results from ROR-Macro with those from ROR-Bulk for these three groups, 13/54 (24%) tumors were discordant in their risk group classification (Figure 2E; Table 2), with potential implications for adjuvant treatment decisions. The difference in absolute ROR scores in the 13 samples ranged from −25.7 to 44.06 units (with the mean absolute difference being 20.58). Including information from standard histopathological parameters, and using the prevailing national guidelines [13], the difference in ROR score classification would potentially change the systemic treatment recommendation in 6 out of 13 cases if ROR-Bulk were to be used—four escalated treatments and two de-escalated treatments (see Table 2 for more details). In two of these cases, escalation to chemotherapy was indicated. In seven cases with discrepant ROR score categories, adjuvant treatment recommendations remained unchanged.
Table 2.
ROR scores and corresponding categories for the 13 discordant cases between ROR-Macro and ROR-Bulk, ordered in rows according to the difference in risk score. Potential change of treatment recommendations within this ER+ HER2+ subpopulation is indicated in the systemic treatment recommendation column. Treatment is based on the Norwegian guidelines, including the use of the Prosigna test [13].
To understand the cause of the observed differences between the ROR measurements, we examined the different components of the risk calculations. When correlating the expression from macrodissected FFPE tumor tissue with the expression from FF bulk tumor tissue on a per-gene basis, we observed a high correlation for the majority of genes (Figure S1); all but 4 had a correlation higher than 0.75, including all 18 proliferation-associated genes (marked in orange). Genes coding for cytokeratins were among the least correlated genes when comparing their expression values from macrodissected FFPE tissue with their expression values from FF bulk tumor tissue.
3.3. Higher Proportion of the Normal-Like Subtype in Data from FF Bulk Tumor Tissue Impacts ROR Score
To further study the impact of the gene expression profiles obtained from bulk tissue, we compared the correlations with the centroids from bulk tumor tissue to the Prosigna subtypes (Figure 3A). A substantial proportion of cases in the bulk tumor data showed high correlation with the normal-like centroid, with 13 out of 94 tumors classified as normal-like (Table 3). We obtained similar results when using genefu to estimate the subtypes—11 out of the 94 bulk tumors were classified as normal-like (Table S7). In contrast, in the macrodissected FFPE tissue-derived data, only one sample was classified as normal-like (this same sample was classified as luminal A by the Prosigna test). We also performed an unsupervised principal component analysis (PCA) on both the FFPE- and FF-tumor-derived data. The normal-like tumors formed a separate cluster clearly separated from the other four subtypes (Figure S2).
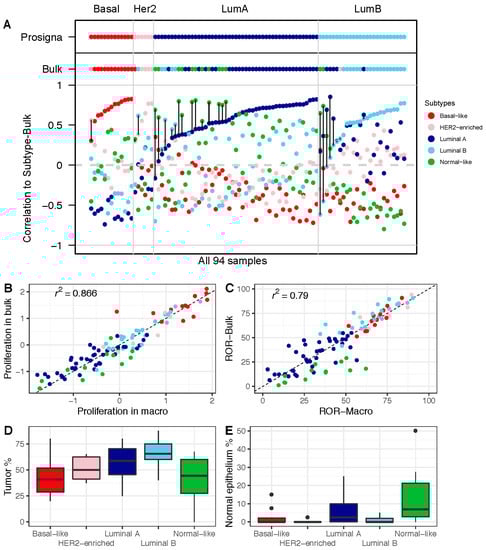
Figure 3.
Impact of gene expression in FF bulk tumor tissue on subtype calls and ROR: (A) Correlation with each of the five PAM50 subtype centroids, calculated based on the research-based Subtype-Bulk from FF tumor tissue. PAM50 calls from Subtype-Prosigna and Subtype-Bulk are shown on top for comparison. Correlation coefficients on the y-axis, and the 94 breast tumor samples along the x-axis, are sorted by increasing correlation with Subtype-Prosigna. Discordant cases between Subtype-Prosigna and Subtype-Bulk are marked with black vertical lines. Samples are colored according to subtype (red = basal-like; pink = HER2-enriched; dark blue = luminal A; light blue = luminal B; green = normal-like). (B) Proliferation score from macrodissected FFPE plotted against FF bulk tumor tissue. (C) ROR-Macro plotted against ROR-Bulk. (D) Boxplots showing estimated tumor content across subtypes. (E) Boxplots showing estimated normal breast epithelium across subtypes. In panels (B–E), all 94 samples are color-coded by subtype according to Subtype-Bulk.
Table 3.
Comparison of subtype calls using Subtype-Bulk and Subtype-Macro: subtypes based on gene expression obtained from fresh-frozen bulk tumor biopsies are shown in columns, and subtypes based on gene expression obtained from macrodissected FFPE sections are shown in rows.
Moreover, when comparing proliferation scores, we found the tumors of the normal-like subtype to have lower cell proliferation when using the data from FF bulk tumor tissue compared to macrodissected FFPE tissue (Figure 3B). This finding seems to be of particular clinical value, since we found the same trend when we compared ROR scores (Figure 3C). This is consistent with tumor and normal breast epithelial cellularity across the subtypes as determined by histopathological evaluation, highlighting the normal-like subtype as a subtype with a low tumor cell percentage (Figure 3D) and a high percentage of normal breast tumor epithelium (Figure 3E). Overall, this shows that the contribution of RNA from non-tumor breast cells has an impact on the ROR scores calculated from bulk tumor gene expression data.
4. Discussion
Genomic assays are increasingly used in clinical practice to assess the benefits of adjuvant chemotherapy. The Prosigna gene signature measures the expression of 50 genes in order to determine both the intrinsic subtypes and a risk score in early breast cancer, and is based on digital counts of RNA molecules in an assay optimized for FFPE tissue. In this study, we carried out a risk of recurrence analysis of a unique set of paired FFPE/FF samples from a set of 94 early breast carcinomas. From analysis of FFPE tumor tissue, the clinically approved Prosigna scores were available, serving as an important benchmark against which data from RNA sequencing of FF bulk tissue were compared. The research-based estimates of ROR-Macro were highly correlated with ROR-Prosigna. When comparing the ROR scores obtained from FFPE vs. FF tumor tissue (i.e., ROR-Macro vs. ROR-Bulk), we found discrepancies, but mostly for luminal tumors in the intermediate-risk range. For several patients, the disagreement was distinct, with potential impact on the use of systemic treatment. For the patients in this study, however, several of the discrepant scores would not have influenced treatment decisions, as these also depend on the complete clinicopathological information, as well as the judgement of the treating physician. In only 2 of the 54 node-negative cases would this discrepancy have potentially changed the use of chemotherapy. Although four cases of altered use of endocrine treatment were indicated, we realize that endocrine treatment may be offered to all ER+ breast cancer patients, irrespective of tumor size and biological characteristics. Nevertheless, the observed discrepancy in ROR scores between ROR-Macro and ROR-bulk should be noted; as of today, only macrodissected tissue input has sufficient documentation for clinical utility.
We observed a higher proportion of the normal-like subtype in the data obtained from FF bulk tissue compared to the FFPE tumor data (13 versus 1). These same tumors were associated with low tumor cellularity, which reduced the ROR estimates. In contrast, the normal-like subtype was practically absent in data obtained from macrodissected FFPE tumor tissue. The clinical implications (change in adjuvant treatment) for the increased proportion of the normal-like subtype for ROR-bulk in this study were probably diminished by a corresponding luminal A categorization by ROR-Macro in the majority of these cases, with endocrine treatment/no treatment decisions predominating in both groups. Due to the similarity to normal breast tissue, it has been debated whether the normal-like subtype is simply a result of RNA contributed by non-tumor cells [15,16]. A previous study showed that normal tissue, concurrently sampled with tumor tissue, is an important source of bias for the PAM50 signature [17]; with in silico contamination of normal tissue, the authors showed that tumors moved from being predicted as more aggressive subtypes to less aggressive subtypes. Nielsen et al. also noted biased subtype calls and a possible effect on ROR score when including non-tumor tissue [18]; however, this was less of a concern when including non-tumor tissue as part of the RNA extraction procedure and subsequent gene expression analysis, as would be the case in clinical practice. In addition, Guedj et al. showed that the rate of non-diploid cells varied among the molecular subtypes as estimated from SNP data, but that this was not a particular feature of the normal-like subtype [19]. As some tumors may have high lymphocyte infiltration, we investigated whether this could explain the discordance in ROR, but the variation in immune cell infiltration assessed by histopathological examination was not the reason for the discrepancy between ROR-Macro and ROR-Bulk (data not shown). Hence, this lends support to our assumption that the variation in prediction is due to tumor heterogeneity in the biopsies, but that the clinical implications are uncertain.
The limitations of tissue sampling in this study and the lack of repetitive sampling to properly assess reproducibility warrant further investigation. Nevertheless, the variation introduced by sampling different parts of the tumor should be random, and will therefore cause a small bias in both positive and negative directions in the ROR score. Within our analysis, two different technologies were used: RNA sequencing, and multiplexed digital counting. However, focusing specifically on the technical differences, we believe that they should not influence the correlation with the normal-like centroid. Picornell et al. reported a high concordance between the two platforms when comparing subtype calling [20]. Furthermore, Vallon-Christersson et al. compared stratification based on a wide range of gene signatures, using RNA sequencing profiles in a large population-based breast cancer cohort [21]; they found agreement between most signatures in the low- and high-risk groups for the ER+/HER− tumors, and less agreement within the intermediate-risk samples; this is consistent with our results, and stresses that there is a continuous need for improved risk predictors in this patient population.
5. Conclusions
In this study of 94 early-stage breast carcinomas, we observed a general agreement of r2 = 0.79 between ROR assessed from macrodissected FFPE tumor tissue and ROR from fresh-frozen bulk tumor tissue. Overall, we observed a higher proportion of the normal-like subtype using RNA extracted from bulk compared to macrodissected tissue. The normal-like tumors showed lower tumor cell content, yielding lower ROR scores, but with limited effect on the treatment decisions. In the subset of ER+HER2-pN0 disease (n = 54), treatment recommendation would potentially have changed for 11% of the patients, including both escalated and de-escalated treatment. Our study highlights the potential of using RNA sequencing from fresh-frozen bulk tissue in diagnostic assays, significantly increasing access to such clinical diagnostic assays. Attention should be paid, however, to tumor cellularity in the context of other clinical parameters that may influence treatment recommendations for particular breast cancer patients. Using FF tissue opens the way for high-quality whole-genome sequencing in clinical practice, including multiple diagnostic signatures and mutational calls, thereby significantly improving diagnostic yield by reflecting the whole molecular portrait of the tumor. As genomic predictors and targeted NGS assays increasingly become available, access to high-quality RNA and DNA provides a wide range of opportunities that may improve decision making in the future.
Supplementary Materials
The following are available online at https://www.mdpi.com/article/10.3390/cancers13236118/s1, Figure S1: Gene-wise correlation between FFPE and FF. Correlation of gene expression between FFPE and FF tissue for the PAM50 genes. For each of the PAM50 genes, we correlated the gene expression obtained from FFPE tissue with the gene expression obtained from FF tissue. Correlation coefficients are shown on the y-axis, and genes are ordered from low to high correlation along the x-axis. The 18 proliferation-associated genes are marked in orange, while all other genes are marked in green. Figure S2: Principal component analysis of gene expression data from FFPE and FF tumor tissue. The two first principal components are shown for the gene expression profiles. Tumor subtype and data type as indicated in the legend. Table S1: Clinical annotation for the 94 tumors included in the study. The columns represent sample ID, Subtype-Prosigna, ROR-Prosigna (continuous and categorical), tumor size, node degree (LN Status), ER, PGR, and HER2 from IHC (% positive cells), HER2 from FISH, tumor size (pT), grade, Ki67, and 6 histopathological quantifications (percentage of invasive tumor, in situ components, stroma, lymphocyte, adipose tissue, and normal breast epithelium), ROR-Macro calculations (subtype, risk; continuous and categorical), ROR-Bulk calculations (subtype, risk; continuous and categorical), and treatment recommendation. Table S2: Normalized log2-transformed FFPE tissue counts for the PAM50 genes. Table S3: Normalized RNA-Seq data from FF tissue for the PAM50 genes. Table S4: Comparison of subtype calls using Subtype-Prosigna and Subtype-Macro. Both methods used the counts from nCounter based on analysis of FFPE tissue. Subtype-Macro is in rows and Subtype-Prosigna is in columns. Table S5: ROR: subtype and correlation to the 5 gene expression centroids for the 14 discordant cases. The correlation values are from the Subtype-Macro algorithm based on the FFPE tumor tissue. Table S6: Comparison of subtype calls using Subtype-Macro and the genefu package. Both methods used the counts from nCounter based on analysis of FFPE tissue. Subtype-Macro is in rows and the genefu subtype is in columns. Table S7: Comparison of subtype calls in FFPE and FF tissue-derived data using genefu. Gene expression data from macrodissected FFPE tumor tissue are in rows and gene expression data from FF bulk tissue are in columns.
Author Contributions
Conceptualization, T.G.L., O.C.L., H.R., B.N. and T.S.; methodology, T.G.L., O.C.L. and T.S.; software, T.G.L.; validation, T.G.L., H.O.O., O.C.L., H.R., B.N. and T.S.; formal analysis, T.G.L.; investigation, T.G.L., H.O.O., Ø.G., E.B., J.V.-C., Å.B., H.R. and B.N.; resources, Å.B., B.N. and T.S.; data curation, M.A., M.A.T.S., J.V.-C., Å.B. and OSBREAC; writing—original draft preparation, T.G.L. and T.S.; writing—review and editing, all authors; visualization, T.G.L.; supervision, O.C.L., B.N. and T.S.; project administration, T.S.; funding acquisition, B.N., Å.B. and T.S. All authors have read and agreed to the published version of the manuscript.
Funding
This research was funded by grants from The Norwegian Cancer Society (420056) and South-Eastern Norway Regional Health Authority (2012071). Open-access funding was provided by Oslo University Hospital. RNA sequencing was performed in the SCAN-B laboratory at Lund University, supported by grants from the Mats Paulsson Foundation and the Berta Kamprad Foundation.
Institutional Review Board Statement
The 94 breast cancer cases included in this study are part of a larger study that has been approved by the Norwegian Regional Committee for Medical Research Ethics (approval number 29668, 29 June 2006). Patients gave written consent for the use of tumor material for research purposes. This study was conducted according to the guidelines of the Declaration of Helsinki.
Informed Consent Statement
Informed consent was obtained from all subjects involved in the study.
Data Availability Statement
R codes are available as Supplementary Materials. Normalized log2-transformed nCounter counts for the PAM50 genes can be found in Table S6. Normalized RNA-Seq data from the PAM50 genes can be found in Table S7. The raw genome-wide RNA-Seq data are available from EGA (accession number EGAS00001003631), and normalized genome-wide log2-transformed FPKM data are available from GEO (accession number GSE135298).
Acknowledgments
We thank Marie Fongaard and Eldri U. Due for processing tumor samples, Anne Marthe F. Wium for designing Figure 1, and Arne Pladsen for cross-checking the codes in R. Membership of the Oslo Breast Cancer Research Consortium (OSBREAC): Jürgen Geisler (Akershus University Hospital, Lørenskog, Norway), Solveig Hofvind (Cancer Registry of Norway, Oslo, Norway), Tone F. Bathen (Norwegian University of Science and Technology, Trondheim, Norway), Elin Borgen, Anne-Lise Børresen-Dale, Olav Engebråten, Øystein Garred, Gry Aarum Geitvik, Vessela N. Kristensen, Anita Langerød, Bjørn Naume, Gunhild M. Mælandsmo, Hege G. Russnes, Ellen Schlichting, Therese Sørlie (Oslo University Hospital, Oslo, Norway), Ole Christian Lingjærde (University of Oslo, Oslo, Norway), Kristine Kleivi Sahlberg, Helle K. Skjerven (Vestre Viken Hospital, Drammen, Norway), and Olaf-Johan Hartman-Johnsen (Østfold Hospital, Norway).
Conflicts of Interest
The authors declare no conflict of interest.
References
- Gnant, M.; Filipits, M.; Greil, R.; Stoeger, H.; Rudas, M.; Bago-Horvath, Z.; Mlineritsch, B.; Kwasny, W.; Knauer, M.; Singer, C.; et al. Predicting Distant Recurrence in Receptor-Positive Breast Cancer Patients with Limited Clinicopathological Risk: Using the PAM50 Risk of Recurrence Score in 1478 Postmenopausal Patients of the ABCSG-8 Trial Treated with Adjuvant Endocrine Therapy Alone. Ann. Oncol. 2014, 25, 339–345. [Google Scholar] [CrossRef] [PubMed]
- Wallden, B.; Storhoff, J.; Nielsen, T.; Dowidar, N.; Schaper, C.; Ferree, S.; Liu, S.; Leung, S.; Geiss, G.; Snider, J.; et al. Development and Verification of the PAM50-Based Prosigna Breast Cancer Gene Signature Assay. BMC Med. Genom. 2015, 8, 54. [Google Scholar] [CrossRef] [Green Version]
- Ohnstad, H.O.; Borgen, E.; Falk, R.S.; Lien, T.G.; Aaserud, M.; Sveli, M.A.T.; Kyte, J.A.; Kristensen, V.N.; Geitvik, G.A.; Schlichting, E.; et al. Prognostic Value of PAM50 and Risk of Recurrence Score in Patients with Early-Stage Breast Cancer with Long-Term Follow-Up. Breast Cancer Res. 2017, 19, 120. [Google Scholar] [CrossRef]
- Jensen, M.B.; Lænkholm, A.V.; Balslev, E.; Buckingham, W.; Ferree, S.; Glavicic, V.; Dupont Jensen, J.; Søegaard Knoop, A.; Mouridsen, H.T.; Nielsen, D.; et al. The Prosigna 50-Gene Profile and Responsiveness to Adjuvant Anthracycline-Based Chemotherapy in High-Risk Breast Cancer Patients. NPJ Breast Cancer 2020, 6, 7. [Google Scholar] [CrossRef] [Green Version]
- Parker, J.S.; Mullins, M.; Cheang, M.C.U.; Leung, S.; Voduc, D.; Vickery, T.; Davies, S.; Fauron, C.; He, X.; Hu, Z.; et al. Supervised Risk Predictor of Breast Cancer Based on Intrinsic Subtypes. J. Clin. Oncol. 2009, 27, 1160–1167. [Google Scholar] [CrossRef]
- Perou, C.M.; Sørile, T.; Eisen, M.B.; van De Rijn, M.; Jeffrey, S.S.; Ress, C.A.; Pollack, J.R.; Ross, D.T.; Johnsen, H.; Akslen, L.A.; et al. Molecular Portraits of Human Breast Tumours. Nature 2000, 406, 747–752. [Google Scholar] [CrossRef] [PubMed]
- Reis, P.P.; Waldron, L.; Goswami, R.S.; Xu, W.; Xuan, Y.; Perez-Ordonez, B.; Gullane, P.; Irish, J.; Jurisica, I.; Kamel-Reid, S. MRNA Transcript Quantification in Archival Samples Using Multiplexed, Color-Coded Probes. BMC Biotechnol. 2011, 11, 46. [Google Scholar] [CrossRef] [Green Version]
- Cieślik, M.; Chinnaiyan, A.M. Cancer Transcriptome Profiling at the Juncture of Clinical Translation. Nat. Rev. Genet. 2018, 19, 93–109. [Google Scholar] [CrossRef]
- Carey, L.A. Through a Glass Darkly: Advances in Understanding Breast Cancer Biology, 2000–2010. Clin. Breast Cancer 2010, 10, 188–195. [Google Scholar] [CrossRef]
- Aure, M.R.; Jernström, S.; Krohn, M.; Vollan, H.K.M.; Due, E.U.; Rødland, E.; Kåresen, R.; Ram, P.; Lu, Y.; Mills, G.B.; et al. Integrated Analysis Reveals MicroRNA Networks Coordinately Expressed with Key Proteins in Breast Cancer. Genome Med. 2015, 7, 21. [Google Scholar] [CrossRef] [PubMed] [Green Version]
- Tekpli, X.; Lien, T.; Røssevold, A.H.; Nebdal, D.; Borgen, E.; Ohnstad, H.O.; Kyte, J.A.; Vallon-Christersson, J.; Fongaard, M.; Due, E.U.; et al. An Independent Poor-Prognosis Subtype of Breast Cancer Defined by a Distinct Tumor Immune Microenvironment. Nat. Commun. 2019, 10, 5499. [Google Scholar] [CrossRef] [Green Version]
- Saal, L.H.; Vallon-Christersson, J.; Häkkinen, J.; Hegardt, C.; Grabau, D.; Winter, C.; Brueffer, C.; Tang, E.H.E.; Reuterswärd, C.; Schulz, R.; et al. The Sweden Cancerome Analysis Network—Breast (SCAN-B) Initiative: A Large-Scale Multicenter Infrastructure towards Implementation of Breast Cancer Genomic Analyses in the Clinical Routine. Genome Med. 2015, 7, 20. [Google Scholar] [CrossRef] [Green Version]
- Norsk Bryst Cancer Gruppe. Nasjonalt Handlingsprogram 15. Utgave. Available online: https://www.helsebiblioteket.no/retningslinjer/brystkreft/adjuvant-og-neoadjuvant-systemisk-behandling/oversikt-over-anbefalt-adjuvant-behandling (accessed on 28 December 2020).
- Gendoo, D.M.A.; Ratanasirigulchai, N.; Schroder, M.S.; Pare, L.; Parker, J.S.; Prat, A.; Haibe-Kains, B. Genefu: Computation of Gene Expression-Based Signatures in Breast Cancer. R Package Version 2.6.0. Available online: http://www.bioconductor.org/packages/devel/bioc/html/genefu.html (accessed on 30 October 2021).
- Prat, A.; Perou, C.M. Deconstructing the Molecular Portraits of Breast Cancer. Mol. Oncol. 2011, 5, 5–23. [Google Scholar] [CrossRef]
- Bastien, R.R.; Rodríguez-Lescure, Á.; Ebbert, M.T.; Prat, A.; Munárriz, B.; Rowe, L.; Miller, P.; Ruiz-Borrego, M.; Anderson, D.; Lyons, B.; et al. PAM50 Breast Cancer Subtyping by RT-qPCR and Concordance with Standard Clinical Molecular Markers. BMC Med. Genom. 2012, 5, 44. [Google Scholar] [CrossRef] [PubMed] [Green Version]
- Elloumi, F.; Hu, Z.; Li, Y.; Parker, J.S.; Gulley, M.L.; Amos, K.D.; Troester, M.A. Systematic Bias in Genomic Classification Due to Contaminating Non-Neoplastic Tissue in Breast Tumor Samples. BMC Med. Genom. 2011, 4, 54. [Google Scholar] [CrossRef] [Green Version]
- Nielsen, T.; Wallden, B.; Schaper, C.; Ferree, S.; Liu, S.; Gao, D.; Barry, G.; Dowidar, N.; Maysuria, M.; Storhoff, J. Analytical Validation of the PAM50-Based Prosigna Breast Cancer Prognostic Gene Signature Assay and NCounter Analysis System Using Formalin-Fixed Paraffin-Embedded Breast Tumor Specimens. BMC Cancer 2014, 14, 177. [Google Scholar] [CrossRef] [Green Version]
- Guedj, M.; Marisa, L.; De Reynies, A.; Orsetti, B.; Schiappa, R.; Bibeau, F.; MacGrogan, G.; Lerebours, F.; Finetti, P.; Longy, M.; et al. A Refined Molecular Taxonomy of Breast Cancer. Oncogene 2012, 31, 1196–1206. [Google Scholar] [CrossRef] [Green Version]
- Picornell, A.C.; Echavarria, I.; Alvarez, E.; López-Tarruella, S.; Jerez, Y.; Hoadley, K.; Parker, J.S.; Del Monte-Millán, M.; Ramos-Medina, R.; Gayarre, J.; et al. Breast Cancer PAM50 Signature: Correlation and Concordance between RNA-Seq and Digital Multiplexed Gene Expression Technologies in a Triple Negative Breast Cancer Series. BMC Genom. 2019, 20, 452. [Google Scholar] [CrossRef] [PubMed] [Green Version]
- Vallon-Christersson, J.; Häkkinen, J.; Hegardt, C.; Saal, L.H.; Larsson, C.; Ehinger, A.; Lindman, H.; Olofsson, H.; Sjöblom, T.; Wärnberg, F.; et al. Cross Comparison and Prognostic Assessment of Breast Cancer Multigene Signatures in a Large Population-Based Contemporary Clinical Series. Sci. Rep. 2019, 9, 12184. [Google Scholar] [CrossRef]
Publisher’s Note: MDPI stays neutral with regard to jurisdictional claims in published maps and institutional affiliations. |
© 2021 by the authors. Licensee MDPI, Basel, Switzerland. This article is an open access article distributed under the terms and conditions of the Creative Commons Attribution (CC BY) license (https://creativecommons.org/licenses/by/4.0/).