
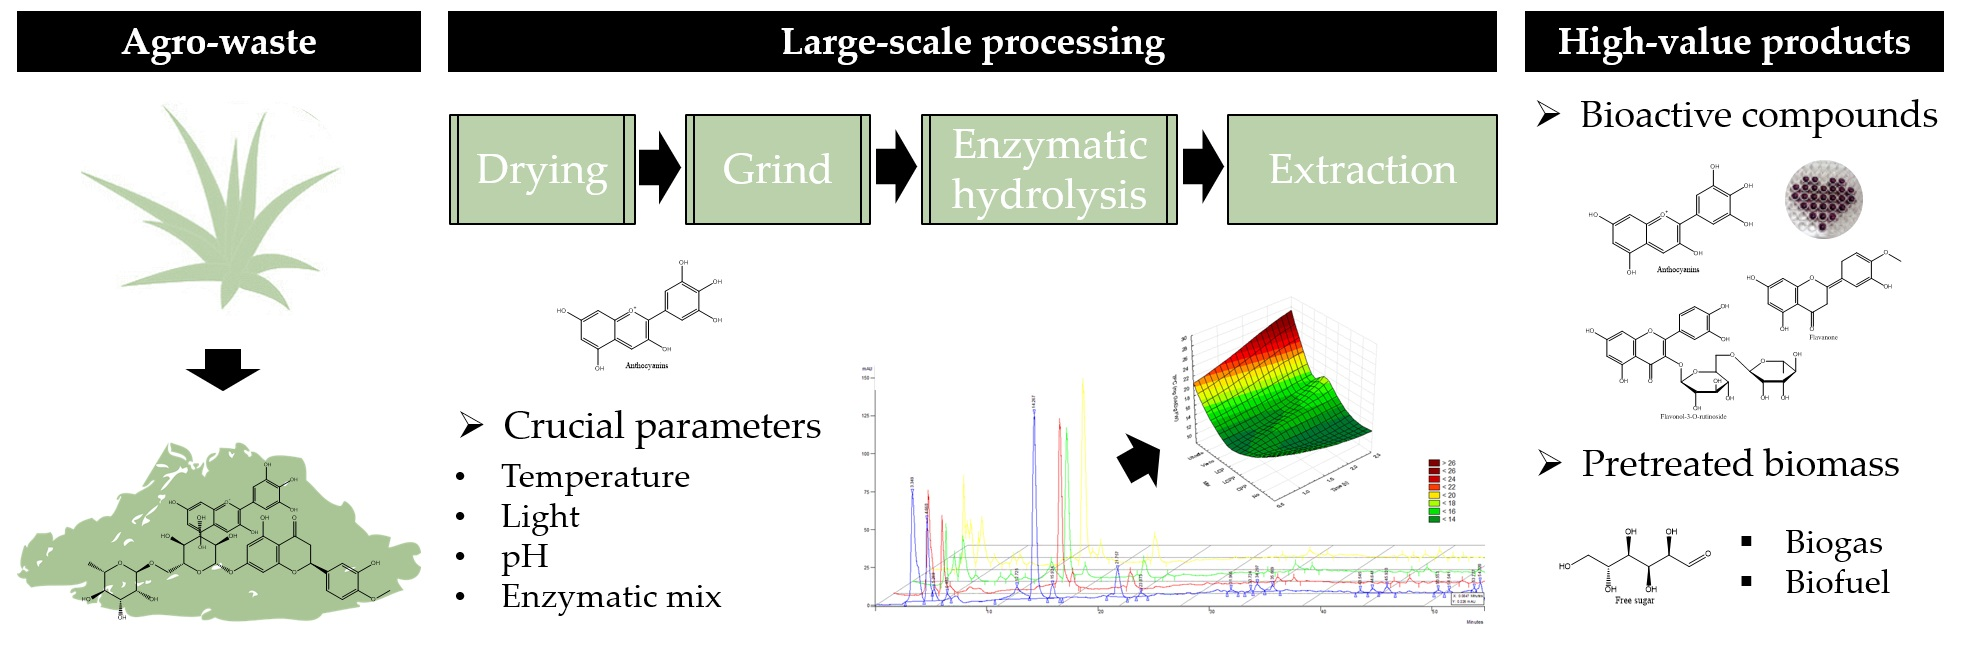
Early Optimization Stages of Agave lechuguilla Bagasse Processing toward Biorefinement: Drying Procedure and Enzymatic Hydrolysis for Flavonoid Extraction

 ,
,  , , ,
, , , 
 and
and
Abstract
:
1. Introduction
2. Results
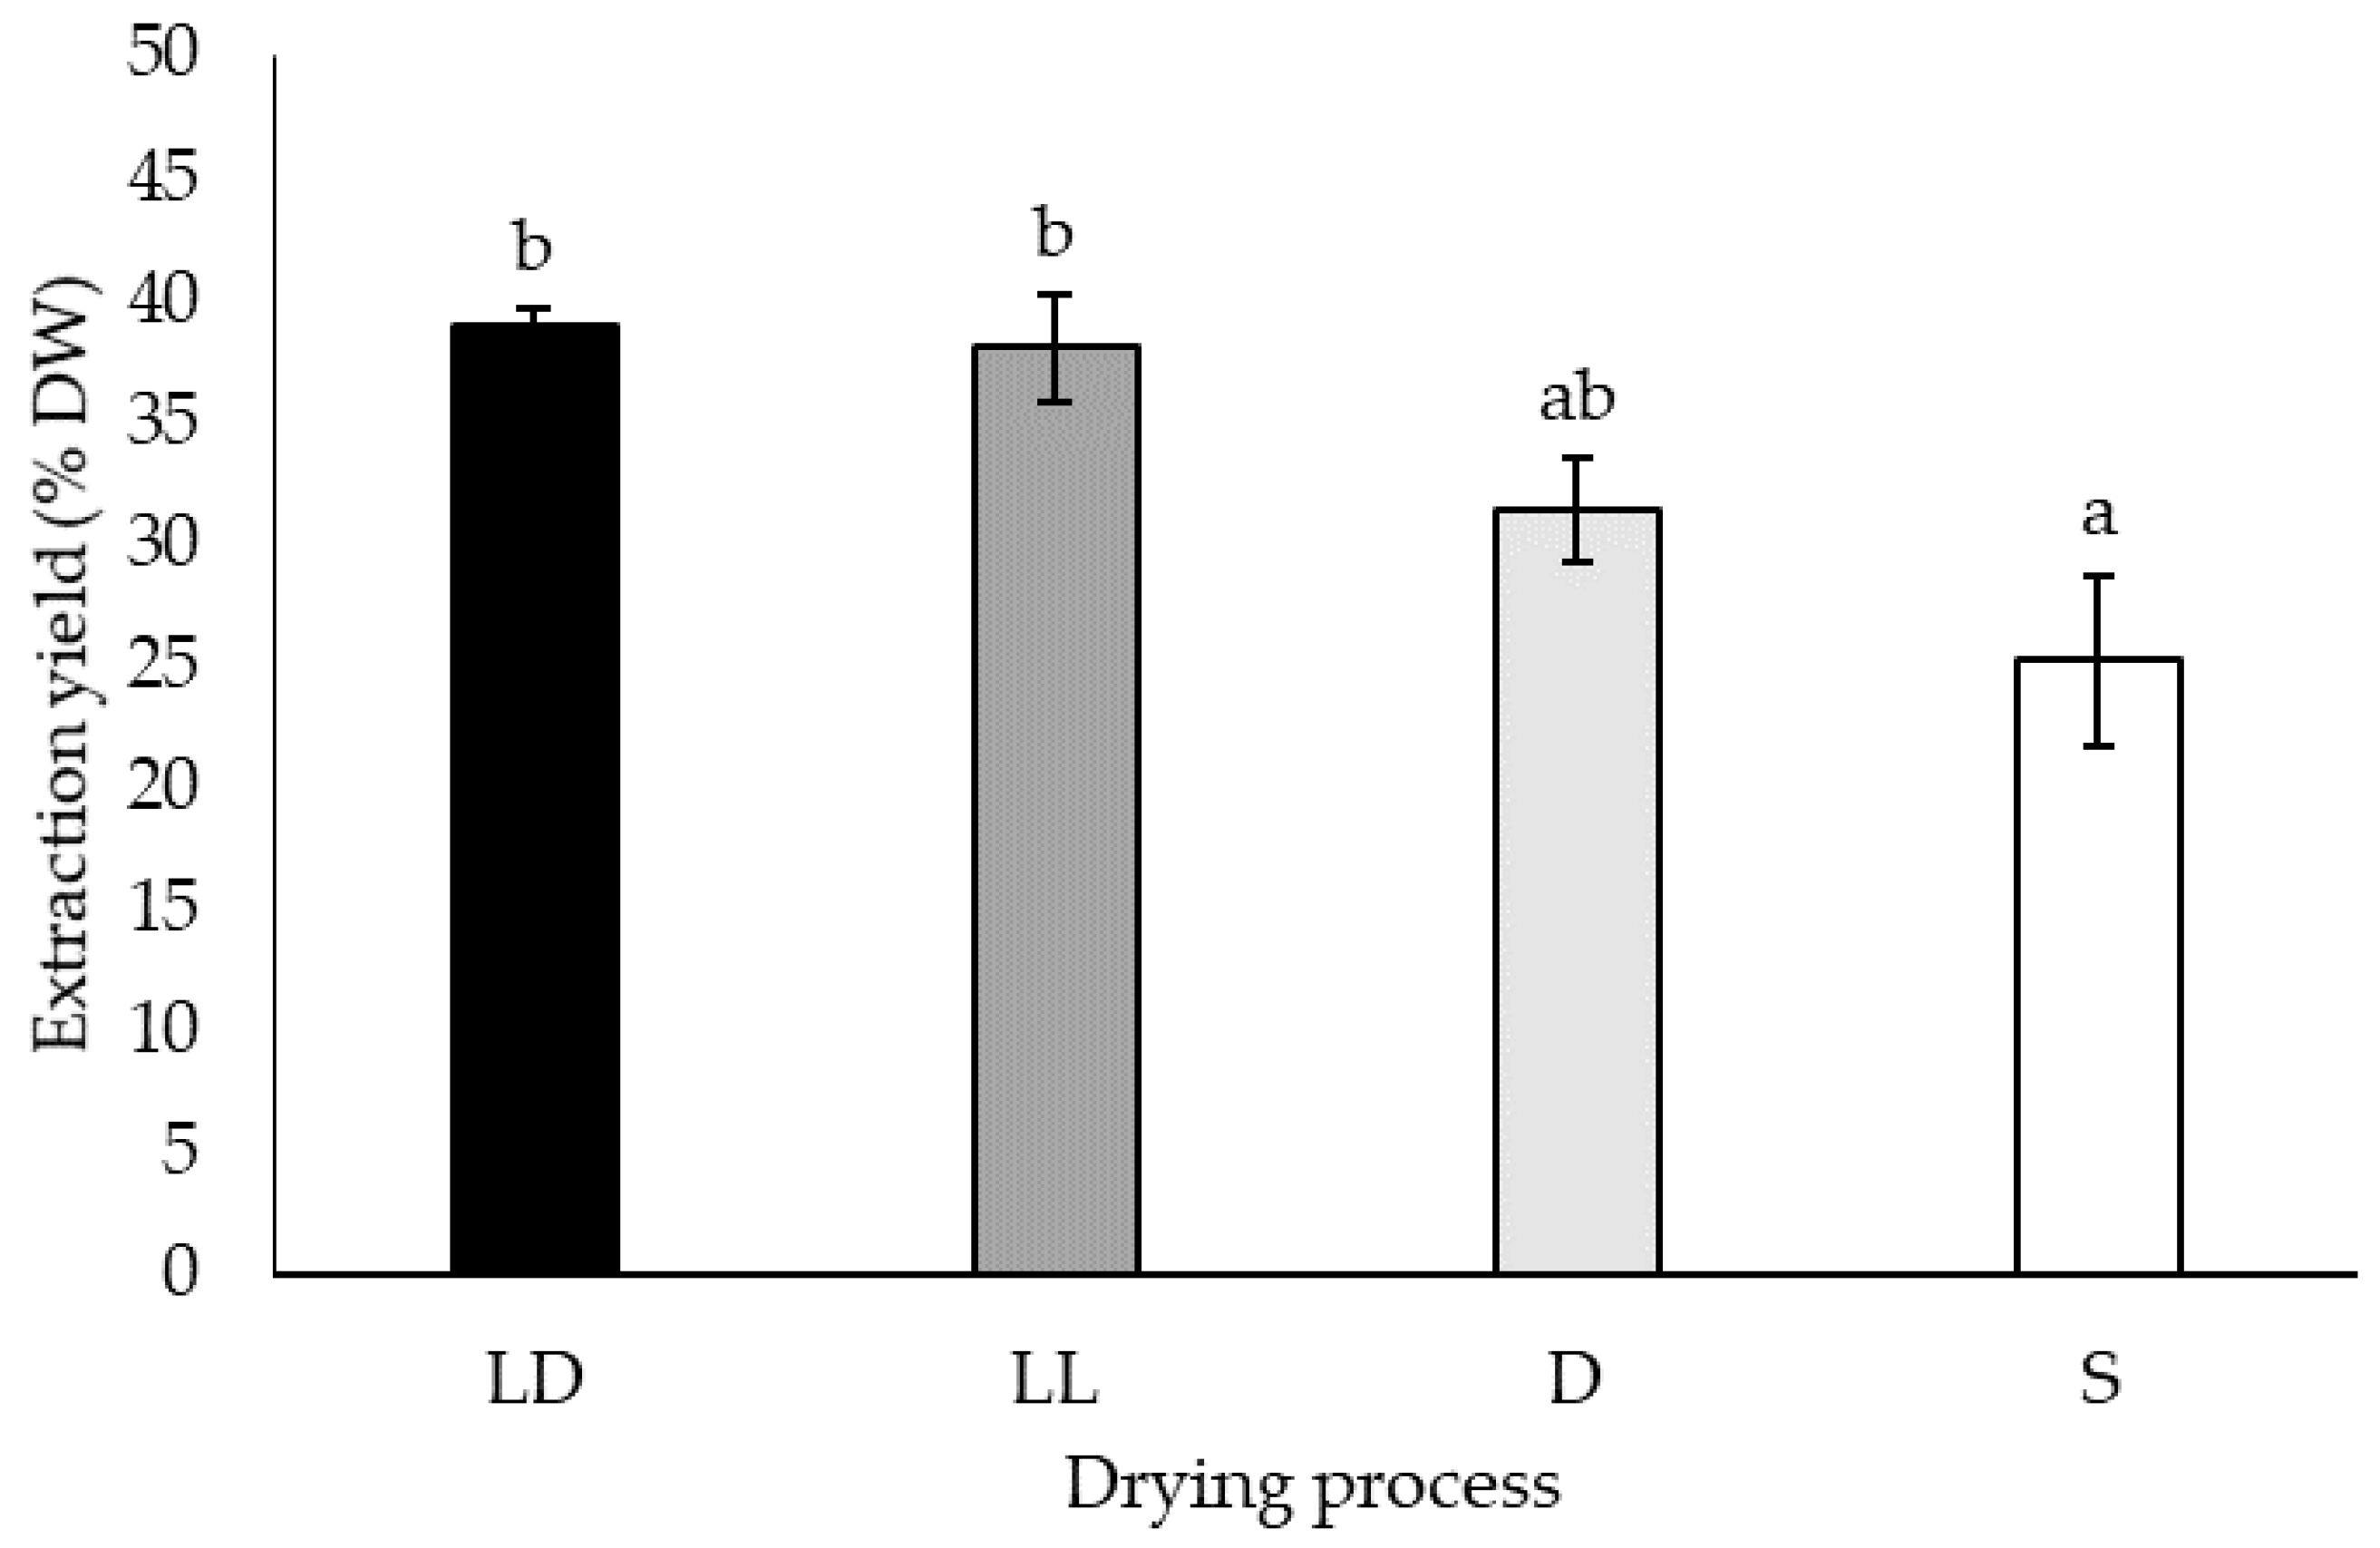
2.1. Drying Process
2.1.1. Extraction Yields
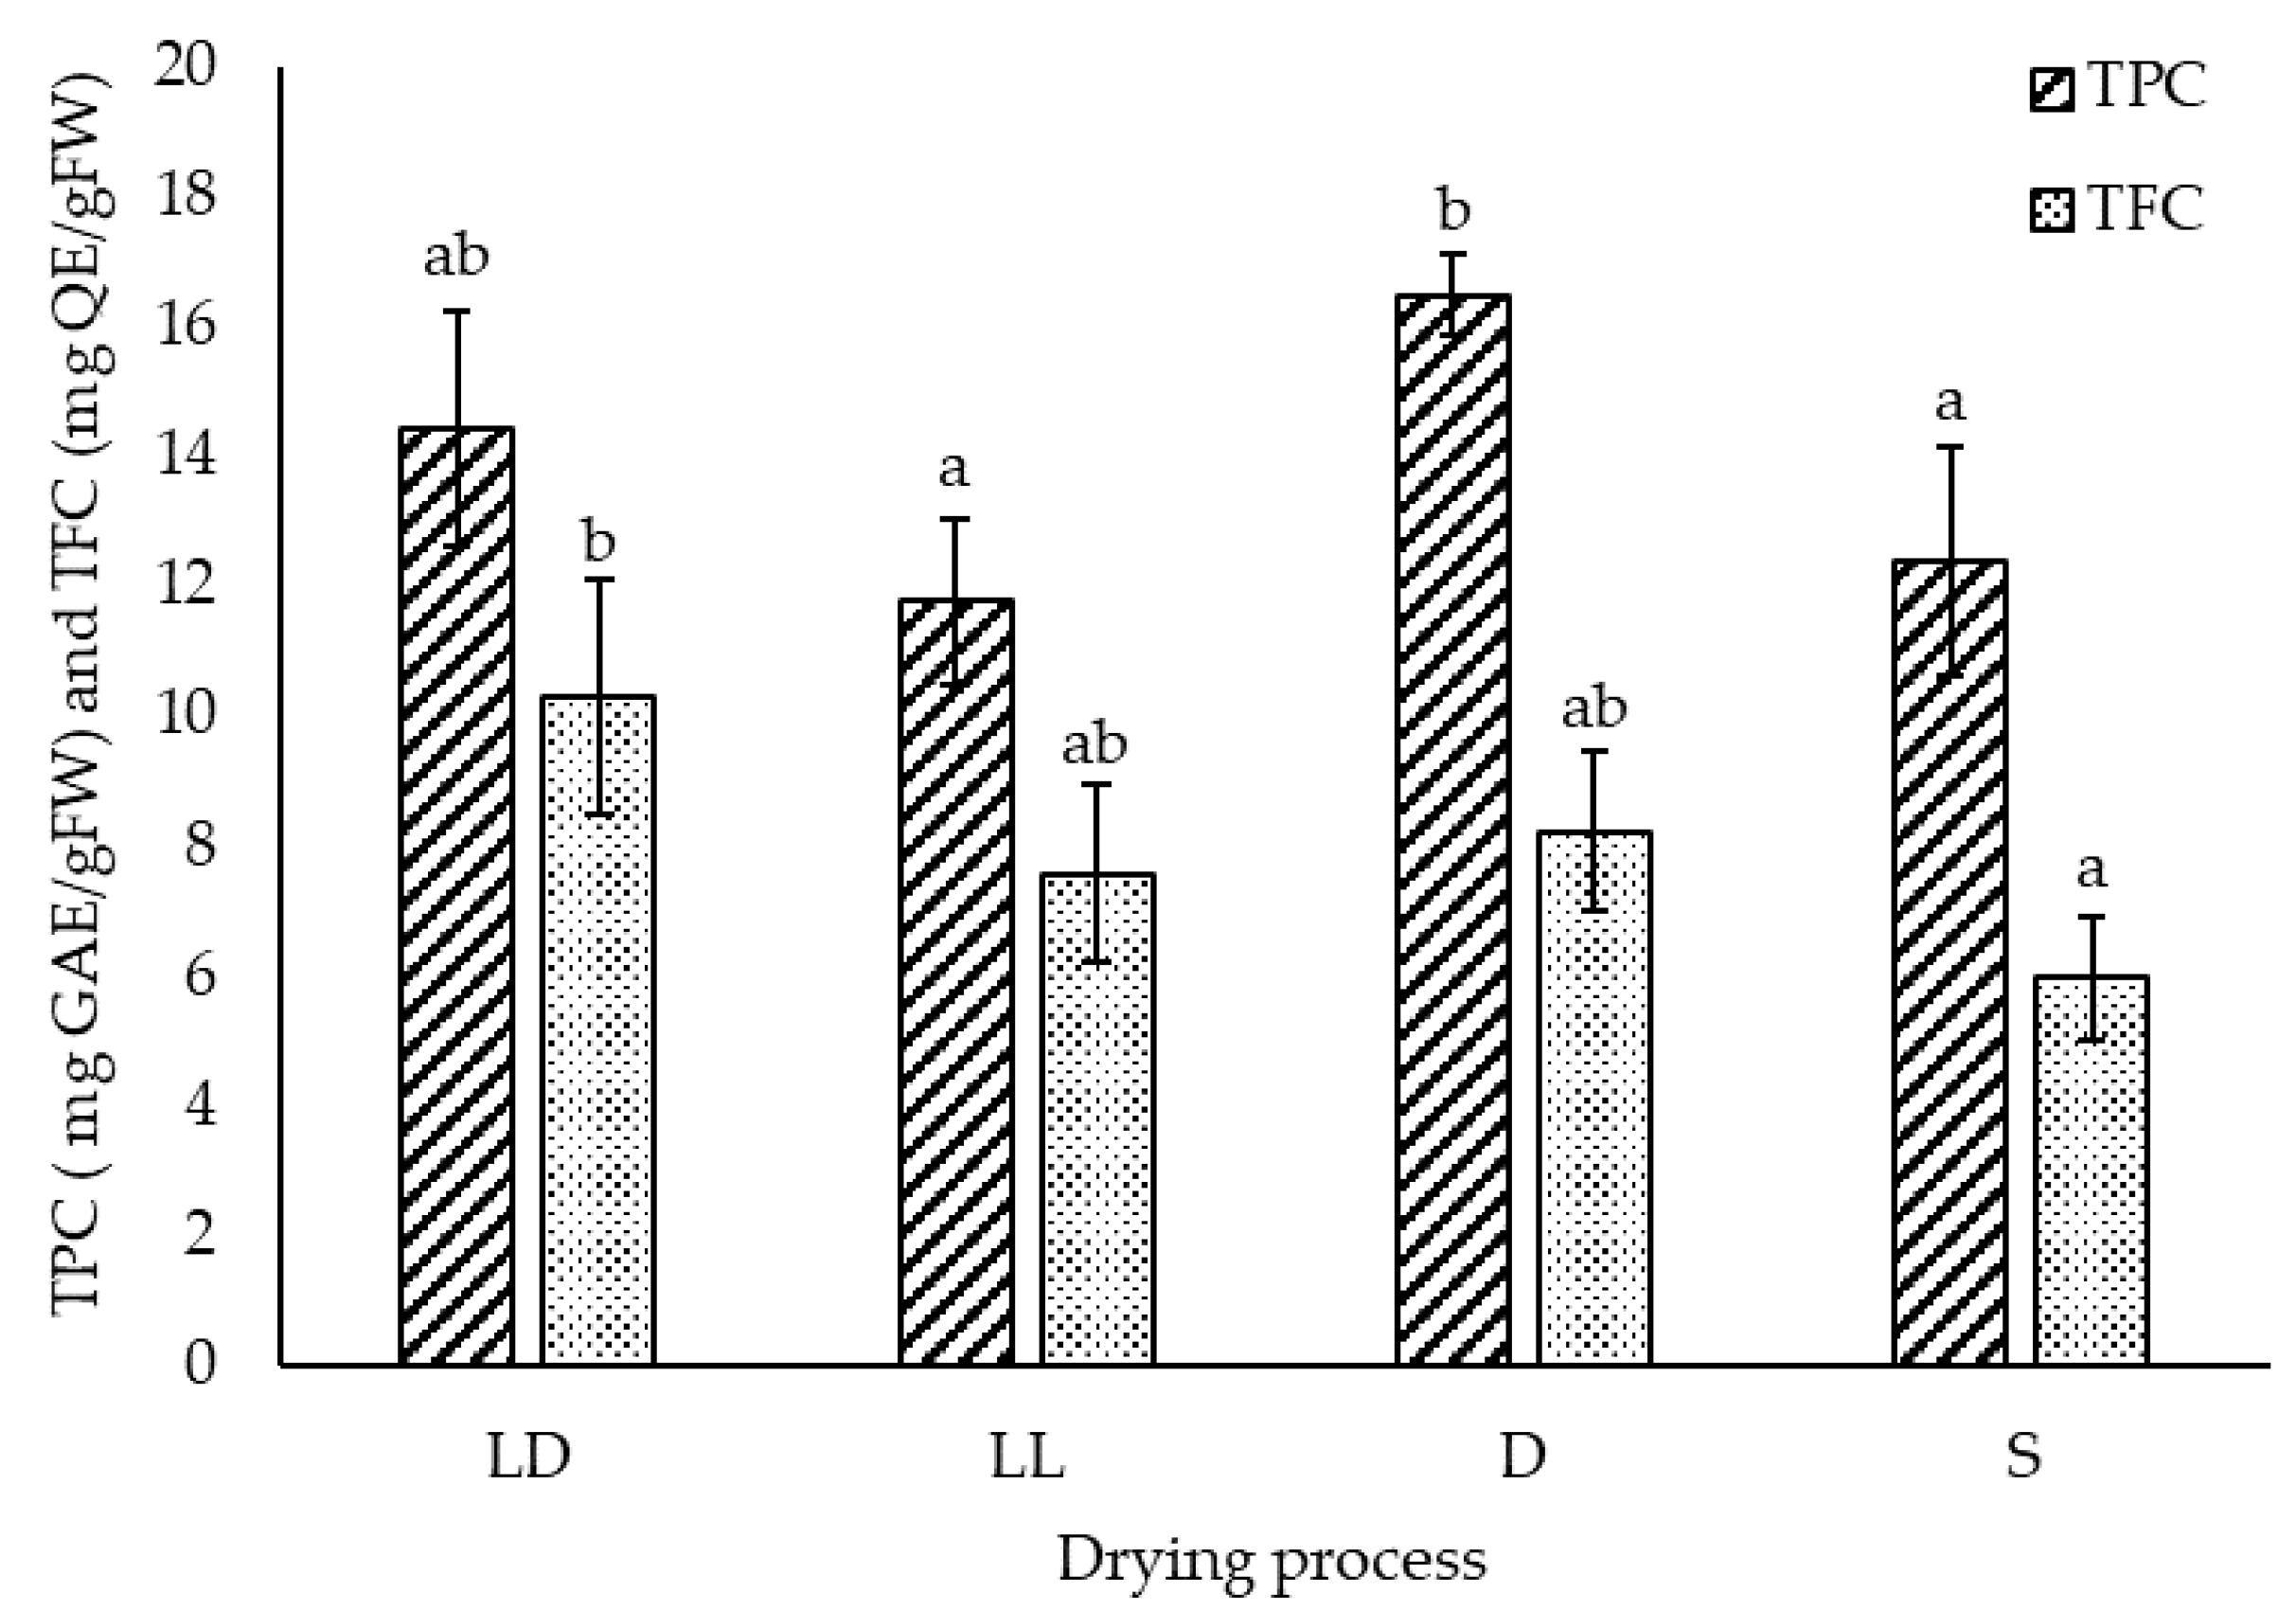
2.1.2. Total Phenolic and Flavonoid Content
2.1.3. Specific Flavonoid Profiles
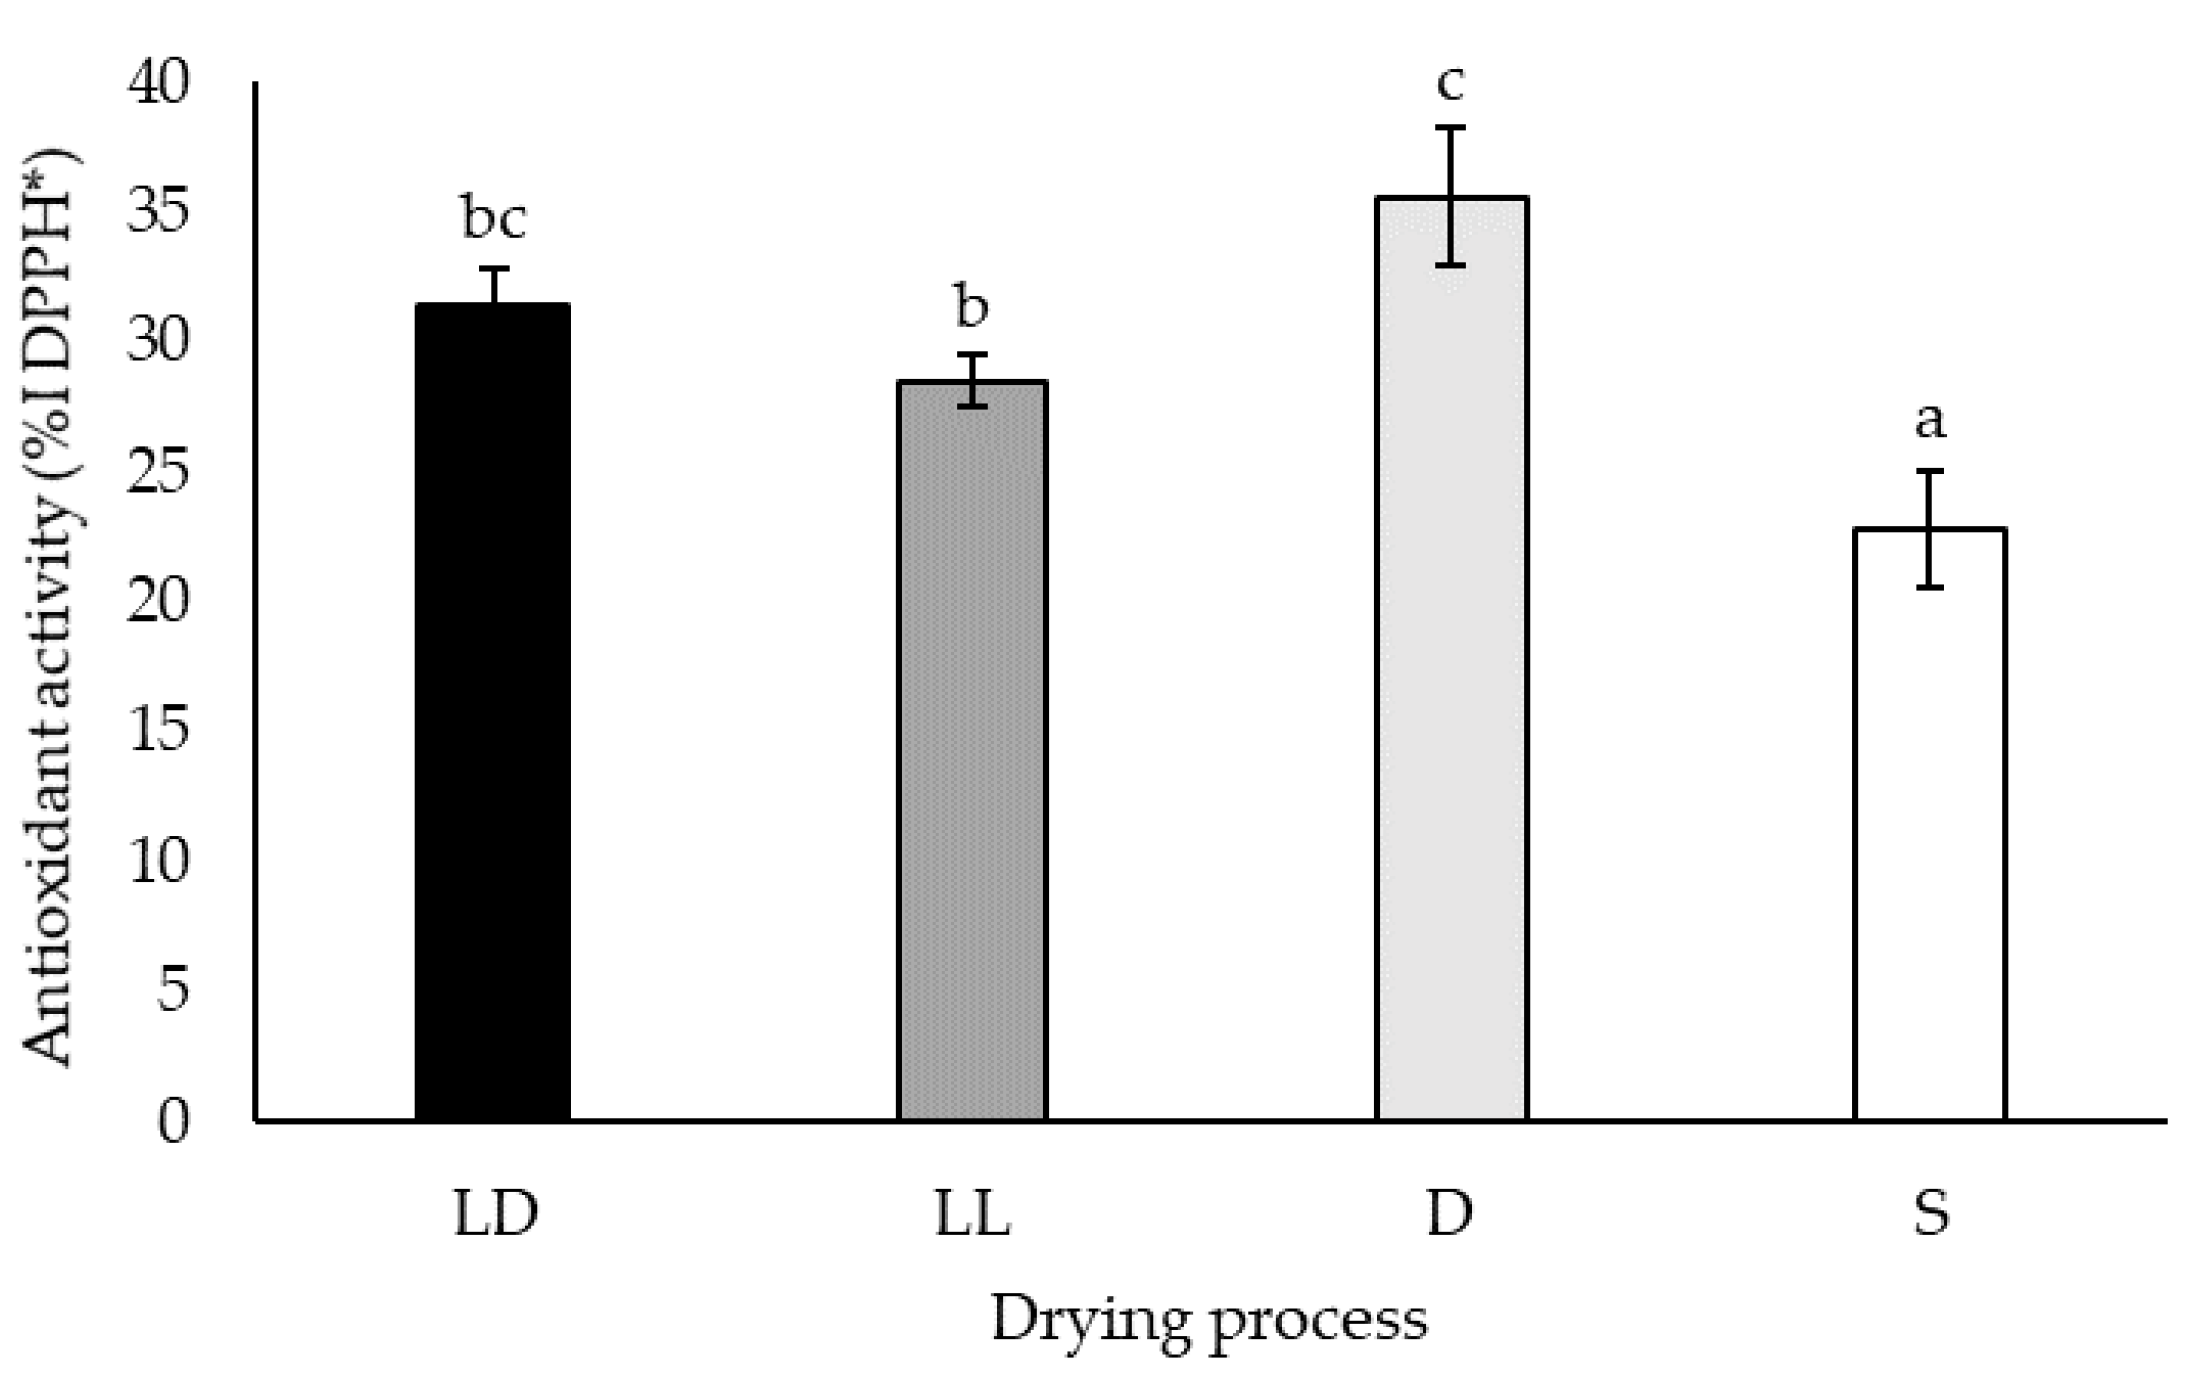
2.1.4. Free-Radical Scavenging Capacity
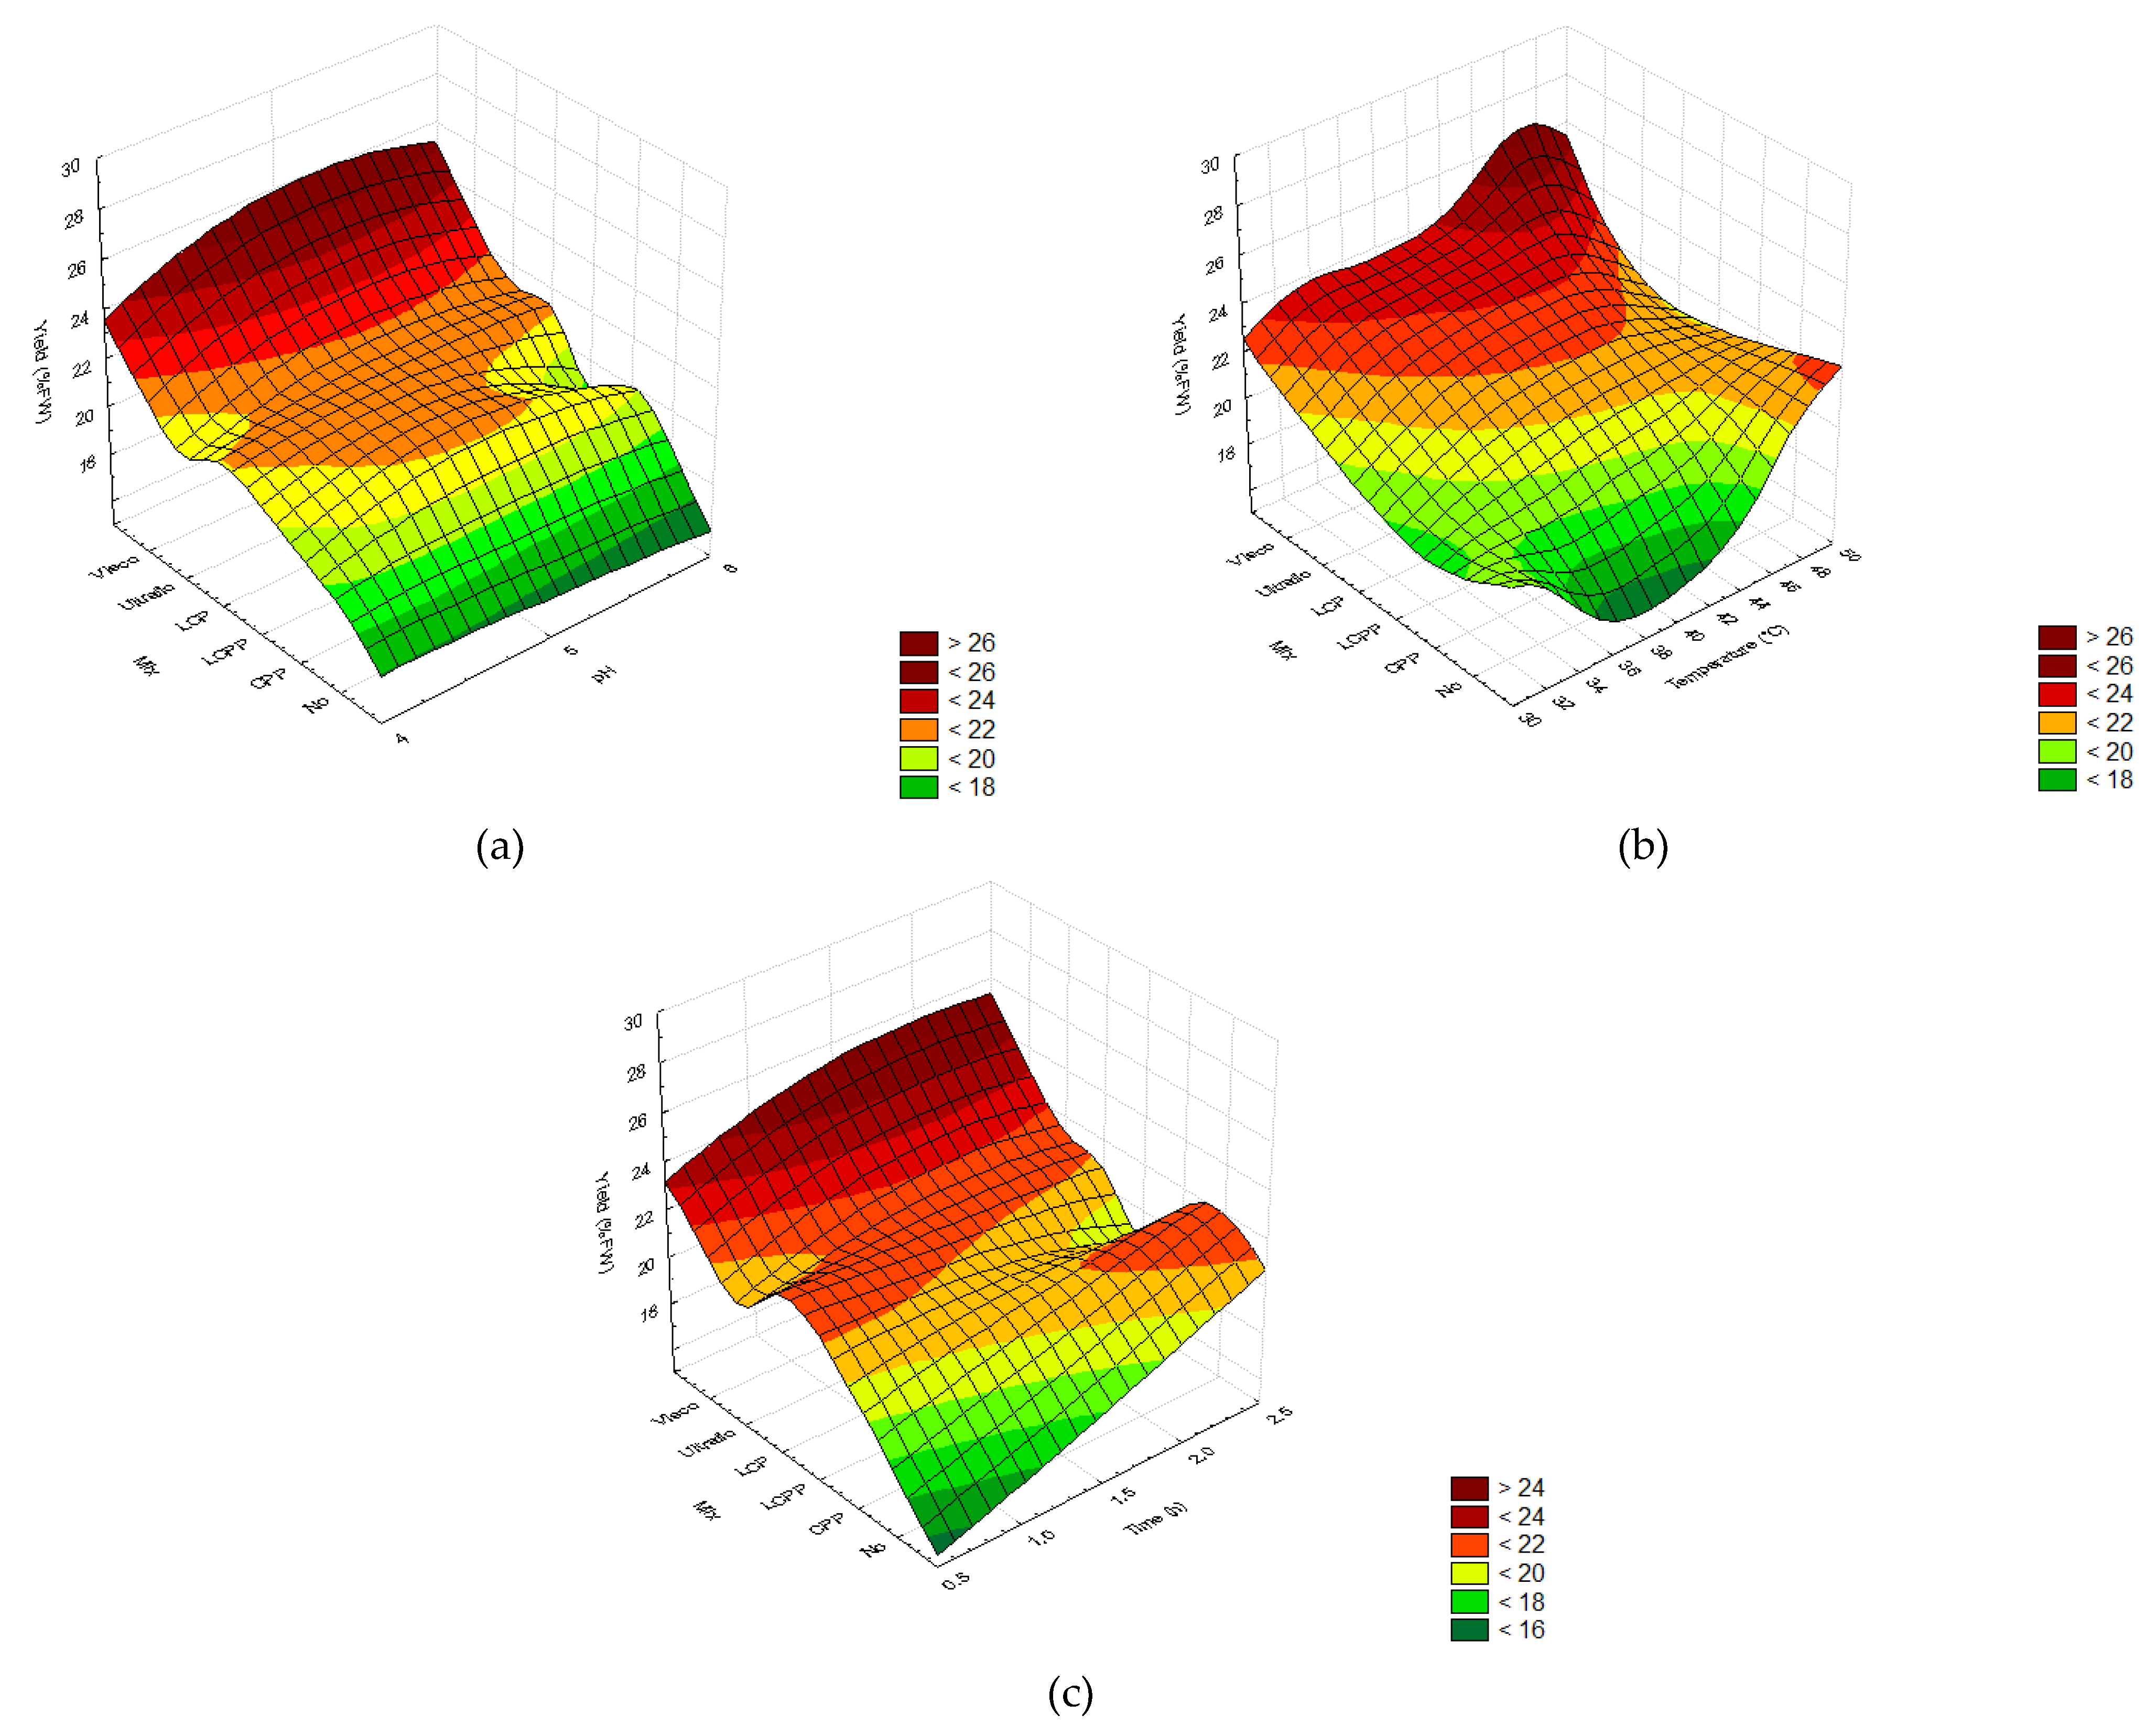
2.2. Optimization of the Enzymatic Hydrolysis Process
2.2.1. Screening of Enzyme Concentrations
2.2.2. Extraction Yields
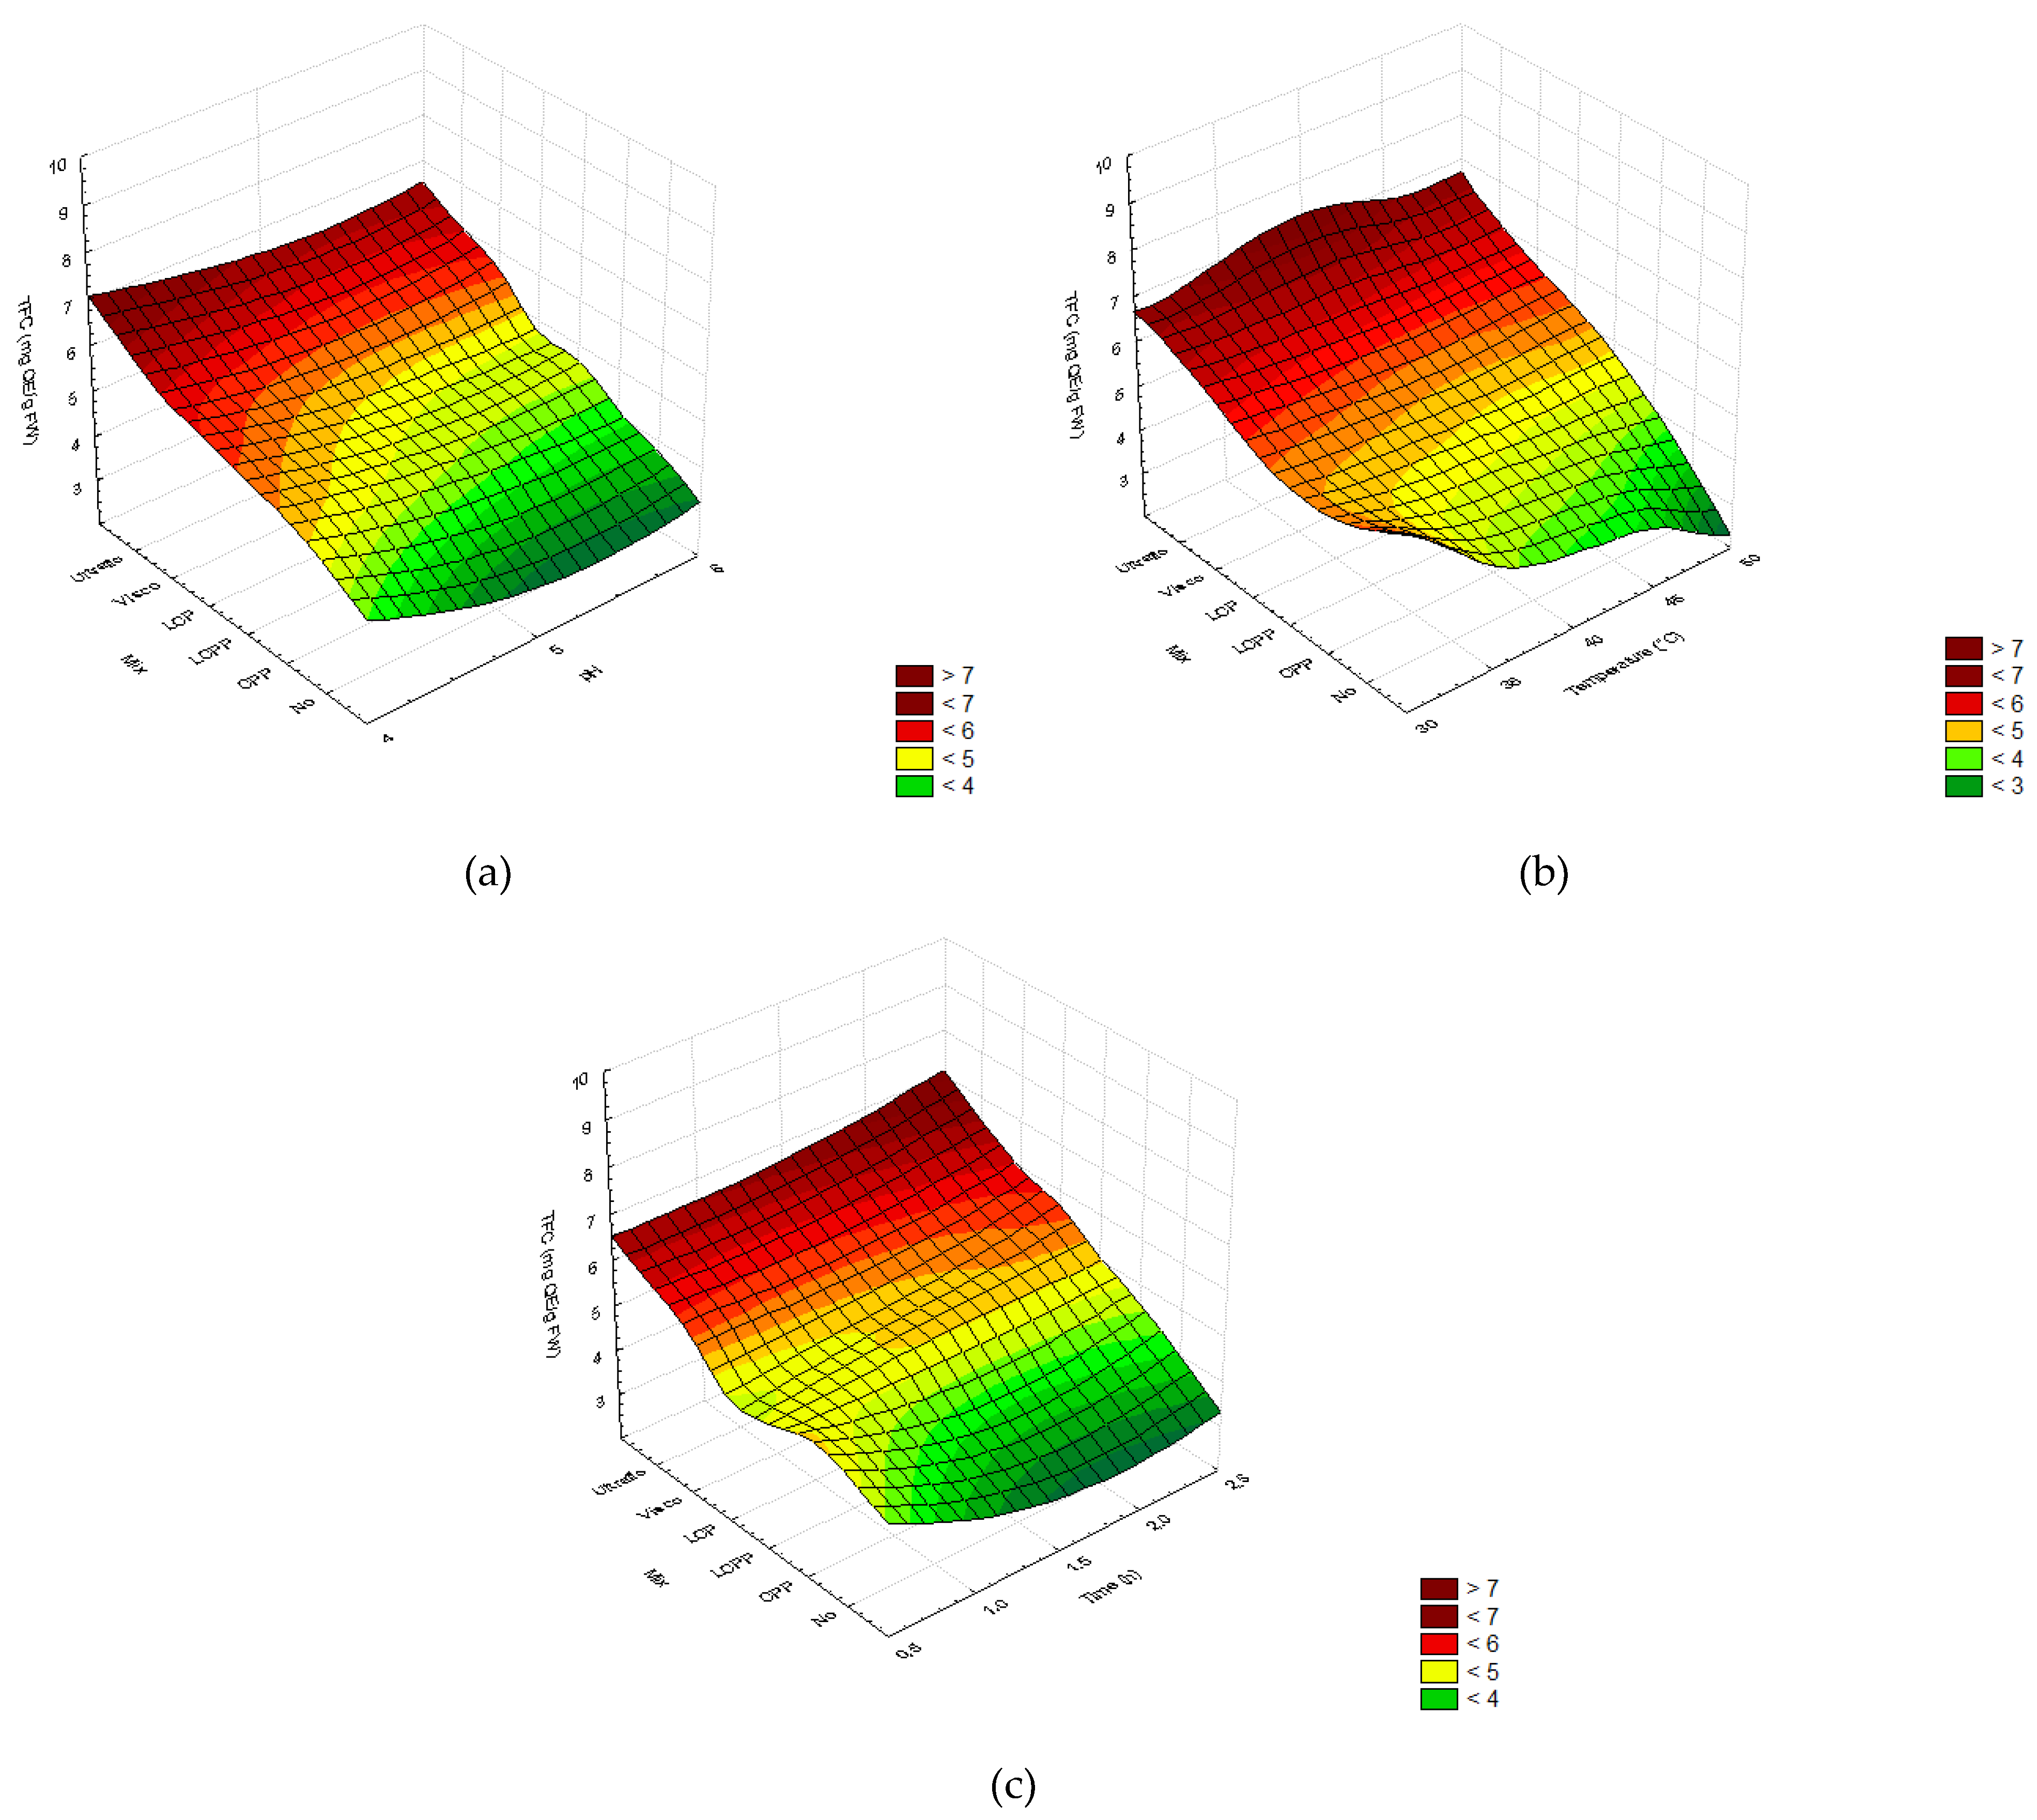
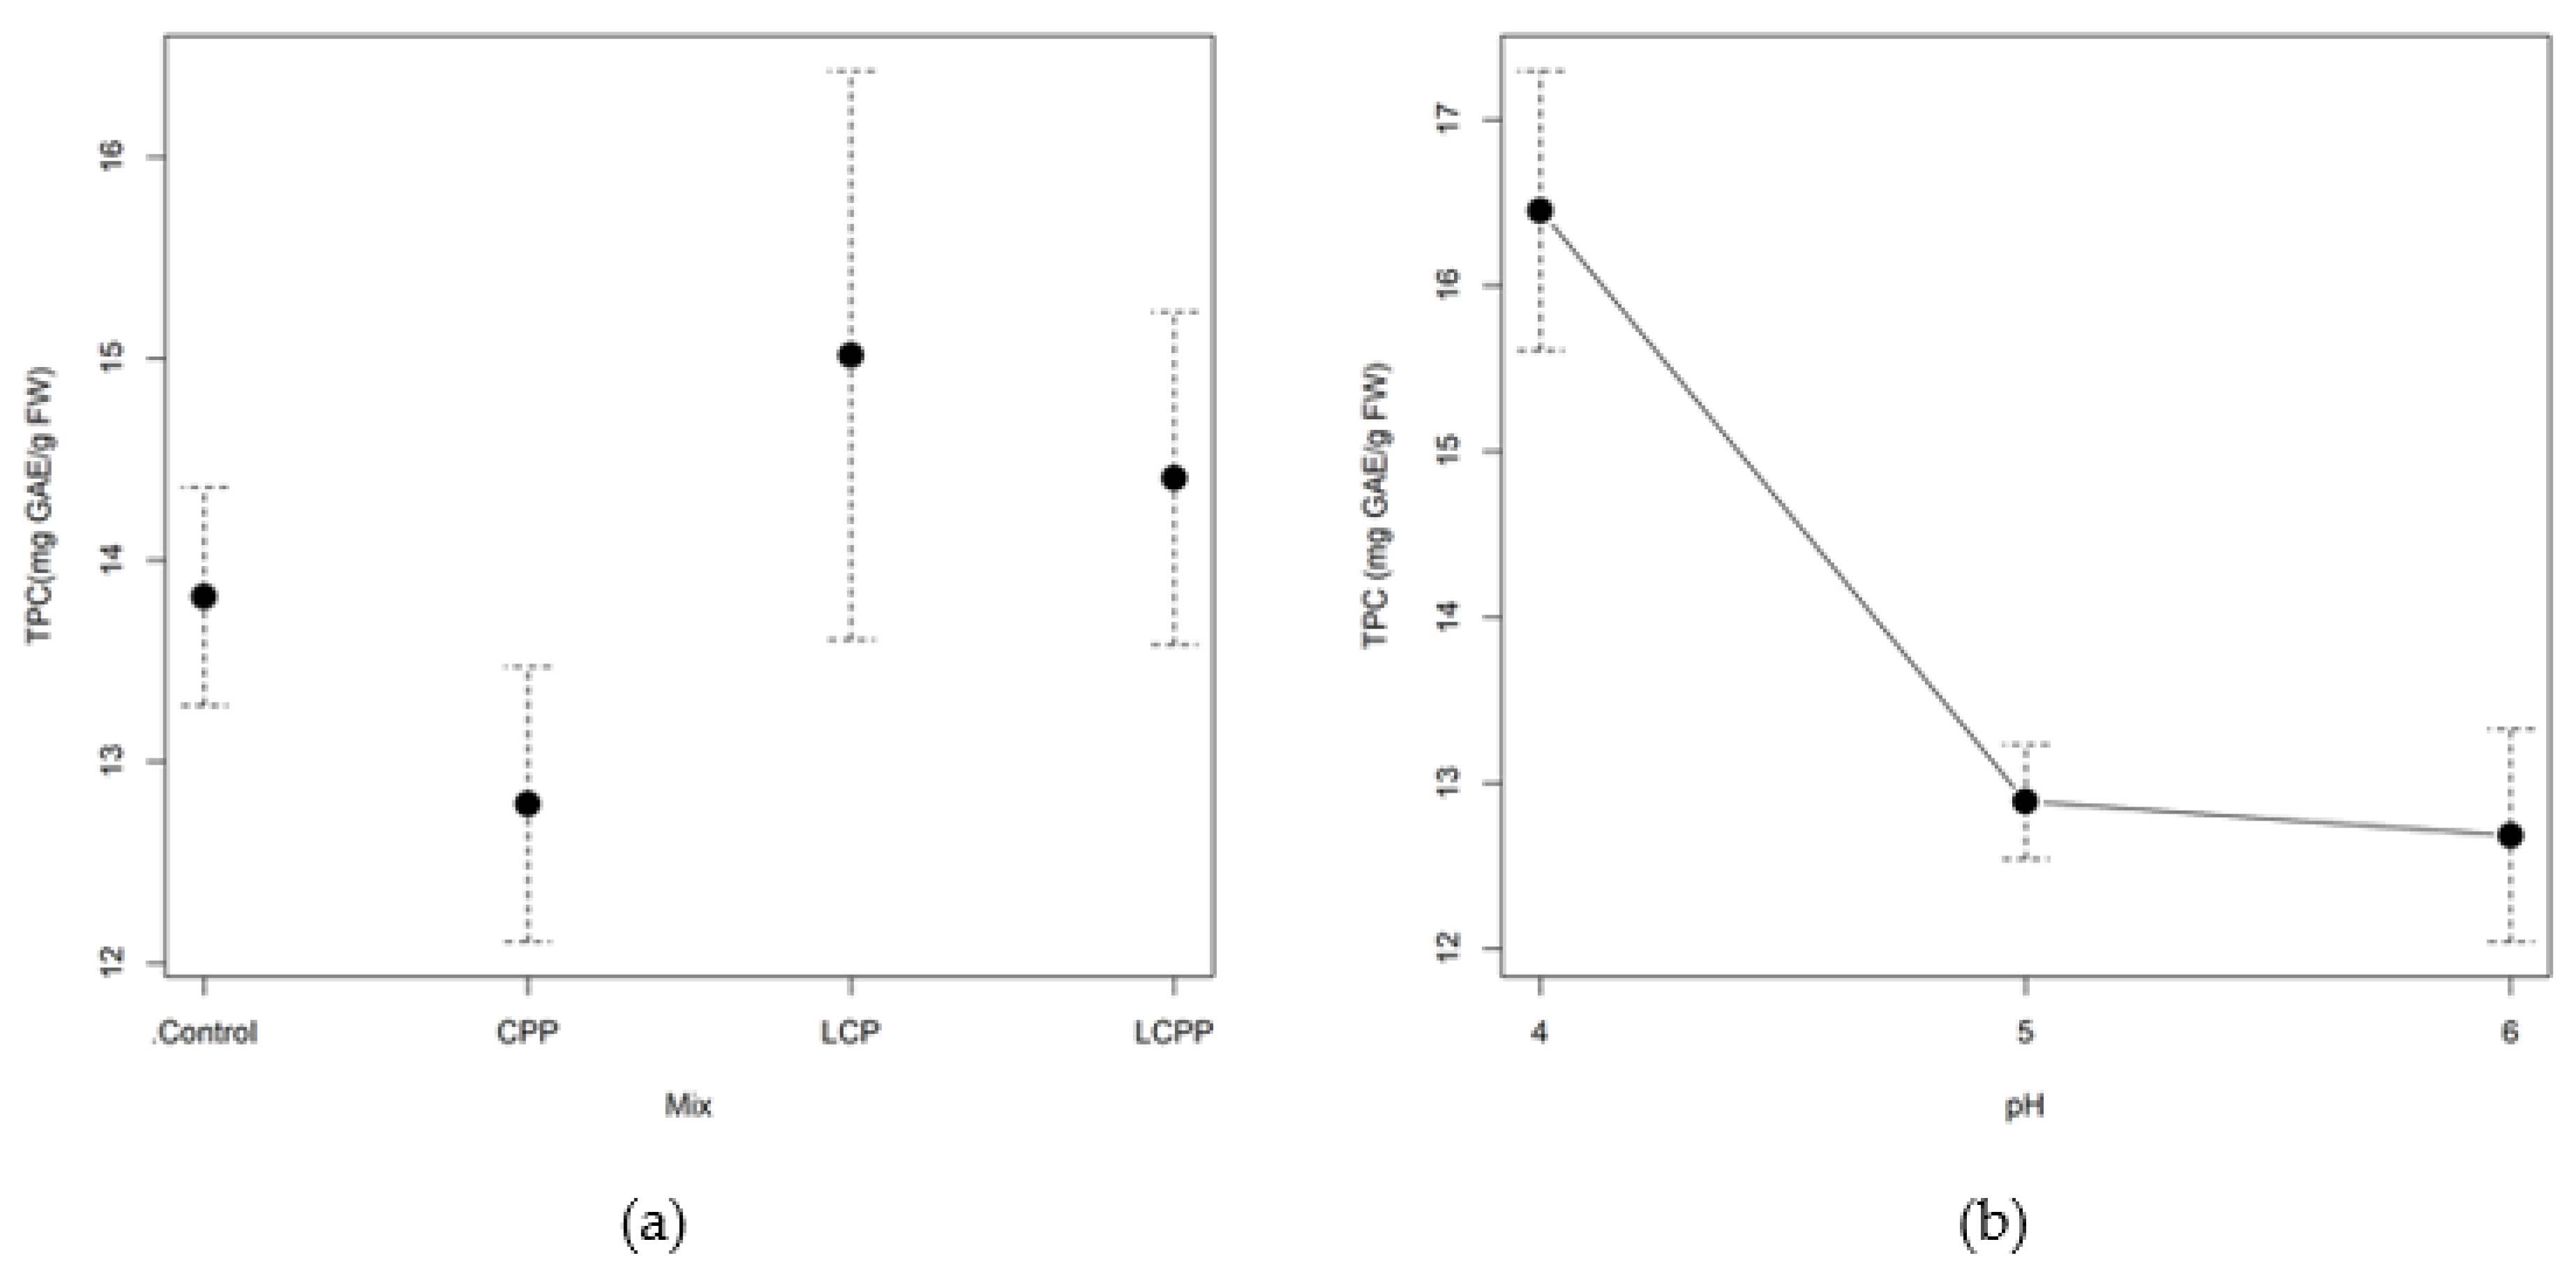
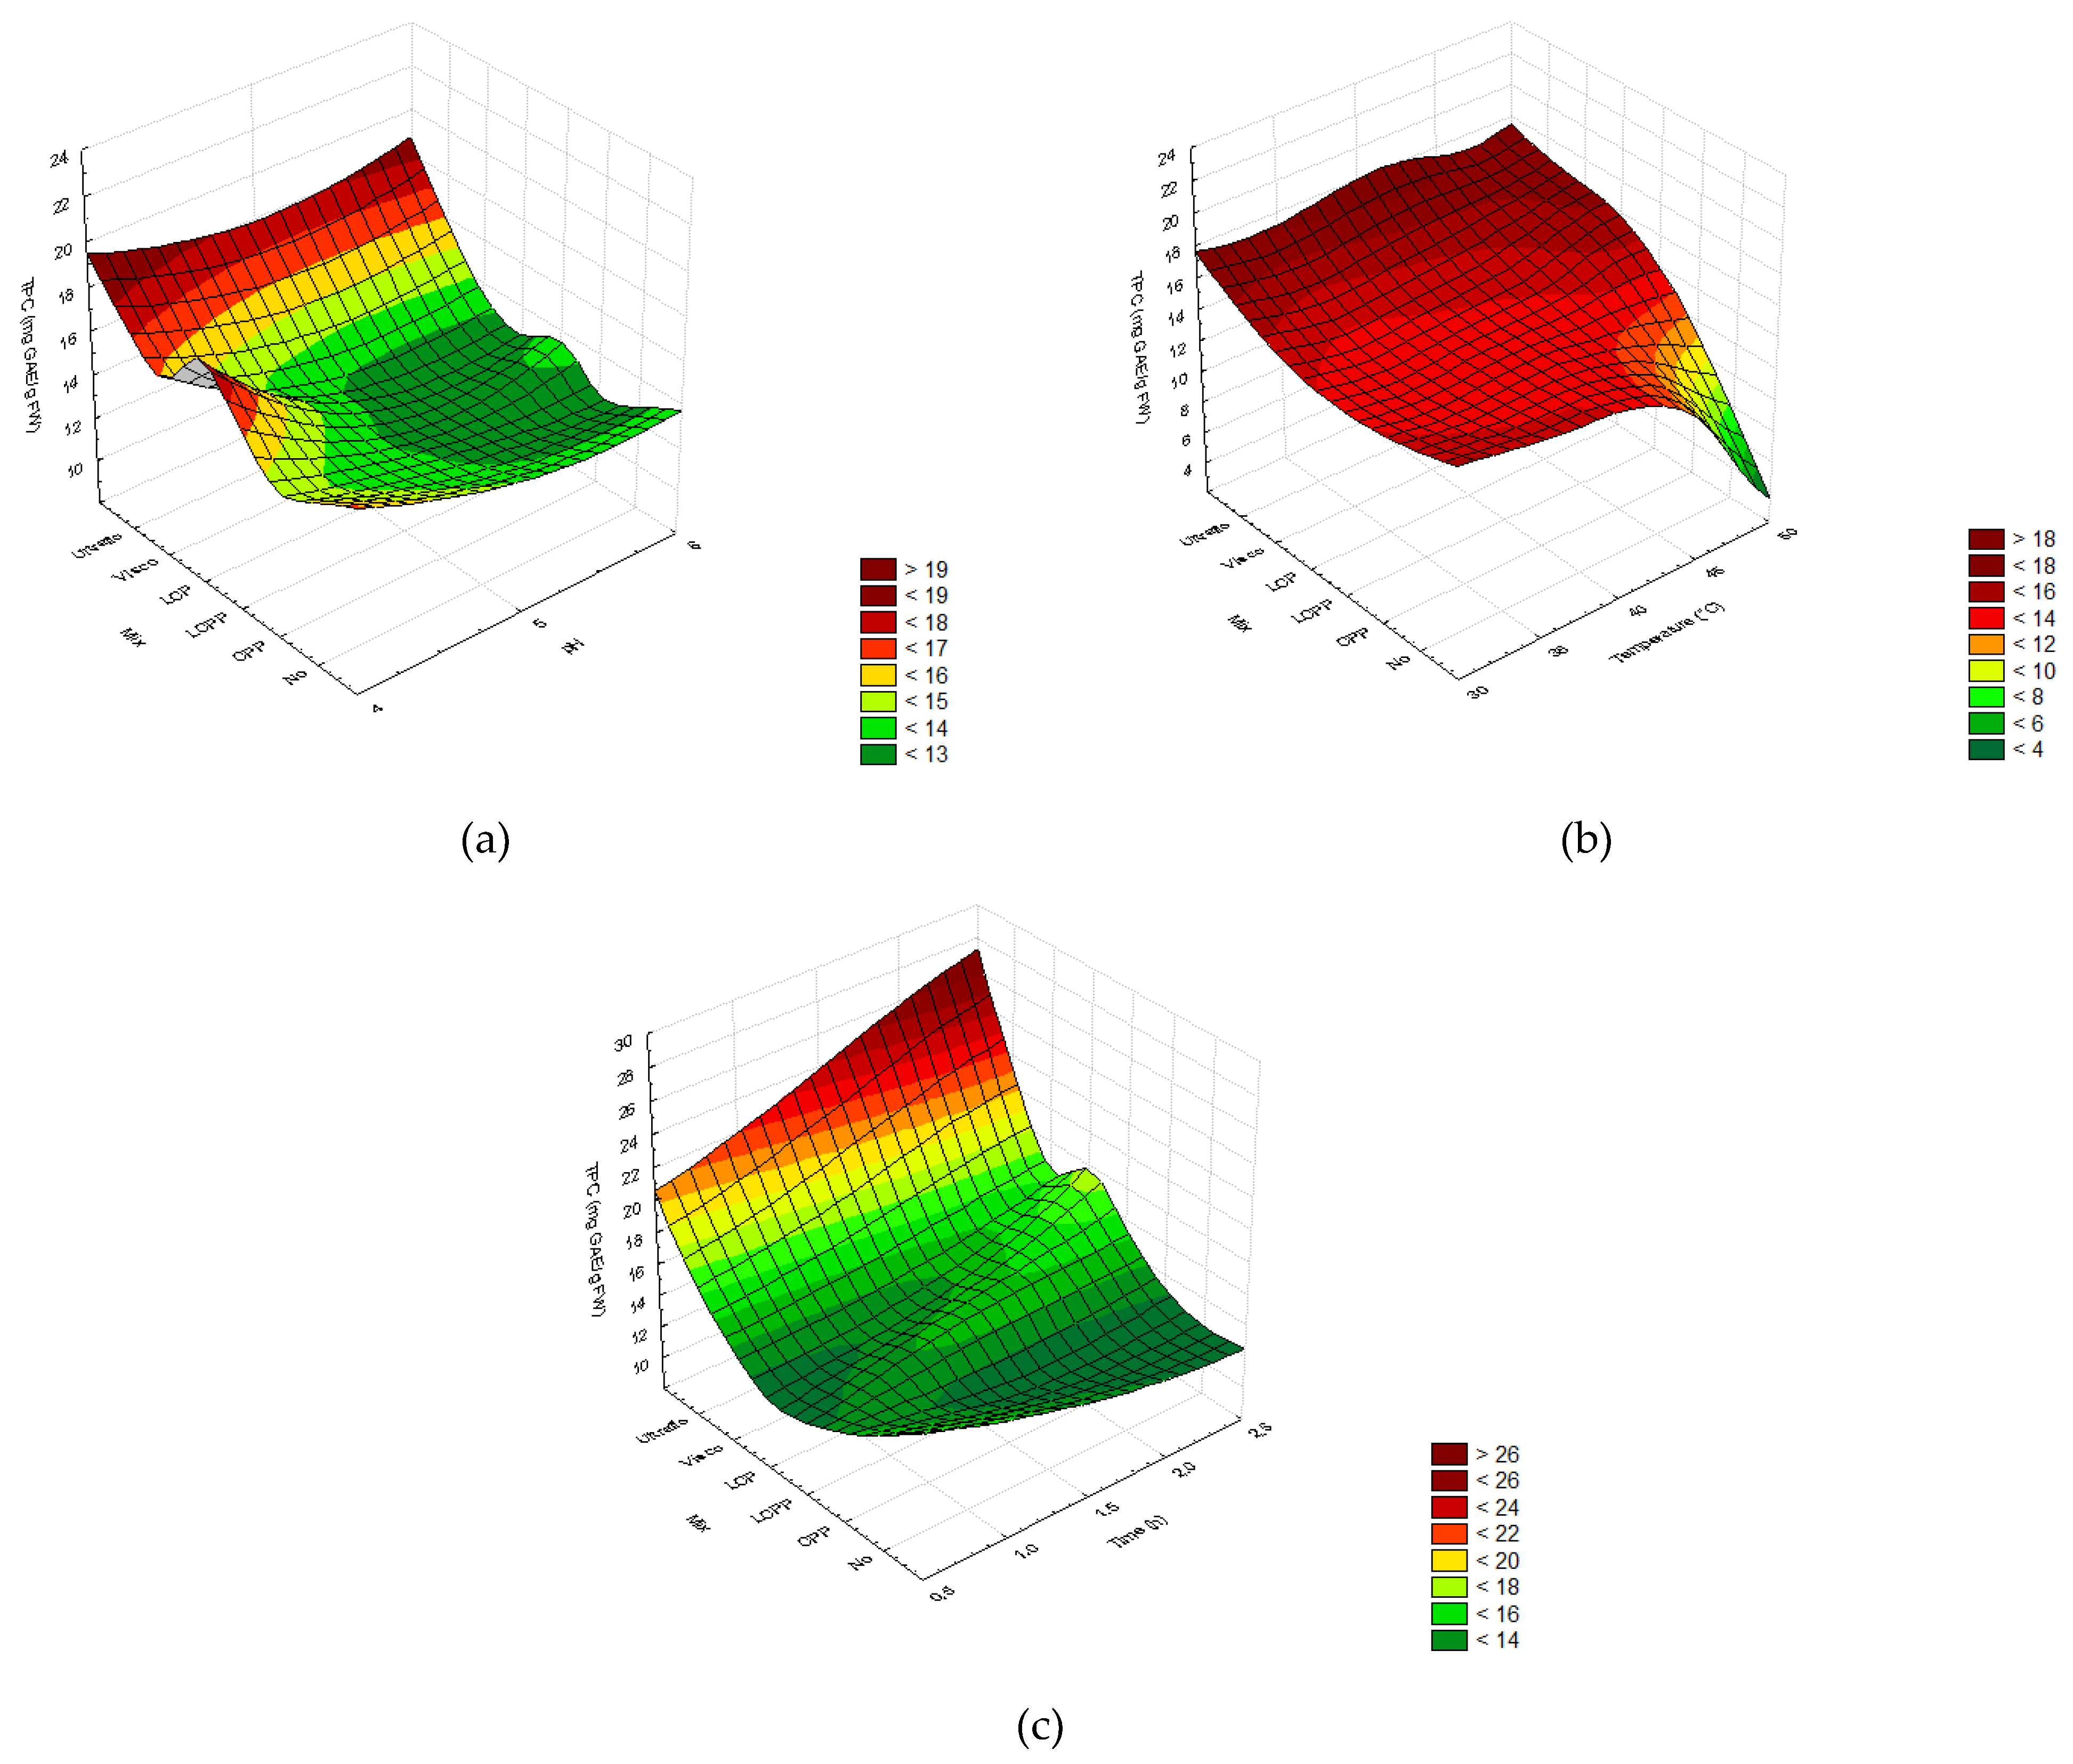
2.2.3. Total Phenolic and Flavonoid Content
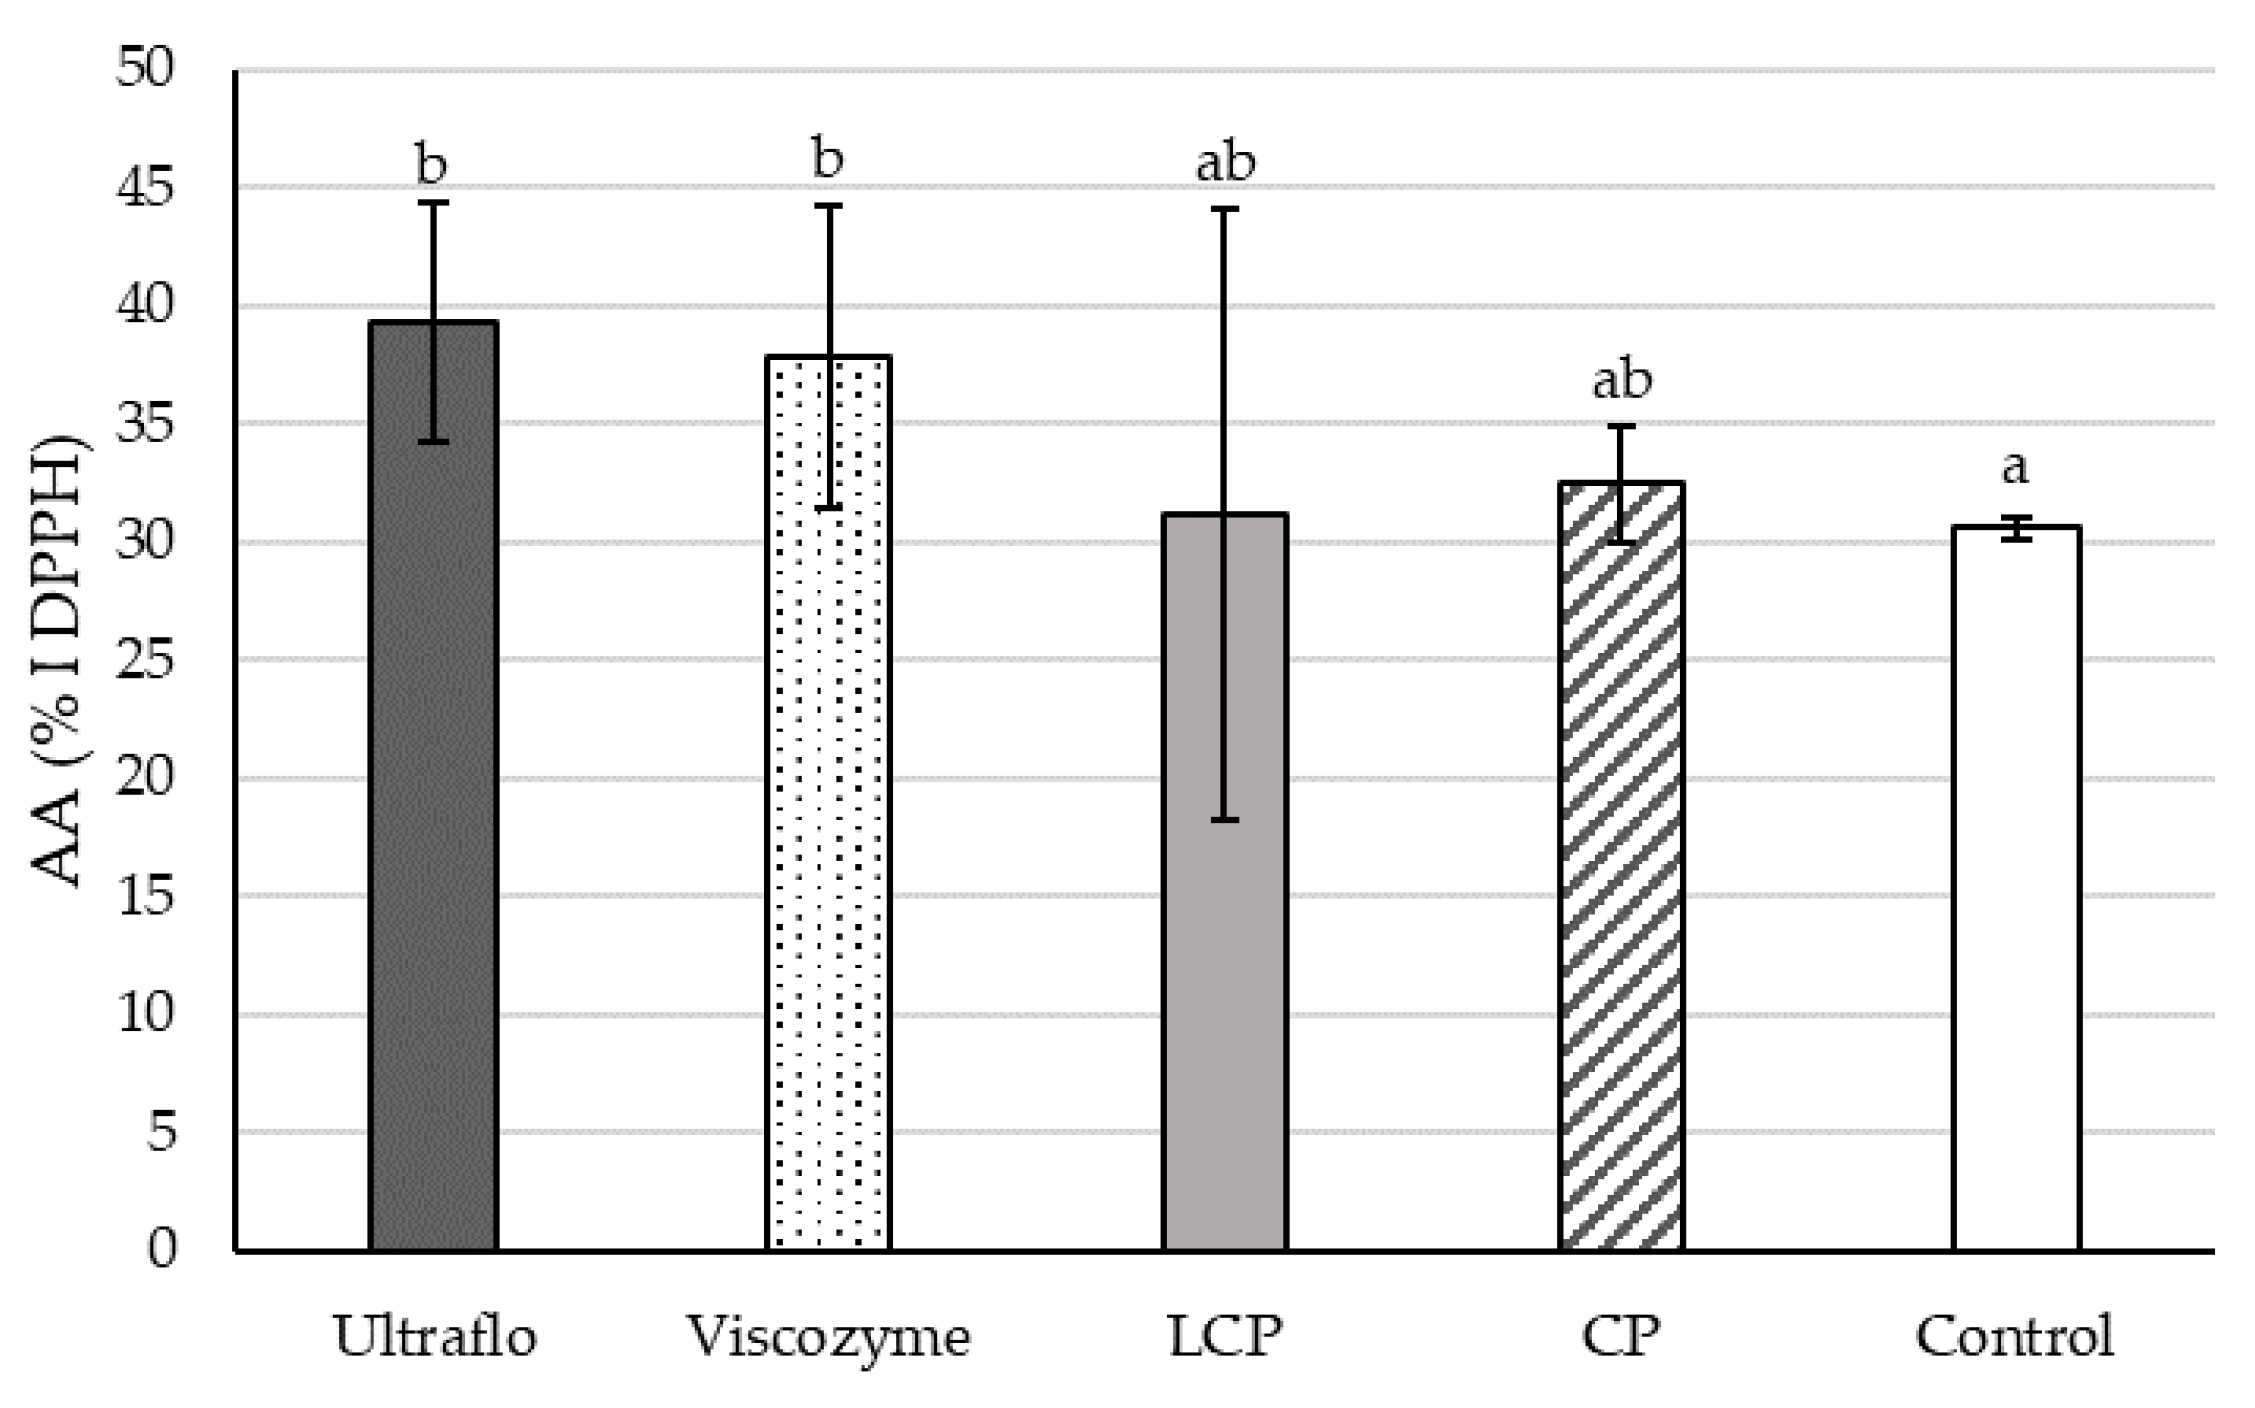
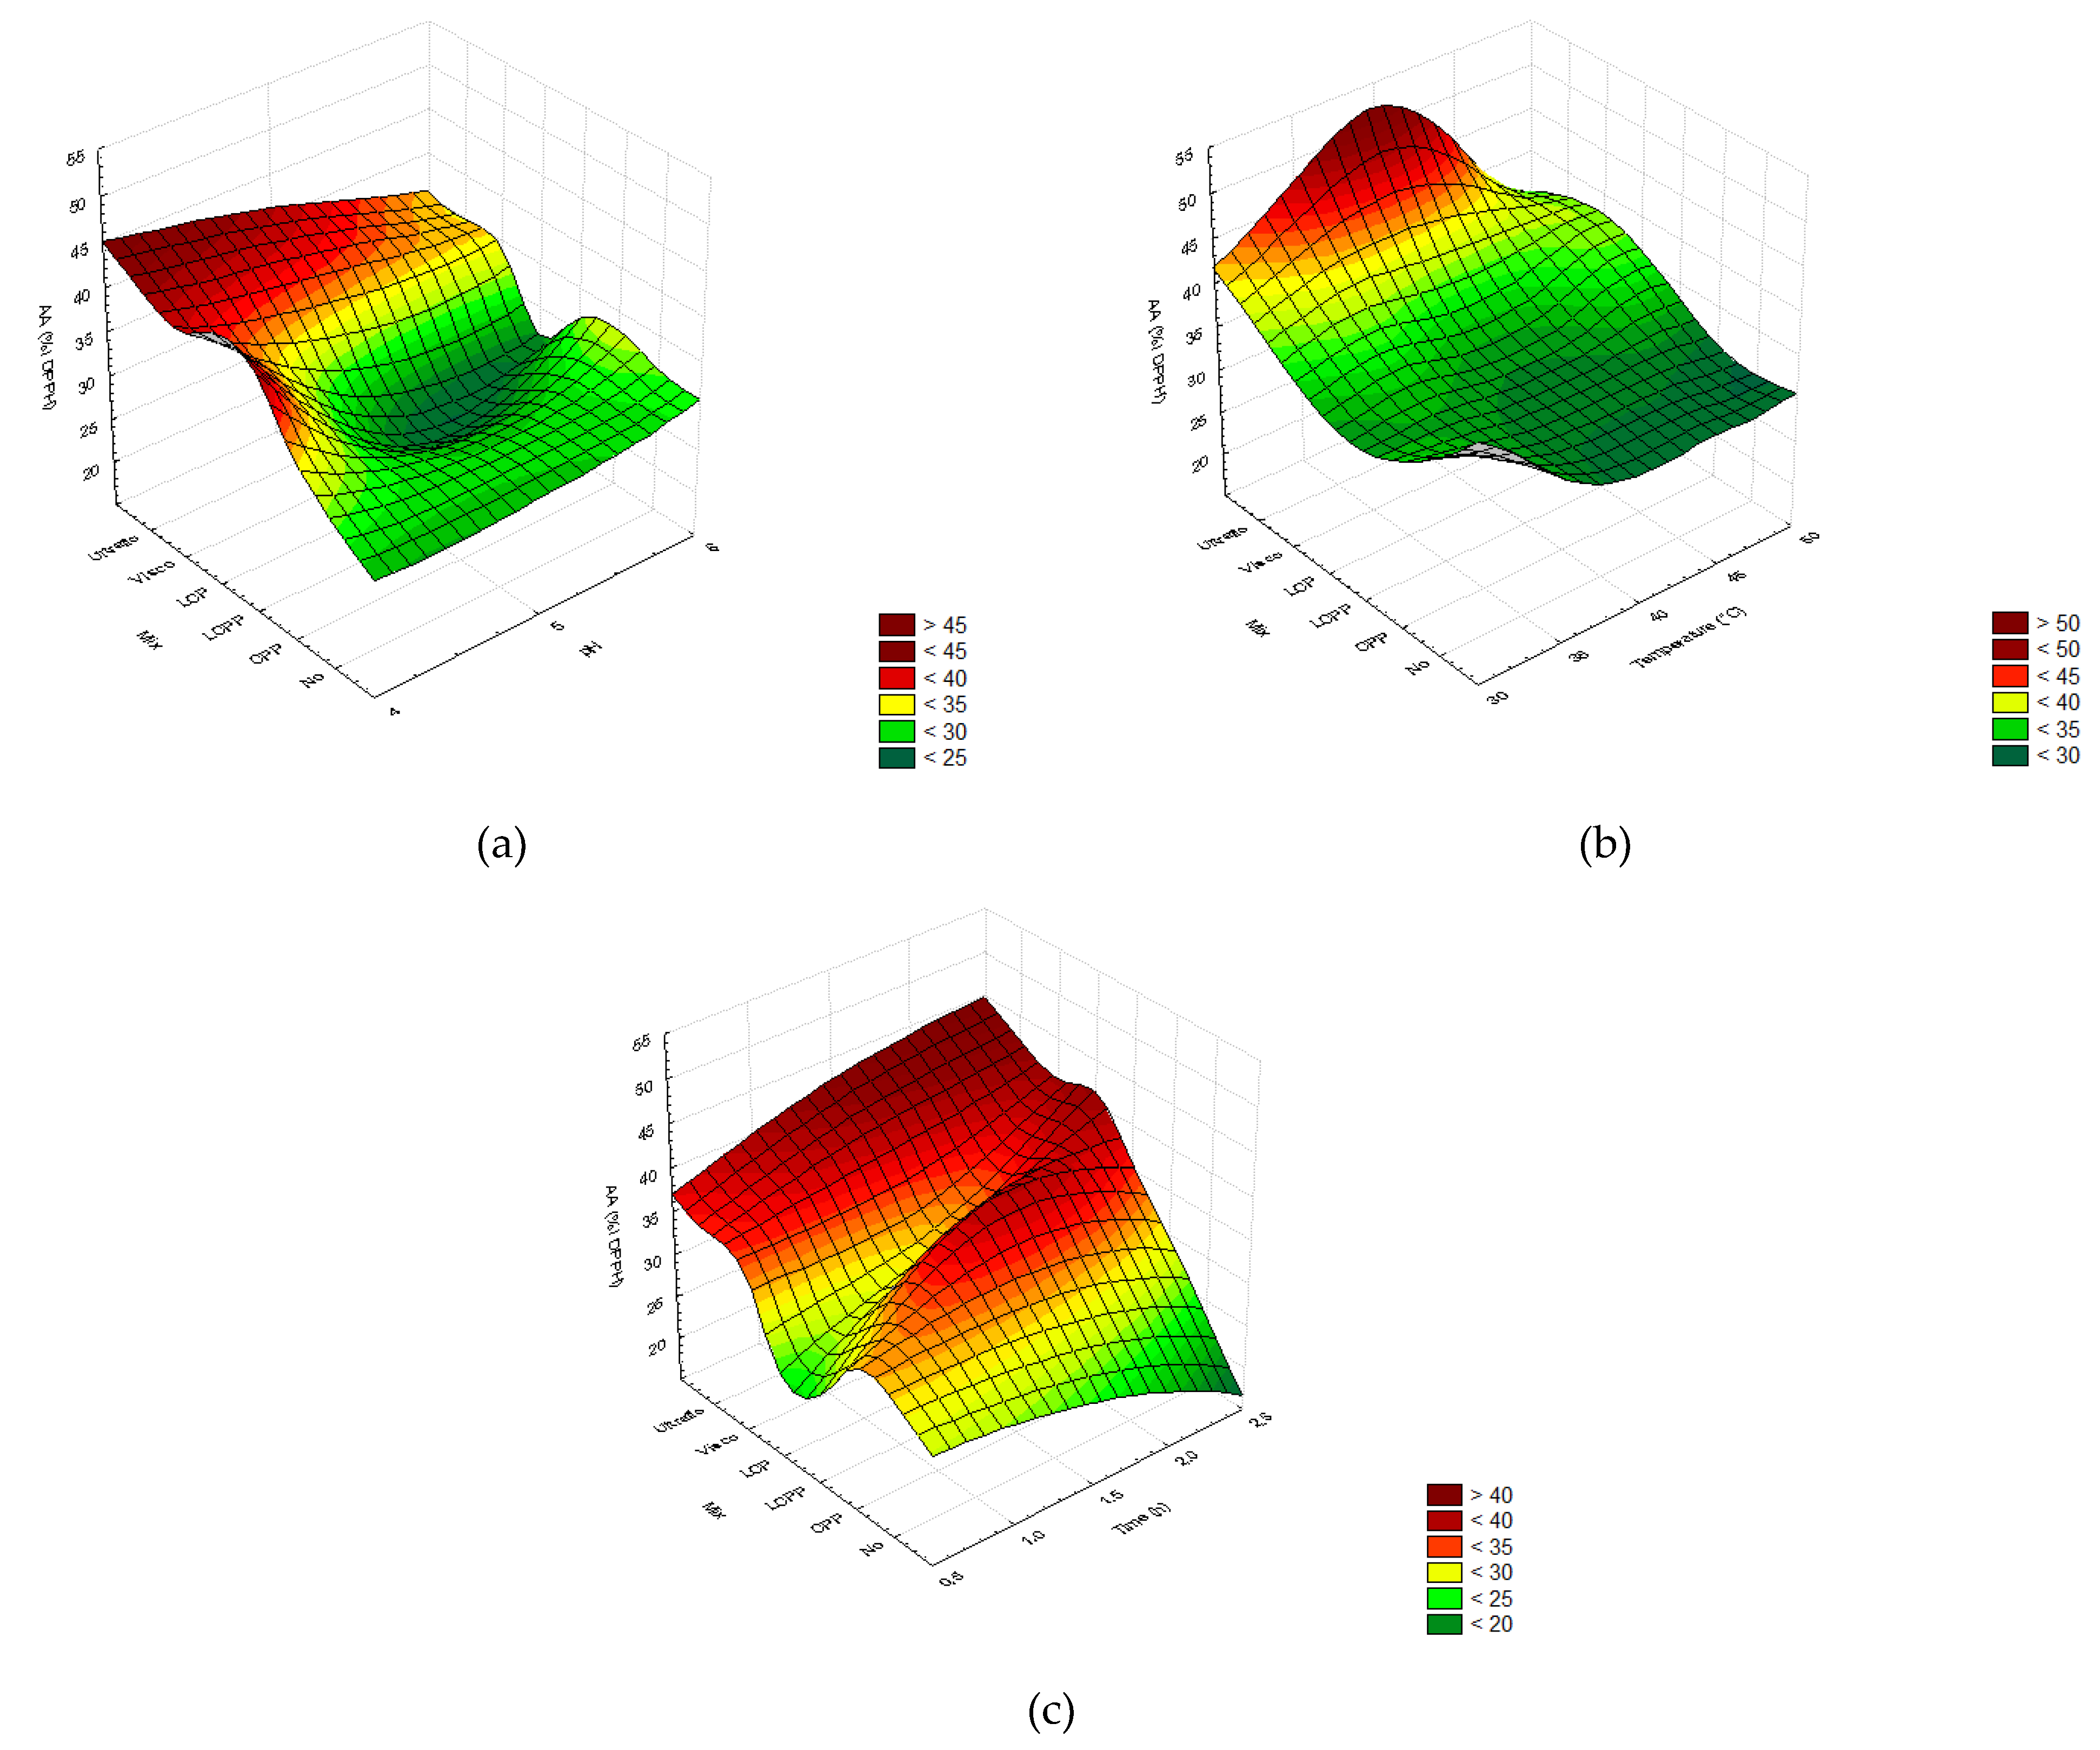
2.2.4. Free-Radical Scavenging Capacity
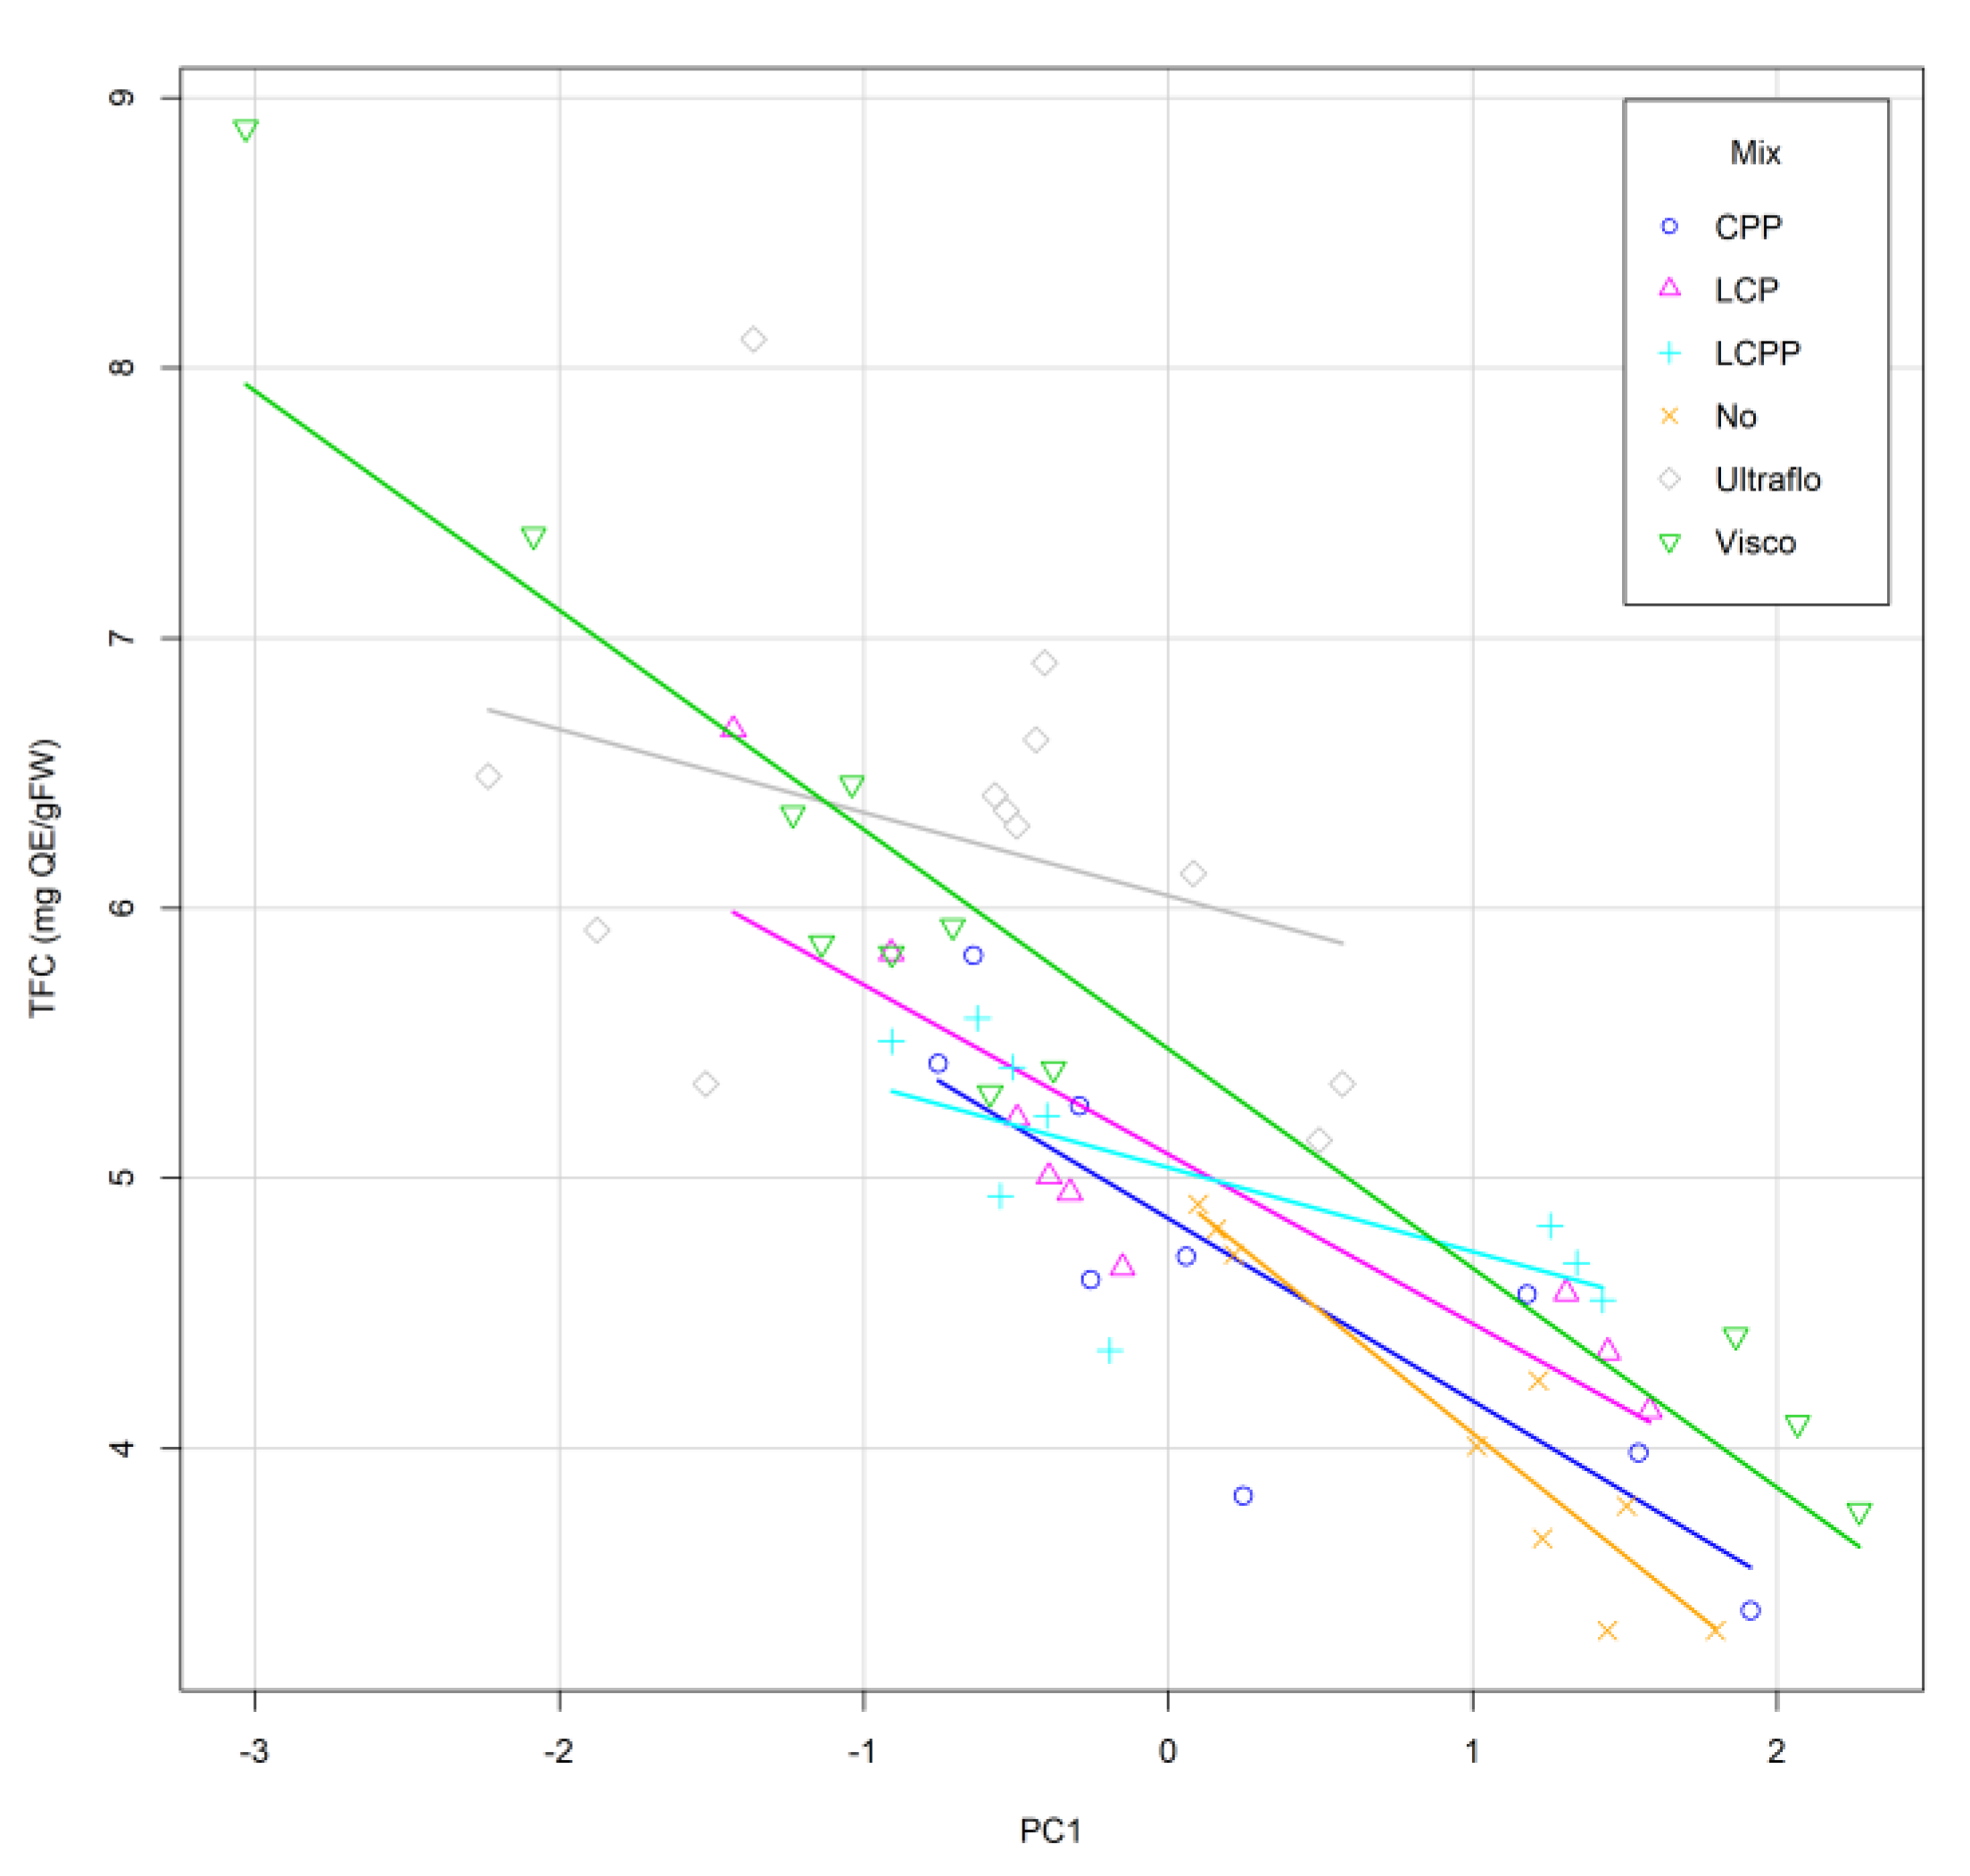
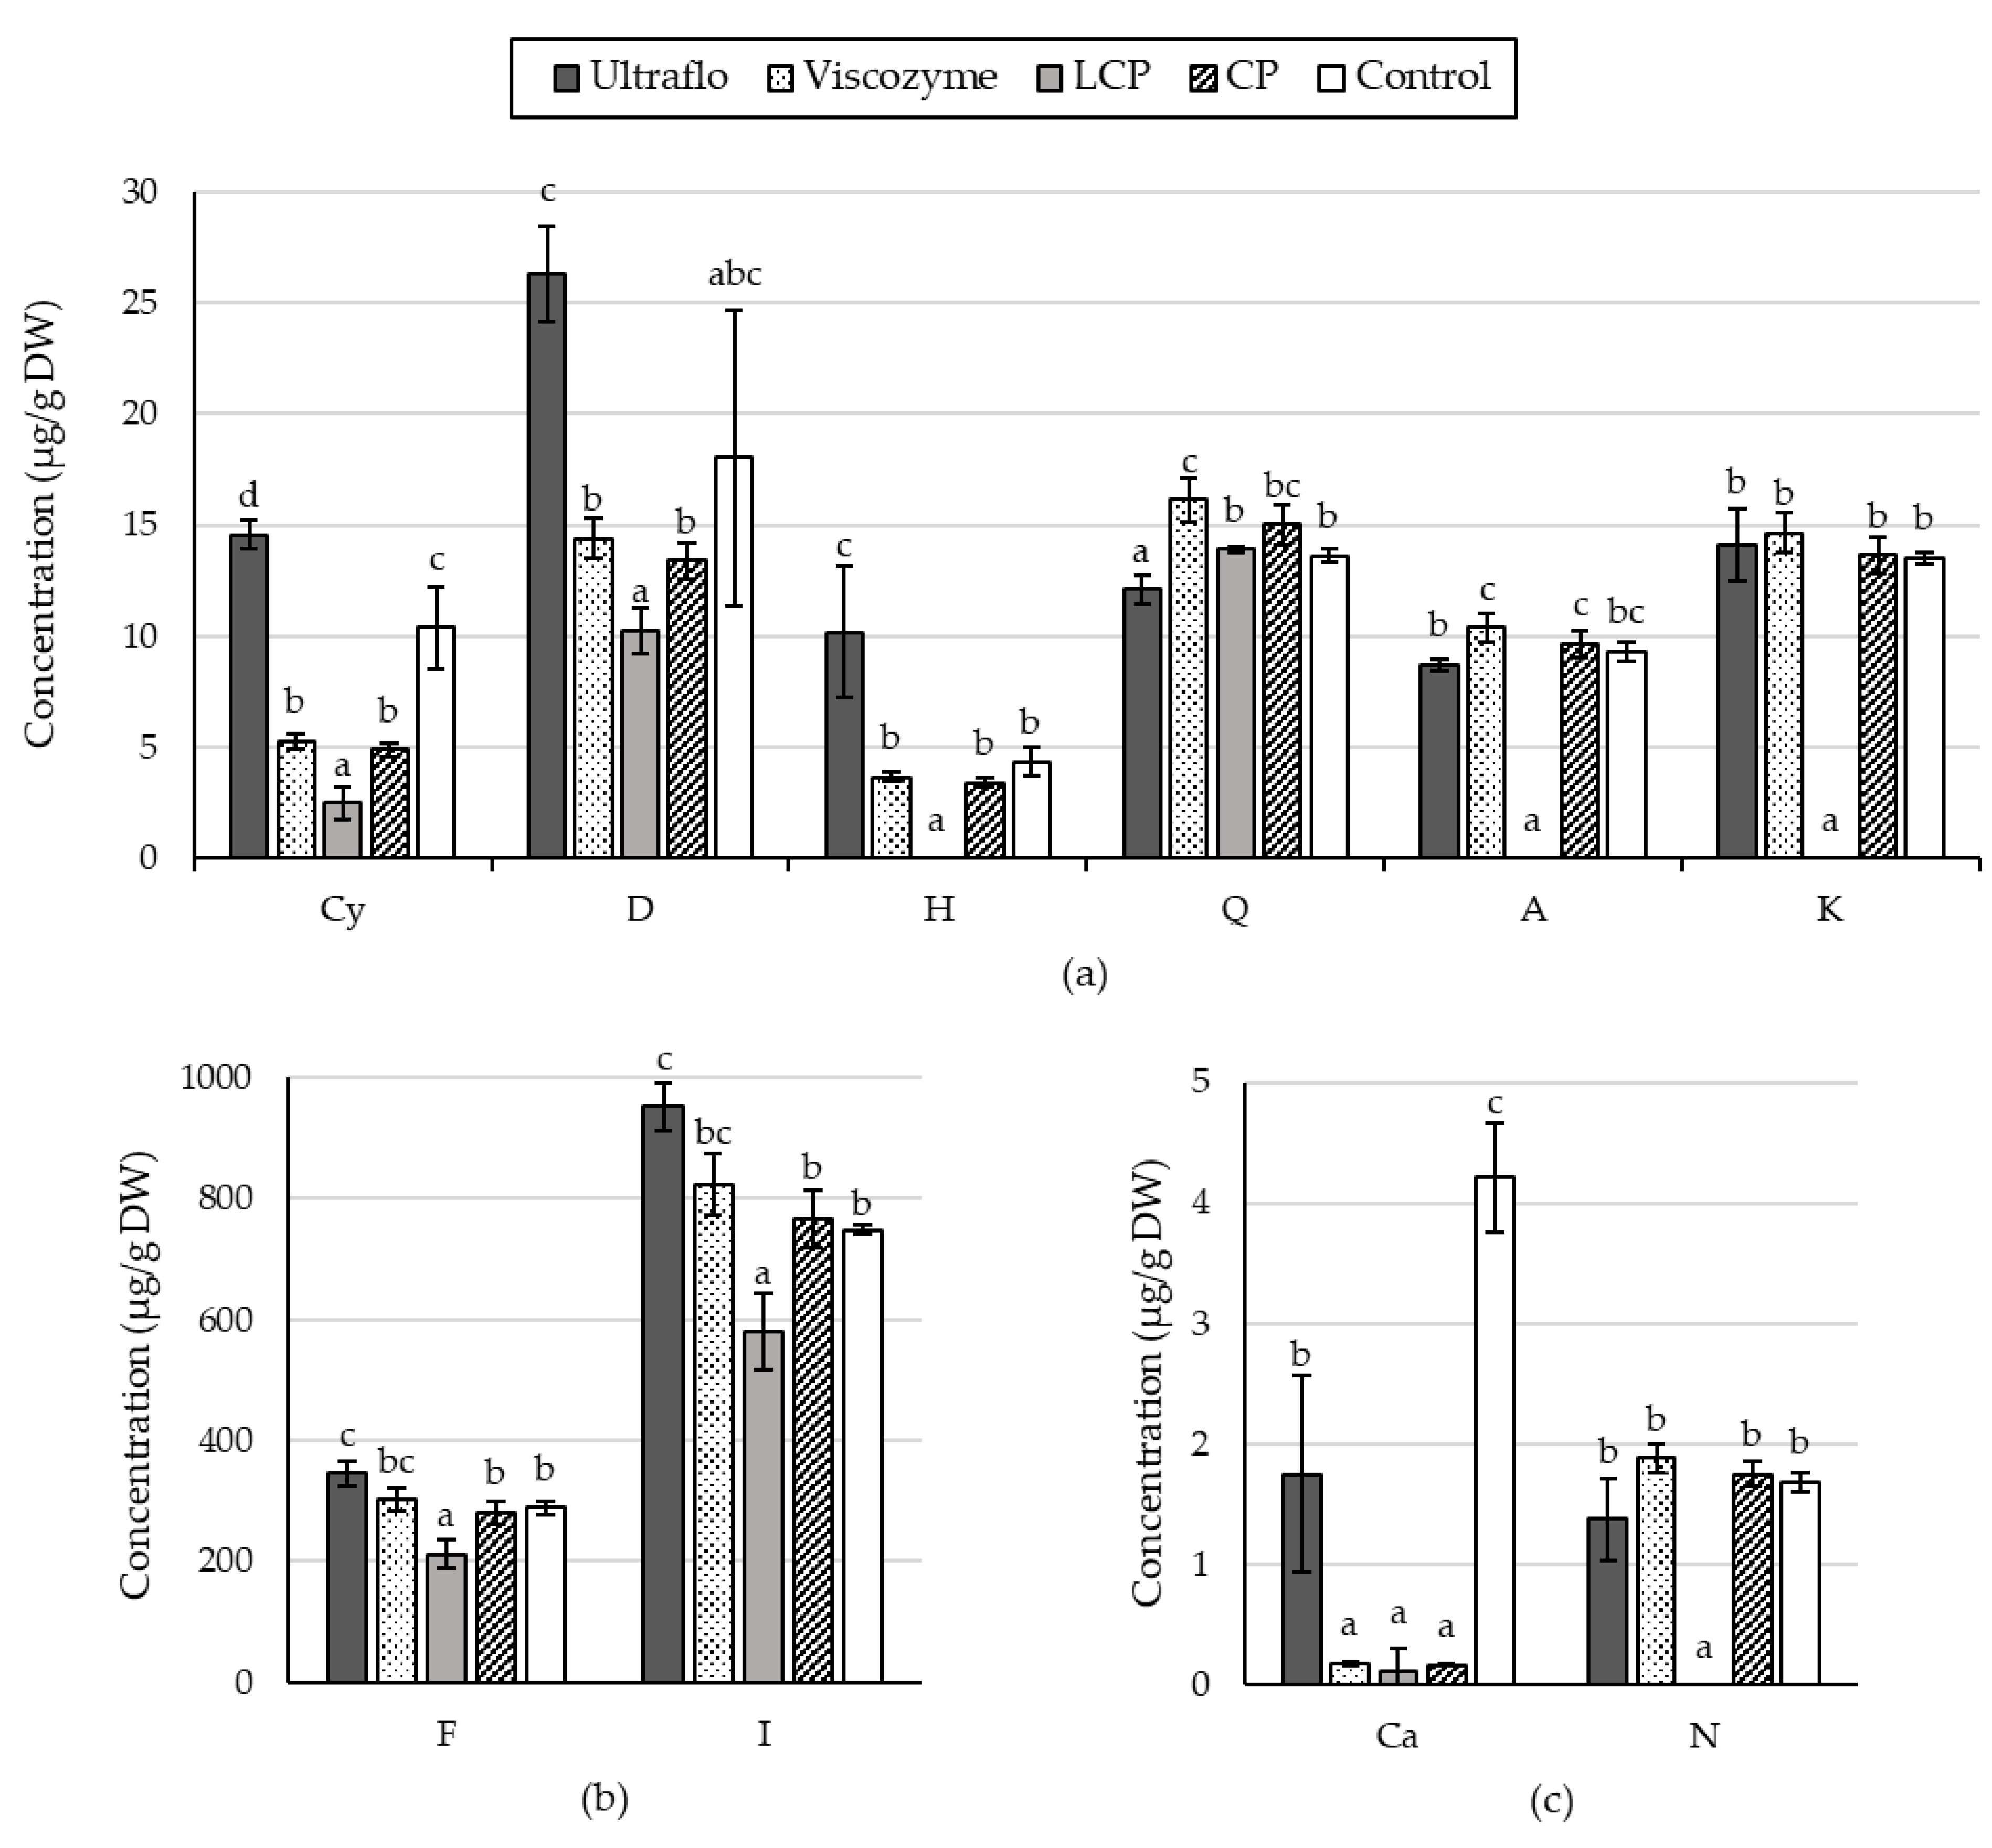
2.2.5. Specific Flavonoid Profiles
2.3. Experimental Validation
3. Discussion
3.1. Drying Process
3.2. Enzymatic Pretreatment
4. Materials and Methods
4.1. Plant Feedstock
4.2. Drying Procedure
4.3. Enzymatic Hydrolysis
4.3.1. Optimization Method
4.3.2. Experimental Validation
4.4. Ultrasound-Assisted Extraction
4.5. Phytochemicals Profiling
4.5.1. Preparation of Extracts
4.5.2. Total Phenolic and Flavonoid Contents
4.5.3. HPLC-UV-MS/MS
4.6. Free-radical Scavenging Capacity
4.7. Statistical Analysis
5. Conclusions
Author Contributions
Funding
Acknowledgments
Conflicts of Interest
Appendix A
Appendix A.1. Method

| Taguchi L9 | pH | Laccase (UI) | Cellulase (UI) | Pectinase (UI) | Pattern |
|---|---|---|---|---|---|
| 1 | 4 | 5 | 5 | 5 | −−−− |
| 2 | 4 | 10 | 10 | 10 | −000 |
| 3 | 4 | 15 | 15 | 15 | −+++ |
| 4 | 5 | 5 | 10 | 15 | 0−0+ |
| 5 | 5 | 10 | 15 | 5 | 00+− |
| 6 | 5 | 15 | 5 | 10 | 0+−0 |
| 7 | 6 | 5 | 15 | 10 | +−+0 |
| 8 | 6 | 10 | 5 | 15 | +0−+ |
| 9 | 6 | 15 | 10 | 5 | ++0− |
| Taguchi L9 | pH | Ratio L:C:P (UI) | Temp (°C) | Time (h) | Pattern |
|---|---|---|---|---|---|
| 11 | 4 | 0:5:10 | 30 | 0.5 | −−−− |
| 12 | 4 | 5:5:10 | 40 | 1.5 | −000 |
| 13 | 4 | 5:5:5 | 50 | 2.5 | −+++ |
| 14 | 5 | 0:5:10 | 40 | 2.5 | 0−0+ |
| 15 | 5 | 5:5:10 | 50 | 0.5 | 00+− |
| 16 | 5 | 5:5:5 | 30 | 1.5 | 0+−0 |
| 17 | 6 | 0:5:10 | 50 | 1.5 | +−+0 |
| 18 | 6 | 5:5:10 | 30 | 2.5 | +0−+ |
| 19 | 6 | 5:5:5 | 40 | 0.5 | ++0− |
| Taguchi L8 | Mix | pH | Temp (°C) | Time (h) | Pattern |
|---|---|---|---|---|---|
| 21 | Viscozyme | 4 | 30 | 0.5 | −−−− |
| 22 | Viscozyme | 4 | 50 | 2.5 | −−++ |
| 23 | Viscozyme | 6 | 50 | 0.5 | −+−+ |
| 24 | Viscozyme | 6 | 30 | 2.5 | −++− |
| 25 | Ultraflo | 4 | 50 | 0.5 | +−−+ |
| 26 | Ultraflo | 4 | 30 | 2.5 | +−+− |
| 27 | Ultraflo | 6 | 30 | 0.5 | ++−− |
| 28 | Ultraflo | 6 | 50 | 2.5 | ++++ |
Appendix A.2. Results
| Yield (%FW) | TPC (mg GAE/g FW) | TFC (mg QE/g FW) | AA (%I DPPH) | |||||
|---|---|---|---|---|---|---|---|---|
| Controls | ||||||||
| C1 | 18.753 ± 2.416 | ab | 15.518 ± 0.302 | ad | 4.811 ± 0.094 | bcehij | 31.031 ± 1.384 | cd |
| C2 | 18.662 ± 1.116 | ab | 13.099 ± 1.217 | ab | 3.668 ± 0.341 | ae | 30.082 ± 1.108 | bcd |
| C3 | 18.327 ± 1.015 | ab | 12.840 ± 1.570 | ab | 3.788 ± 0.463 | ae | 30.655 ± 1.458 | bcd |
| DOE I | ||||||||
| 1 | 22.202 ± 2.028 | ace | 12.842 ± 0.394 | ab | 4.026 ± 0.123 | acef | NA | |
| 2 | 22.652 ± 2.701 | ace | 12.251 ± 1.032 | ab | 3.693 ± 0.311 | ae | NA | |
| 3 | 27.763 ± 2.985 | e | 11.675 ± 0.908 | ab | 3.339 ± 0.260 | acef | NA | |
| 4 | 26.271 ± 1.878 | de | 12.419 ± 1.540 | ab | 3.962 ± 0.491 | ae | NA | |
| 5 | 21.060 ± 0.824 | acd | 12.301 ± 0.606 | ab | 4.465 ± 0.220 | bceh | NA | |
| 6 | 23.290 ± 1.245 | ace | 12.345 ± 1.270 | ab | 3.259 ± 0.335 | acef | NA | |
| 7 | 24.509 ± 2.584 | bce | 12.885 ± 0.073 | ab | 3.519 ± 0.159 | acd | NA | |
| 8 | 25.451 ± 3.926 | ce | 11.908 ± 0.831 | ab | 3.078 ± 0.215 | ab | NA | |
| 9 | 22.721 ± 1.759 | ace | 10.939 ± 0.679 | ab | 2.623 ± 0.163 | a | NA | |
| DOE II | ||||||||
| 11 | 19.341 ± 2.734 | ac | 13.865 ± 1.465 | abc | 5.269 ± 0.557 | dehij | 34.061 ± 4.633 | cde |
| 12 | 20.419 ± 3.881 | acd | 16.166 ± 1.809 | ad | 5.412 ± 0.181 | ehij | 44.372 ± 4.850 | ghi |
| 13 | 21.792 ± 0.548 | ace | 20.256 ± 2.870 | d | 5.834 ± 0.827 | fghk | 45.530 ± 2.607 | h |
| 14 | 21.782 ± 1.046 | ace | 13.215 ± 2.286 | abc | 4.625 ± 0.800 | bcehi | 29.619 ± 1.592 | bcd |
| 15 | 21.516 ± 3.371 | ace | 12.335 ± 0.363 | ab | 4.687 ± 0.138 | bcehi | 23.176 ± 0.858 | ab |
| 16 | 21.334 ± 1.596 | ace | 12.899 ± 0.631 | ab | 4.946 ± 0.277 | cehij | 27.327 ± 1.263 | ac |
| 17 | 21.284 ± 1.272 | ace | 11.283 ± 2.014 | a | 3.986 ± 0.585 | ae | 33.602 ± 0.304 | cde |
| 18 | 16.856 ± 1.398 | a | 14.716 ± 3.163 | abc | 4.934 ± 0.572 | cehij | 34.434 ± 1.150 | cdef |
| 19 | 22.779 ± 0.908 | ace | 11.893 ± 0.743 | ab | 4.358 ± 0.218 | aceh | 20.527 ± 1.540 | a |
| DOE III | ||||||||
| 21 | 20.027 ± 1.737 | acd | 15.696 ± 1.397 | ad | 5.933 ± 0.528 | hk | 36.931 ± 2.278 | dg |
| 22 | 23.305 ± 3.603 | ace | 15.143 ± 1.341 | ad | 5.833 ± 0.517 | fghk | 41.797 ± 3.616 | fgh |
| 23 | 22.911 ± 1.380 | ace | 11.640 ± 0.922 | ab | 4.093 ± 0.324 | aceg | 29.236 ± 3.471 | bc |
| 24 | 22.991 ± 0.507 | ace | 18.635 ± 3.810 | cd | 7.380 ± 1.509 | k | 43.496 ± 1.789 | gh |
| 25 | 18.892 ± 1.566 | ac | 15.517 ± 1.901 | ad | 6.129 ± 0.780 | hk | 32.305 ± 1.057 | cd |
| 26 | 20.394 ± 0.906 | acd | 15.167 ± 1.586 | ad | 6.361 ± 0.057 | jk | 40.761 ± 3.224 | gh |
| 27 | 19.747 ± 0.632 | acd | 15.790 ± 0.141 | bd | 5.919 ± 0.570 | ghk | 39.846 ± 2.517 | egh |
| 28 | 21.568 ± 1.648 | ace | 17.132 ± 3.832 | ad | 6.624 ± 1.482 | ik | 44.374 ± 0.905 | egh |


References
- Arevalo-Gallegos, A.; Ahmad, Z.; Asgher, M.; Parra-Saldivar, R.; Iqbal, H.M.N. Lignocellulose: A sustainable material to produce value-added products with a zero waste approach—A review. Int. J. Biol. Macromol. 2017, 99, 308–318. [Google Scholar] [CrossRef] [PubMed]
- FAO. The State of Food and Agriculture; Food and Agriculture Organization: Rome, Italy, 2019. [Google Scholar]
- Freitas, L.C.; Barbosa, J.R.; da Costa, A.L.C.; Bezerra, F.W.F.; Pinto, R.H.H.; Carvalho Junior, R.N. de From waste to sustainable industry: How can agro-industrial wastes help in the development of new products? Resour. Conserv. Recycl. 2021, 169, 105466. [Google Scholar] [CrossRef]
- Reyes, A.; Rivera-Pérez, C.; Sáenz-Galindo, A.; Fuentes-Avilés, J.J.; Salinas-Salazar, C.; Parra-Saldívar, R. Merging Green Chemistry and Biorefinery: Consolidating Processes. In Handbook of Research on Bioenergy and Biomaterials Consolidated and Green Processes; Ríos-González, L.J., Rodríguez-de la Garza, J.A., Medina-Morales, M.A., Aguilara, C.N., Eds.; Taylor & Francis: Abingdon, UK, 2021; pp. 3–38. [Google Scholar]
- Cheah, W.Y.; Sankaran, R.; Show, P.L.; Ibrahim, T.N.B.T.; Chew, K.W.; Culaba; Chang, J.-S. Pretreatment methods for lignocellulosic biofuels production: Current advances, challenges and future prospects. Biofuel Res. J. 2020, 7, 1115–1127. [Google Scholar]
- Castillo-Quiroz, D.; Cano-Pineda, A.; Berlanga-Reyes, C.A. Establecimiento y aprovechamiento de lechuguilla (Agave lechuguilla Torr.). Com. Nac. For. 2012, 33. Available online: https://www.conafor.gob.mx/biblioteca/Establecimiento_y_aprovechamiento_de_la_lechuguilla_Agave_lechuguilla_Torr.pdf (accessed on 3 November 2021).
- Díaz-Jiménez, L.; Carlos-Hernandez, S.; Jasso de Rodríguez, D.; Rodríguez-García, R. Conceptualization of a biorefinery for guishe revalorization. Ind. Crops Prod. 2019, 138, 111441. [Google Scholar] [CrossRef]
- Reyes-Agüero, J.A.; Aguirre-Rivera, J.R.; Peña-Valdivia, C.B. Biología y aprovechamiento de Agave lechuguilla Torrey. Bot. Sci. 2000, 88, 75. [Google Scholar] [CrossRef]
- Nobel, P.S. Environmental Biology of Agaves and Cacti; Cambridge University Press: Cambridge, UK, 2003; p. 284. [Google Scholar]
- Taylor, N.T.; Davis, K.M.; Abad, H.; McClung, M.R.; Moran, M.D. Ecosystem services of the Big Bend region of the Chihuahuan Desert. Ecosyst. Serv. 2017, 27, 48–57. [Google Scholar] [CrossRef]
- Quiroz, D.C.; Reyes, J.T.S.; Velasco, M.N.; Ramos, J.A.V. Propiedades Físico-Mecánicas de la Fibra de Agave lechuguilla Torr. de Cinco Procedencias Bajo Plantaciones Physical and Mechanical Properties of Agave lechuguilla Torr. Fiber under Plantations of Five Provenances. Rev. Mex. Ciencias For. 2013, 4, 78–91. [Google Scholar]
- Pando-Moreno, M.; Pulido, R.; Castillo, D.; Jurado, E.; Jiménez, J. Estimating fiber for lechuguilla (Agave lecheguilla Torr., Agavaceae), a traditional non-timber forest product in Mexico. For. Ecol. Manag. 2008, 255, 3686–3690. [Google Scholar] [CrossRef]
- Pando-Moreno, M.; Eufracio, O.; Jurado, E.; Estrada, E. Post-harvest growth of lechuguilla (Agave lecheguilla Torr., agavaceae) in northeastern Mexico. Econ. Bot. 2004, 58, 78–82. [Google Scholar] [CrossRef]
- Secretaría de Medio Ambiente y Recursos Naturales (SEMARNAT). Norma Oficial Mexicana NOM-008-SEMARNAT-1996 que Establece los Procedimientos, Criterios y Especificaciones para Realizar el Aprovechamiento de Cogollos. D. Of. Fed. 2003, 10. Available online: http://www.profepa.gob.mx/innovaportal/file/3310/1/nom-008-semarnat-1996.pdf (accessed on 3 November 2021).
- Palomo-Briones, R.; López-Gutiérrez, I.; Islas-Lugo, F.; Galindo-Hernández, K.L.; Munguía-Aguilar, D.; Rincón-Pérez, J.A.; Cortés-Carmona, M.Á.; Alatriste-Mondragón, F.; Razo-Flores, E. Agave bagasse biorefinery: Processing and perspectives. Clean Technol. Environ. Policy 2018, 20, 1423–1441. [Google Scholar] [CrossRef]
- Corbin, K.R.; Byrt, C.S.; Bauer, S.; Debolt, S.; Chambers, D.; Holtum, J.A.M.; Karem, G.; Henderson, M.; Lahnstein, J.; Beahan, C.T.; et al. Prospecting for energy-rich renewable raw materials: Agave leaf case study. PLoS ONE 2015, 10, e0135382. [Google Scholar]
- Pérez-Pimienta, J.A.; Mojica-Álvarez, R.M.; Sánchez-Herrera, L.M.; Mittal, A.; Sykes, R.W. Recalcitrance Assessment of the Agro-industrial Residues from Five Agave Species: Ionic Liquid Pretreatment, Saccharification and Structural Characterization. Bioenergy Res. 2018, 11, 551–561. [Google Scholar] [CrossRef]
- Rios-González, L.J.; Morales-Martínez, T.K.; Rodríguez-Flores, M.F.; Rodríguez-De la Garza, J.A.; Castillo-Quiroz, D.; Castro-Montoya, A.J.; Martinez, A. Autohydrolysis pretreatment assessment in ethanol production from agave bagasse. Bioresour. Technol. 2017, 242, 184–190. [Google Scholar] [CrossRef] [PubMed]
- Morales-Martínez, T.K.; Medina-Morales, M.A.; Ortíz-Cruz, A.L.; Rodríguez-De la Garza, J.A.; Moreno-Dávila, M.; López-Badillo, C.M.; Ríos-González, L. Consolidated bioprocessing of hydrogen production from agave biomass by Clostridium acetobutylicum and bovine ruminal fluid. Int. J. Hydrogen Energy 2020, 45, 13707–13716. [Google Scholar] [CrossRef]
- Ríos-González, L.J.; Medina-Morales, M.A.; Rodríguez-De la Garza, J.A.; Romero-Galarza, A.; Medina, D.D.; Morales-Martínez, T.K. Comparison of dilute acid pretreatment of agave assisted by microwave versus ultrasound to enhance enzymatic hydrolysis. Bioresour. Technol. 2021, 319, 124099. [Google Scholar] [CrossRef]
- Díaz-Blanco, D.I.; de La Cruz, J.R.; López-Linares, J.C.; Morales-Martínez, T.K.; Ruiz, E.; Rios-González, L.J.; Romero, I.; Castro, E. Optimization of dilute acid pretreatment of Agave lechuguilla and ethanol production by co-fermentation with Escherichia coli MM160. Ind. Crops Prod. 2018, 114, 154–163. [Google Scholar] [CrossRef]
- Bergeron, C.; Carrier, D.J.; Ramaswamy, S. Biorefinery Co-Products: Phytochemicals, Primary Metabolites and Value-Added Biomass Processing; Bergeron, C., Carrier, D.J., Ramaswamy, S., Eds.; John Wiley & Sons: Hoboken, NJ, USA, 2012. [Google Scholar]
- Oleszek, M.; Kowalska, I.; Oleszek, W. Phytochemicals in Bioenergy Crops. Phytochem. Rev. 2019, 18, 893–927. [Google Scholar] [CrossRef] [Green Version]
- Nagappan, S.; Nakkeeran, E. Biorefinery: A Concept for Co-producing Biofuel with Value-Added Products. In Environmental Biotechnology; Gothandam, K.M., Ed.; Spinger Nature Switzerland AG: Cham, Switzerland, 2020; pp. 23–52. [Google Scholar]
- Mehmood, T.; Nadeem, F.; Qamar, S.A.; Bilal, M.; Iqbal, H.M.N. Waste into Value-Added Compounds. In Sustainable Bioconversion of Waste to Value Added Products; Inamúddin, A.K., Ed.; Spinger Nature Switzerland AG: Cham, Switzerland, 2021; pp. 349–368. [Google Scholar]
- Santos-Zea, L.; Leal-Diaz, A.; Cortes-Ceballos, E.; Gutierrez-Uribe, J. Agave (Agave spp.) and its Traditional Products as a Source of Bioactive Compounds. Curr. Bioact. Compd. 2012, 8, 218–231. [Google Scholar] [CrossRef]
- Nava-Cruz, N.Y.; Medina-Morales, M.A.; Martinez, J.L.; Rodriguez, R.; Aguilar, C.N. Agave biotechnology: An overview. Crit. Rev. Biotechnol. 2015, 35, 546–559. [Google Scholar] [CrossRef]
- Barreto, M.A.S.G.; Cadavid, C.O.M.; De Oliveira Moura, R.A.; Silva, G.M.M.; Ferreira De Araújo, V.S.; Da Silva Filho, J.A.A.; Rocha, H.A.O.; Oliveira, R.D.P.; Giordani, R.B.; Ferrari, M. In vitro and in vivo antioxidant activity of Agave sisalana agro-industrial residue. Biomolecules 2020, 10, 1435. [Google Scholar] [CrossRef]
- Ahmadu, T.; Ahmad, K. An Introduction to Bioactive Natural Products and General Applications. In Bioactive Natural Products for Pharmaceutical Applications. Advanced Structured Materials; Pal, D., Nayak, A.K., Eds.; Spinger Nature Switzerland AG: Cham, Switzerland, 2021; pp. 41–91. [Google Scholar]
- Carmona, J.E.; Morales-Martínez, T.K.; Mussatto, S.I.; Castillo-Quiroz, D.; Ríos-González, L.J. Propiedades químicas, estructurales y funcionales de la lechuguilla (Agave lechuguilla Torr.). Rev. Mex. Ciencias For. 2017, 8, 100–122. [Google Scholar]
- Ahumada-Santos, Y.P.; Montes-Avila, J.; Uribe-Beltrán, M.d.J.; Díaz-Camacho, S.P.; López-Angulo, G.; Vega-Aviña, R.; López-Valenzuela, J.Á.; Heredia, J.B.; Delgado-Vargas, F. Chemical characterization, antioxidant and antibacterial activities of six Agave species from Sinaloa, Mexico. Ind. Crops Prod. 2013, 49, 143–149. [Google Scholar] [CrossRef]
- Anguiano-Sevilla, L.A.; Lugo-Cervantes, E.; Ordaz-Pichardo, C.; Rosas-Trigueros, J.L.; Jaramillo-Flores, M.E. Apoptosis induction of Agave lechuguilla Torrey extract on human lung adenocarcinoma cells (SK-LU-1). Int. J. Mol. Sci. 2018, 19, 3765. [Google Scholar] [CrossRef] [PubMed] [Green Version]
- Peña-Rodríguez, A.; Pelletier-Morreeuw, Z.; García-Luján, J.; Rodríguez-Jaramillo, M.D.C.; Guzmán-Villanueva, L.; Escobedo-Fregoso, C.; Tovar-Ramírez, D.; Reyes, A.G. Evaluation of Agave lechuguilla by-product crude extract as a feed additive for juvenile shrimp Litopenaeus vannamei. Aquac. Res. 2020, 51, 1336–1345. [Google Scholar] [CrossRef]
- Botura, M.B.; Silva, G.D.; Lima, H.G.; Oliveira, J.V.A.; Souza, T.S.; Santos, J.D.G.; Branco, A.; Moreira, E.L.T.; Almeida, M.A.O.; Batatinha, M.J.M. In vivo anthelmintic activity of an aqueous extract from sisal waste (Agave sisalana Perr.) against gastrointestinal nematodes in goats. Vet. Parasitol. 2011, 177, 104–110. [Google Scholar] [CrossRef] [PubMed] [Green Version]
- Botura, M.B.; dos Santos, J.D.G.; da Silva, G.D.; de Lima, H.G.; de Oliveira, J.V.A.; de Almeida, M.A.O.; Batatinha, M.J.M.; Branco, A. In vitro ovicidal and larvicidal activity of Agave sisalana Perr. (sisal) on gastrointestinal nematodes of goats. Vet. Parasitol. 2013, 192, 211–217. [Google Scholar] [CrossRef] [PubMed] [Green Version]
- Castillo-Reyes, F.; Hernandez-Castillo, F.D.; Clemente-Constantino, J.A.; Gallegos-Morales, G.; Rodriguez-Herrera, R.; Aguilar, C.N. In vitro antifungal activity of polyphenols-rich plant extracts against Phytophthora cinnamomi Rands. Afr. J. Agric. Res. 2015, 10, 4554–4560. [Google Scholar]
- De Rodríguez, D.J.; García, R.R.; Castillo, F.D.H.; González, C.N.A.; Galindo, A.S.; Quintanilla, J.A.V.; Zuccolotto, L.E.M. In vitro antifungal activity of extracts of Mexican Chihuahuan Desert plants against postharvest fruit fungi. Ind. Crops Prod. 2011, 34, 960–966. [Google Scholar] [CrossRef]
- Almaraz-Abarca, N.; Delgado-Alvarado, E.A.; Ávila-Reyes, J.A.; Uribe-Soto, J.N.; González-Valdez, L.S. The Phenols of the Genus Agave (Agavaceae). J. Biomater. Nanobiotechnol. 2013, 4, 9–16. [Google Scholar] [CrossRef] [Green Version]
- Almaraz-Abarca, N.; González-Elizondo, M.D.S.; Da Graça Campos, M.; Ávila-Sevilla, Z.E.; Delgado-Alvarado, E.A.; Ávila-Reyes, J.A. Variability of the foliar phenol profiles of the Agave victoriae-reginae complex (Agavaceae). Bot. Sci. 2013, 91, 295–306. [Google Scholar] [CrossRef] [Green Version]
- Morreeuw, Z.P.; Escobedo-Fregoso, C.; Ríos-González, L.J.; Castillo-Quiroz, D.; Reyes, A.G. Transcriptome-based metabolic profiling of flavonoids in Agave lechuguilla waste biomass. Plant. Sci. 2021, 305, 110748. [Google Scholar] [CrossRef] [PubMed]
- Morreeuw, Z.P.; Castillo-Quiroz, D.; Ríos-González, L.J.; Martínez-Rincón, R.; Estrada, N.; Melchor-Martínez, E.M.; Iqbal, H.M.N.; Parra-Saldívar, R.; Reyes, A.G. High throughput profiling of flavonoid abundance in Agave lechuguilla residue-valorizing under explored mexican plant. Plants 2021, 10, 695. [Google Scholar] [CrossRef] [PubMed]
- Barreca, D.; Trombetta, D.; Smeriglio, A.; Mandalari, G.; Romeo, O.; Felice, M.R.; Gattuso, G.; Nabavi, S.M. Food flavonols: Nutraceuticals with complex health benefits and functionalities. Trends Food Sci. Technol. 2021, in press. [Google Scholar] [CrossRef]
- Belwal, T.; Singh, G.; Jeandet, P.; Pandey, A.; Giri, L.; Ramola, S.; Bhatt, I.D.; Venskutonis, P.R.; Georgiev, M.I.; Clément, C.; et al. Anthocyanins, multi-functional natural products of industrial relevance: Recent biotechnological advances. Biotechnol. Adv. 2020, 43, 107600. [Google Scholar] [CrossRef]
- Ockermann, P.; Headley, L.; Lizio, R.; Hansmann, J. A review of the properties of anthocyanins and their influence on factors affecting cardiometabolic and cognitive health. Nutrients 2021, 13, 2831. [Google Scholar] [CrossRef]
- Dias, M.C.; Pinto, D.C.G.; Silva, A.M.S. Plant Flavonoids: Chemical Characteristics and Biological Activity. Molecules 2021, 26, 5377. [Google Scholar] [CrossRef]
- Bilal, M.; Iqbal, H.M.N. Sustainable bioconversion of food waste into high-value products by immobilized enzymes to meet bio-economy challenges and opportunities–A review. Food Res. Int. 2019, 123, 226–240. [Google Scholar] [CrossRef]
- Iser, M.; Valdivié, M.; Figueredo, L.; Nuñez, E.; Más, D.; Martínez, Y. Secondary metabolites, quality indicators and organoleptic characteristics of stems meal from Agave fourcroydes (Henequen). Cuba. J. Agric. Sci. 2020, 54, 25–34. [Google Scholar]
- Valdez-Vazquez, I.; Alatriste-Mondragón, F.; Arreola-Vargas, J.; Buitrón, G.; Carrillo-Reyes, J.; León-Becerril, E.; Mendez-Acosta, H.O.; Ortíz, I.; Weber, B. A comparison of biological, enzymatic, chemical and hydrothermal pretreatments for producing biomethane from Agave bagasse. Ind. Crops Prod. 2020, 145, 112160. [Google Scholar] [CrossRef]
- Antunes-Ricardo, M.; Gutiérrez-Uribe, J.A. Flavonoids. In Phenolic Compounds in Food: Characterization and Analysis; Nollet, L.M.L., Gutiérrez-Uribe, J.A., Eds.; Taylor & Francis Group, LLC: Abingdon, UK, 2018; pp. 173–183. [Google Scholar]
- Santana-Jiménez, A.Z.; Quintero-Ramos, A.; Sánchez-Madrigal, M.A.; Meléndez-Pizarro, C.O.; Valdez-Cárdenas, M.d.C.; Orizaga-Heredia, M.d.R.; Méndez-Zamora, G.; Talamás-Abbud, R. Eects of UV-C irradiation and thermal processing on the microbial and physicochemical properties of Agave tequilana Weber var. azul extracts at various pH values. Processes 2020, 8, 841. [Google Scholar] [CrossRef]
- Biesaga, M. Influence of extraction methods on stability of flavonoids. J. Chromatogr. A 2011, 1218, 2505–2512. [Google Scholar] [CrossRef]
- Huynh, N.T.; Van Camp, J.; Smagghe, G.; Raes, K. Improved release and metabolism of flavonoids by steered fermentation processes: A review. Int. J. Mol. Sci. 2014, 15, 19369–19388. [Google Scholar] [CrossRef] [PubMed]
- Leong, H.Y.; Chang, Y.K.; Ooi, C.W.; Law, C.L.; Julkifle, A.L.; Show, P.L. Liquid biphasic electric partitioning system as a novel integration process for betacyanins extraction from red-purple pitaya and antioxidant properties assessment. Front. Chem. 2019, 7, 201. [Google Scholar] [CrossRef]
- Nadar, S.S.; Rao, P.; Rathod, V.K. Enzyme assisted extraction of biomolecules as an approach to novel extraction technology: A review. Food Res. Int. 2018, 108, 309–330. [Google Scholar] [CrossRef]
- Puri, M.; Sharma, D.; Barrow, C.J. Enzyme-assisted extraction of bioactives from plants. Trends Biotechnol. 2012, 30, 37–44. [Google Scholar] [CrossRef] [PubMed]
- Antunes-Ricardo, M.; García-Cayuela, T.; Mendiola, J.A.; Ibañez, E.; Gutiérrez-Uribe, J.A.; Cano, M.P.; Guajardo-Flores, D. Supercritical CO2 enzyme hydrolysis as a pretreatment for the release of isorhamnetin conjugates from Opuntia ficus-indica (L.) Mill. J. Supercrit. Fluids 2018, 141, 21–28. [Google Scholar] [CrossRef]
- Huynh, N.T.; Smagghe, G.; Gonzales, G.B.; Van Camp, J.; Raes, K. Enzyme-assisted extraction enhancing the phenolic release from cauliflower (Brassica oleracea L. var. botrytis) outer leaves. J. Agric. Food Chem. 2014, 62, 7468–7476. [Google Scholar] [CrossRef]
- Tran, T.N.T.; Chew, K.W.; Bui, X.V.; Nguyen, T.D.P.; Le, T.T.A.; Truong, T.M.H.; Show, P.L. Optimization of isoflavones extraction from soybeans using full factorial design. J. Food Process. Preserv. 2019, 43, e14078. [Google Scholar] [CrossRef]
- Rodríguez, K.; Ah-Hen, K.S.; Vega-Gálvez, A.; Vásquez, V.; Quispe-Fuentes, I.; Rojas, P.; Lemus-Mondaca, R. Changes in bioactive components and antioxidant capacity of maqui, Aristotelia chilensis [Mol] Stuntz, berries during drying. LWT–Food Sci. Technol. 2016, 65, 537–542. [Google Scholar] [CrossRef]
- Papoutsis, K.; Pristijono, P.; Golding, J.B.; Stathopoulos, C.E.; Bowyer, M.C.; Scarlett, C.J.; Vuong, Q.V. Effect of vacuum-drying, hot air-drying and freeze-drying on polyphenols and antioxidant capacity of lemon (Citrus limon) pomace aqueous extracts. Int. J. Food Sci. Technol. 2017, 52, 880–887. [Google Scholar] [CrossRef] [Green Version]
- Quispe-Fuentes, I.; Vega-Gálvez, A.; Aranda, M. Evaluation of phenolic profiles and antioxidant capacity of maqui (Aristotelia chilensis) berries and their relationships to drying methods. J. Sci. Food Agric. 2018, 98, 4168–4176. [Google Scholar] [CrossRef] [PubMed]
- Sankaran, R.; Cruz, R.A.P.; Pakalapati, H.; Show, P.L.; Ling, T.C.; Chen, W.H.; Tao, Y. Recent advances in the pretreatment of microalgal and lignocellulosic biomass: A comprehensive review. Bioresour. Technol. 2020, 298, 122476. [Google Scholar] [CrossRef] [PubMed]
- Arslan, M.; Zareef, M.; Tahir, H.E.; Ali, S.; Xiaowei, H.; Rakha, A.; Shi, J.; Xiaobo, Z. Comparative analyses of phenolic compounds and antioxidant properties of Chinese jujube as affected by geographical region and drying methods (Puff-drying and convective hot air-drying systems). J. Food Meas. Charact. 2021, 15, 933–943. [Google Scholar] [CrossRef]
- Nemzer, B.; Vargas, L.; Xia, X.; Sintara, M.; Feng, H. Phytochemical and physical properties of blueberries, tart cherries, strawberries, and cranberries as affected by different drying methods. Food Chem. 2018, 262, 242–250. [Google Scholar] [CrossRef]
- Zhang, X.; Wang, X.; Wang, M.; Cao, J.; Xiao, J.; Wang, Q. Effects of different pretreatments on flavonoids and antioxidant activity of Dryopteris erythrosora leave. PLoS ONE 2019, 14, e0200174. [Google Scholar] [CrossRef] [Green Version]
- Giacobbe, S.; Pezzella, C.; Sannia, G.; Piscitelli, A. Old Enzymes at the Forefront of Lignocellulosic Waste Valorization. In Laccases in Bioremediation and Waste Valorisation; Schlosser, D., Ed.; Springer: Berlin, Germany, 2020; pp. 57–78. [Google Scholar]
- Antunes-Ricardo, M.; Mendiola, J.A.; García-Cayuela, T.; Ibañez, E.; Gutiérrez-Uribe, J.A.; Pilar Cano, M.; Guajardo-Flores, D. Enzyme-assisted supercritical fluid extraction of antioxidant isorhamnetin conjugates from Opuntia ficus-indica (L.) Mill. J. Supercrit. Fluids 2020, 158, 104713. [Google Scholar] [CrossRef]
- Song, Y.R.; Sung, S.K.; Shin, E.J.; Cho, C.W.; Han, C.J.; Hong, H.D. The effect of pectinase-assisted extraction on the physicochemical and biological properties of polysaccharides from Aster scaber. Int. J. Mol. Sci. 2018, 19, 2839. [Google Scholar] [CrossRef] [Green Version]
- Wang, L.; Wu, Y.; Liu, Y.; Wu, Z. Complex enzyme-assisted extraction releases antioxidative phenolic compositions from guava leaves. Molecules 2017, 22, 1648. [Google Scholar] [CrossRef]
- Chen, S.; Xing, X.H.; Huang, J.J.; Xu, M.S. Enzyme-assisted extraction of flavonoids from Ginkgo biloba leaves: Improvement effect of flavonol transglycosylation catalyzed by Penicillium decumbens cellulase. Enzyme Microb. Technol. 2011, 48, 100–105. [Google Scholar] [CrossRef]
- Saldarriaga-Hernández, S.; Velasco-Ayala, C.; Leal-Isla Flores, P.; de Jesús Rostro-Alanis, M.; Parra-Saldivar, R.; Iqbal, H.M.N.; Carrillo-Nieves, D. Biotransformation of lignocellulosic biomass into industrially relevant products with the aid of fungi-derived lignocellulolytic enzymes. Int. J. Biol. Macromol. 2020, 161, 1099–1116. [Google Scholar] [CrossRef] [PubMed]
- Huang, Z.; Feng, G.; Lin, K.; Pu, F.; Tan, Y.; Tu, W.; Han, Y.; Hou, X.; Zhang, H.; Zhang, Y. Industrial Crops & Products Significant boost in xylose yield and enhanced economic value with one-pot process using deep eutectic solvent for the pretreatment and saccharification of rice straw. Ind. Crop. Prod. 2020, 152, 112515. [Google Scholar]
- Xu, L.; He, W.; Lu, M.; Yuan, B.; Zeng, M.; Tao, G.; Qin, F.; Chen, J.; Guan, Y.; He, Z. Enzyme-assisted ultrasonic-microwave synergistic extraction and UPLC-QTOF-MS analysis of flavonoids from Chinese water chestnut peels. Ind. Crops Prod. 2018, 117, 179–186. [Google Scholar] [CrossRef]
- Ramírez-Cavazos, L.I.; Junghanns, C.; Ornelas-Soto, N.; Cárdenas-Chávez, D.L.; Hernández-Luna, C.; Demarche, P.; Enaud, E.; García-Morales, R.; Agathos, S.N.; Parra, R. Purification and characterization of two thermostable laccases from Pycnoporus sanguineus and potential role in degradation of endocrine disrupting chemicals. J. Mol. Catal. B Enzym. 2014, 108, 32–42. [Google Scholar] [CrossRef] [Green Version]
- Martins, L.O.; Melo, E.P.; Sanchez-Amat, A.; Robalo, M.P. Bacterial Laccases: Some Recent Advances and Applications. In Laccases in Bioremediation and Waste Valorisation; Schlosser, D., Ed.; Springer: Berlin, Germany, 2020; pp. 27–55. [Google Scholar]
- Pontillo, A.R.N.; Papakosta-Tsigkri, L.; Lymperopoulou, T.; Mamma, D.; Kekos, D.; Detsi, A. Conventional and enzyme-assisted extraction of rosemary leaves (Rosmarinus officinalis L.): Toward a greener approach to high added-value extracts. Appl. Sci. 2021, 11, 3724. [Google Scholar] [CrossRef]
- Kim, J.H.; Lee, H.J.; Park, Y.; Ra, K.S.; Shin, K.S.; Yu, K.W.; Suh, H.J. Mucilage removal from cactus cladodes (Opuntia humifusa Raf.) by enzymatic treatment to improve extraction efficiency and radical scavenging activity. LWT–Food Sci. Technol. 2013, 51, 337–342. [Google Scholar] [CrossRef]
- Kim, S.M.; Lim, S.T. Enhanced antioxidant activity of rice bran extract by carbohydrase treatment. J. Cereal Sci. 2016, 68, 116–121. [Google Scholar] [CrossRef]
- Cruz-Zúñiga, J.M.; Soto-Valdez, H.; Peralta, E.; Mendoza-Wilson, A.M.; Robles-Burgueño, M.R.; Auras, R.; Gámez-Meza, N. Development of an antioxidant biomaterial by promoting the deglycosylation of rutin to isoquercetin and quercetin. Food Chem. 2016, 204, 420–426. [Google Scholar] [CrossRef]
- Khan, J.; Deb, P.K.; Priya, S.; Medina, K.D.; Devi, R.; Walode, S.G.; Rudrapal, M. Dietary flavonoids: Cardioprotective potential with antioxidant effects and their pharmacokinetic, toxicological and therapeutic concerns. Molecules 2021, 26, 4021. [Google Scholar] [CrossRef]
- Singleton, V.L.; Rossi, J.A. Colorimetry of Total Phenolics with Phosphomolybdic-Phosphotungstic Acid Reagent. Am. J. Enol. Vitic. 1965, 16, 144–158. [Google Scholar]
- Lauranson-Broyer, J.; Lebreton, P. Flavonoids and morphological traits of needles, as markers of natural hybridization between Pinus uncinata Ram. and Pinus sylvestris L. Biochem. Syst. Ecol. 1993, 21, 241–247. [Google Scholar] [CrossRef]
- Mendez-Flores, A.; Hérnandez-Almanza, A.; Sáenz-Galindo, A.; Morlett-Chávez, J.; Aguilar, C.N.; Ascacio-Valdés, J. Ultrasound-assisted extraction of antioxidant polyphenolic compounds from Nephelium lappaceum L. (Mexican variety) husk. Asian Pac. J. Trop. Med. 2018, 11, 676–681. [Google Scholar]
- Brand-Williams, W.; Cuvelier, M.E.; Berset, C. Use of a free radical method to evaluate antioxidant activity. LWT–Food Sci. Technol. 1995, 28, 25–30. [Google Scholar] [CrossRef]


| LD | LL | D | S | |||||||||
|---|---|---|---|---|---|---|---|---|---|---|---|---|
| Means | SD | * | Means | SD | * | Means | SD | * | Means | SD | * | |
| F | 224.780 | 9.795 | c | 179.290 | 1.373 | ab | 194.120 | 5.180 | bc | 151.925 | 4.205 | a |
| I | 614.320 | 12.470 | b | 490.720 | 6.404 | a | 864.350 | 7.700 | c | 458.956 | 2.039 | a |
| Ca | 4.970 | 2.260 | a | 2.110 | 1.320 | a | 3.340 | 1.600 | a | 1.814 | 0.071 | a |
| Cy | 3.530 | 0.220 | b | 0.000 | 0.000 | a | 6.590 | 1.190 | c | 0.000 | 0.000 | a |
| D | 11.420 | 0.320 | b | 0.000 | 0.000 | a | 10.880 | 0.990 | b | 0.000 | 0.000 | a |
| H | 4.050 | 0.290 | b | 1.830 | 0.800 | a | 3.720 | 0.200 | b | 1.388 | 0.477 | a |
| Q | 13.730 | 0.250 | c | 12.280 | 0.680 | b | 13.620 | 0.380 | bc | 10.746 | 0.652 | a |
| A | 7.850 | 0.840 | a | 8.640 | 0.490 | a | 8.240 | 0.600 | a | 7.813 | 0.430 | a |
| K | 12.770 | 0.430 | ab | 13.170 | 0.250 | b | 12.960 | 0.310 | ab | 12.122 | 0.375 | a |
| N | 1.430 | 0.150 | a | 1.570 | 0.090 | a | 1.500 | 0.110 | a | 1.239 | 0.189 | a |
| Unprocessed | Processed | ||||
|---|---|---|---|---|---|
| Mean | SD | Mean | SD | ||
| Yield (% DW) | 31.65 ± 1.65 | 35.53 ± 1.72 | * | ||
| TPC (mg GAE/g DW) | 12.81 ± 0.73 | 15.06 ± 1.21 | * | ||
| TFC (mg QE/g DW) | 6.41 ± 1.02 | 7.06 ± 0.98 | |||
| AA (%I DPPH) | 35.59 ± 2.68 | 41.31 ± 2.14 | * | ||
| Flavonoids (µg/g DW) | |||||
| Flavanone | 194.120 ± 5.180 | 147.238 ± 5.390 | * | ||
| Isorhamnetin | 864.350 ± 7.700 | 752.796 ± 2.908 | * | ||
| Catechin | 3.340 ± 1.600 | 4.377 ± 0.500 | |||
| Cyanidin | 6.590 ± 1.190 | 10.481 ± 2.605 | * | ||
| Delphinidin | 10.880 ± 0.990 | 21.549 ± 3.794 | * | ||
| Hesperidin | 3.720 ± 0.200 | 4.690 ± 0.187 | * | ||
| Quercetin | 13.620 ± 0.380 | 13.481 ± 0.318 | |||
| Apigenin | 8.240 ± 0.600 | 3.252 ± 0.608 | * | ||
| Kaempferol | 12.960 ± 0.310 | 13.482 ± 0.311 | |||
| Naringenin | 1.500 ± 0.110 | 1.682 ± 0.111 | |||
Publisher’s Note: MDPI stays neutral with regard to jurisdictional claims in published maps and institutional affiliations. |
© 2021 by the authors. Licensee MDPI, Basel, Switzerland. This article is an open access article distributed under the terms and conditions of the Creative Commons Attribution (CC BY) license (https://creativecommons.org/licenses/by/4.0/).
Share and Cite
Morreeuw, Z.P.; Ríos-González, L.J.; Salinas-Salazar, C.; Melchor-Martínez, E.M.; Ascacio-Valdés, J.A.; Parra-Saldívar, R.; Iqbal, H.M.N.; Reyes, A.G. Early Optimization Stages of Agave lechuguilla Bagasse Processing toward Biorefinement: Drying Procedure and Enzymatic Hydrolysis for Flavonoid Extraction. Molecules 2021, 26, 7292. https://doi.org/10.3390/molecules26237292
Morreeuw ZP, Ríos-González LJ, Salinas-Salazar C, Melchor-Martínez EM, Ascacio-Valdés JA, Parra-Saldívar R, Iqbal HMN, Reyes AG. Early Optimization Stages of Agave lechuguilla Bagasse Processing toward Biorefinement: Drying Procedure and Enzymatic Hydrolysis for Flavonoid Extraction. Molecules. 2021; 26(23):7292. https://doi.org/10.3390/molecules26237292
Chicago/Turabian StyleMorreeuw, Zoé P., Leopoldo J. Ríos-González, Carmen Salinas-Salazar, Elda M. Melchor-Martínez, Juan A. Ascacio-Valdés, Roberto Parra-Saldívar, Hafiz M. N. Iqbal, and Ana G. Reyes. 2021. "Early Optimization Stages of Agave lechuguilla Bagasse Processing toward Biorefinement: Drying Procedure and Enzymatic Hydrolysis for Flavonoid Extraction" Molecules 26, no. 23: 7292. https://doi.org/10.3390/molecules26237292
APA StyleMorreeuw, Z. P., Ríos-González, L. J., Salinas-Salazar, C., Melchor-Martínez, E. M., Ascacio-Valdés, J. A., Parra-Saldívar, R., Iqbal, H. M. N., & Reyes, A. G. (2021). Early Optimization Stages of Agave lechuguilla Bagasse Processing toward Biorefinement: Drying Procedure and Enzymatic Hydrolysis for Flavonoid Extraction. Molecules, 26(23), 7292. https://doi.org/10.3390/molecules26237292