
Investigating Carnivore Guild Structure: Spatial and Temporal Relationships amongst Threatened Felids in Myanmar

 , ,
, , 
Abstract
:1. Introduction
2. Materials and Methods
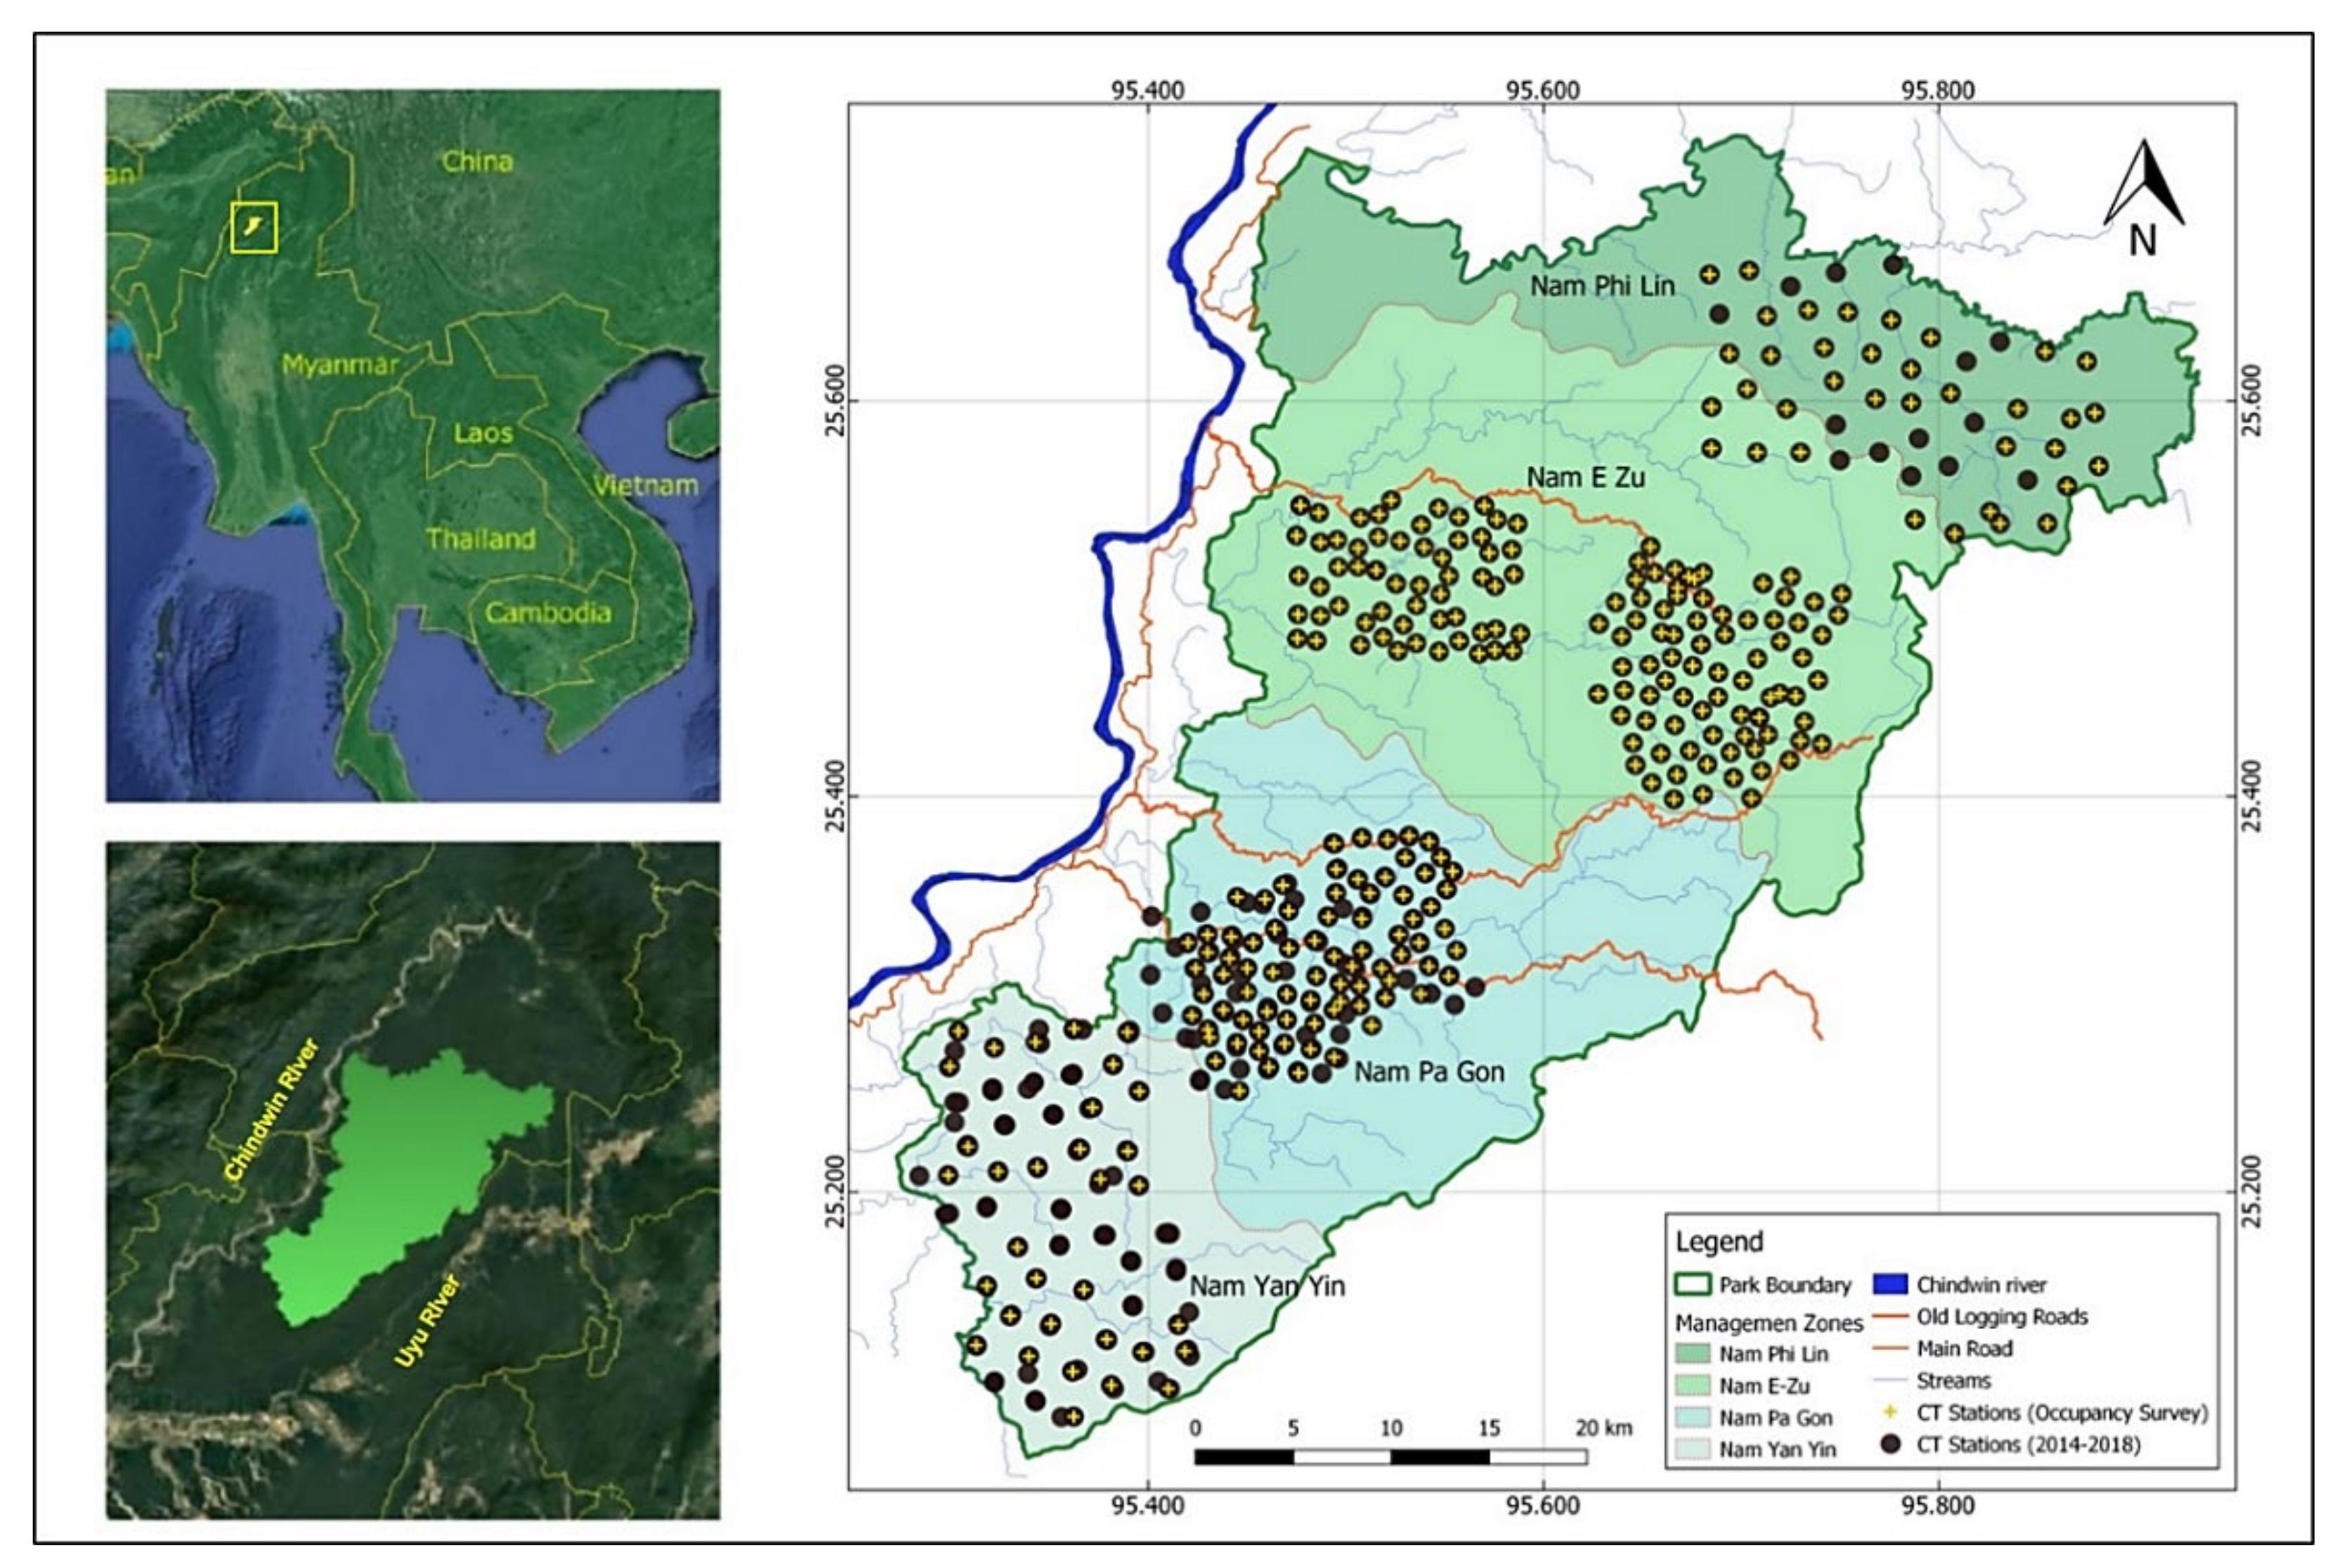
2.1. Study Area
2.2. Camera Trap Surveys
2.3. Space Use and Species Interaction
2.4. Temporal Activity and Overlap
2.5. Multi-Dimensional Spatio-Temporal Overlap
2.6. Multivariate Evaluation of Support for All Hypotheses
3. Results
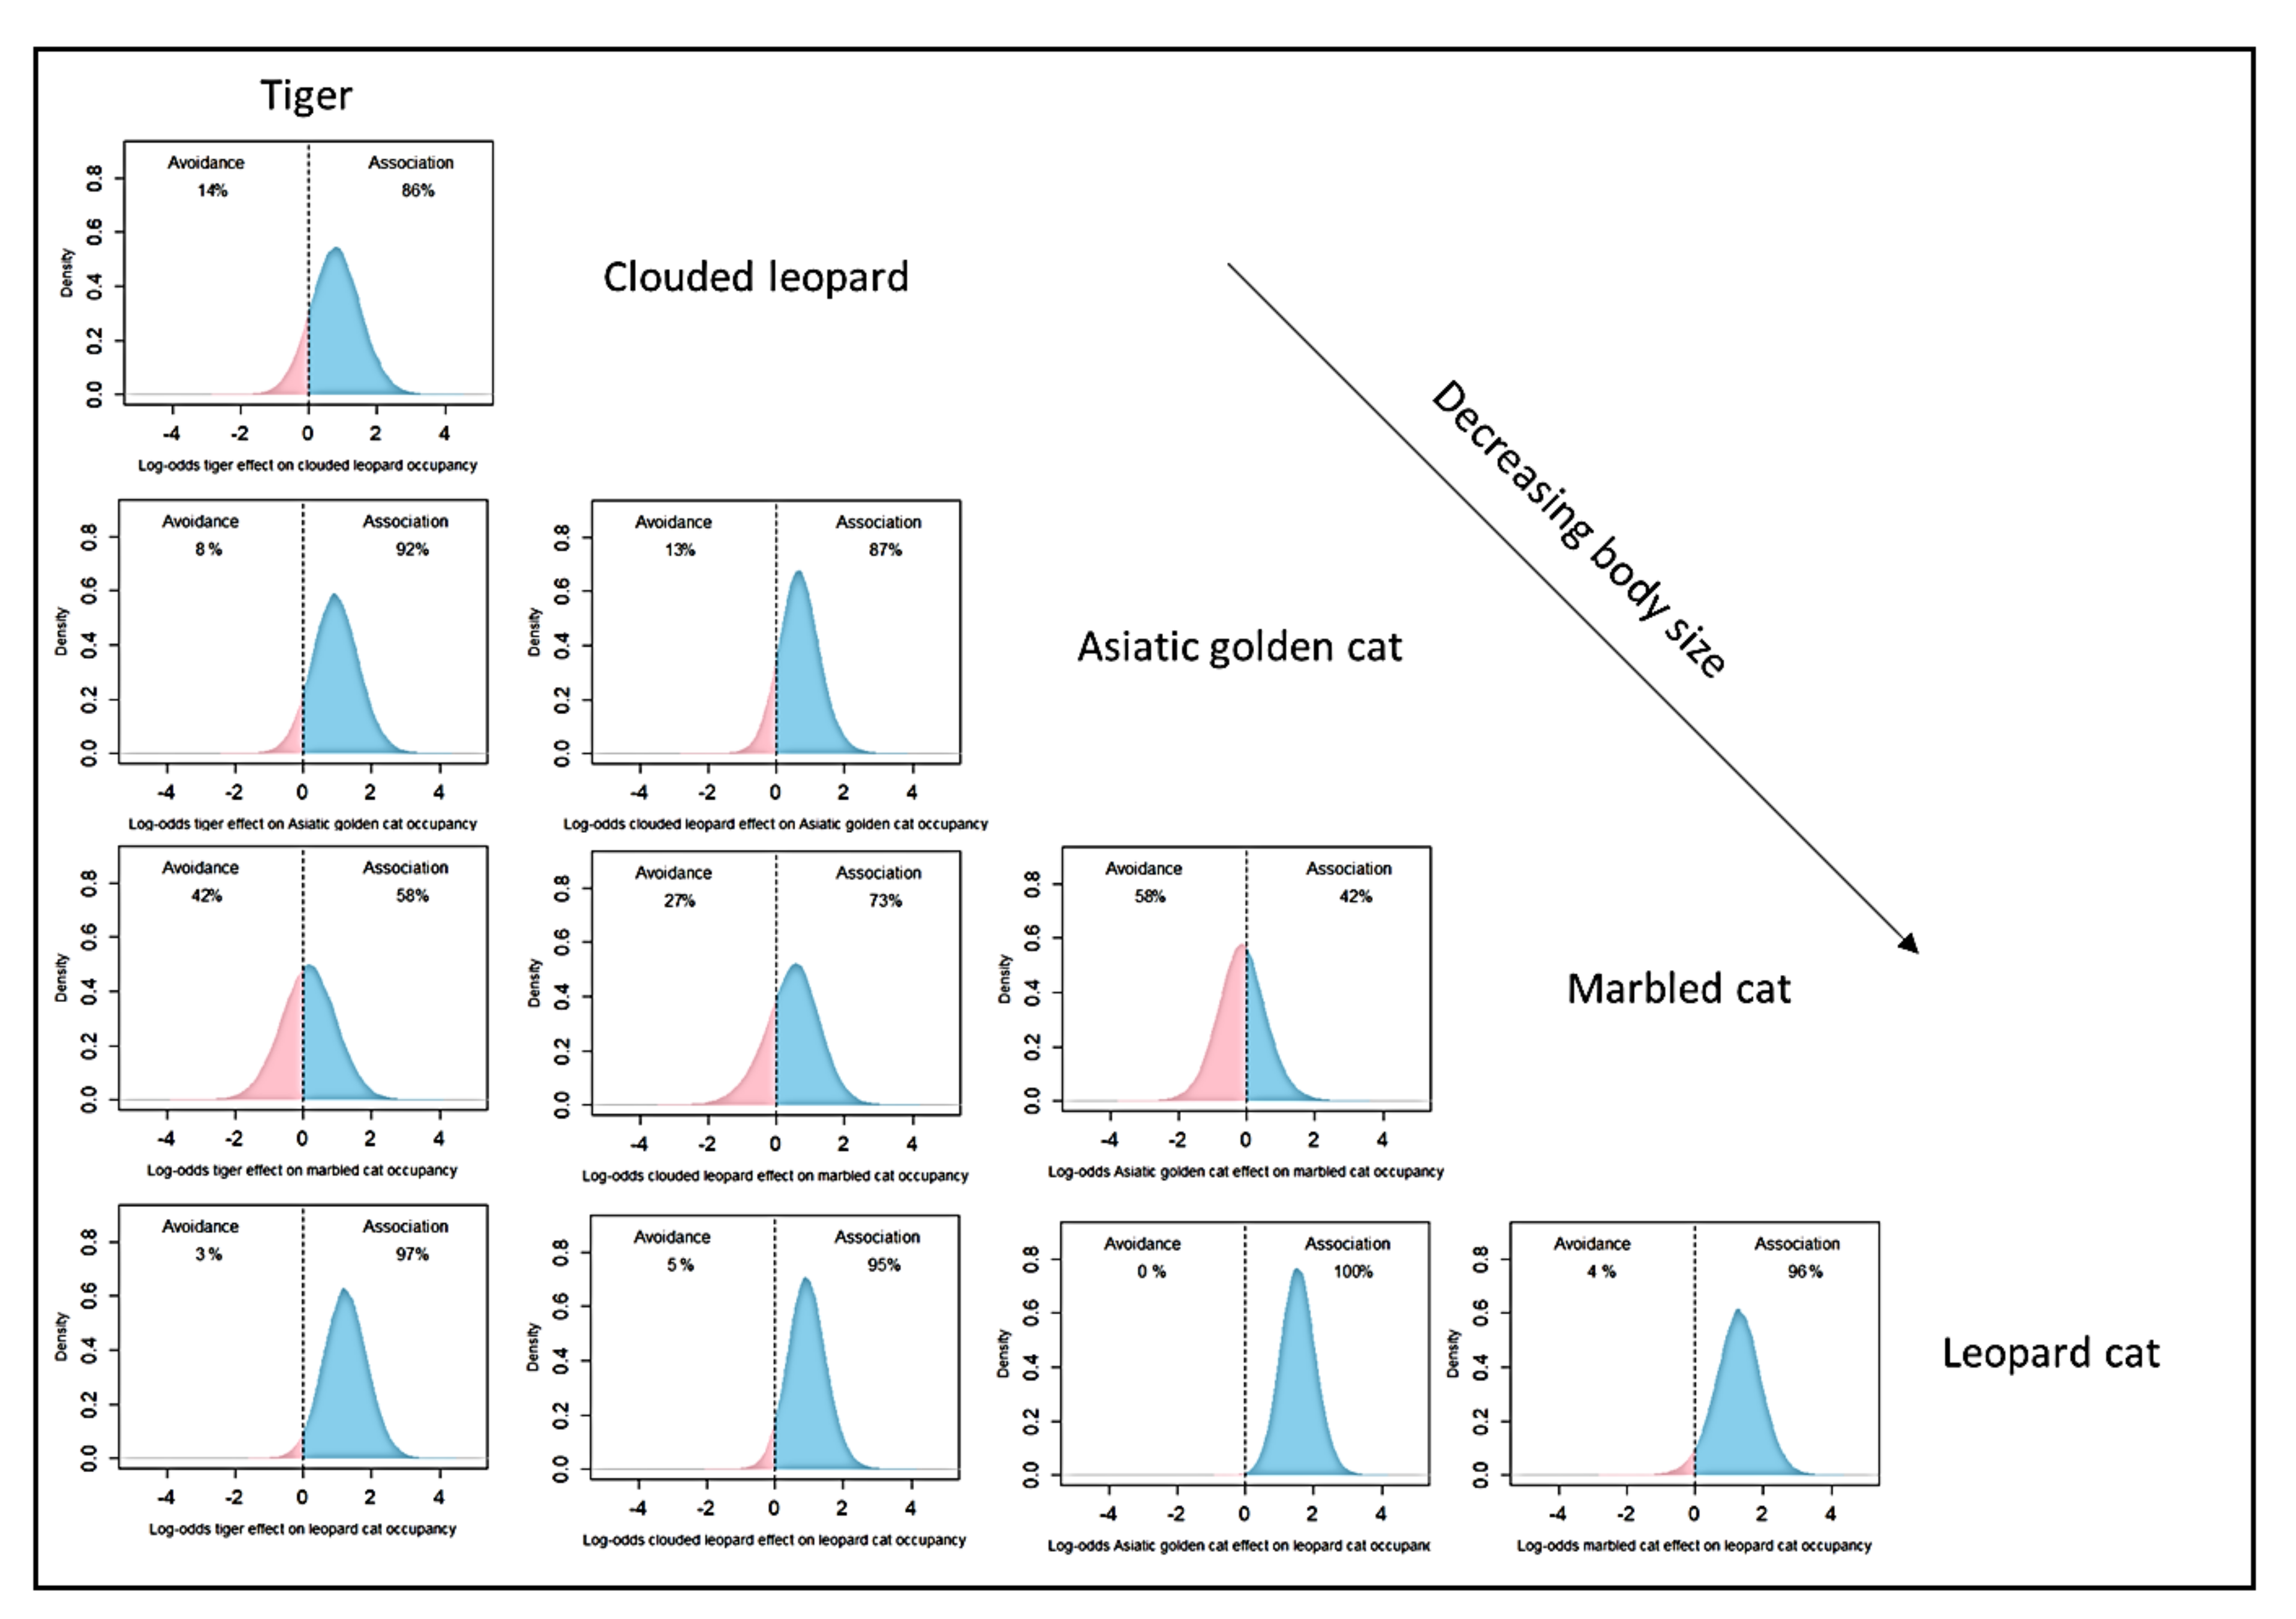
3.1. Space Use
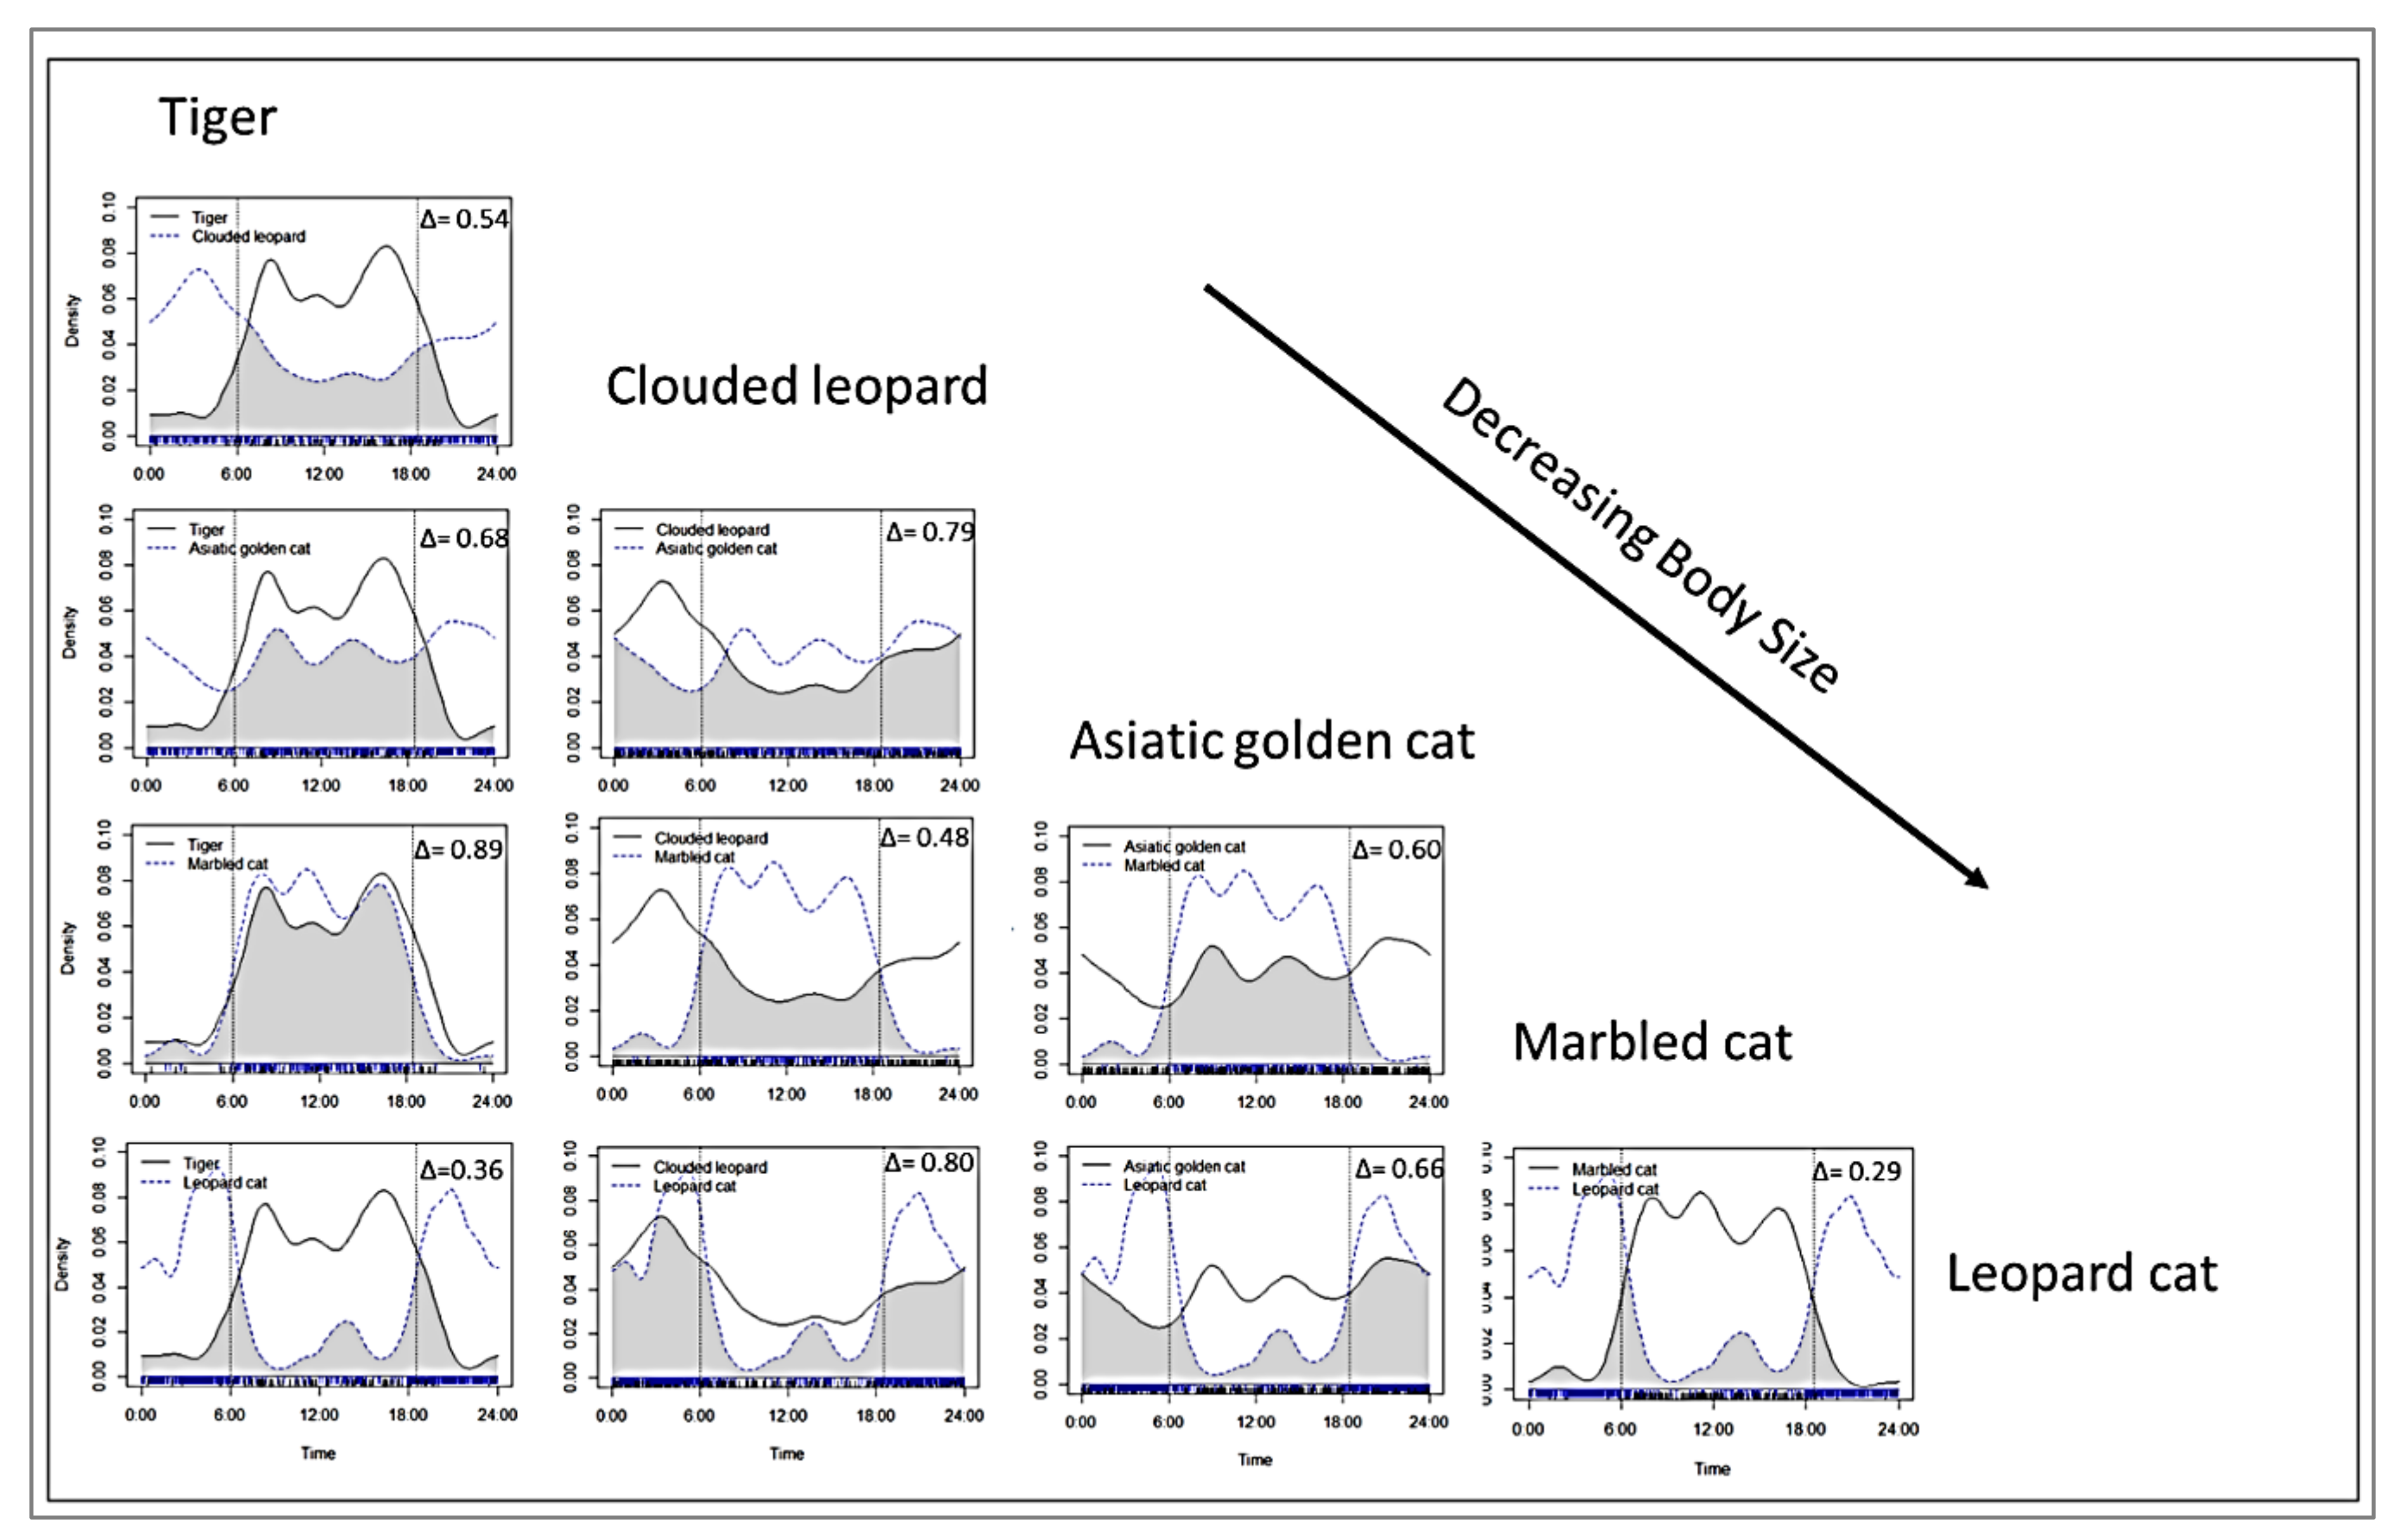
3.2. Activity Pattern and Temporal Overlap
3.3. Multi-Dimensional Spatio-Temporal Overlap
3.4. Multivariate Analysis of Hypothesis Support
4. Discussion
4.1. Multi-Model Evaluation of Hypotheses
4.2. Conservation Implications
4.3. Scope and Limitations
5. Conclusions
Supplementary Materials
Author Contributions
Funding
Data Availability Statement
Acknowledgments
Conflicts of Interest
References
- Hutchinson, G.E. Concluding remarks. Population studies: Animal ecology and demography. Cold Spring Harb. Symp. Quant. Biol. 1957, 22, 415–427. [Google Scholar] [CrossRef]
- Hegel, T.M.; Mysterud, A.; Huettmann, F.; Stenseth, N.C. Interacting effect of wolves and climate on recruitment in a northern mountain caribou population. Oikos 2010, 119, 1453–1461. [Google Scholar] [CrossRef]
- Blonder, B. Hypervolume concepts in niche- and trait-based ecology. Ecography (Cop.) 2018, 41, 1441–1455. [Google Scholar] [CrossRef]
- Mayor, S.J.; Schneider, D.C.; Schaefer, J.A.; Mahoney, S.P. Habitat selection at multiple scales. Ecoscience 2009, 16, 238–247. [Google Scholar] [CrossRef]
- Hardin, G. The Competitive Exclusion Principle. Science 1960, 131, 1292–1297. [Google Scholar] [CrossRef] [PubMed] [Green Version]
- Dayan, T.; Simberloff, D.; Yom-tov, Y. Inter- and intraspecific character displacement in mustelids. Ecol. Res. 1989, 70, 1526–1539. [Google Scholar] [CrossRef]
- Macdonald, D.W.; Sillero-zubiri, C. The Biology and Conservation of Wild Canids; Oxford University Press: New York, NY, USA, 2004. [Google Scholar]
- Macdonald, D.W.; Newman, C.; Harrington, L.A. Biology and Conservation of Musteloids; Oxford University Press: New York, NY, USA, 2017. [Google Scholar]
- Hearn, A.J.; Cushman, S.A.; Ross, J.; Goossens, B.; Hunter, L.T.B.; Macdonald, D.W. Spatio-temporal ecology of sympatric felids on Borneo. Evidence for resource partitioning? PLoS ONE 2018, 13, e0200828. [Google Scholar] [CrossRef]
- Macdonald, D.W.; Loveridge, A.J.; Nowell, K. Dramatis personae: An introduction to the wild felids. In The Biodiversity and Conservation of Wild Felids; Macdonald, D.W., Loveridge, A.J., Eds.; Oxford University Press: New York, NY, USA, 2010; pp. 3–58. [Google Scholar]
- Macdonald, D.W.; Loveridge, A.J. Biology and Conservation of Wild Felids; Oxford University Press: New York, NY, USA, 2010. [Google Scholar]
- De Oliveira, T.G.; Tortato, M.A.; Silveira, L.; Kasper, B.C.; Mazim, F.D.; Lucherini, M.; Jacomo, A.T.; Soares, J.B.G.; Marques, R.V.; Sunquist, M. Ocelot ecology and its effect on the small-felid guild in the lowland neotropics. In Biology and Conservation of Wild Felids; MacDonald, D.W., Loveridge, A.J., Eds.; Oxford University Press: New York, NY, USA, 2010; pp. 559–580. [Google Scholar]
- Crooks, K.; Soule, M. Mesopredator release and avifaunal extinctions in a fragmented system. Nature 1999, 400, 563–566. [Google Scholar] [CrossRef]
- Myers, N.; Mittermeier, R.A.; Mittermeier, C.G.; da Fonseca, G.A.B.; Kent, J. Biodiversity hotspots for conservation priorities. Nature 2000, 403, 853–858. [Google Scholar] [CrossRef]
- Kaszta, Ż.; Cushman, S.A.; Macdonald, D.W. Prioritizing habitat core areas and corridors for a large carnivore across its range. Anim. Conserv. 2020, in press. [Google Scholar] [CrossRef]
- Estes, J.A. Predators and ecosystem management. Wildl. Soc. Bull. 1996, 24, 390–396. [Google Scholar]
- Caro, T. Behavior and conservation: A bridge too far? Trends Ecol. Evol. 2007, 22, 394–400. [Google Scholar] [CrossRef]
- Macdonald, D.W.; Bothwell, H.M.; Kaszta, Ż.; Ash, E.; Bolongon, G.; Burnham, D.; Can, Ö.E.; Campos-Arceiz, A.; Channa, P.; Clements, G.R.; et al. Multi-scale habitat modelling identifies spatial conservation priorities for mainland clouded leopards (Neofelis nebulosa). Divers. Distrib. 2019, 25, 1639–1654. [Google Scholar] [CrossRef] [Green Version]
- Can, Ö.E.; Yadav, B.P.; Johnson, P.J.; Ross, J.; D’Cruze, N.; Macdonald, D.W. Factors affecting the occurrence and activity of clouded leopards, common leopards and leopard cats in the Himalayas. Biodivers. Conserv. 2020, 29, 839–851. [Google Scholar] [CrossRef] [Green Version]
- Cheyne, S.M.; MacDonald, D.W. Wild felid diversity and activity patterns in Sabangau peat-swamp forest, Indonesian Borneo. Oryx 2011, 45, 119–124. [Google Scholar] [CrossRef] [Green Version]
- Singh, P.; Macdonald, D.W. Populations and activity patterns of clouded leopards and marbled cats in Dampa Tiger Reserve, India. J. Mammal. 2017, 98, 1453–1462. [Google Scholar] [CrossRef] [Green Version]
- Haidir, I.A.; Macdonald, D.W.; Linkie, M. Assessing the spatiotemporal interactions of mesopredators in Sumatra’s tropical rainforest. PLoS ONE 2018, 13, e0202876. [Google Scholar] [CrossRef] [Green Version]
- Haidir, I.A.; Dinata, Y.; Linkie, M.; Macdonald, D.W. Asiatic golden cat and Sunda clouded leopard occupancy in the Kerinci Seblat landscape, West-Central Sumatra. CatNews 2013, 59, 7–10. [Google Scholar]
- Odden, M.; Wegge, P.; Fredriksen, T. Do tigers displace leopards? If so, why? Ecol. Res. 2010, 25, 875–881. [Google Scholar] [CrossRef]
- Arino, O.; Ramos Perez, J.J.; Kalogirou, V.; Bontemps, S.; Defourny, P.; Van Bogaert, E. Global Land Cover Map for 2009 (GlobCover 2009). Available online: https://doi.org/10.1594/PANGAEA.787668 (accessed on 5 January 2020).
- Naing, H.; Ross, J.; Burnham, D.; Htun, S.; Macdonald, D.W. Population density estimates and conservation concern for clouded leopards Neofelis nebulosa, marbled cats Pardofelis marmorata and tigers Panthera tigris in Htamanthi Wildlife Sanctuary, Sagaing, Myanmar. Oryx 2019, 53, 654–662. [Google Scholar] [CrossRef] [Green Version]
- Rabinowitz, A.; Schaller, G.B.; Uga, U. A survey to assess the status of Sumatran rhinoceros and other large mammal species in Tamanthi Wildlife Sanctuary, Myanmar. Oryx 1995, 29, 123–128. [Google Scholar] [CrossRef] [Green Version]
- BRSoftware BR’s EXIFextracter. Available online: https://www.br-software.com/extracter.html (accessed on 22 May 2019).
- PantheraCameraTrap Camera Trap File Manager. Available online: http://pantheracameratrap.org (accessed on 13 March 2018).
- Olliff, E.R.R.; Cline, C.W.; Bruen, D.C.; Yarmchuk, E.J.; Pickles, R.S.A.; Hunter, L. The Panthercam-a camera-trap optimized for monitoring wild felids. Wild Felid Monit. 2013, 7, 21–28. [Google Scholar]
- Davey, K.; Wacher, T.; Amin, R. Analysis tool for camera trap survey data, ZSL. (In Prep). 2015. [Google Scholar]
- MacKenzie, D.I.; Nichols, J.D.; Lachman, G.B.; Droege, S.; Royle, A.A.; Langtimm, C.A. Estimating site occupancy rates when detection probabilities are less than one. Ecology 2002, 83, 2248–2255. [Google Scholar] [CrossRef]
- MacKenzie, D.I.; Nichols, J.D.; Royle, J.A.; Pollock, K.H.; Bailey, L.L.; Hines, J.E. Occupancy Estimation and Modeling: Inferring Patterns and Dynamics of Species Occurrence, 2nd ed.; Academic Press: London, UK, 2017. [Google Scholar]
- Bischof, R.; Ali, H.; Kabir, M.; Hameed, S.; Nawaz, M.A. Being the underdog: An elusive small carnivore uses space with prey and time without enemies. J. Zool. 2014, 293, 40–48. [Google Scholar] [CrossRef] [Green Version]
- Waddle, J.H.; Dorazio, R.M.; Walls, S.C.; Rice, K.G.; Schuman, M.J.; Mazzotti, F.J.; Waddle, J.H.; Dorazio, R.M.; Walls, S.C.; Rice, K.G.; et al. A new parameterization for estimating co-occurrence of interacting species. Ecol. Appl. 2010, 20, 1467–1475. [Google Scholar] [CrossRef] [Green Version]
- Northrup, J.M.; Gerber, B.D. A comment on priors for Bayesian occupancy models. PLoS ONE 2018, 13, e0192819. [Google Scholar] [CrossRef]
- Gelman, A.; Carlin, J.B.; Stern, H.S.; Dunson, D.B.; Vehtari, A.; Rubin, D.B. Bayesian Data Analysis, 3rd ed.; Chapman and Hall/CRC: London, UK, 2013. [Google Scholar]
- Gelman, A.; Rubin, D.B. Inference from iterative simulation using multiple sequences. Stat. Sci. 1992, 7, 457–472. [Google Scholar] [CrossRef]
- Su, Y.-S.; Yajima, M. Using R to Run “JAGS”. Available online: https://cran.r-project.org/package=R2jags (accessed on 9 December 2020).
- R Core Team R: A Language and Environment for Statistical Computing. Available online: http://www.r-project.org/ (accessed on 12 September 2020).
- Plummer, M. JAGS: A Program for Analysis of Bayesian Graphical Models Using Gibbs Sampling; 2003. Available online: https://www.r-project.org/conferences/DSC-2003/Proceedings/Plummer.pdf (accessed on 12 November 2021).
- Lynam, A.J.; Jenks, K.E.; Steinmetz, R.; Reed, D.H. Terrestrial activity patterns of wild cats from camera-trapping. Raffles Bull. Zool. 2013, 61, 407–415. [Google Scholar]
- Linkie, M.; Ridout, M. Assessing tiger-prey interactions in Sumatran rainforests. J. Zool. 2011, 284, 224–229. [Google Scholar] [CrossRef]
- Wand, M.P.; Jones, M.C. Kernal Smoothing, 1st ed.; Chapman and Hall/CRC: New York, NY, USA, 1994; ISBN 9780412552700. [Google Scholar]
- Meredith, M.; Ridout, M.S. Overview of the Overlap Package. Available online: https://cran.r-project.org/web/packages/overlap/vignettes/overlap.pdf (accessed on 9 December 2020).
- Ridout, M.S.; Linkie, M. Estimating overlap of daily activity patterns from camera trap data. J. Agric. Biol. Environ. Stat. 2009, 14, 322–337. [Google Scholar] [CrossRef]
- Mantel, N. The Detection of Disease Clustering and a Generalized Regression Approach. Cancer Res. 1967, 27, 209–220. [Google Scholar] [PubMed]
- Legendre, P.; Legendre, L. Numerical Ecology; Elsevier: Amsterdam, The Netherlands, 1998. [Google Scholar]
- Ash, E.; Cushman, S.A.; Macdonald, D.W.; Redford, T.; Kaszta, Ż. How important are resistance, dispersal ability, population density and mortality in temporally dynamic simulations of population connectivity? A case study of tigers in Southeast Asia. Land 2020, 9, 415. [Google Scholar] [CrossRef]
- Cushman, S.A.; McKelvey, K.S.; Hayden, J.; Schwartz, M.K. Gene flow in complex landscapes: Testing multiple hypotheses with causal modeling. Am. Nat. 2006, 168, 486–499. [Google Scholar] [CrossRef] [PubMed] [Green Version]
- Cushman, S.A.; Max, T.; Meneses, N.; Evans, L.M.; Ferrier, S.; Honchak, B.; Whitham, T.G.; Allan, G.J. Landscape genetic connectivity in a riparian foundation tree is jointly driven by climatic gradients and river networks. Ecol. Appl. 2014, 24, 1000–1014. [Google Scholar] [CrossRef] [Green Version]
- Sunquist, M.; Sunquist, F. Marbled cat Pardofelis marmorata(Martin 1837). In Wild Cats of the World; The University of Chicago Press: Chicago, IL, USA, 2002; pp. 373–376. ISBN 978-0-226-77999-7. [Google Scholar]
- Soule, M.E.; Bolger, D.T.; Alberts, A.C.; Wright, J.; Sorice, M.; Hill, S. Reconstructed dynamics of rapid extinctions of chaparral-requiring birds in urban habitat islands. Conserv. Biol. 1988, 2, 75–92. [Google Scholar] [CrossRef] [Green Version]
- Sunarto, S.; Kelly, M.J.; Parakkasi, K.; Hutajulu, M.B. Cat coexistence in central Sumatra: Ecological characteristics, spatial and temporal overlap, and implications for management. J. Zool. 2015, 296, 104–115. [Google Scholar] [CrossRef]
- McGarigal, K.; Cushman, S.A. Comparative evaluation of experimental approaches to the study of habitat fragmentation effects. Ecol. Appl. 2002, 12, 335–345. [Google Scholar] [CrossRef]
- Krebs, C.J. The experimental paradigm and long-term population studies. Int. J. Avian Sci. 1991, 133, 3–8. [Google Scholar] [CrossRef]
- Chiaverini, L.; Macdonald, D.W.; Hearn, A.J.; Cheyne, S.M.; Haidir, I.A.; Hunter, L.T.B.; Kaszta, Z.; Linkie, M.; Macdonald, E.A.; Ross, J.; et al. Hostility and tyranny in the uneasy coexistence in guilds of Sunda Islands felids, from tigers to leopard cats. Manuscript in preparation. 2020. [Google Scholar]
- Rabinowitz, A.; Andau, P.; Chai, P.P.K. The clouded leopard in Malaysian Borneo. Oryx 1987, 21, 107–111. [Google Scholar] [CrossRef]
- Hunter, L. Wild Cats of the World, 1st ed.; Bloomsbury: London, UK, 2015. [Google Scholar]
- Carter, N.H.; Shrestha, B.K.; Karki, J.B.; Pradhan, N.M.B.; Liu, J. Coexistence between wildlife and humans at fine spatial scales. Proc. Natl. Acad. Sci. USA 2012, 109, 15360–15365. [Google Scholar] [CrossRef] [Green Version]
- Carter, N.H.; Jasny, M.; Gurung, B.; Liu, J. Impacts of people and tigers on leopard spatiotemporal activity patterns in a global biodiversity hotspot. Glob. Ecol. Conserv. 2015, 3, 149–162. [Google Scholar] [CrossRef] [Green Version]
- Naha, D.; Jhala, Y.V.; Qureshi, Q.; Roy, M.; Sankar, K.; Gopal, R. Ranging, activity and habitat use by tigers in the mangrove forests of the Sundarban. PLoS ONE 2016, 11, e0152119. [Google Scholar] [CrossRef] [Green Version]
- Gordon, C.H.; Stewart, A.E. The use of logging roads by clouded leopard. Cat News 2007, 47, 12–13. [Google Scholar]
- Zaw, T.; Myint, T.; Htun, S.; Po, S.H.T.; Latt, K.T.; Maung, M.; Lynam, A.J. Status and distribution of smaller cats in Myanmar. Cat News 2014, 8, 24–30. [Google Scholar]
- Palomares, F.; Caro, T.M. Interspecific killing among mammalian carnivores. Am. Nat. 1999, 153, 492–508. [Google Scholar] [CrossRef]
- Vanak, A.T.; Fortin, D.; Thaker, M.; Ogden, M.; Owen, C.; Greatwood, S.; Slotow, R. Moving to stay in place: Behavioral mechanisms for coexistence of African large carnivores. Ecology 2013, 94, 2619–2631. [Google Scholar] [CrossRef]
- Thinley, P.; Kamler, J.; Wang, S.W.; Lham, K.; Stenkewitz, U.; Macdonald, D.W. Seasonal diet of dholes (Cuon alpinus) in northwestern Bhutan. Mamm. Biol. 2011, 76, 518–520. [Google Scholar] [CrossRef]
- Singh, P.; Srivathsa, A.; MacDonald, D.W. Conservation status of the dhole Cuon alpinus in north-east India, with a focus on Dampa Tiger Reserve, Mizoram. Oryx 2019, 54, 873–877. [Google Scholar] [CrossRef] [Green Version]
- Karanth, K.U.; Sunquist, M.E. Behavioural correlates of predation by tiger (Panthera tigris), leopard (Panthera pardus) and dhole (Cuon alpinus) in Nagarahole, India. J. Zool. 2000, 250, 255–265. [Google Scholar] [CrossRef]
- Venkataraman, A.B. Do dholes (Cuon alpinus) live in packs in response to competition with or predation by large cats? Curr. Sci. 1995, 69, 934–936. [Google Scholar]
- Naing, H.; Htun, S.; Kamler, J.F.; Burnham, D.; Macdonald, D.W. Large carnivores as potential predators of sun bears. Ursus 2019, 30, 51–57. [Google Scholar] [CrossRef]
- Connell, J.H. Diversity and the coevolution of competitors, or the ghost of competition past. Oikos 1980, 35, 131–138. [Google Scholar] [CrossRef] [Green Version]

| Clouded Leopard | Asiatic Golden Cat | Marbled Cat | Leopard Cat | |||||
|---|---|---|---|---|---|---|---|---|
| n = 823 (Δ1) | n = 1344 (Δ4) | n = 823 (Δ1) | n = 1344 (Δ4) | n = 823 (Δ1) | n = 1344 (Δ4) | n = 823 (Δ1) | n = 1344 (Δ4) | |
| Tiger | 0.6 (0.48–0.72) | 0.54 (0.45–0.63) | 0.68 (0.57–0.78) | 0.68 (0.59–0.76) | 0.88 (0.77–0.97) | 0.89 (0.81–0.97) | 0.36 (0.26–0.47) | 0.362 (0.27–0.44) |
| Clouded leopard | 0.83 (0.75–0.90) | 0.79 (0.72–0.85) | 0.525 (0.44–0.61) | 0.48 (0.41–0.55) | 0.73 (0.65–0.79) | 0.79 (0.74–0.85) | ||
| Asiatic golden cat | 0.59 (0.51–0.67) | 0.60 (0.54–0.67) | 0.64 (0.57–0.08) | 0.664 (0.61–0.72) | ||||
| Marbled cat | 0.273 (0.20–0.35) | 0.29 (0.24–0.36) | ||||||
| Paired Species | Spatial Overlap | Temporal Overlap | Index of Niche Overlap |
|---|---|---|---|
| Asiatic golden cat–Marbled cat | 0.42 | 0.6 | 0.25 |
| Marbled cat–Leopard cat | 0.96 | 0.29 | 0.28 |
| Tiger–Leopard cat | 0.97 | 0.36 | 0.35 |
| Clouded leopard–Marbled cat | 0.73 | 0.48 | 0.35 |
| Tiger–Clouded leopard | 0.86 | 0.54 | 0.46 |
| Tiger–Marbled cat | 0.58 | 0.89 | 0.52 |
| Tiger–Asiatic golden cat | 0.92 | 0.68 | 0.63 |
| Asiatic golden cat–Leopard cat | 1 | 0.66 | 0.66 |
| Clouded leopard–Asiatic golden cat | 0.87 | 0.79 | 0.69 |
| Clouded leopard–Leopard cat | 0.95 | 0.8 | 0.76 |
| Alpha Level | Hypothesis 6 | Hypothesis 5 | Hypothesis 4 | Hypothesis 3 | Hypothesis 2 | Hypothesis 1 |
|---|---|---|---|---|---|---|
| 0.2 | 1 | 0.5 | 0.5 | 0 | 0.5 | 0.5 |
| 0.1 | 1 | 0.556 | 0.111 | 0 | 0.556 | 0.444 |
| 0.05 | 1 | 1 | 0 | 0 | 0.5 | 0 |
| Alpha Level | Hypothesis 6 | Hypothesis 5 | Hypothesis 4 | Hypothesis 3 | Hypothesis 2 | Hypothesis 1 |
|---|---|---|---|---|---|---|
| 0.2 | 1 | 0.714 | 0.143 | 0.571 | 0.286 | 0.5 |
| 0.1 | 1 | 0.4 | 0 | 0.2 | 0 | 0.4 |
| 0.05 | 1 | 1 | 0 | 0 | 0 | 1 |
Publisher’s Note: MDPI stays neutral with regard to jurisdictional claims in published maps and institutional affiliations. |
© 2021 by the authors. Licensee MDPI, Basel, Switzerland. This article is an open access article distributed under the terms and conditions of the Creative Commons Attribution (CC BY) license (https://creativecommons.org/licenses/by/4.0/).
Share and Cite
Kyaw, P.P.; Macdonald, D.W.; Penjor, U.; Htun, S.; Naing, H.; Burnham, D.; Kaszta, Ż.; Cushman, S.A. Investigating Carnivore Guild Structure: Spatial and Temporal Relationships amongst Threatened Felids in Myanmar. ISPRS Int. J. Geo-Inf. 2021, 10, 808. https://doi.org/10.3390/ijgi10120808
Kyaw PP, Macdonald DW, Penjor U, Htun S, Naing H, Burnham D, Kaszta Ż, Cushman SA. Investigating Carnivore Guild Structure: Spatial and Temporal Relationships amongst Threatened Felids in Myanmar. ISPRS International Journal of Geo-Information. 2021; 10(12):808. https://doi.org/10.3390/ijgi10120808
Chicago/Turabian StyleKyaw, Pyae Phyoe, David W. Macdonald, Ugyen Penjor, Saw Htun, Hla Naing, Dawn Burnham, Żaneta Kaszta, and Samuel A. Cushman. 2021. "Investigating Carnivore Guild Structure: Spatial and Temporal Relationships amongst Threatened Felids in Myanmar" ISPRS International Journal of Geo-Information 10, no. 12: 808. https://doi.org/10.3390/ijgi10120808
APA StyleKyaw, P. P., Macdonald, D. W., Penjor, U., Htun, S., Naing, H., Burnham, D., Kaszta, Ż., & Cushman, S. A. (2021). Investigating Carnivore Guild Structure: Spatial and Temporal Relationships amongst Threatened Felids in Myanmar. ISPRS International Journal of Geo-Information, 10(12), 808. https://doi.org/10.3390/ijgi10120808