
The Pellicle–Another Strategy of the Root Apex Protection against Mechanical Stress?


Abstract
:1. Introduction
2. Materials and Methods
2.1. Plant Material
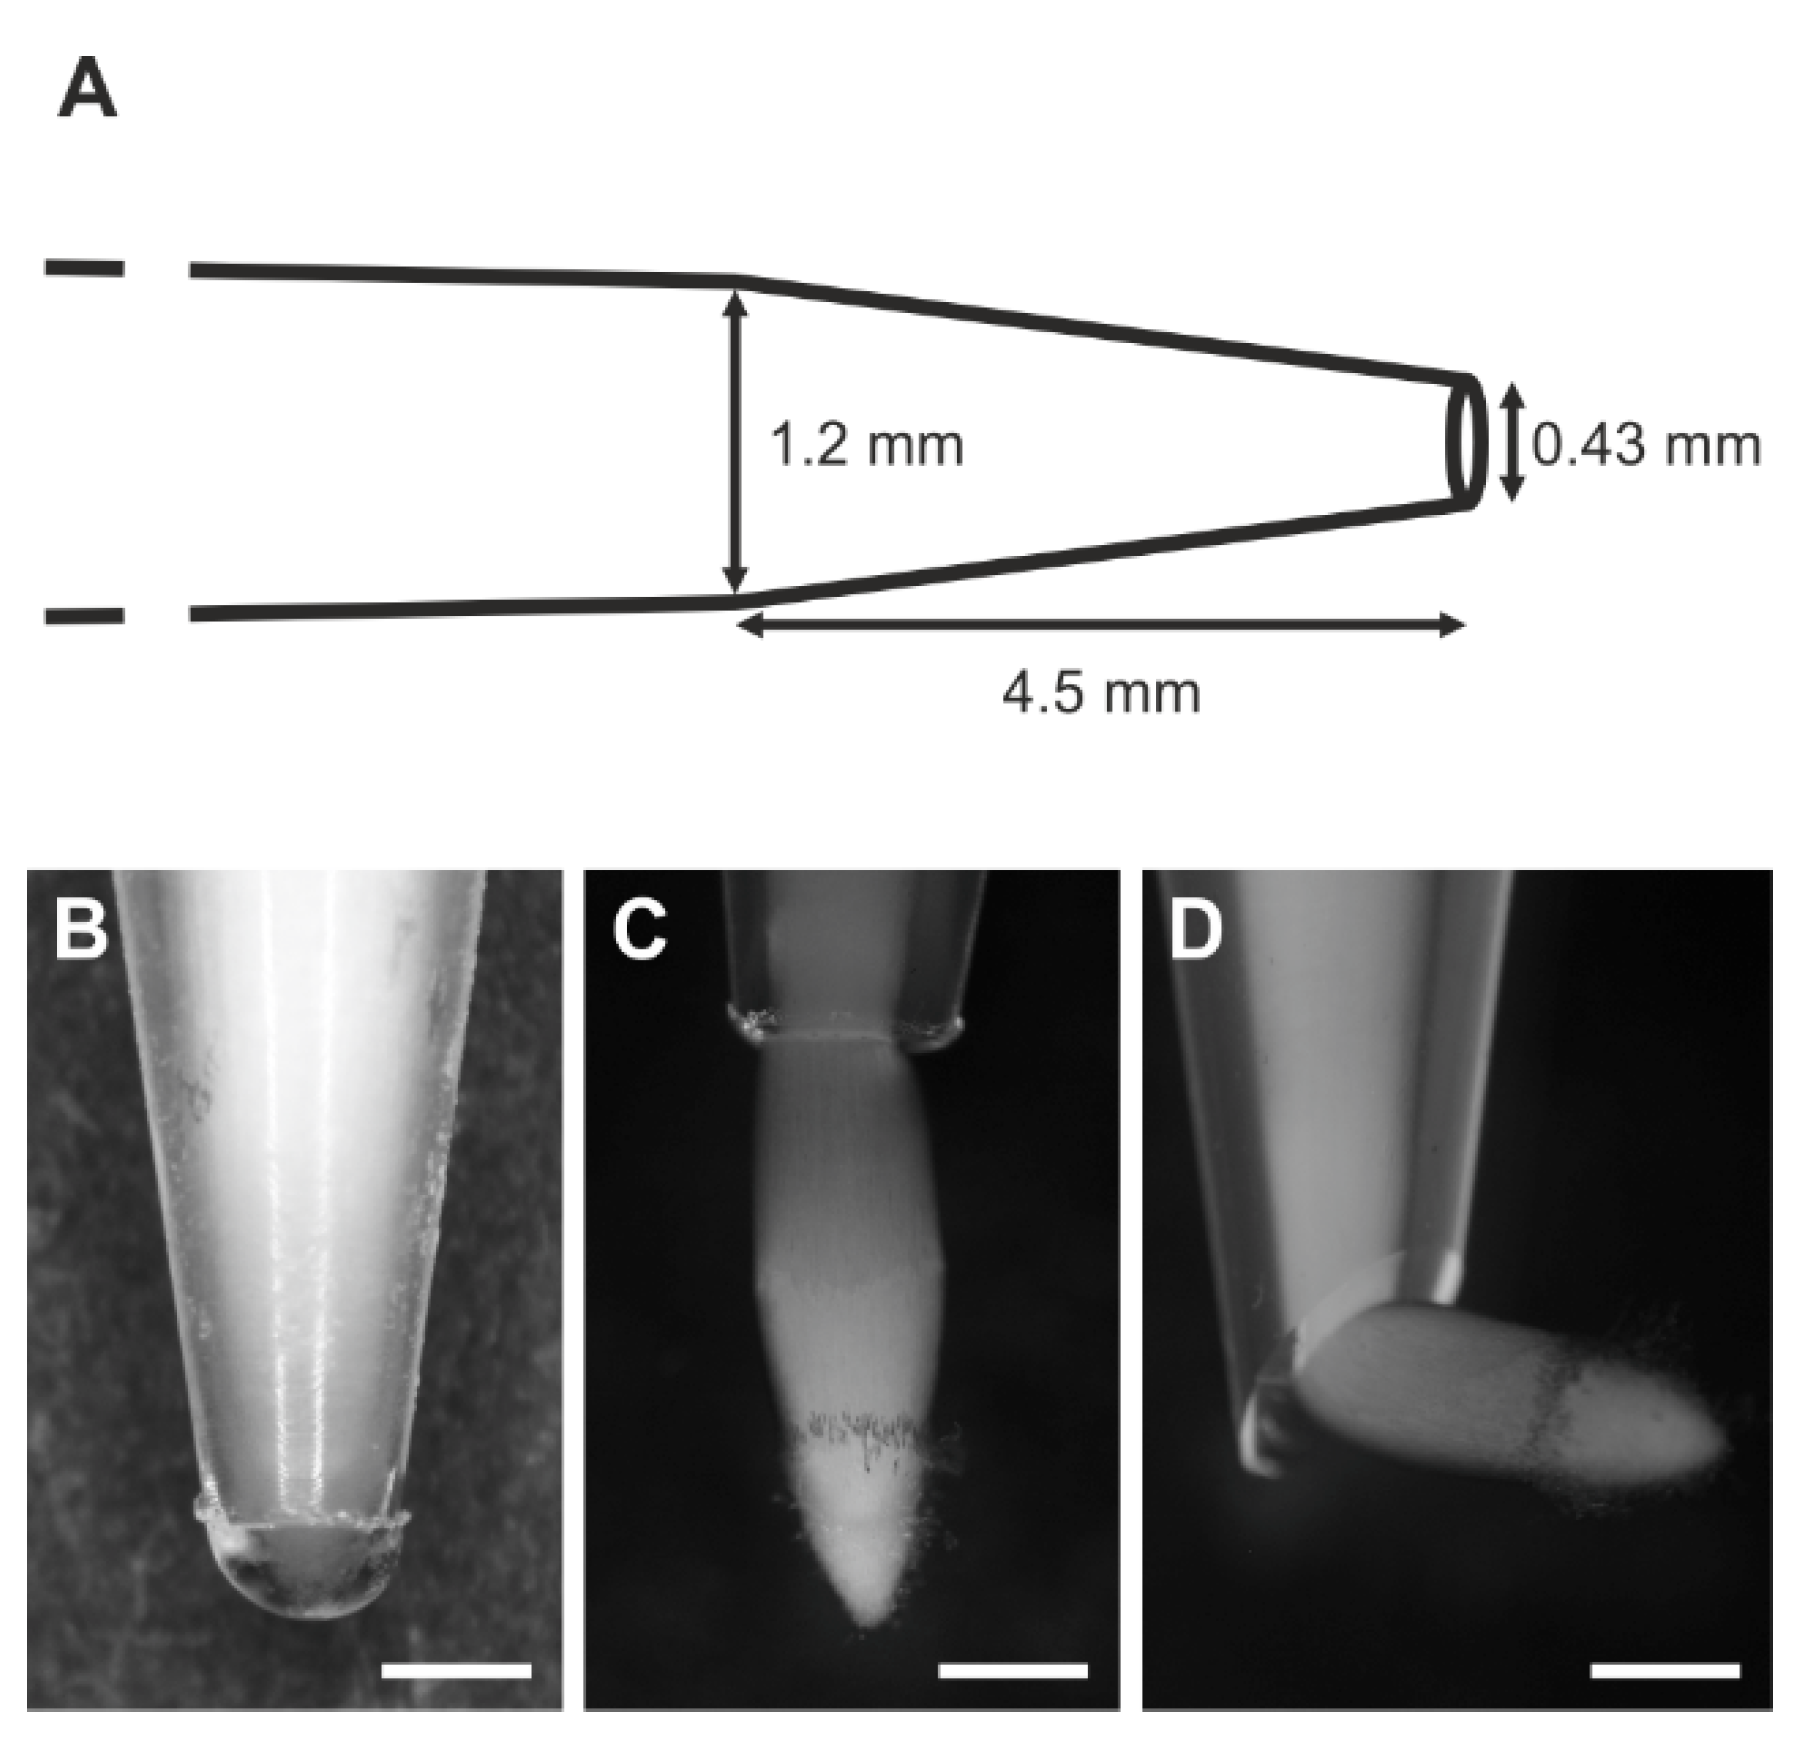
2.2. Experiment
2.3. Cell Viability Assays
2.3.1. Evans Blue Staining
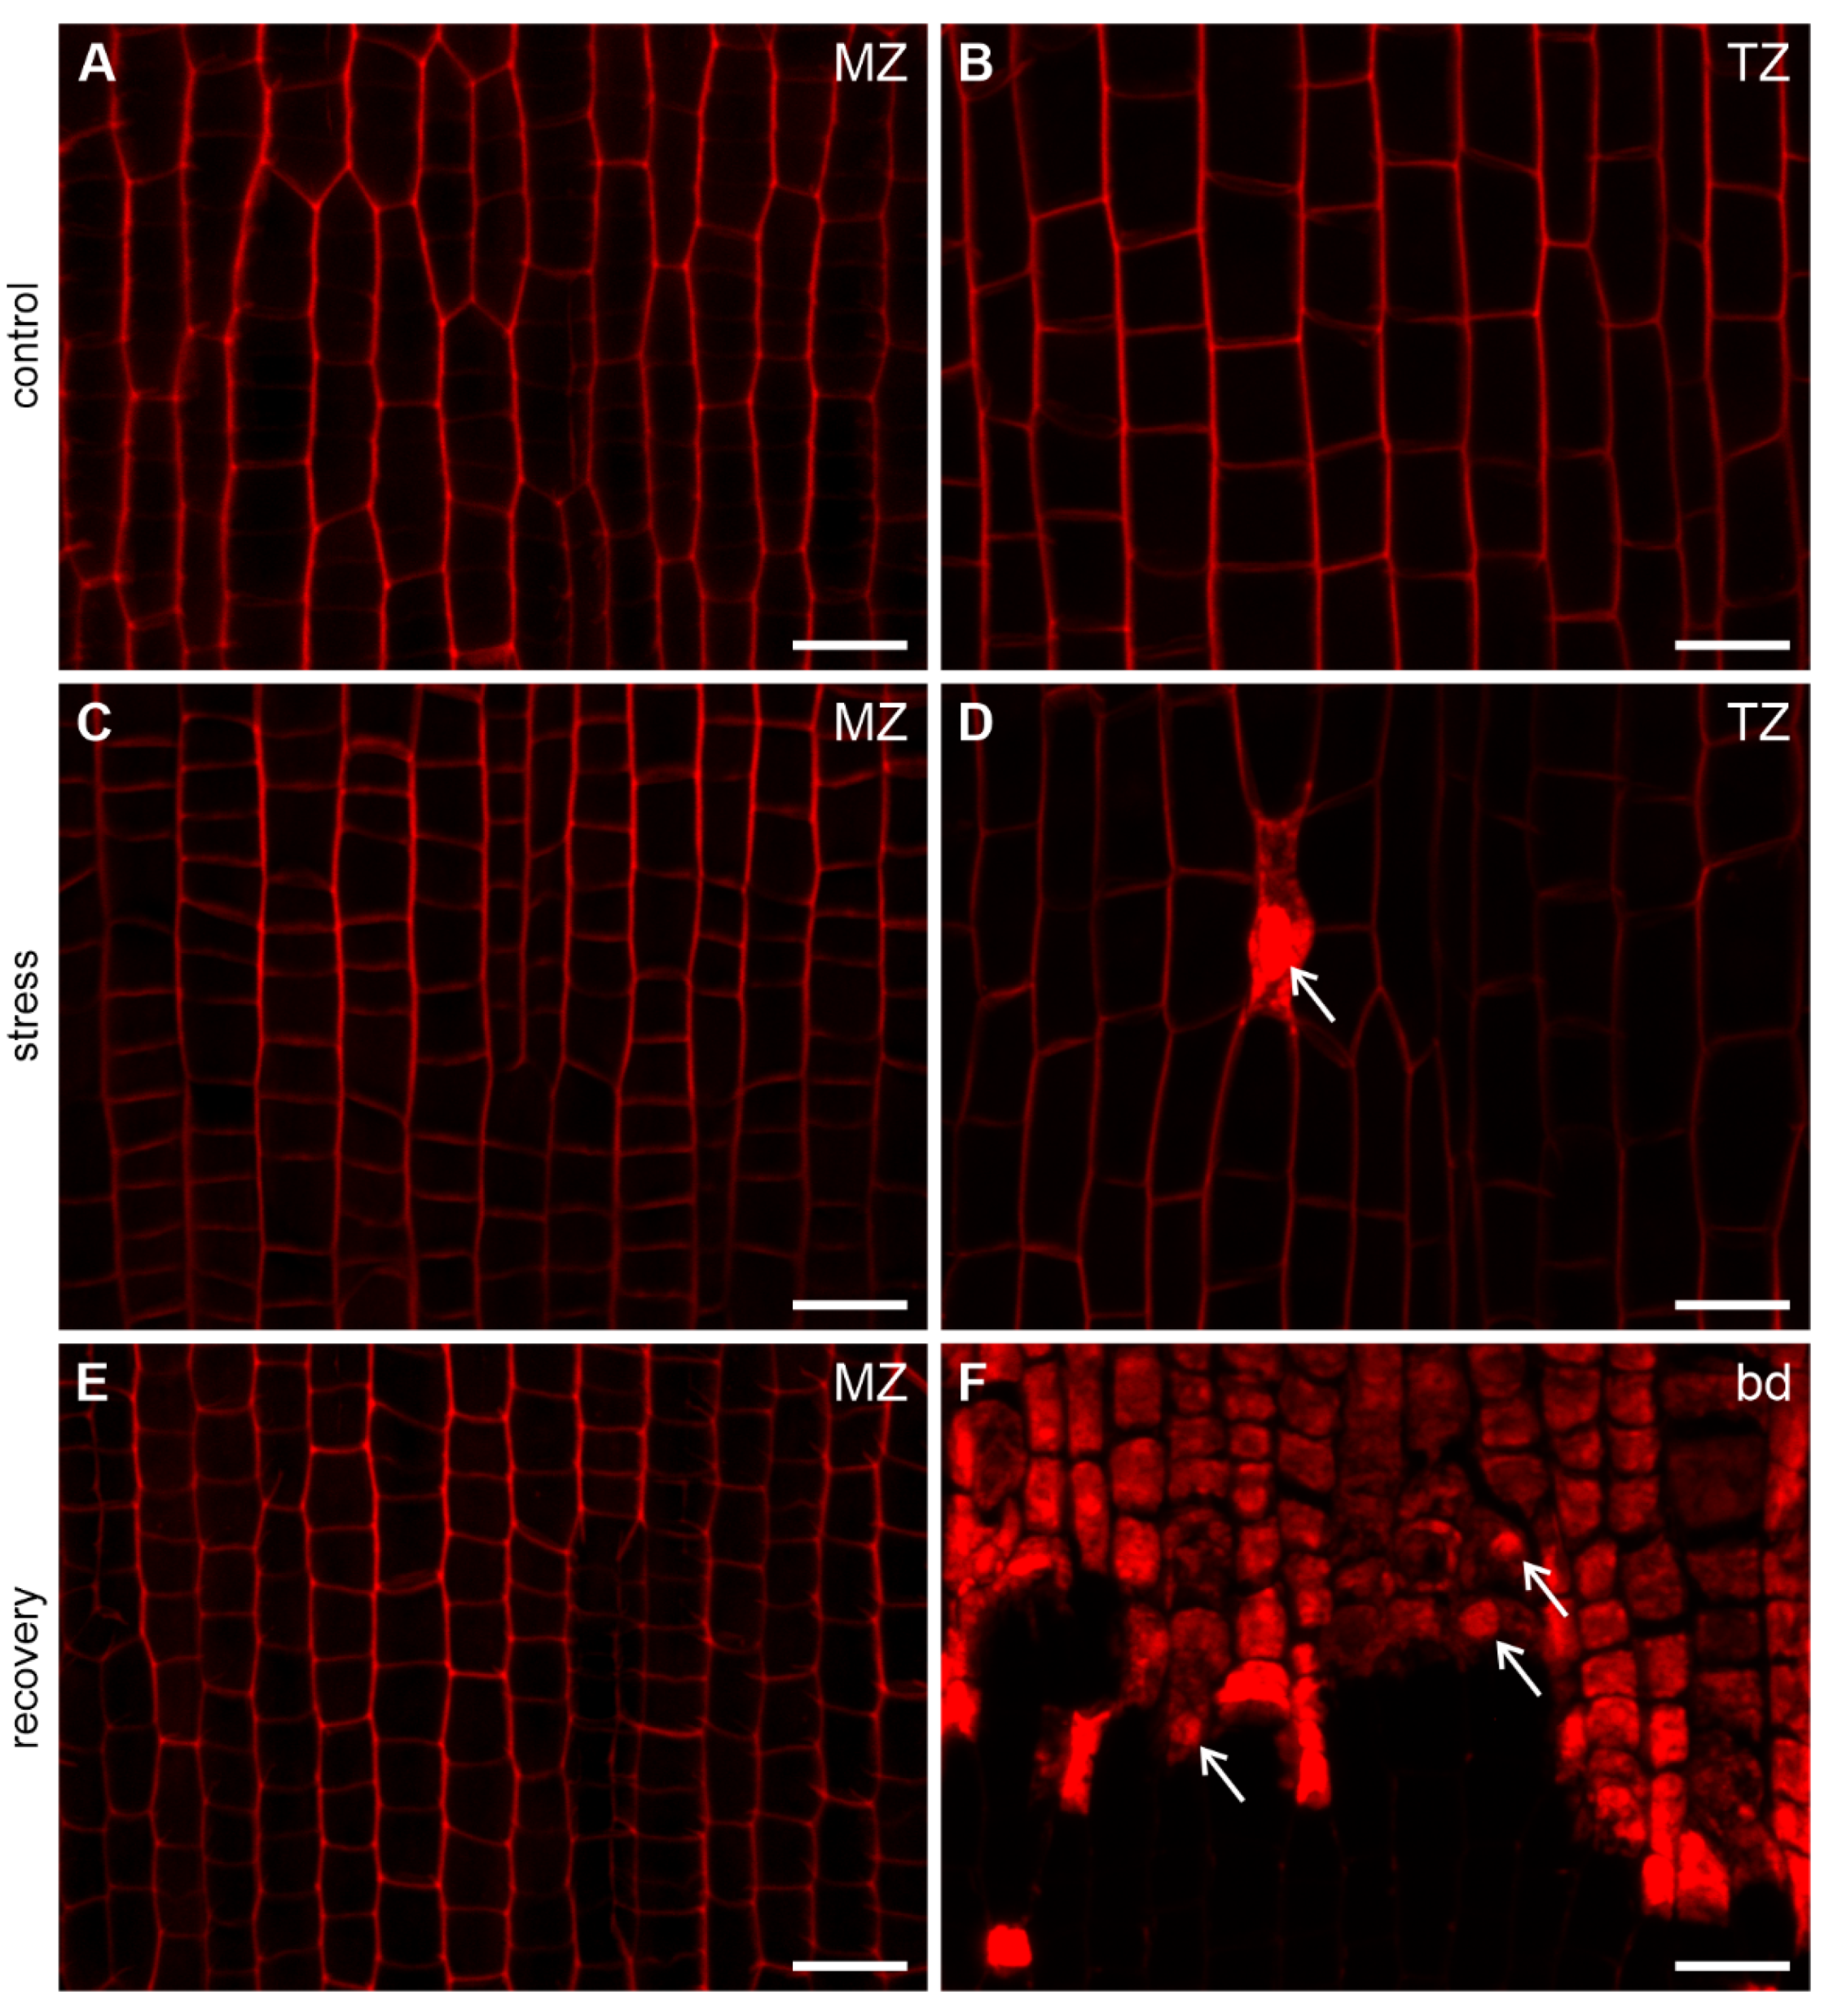
2.3.2. Propidium Iodide (PI) Staining
2.4. Visualization of the Epidermal Surface Components
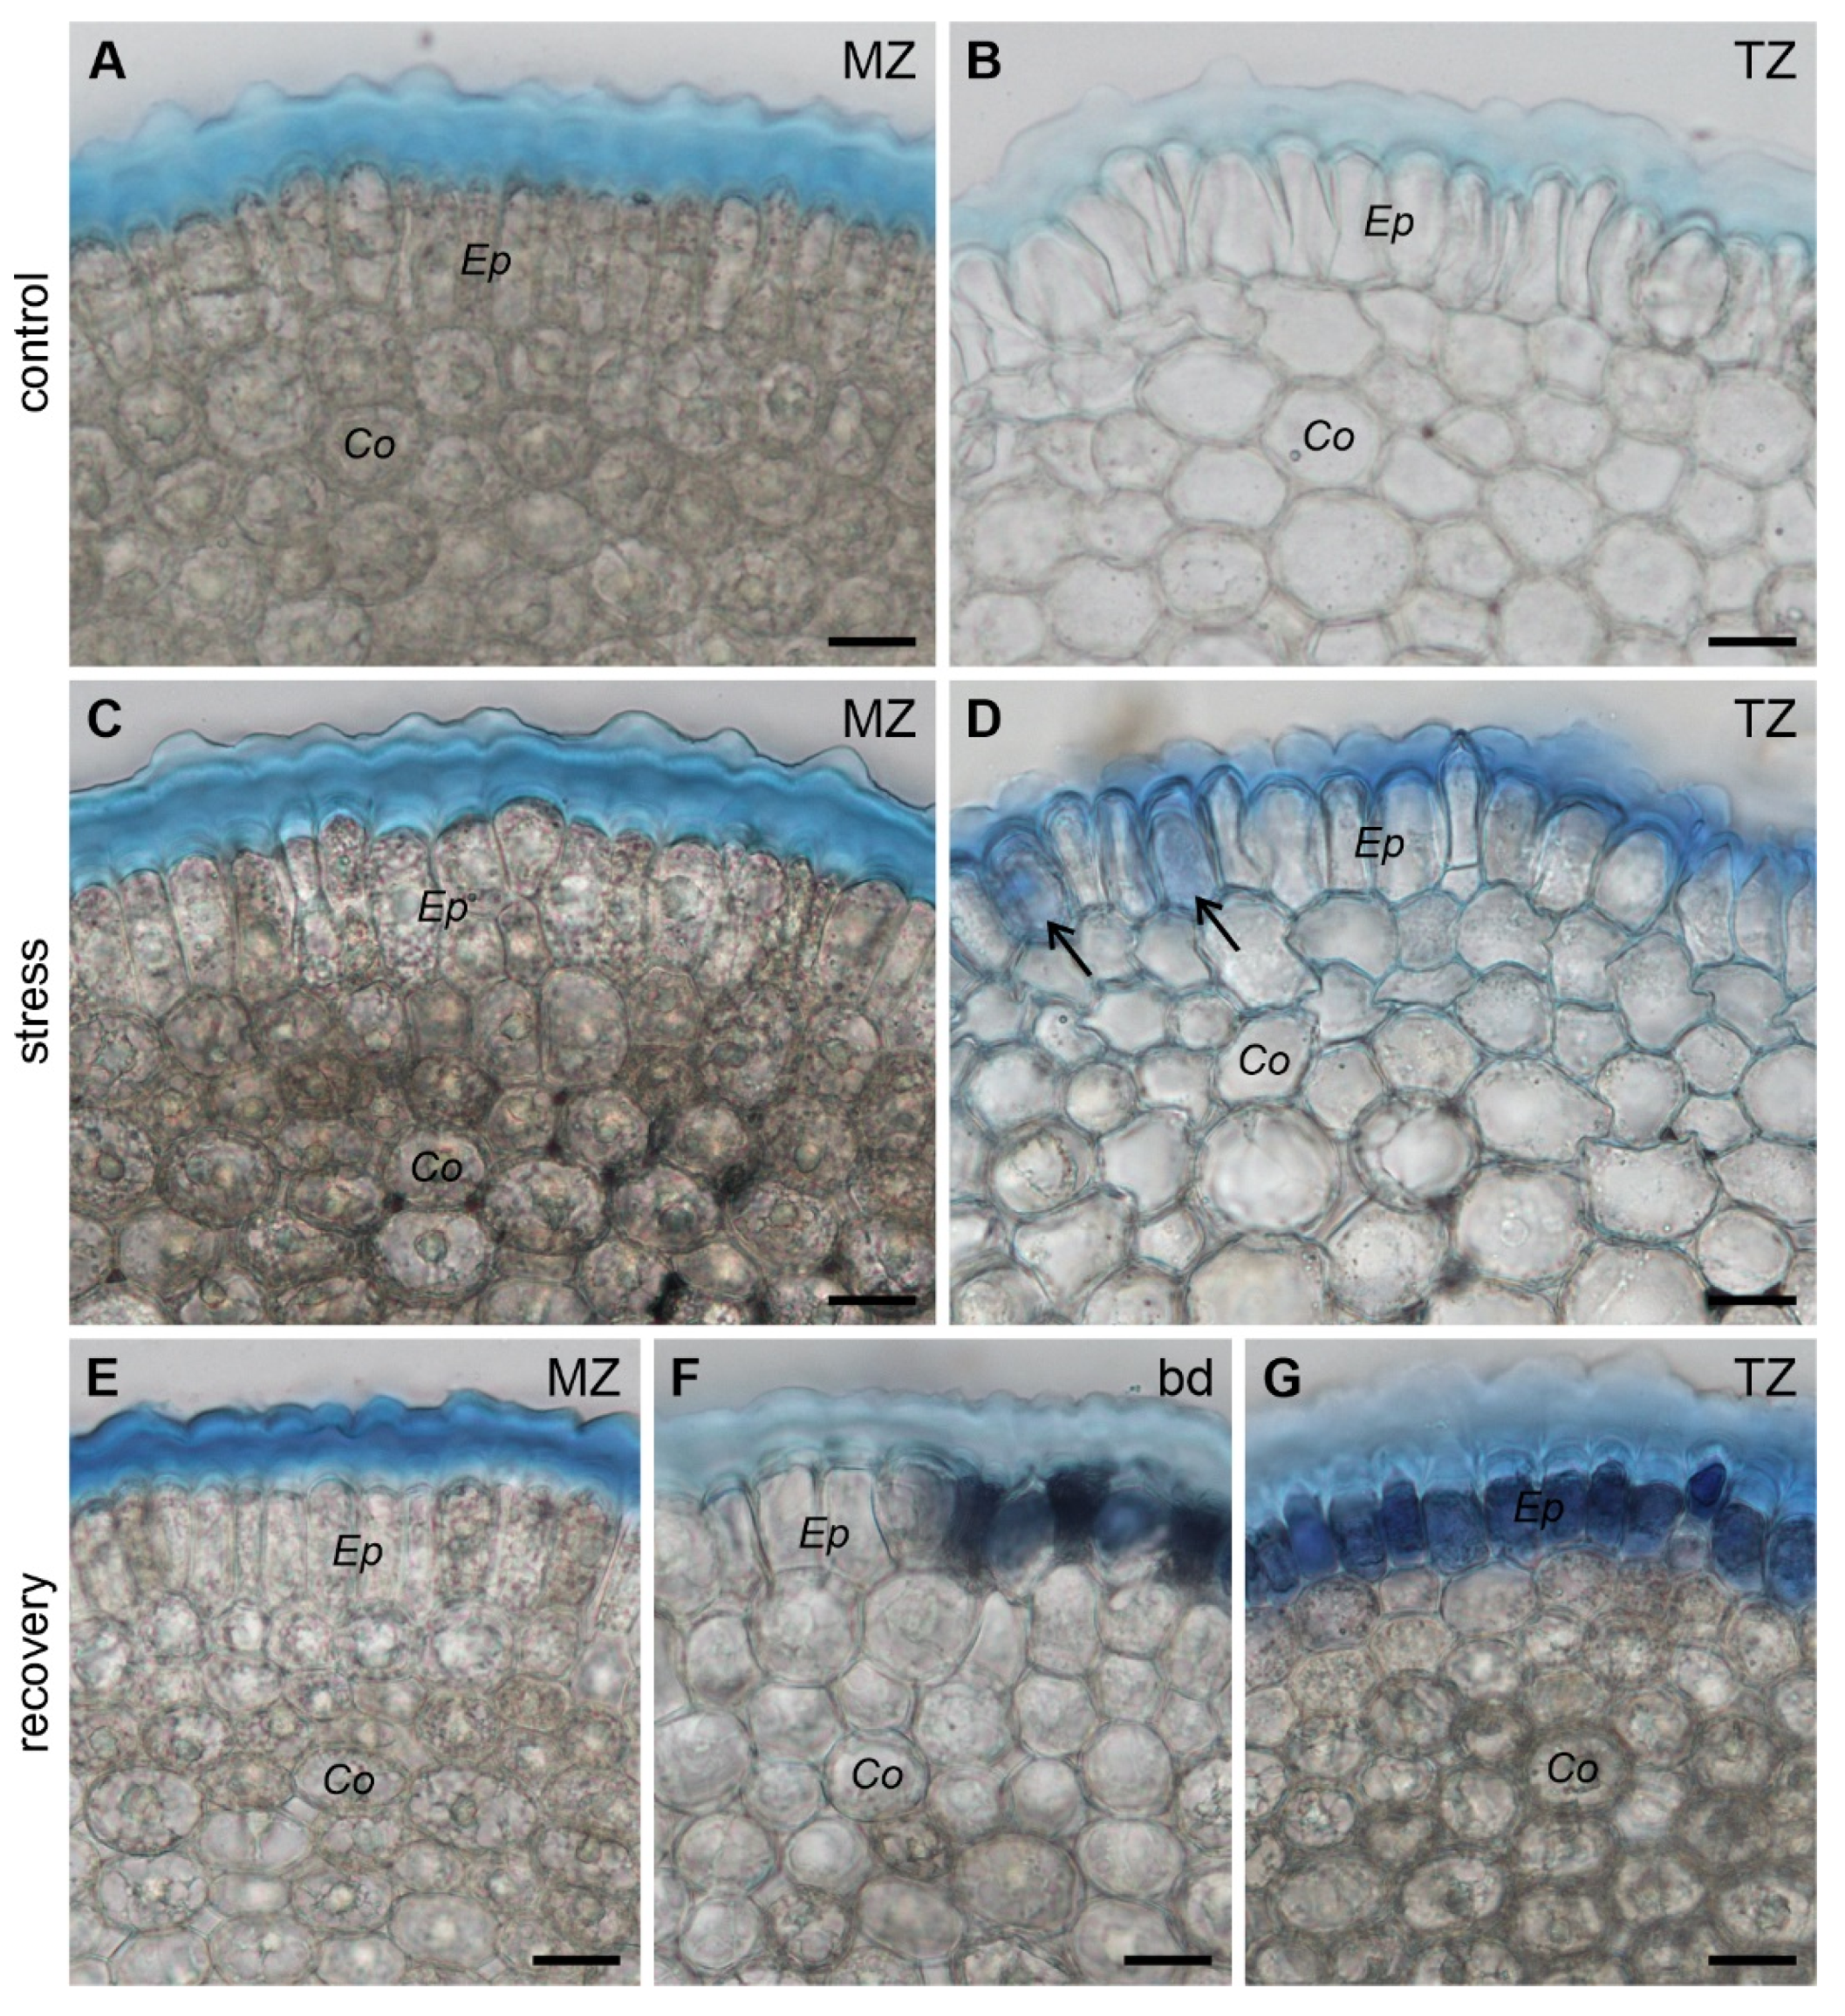
2.4.1. Coomassie Blue Staining
2.4.2. Confocal Laser Scanning Microscopy (CLSM) Imaging
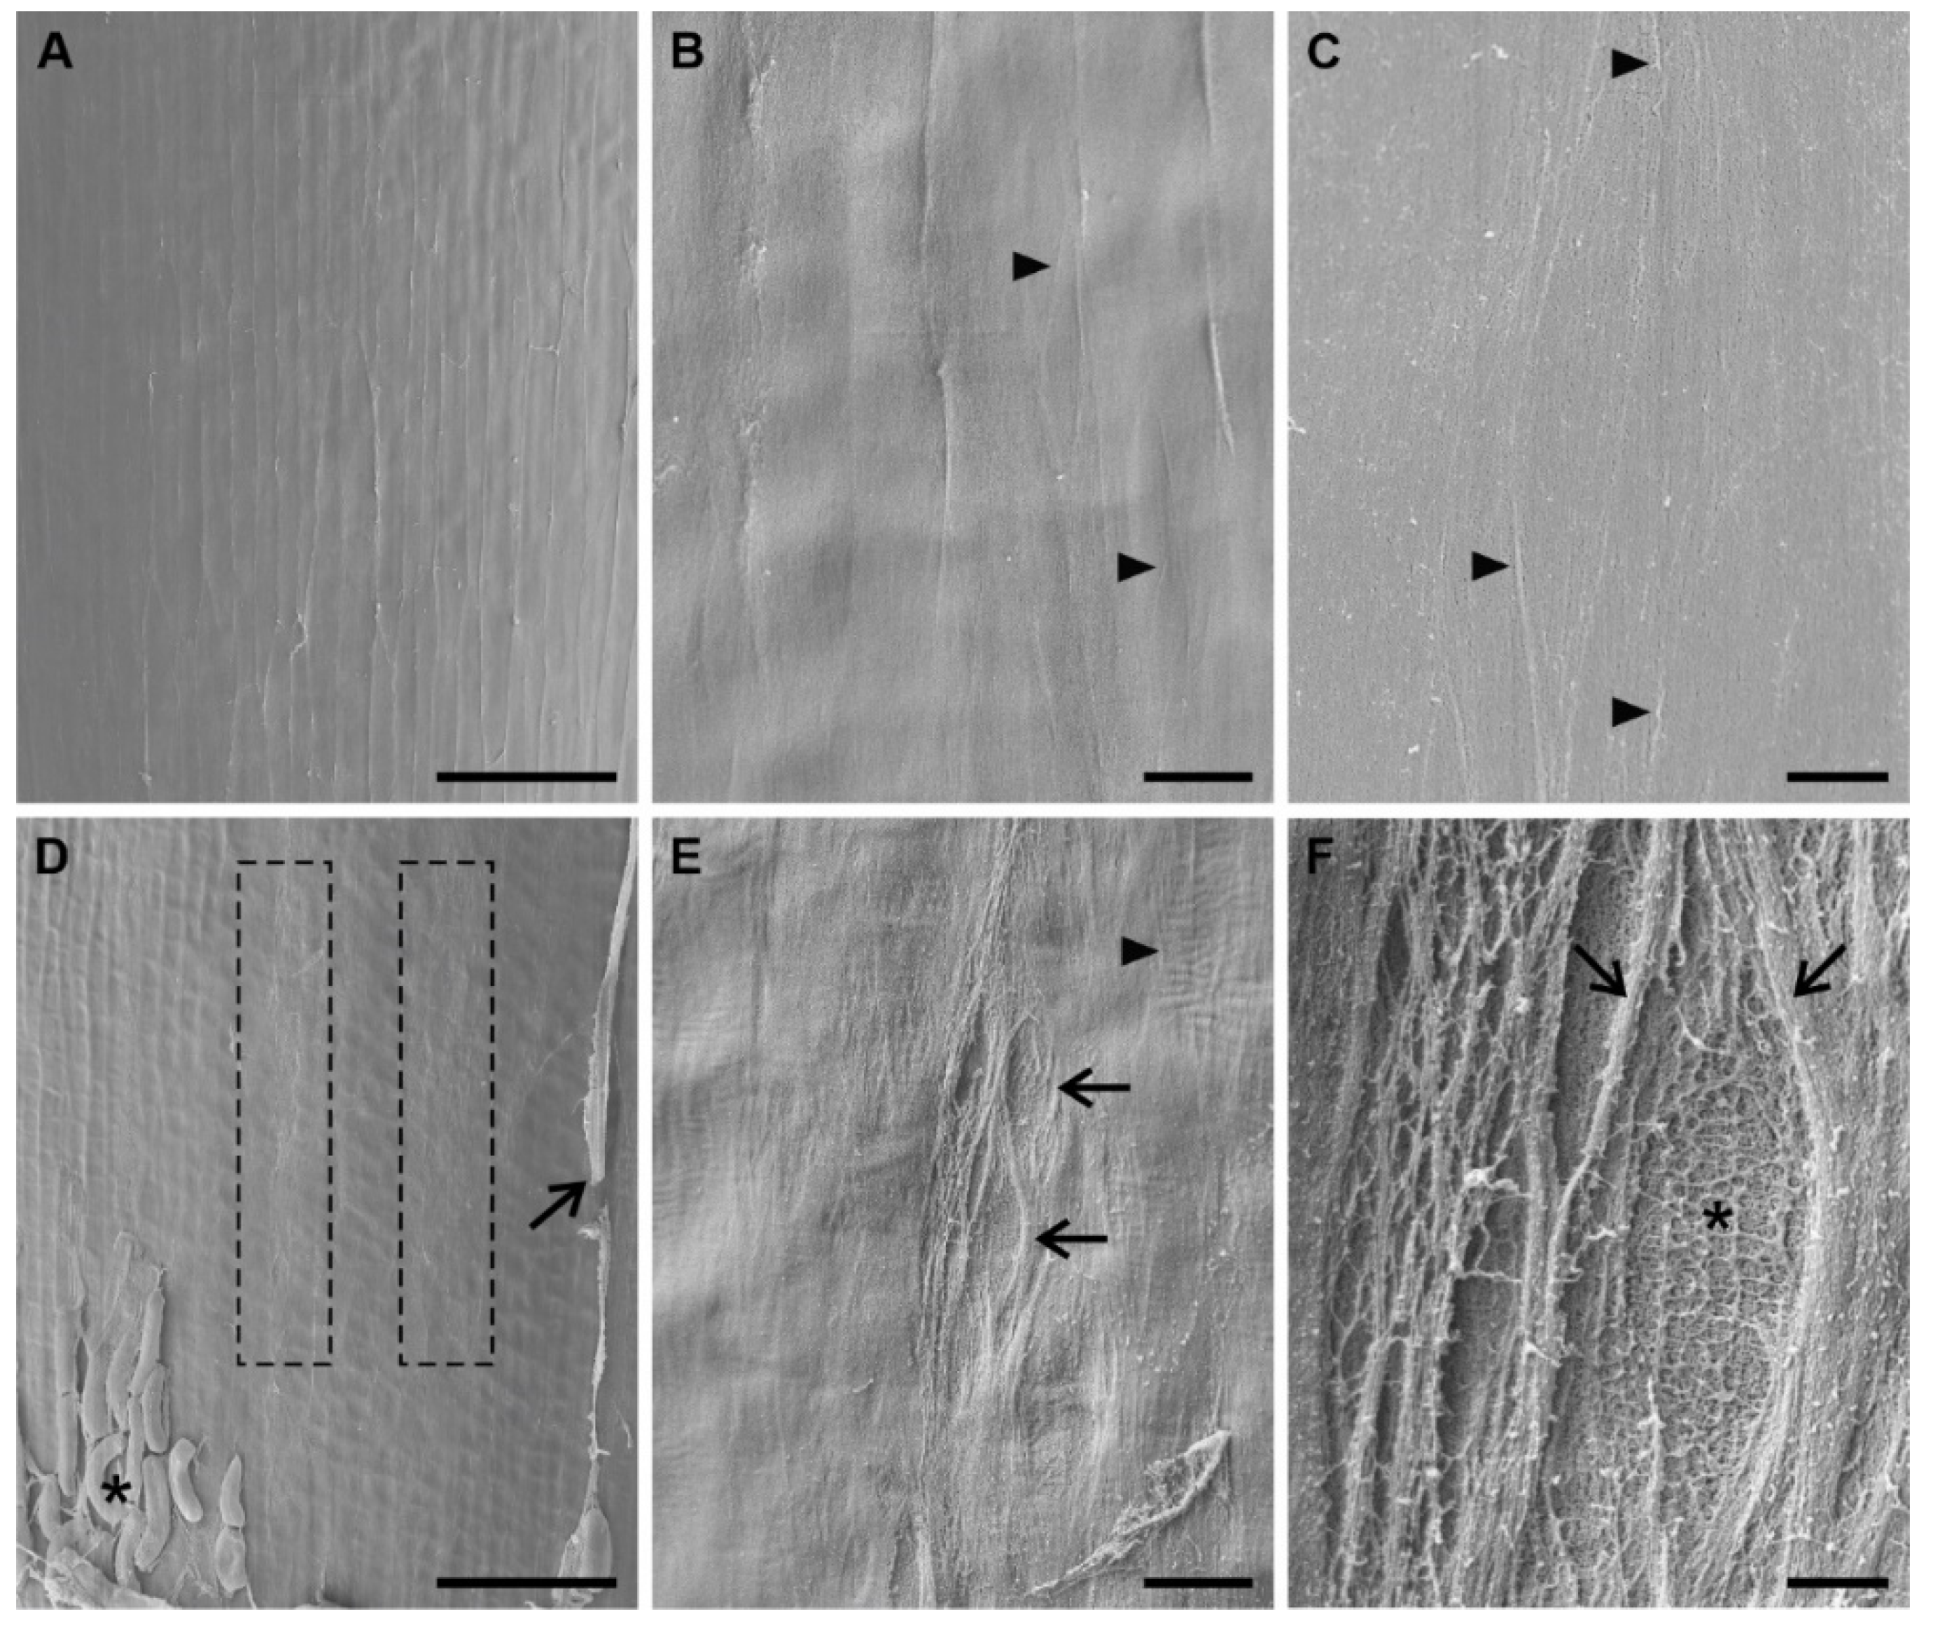
2.4.3. Scanning Electron Microscopy (SEM) Imaging
3. Results
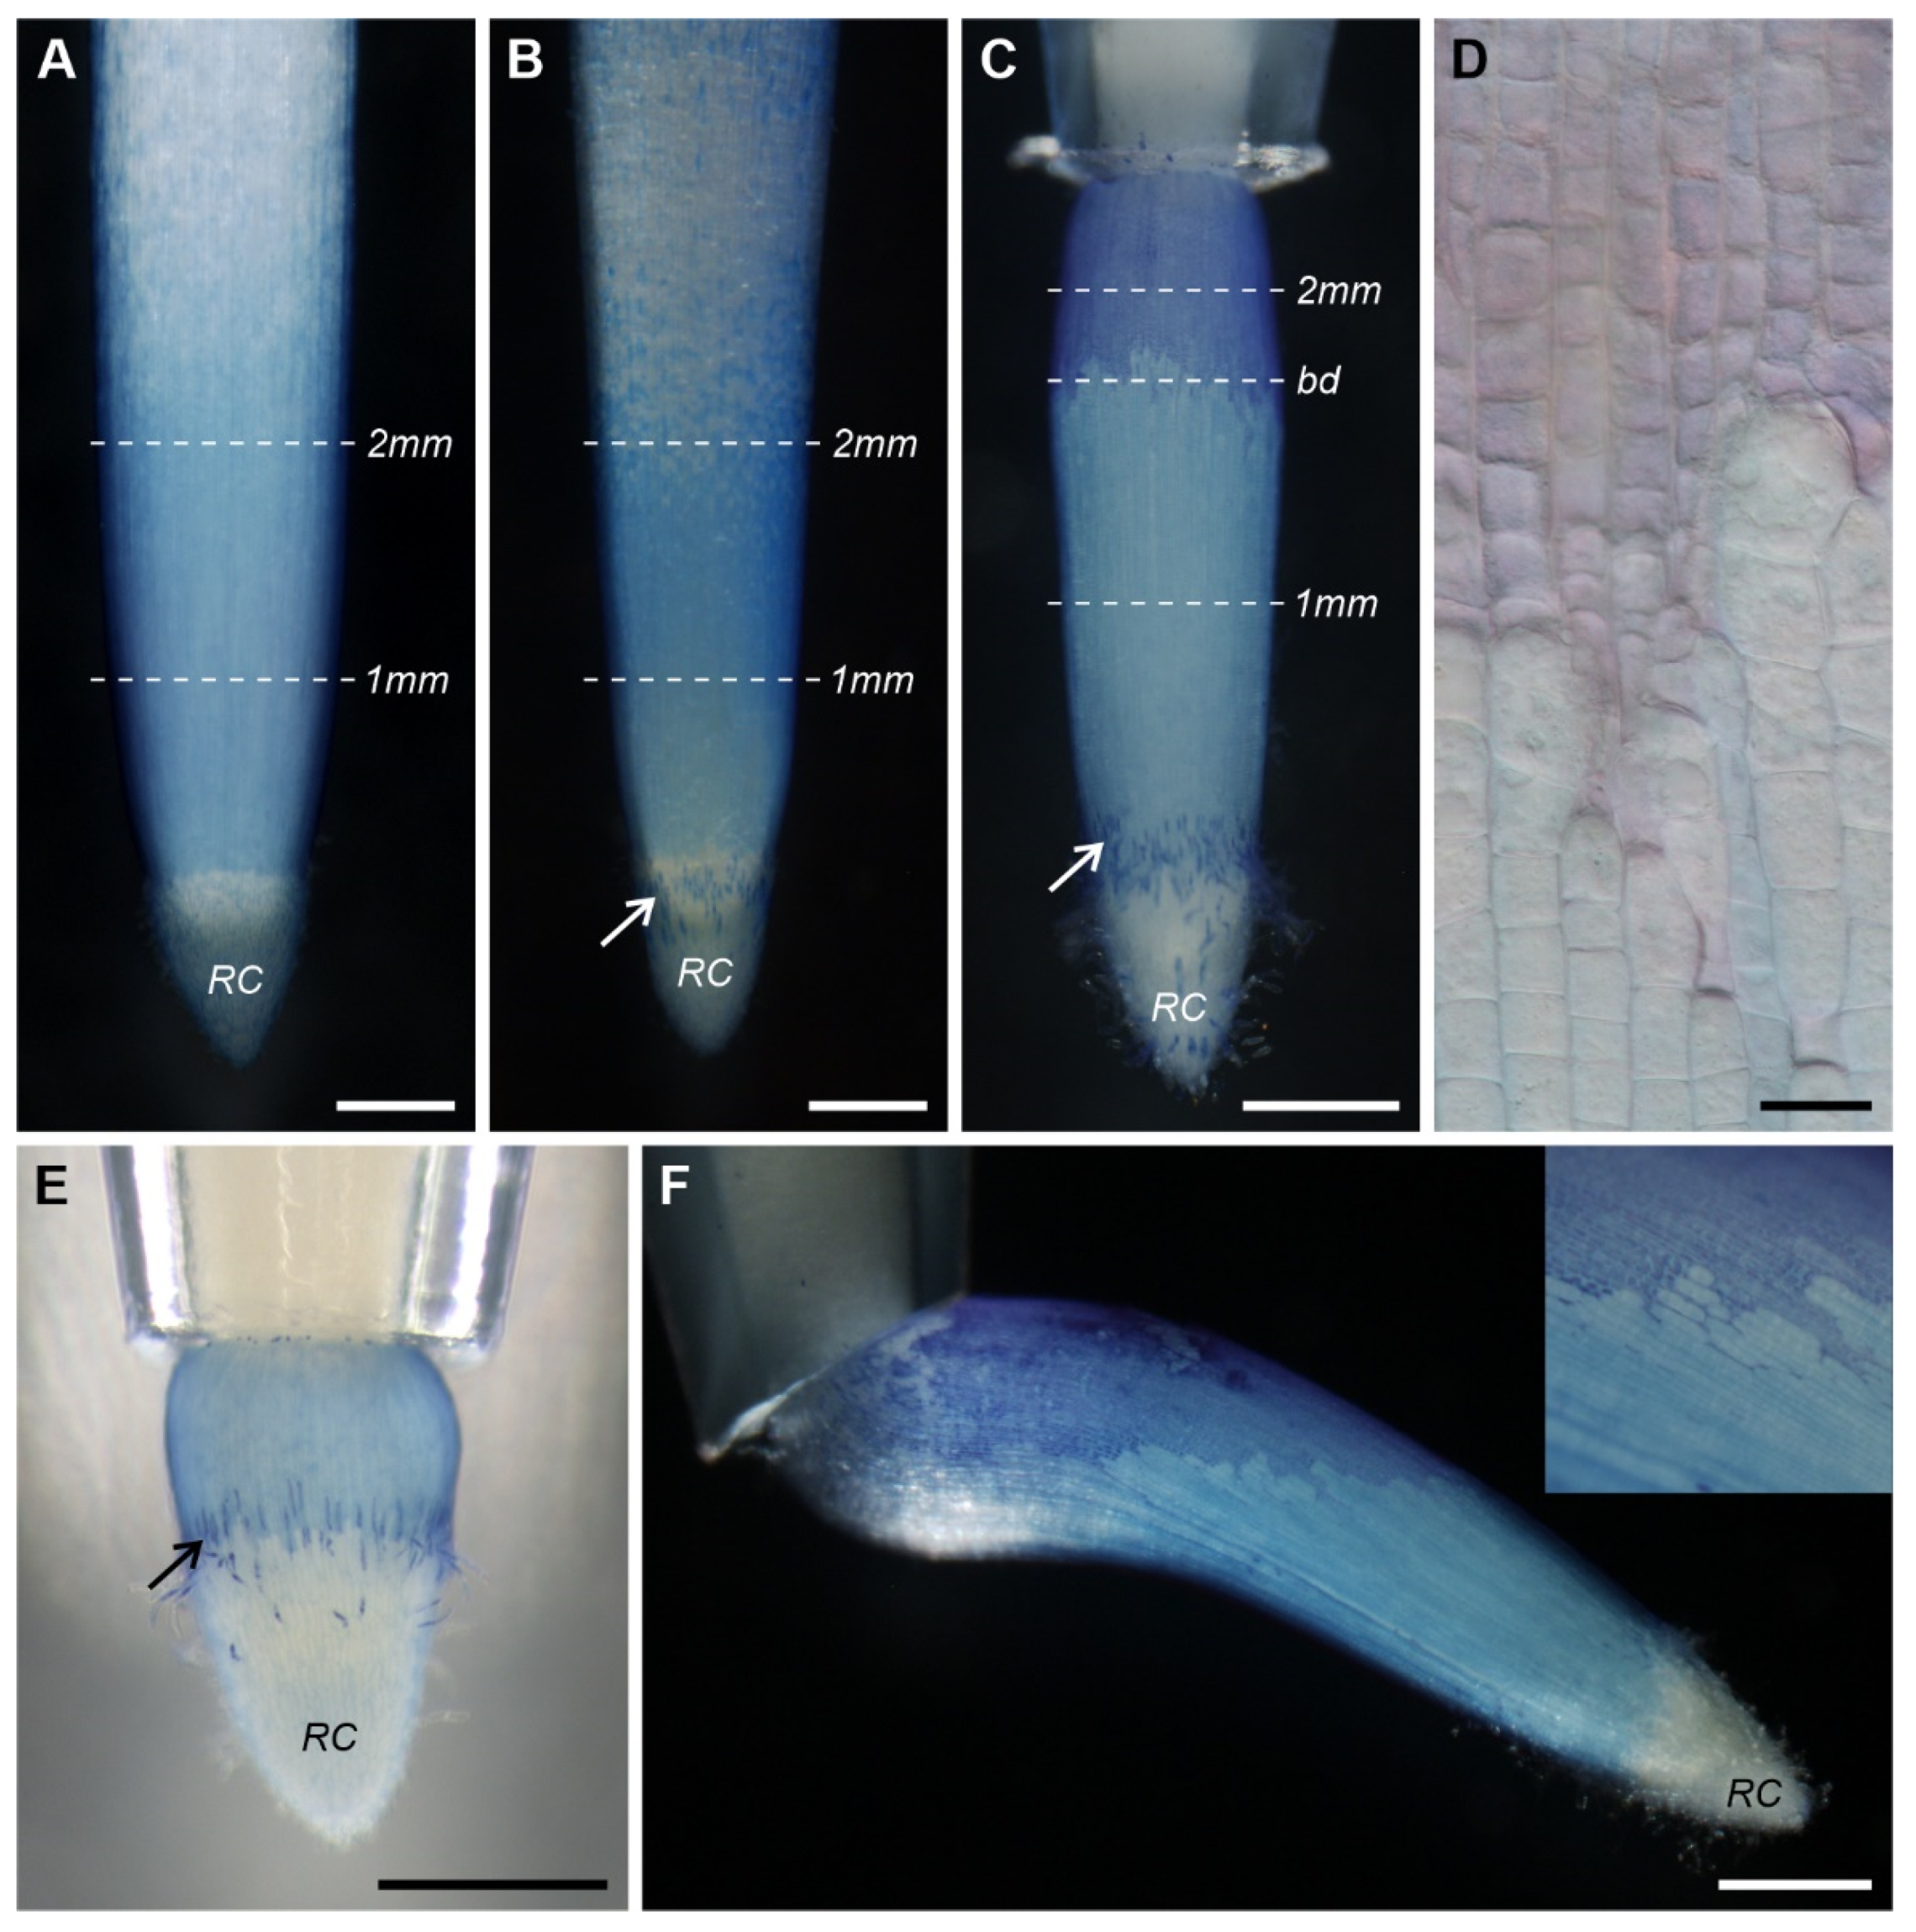
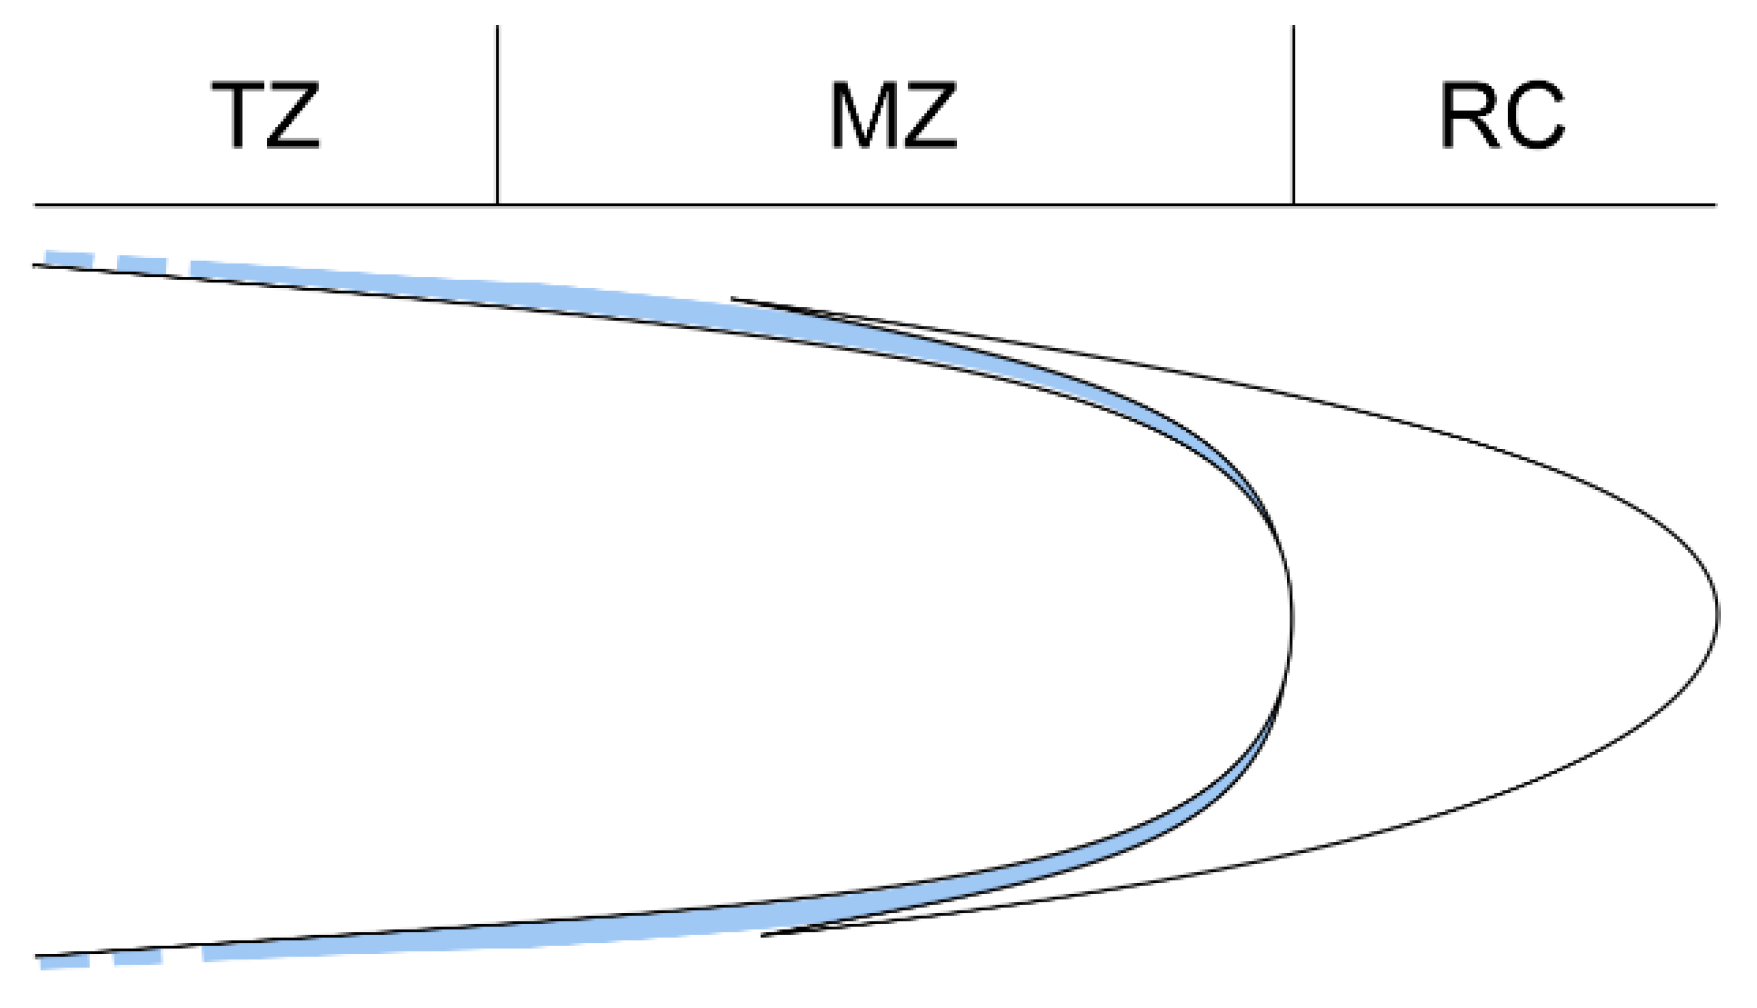
3.1. Root Growth Orientation
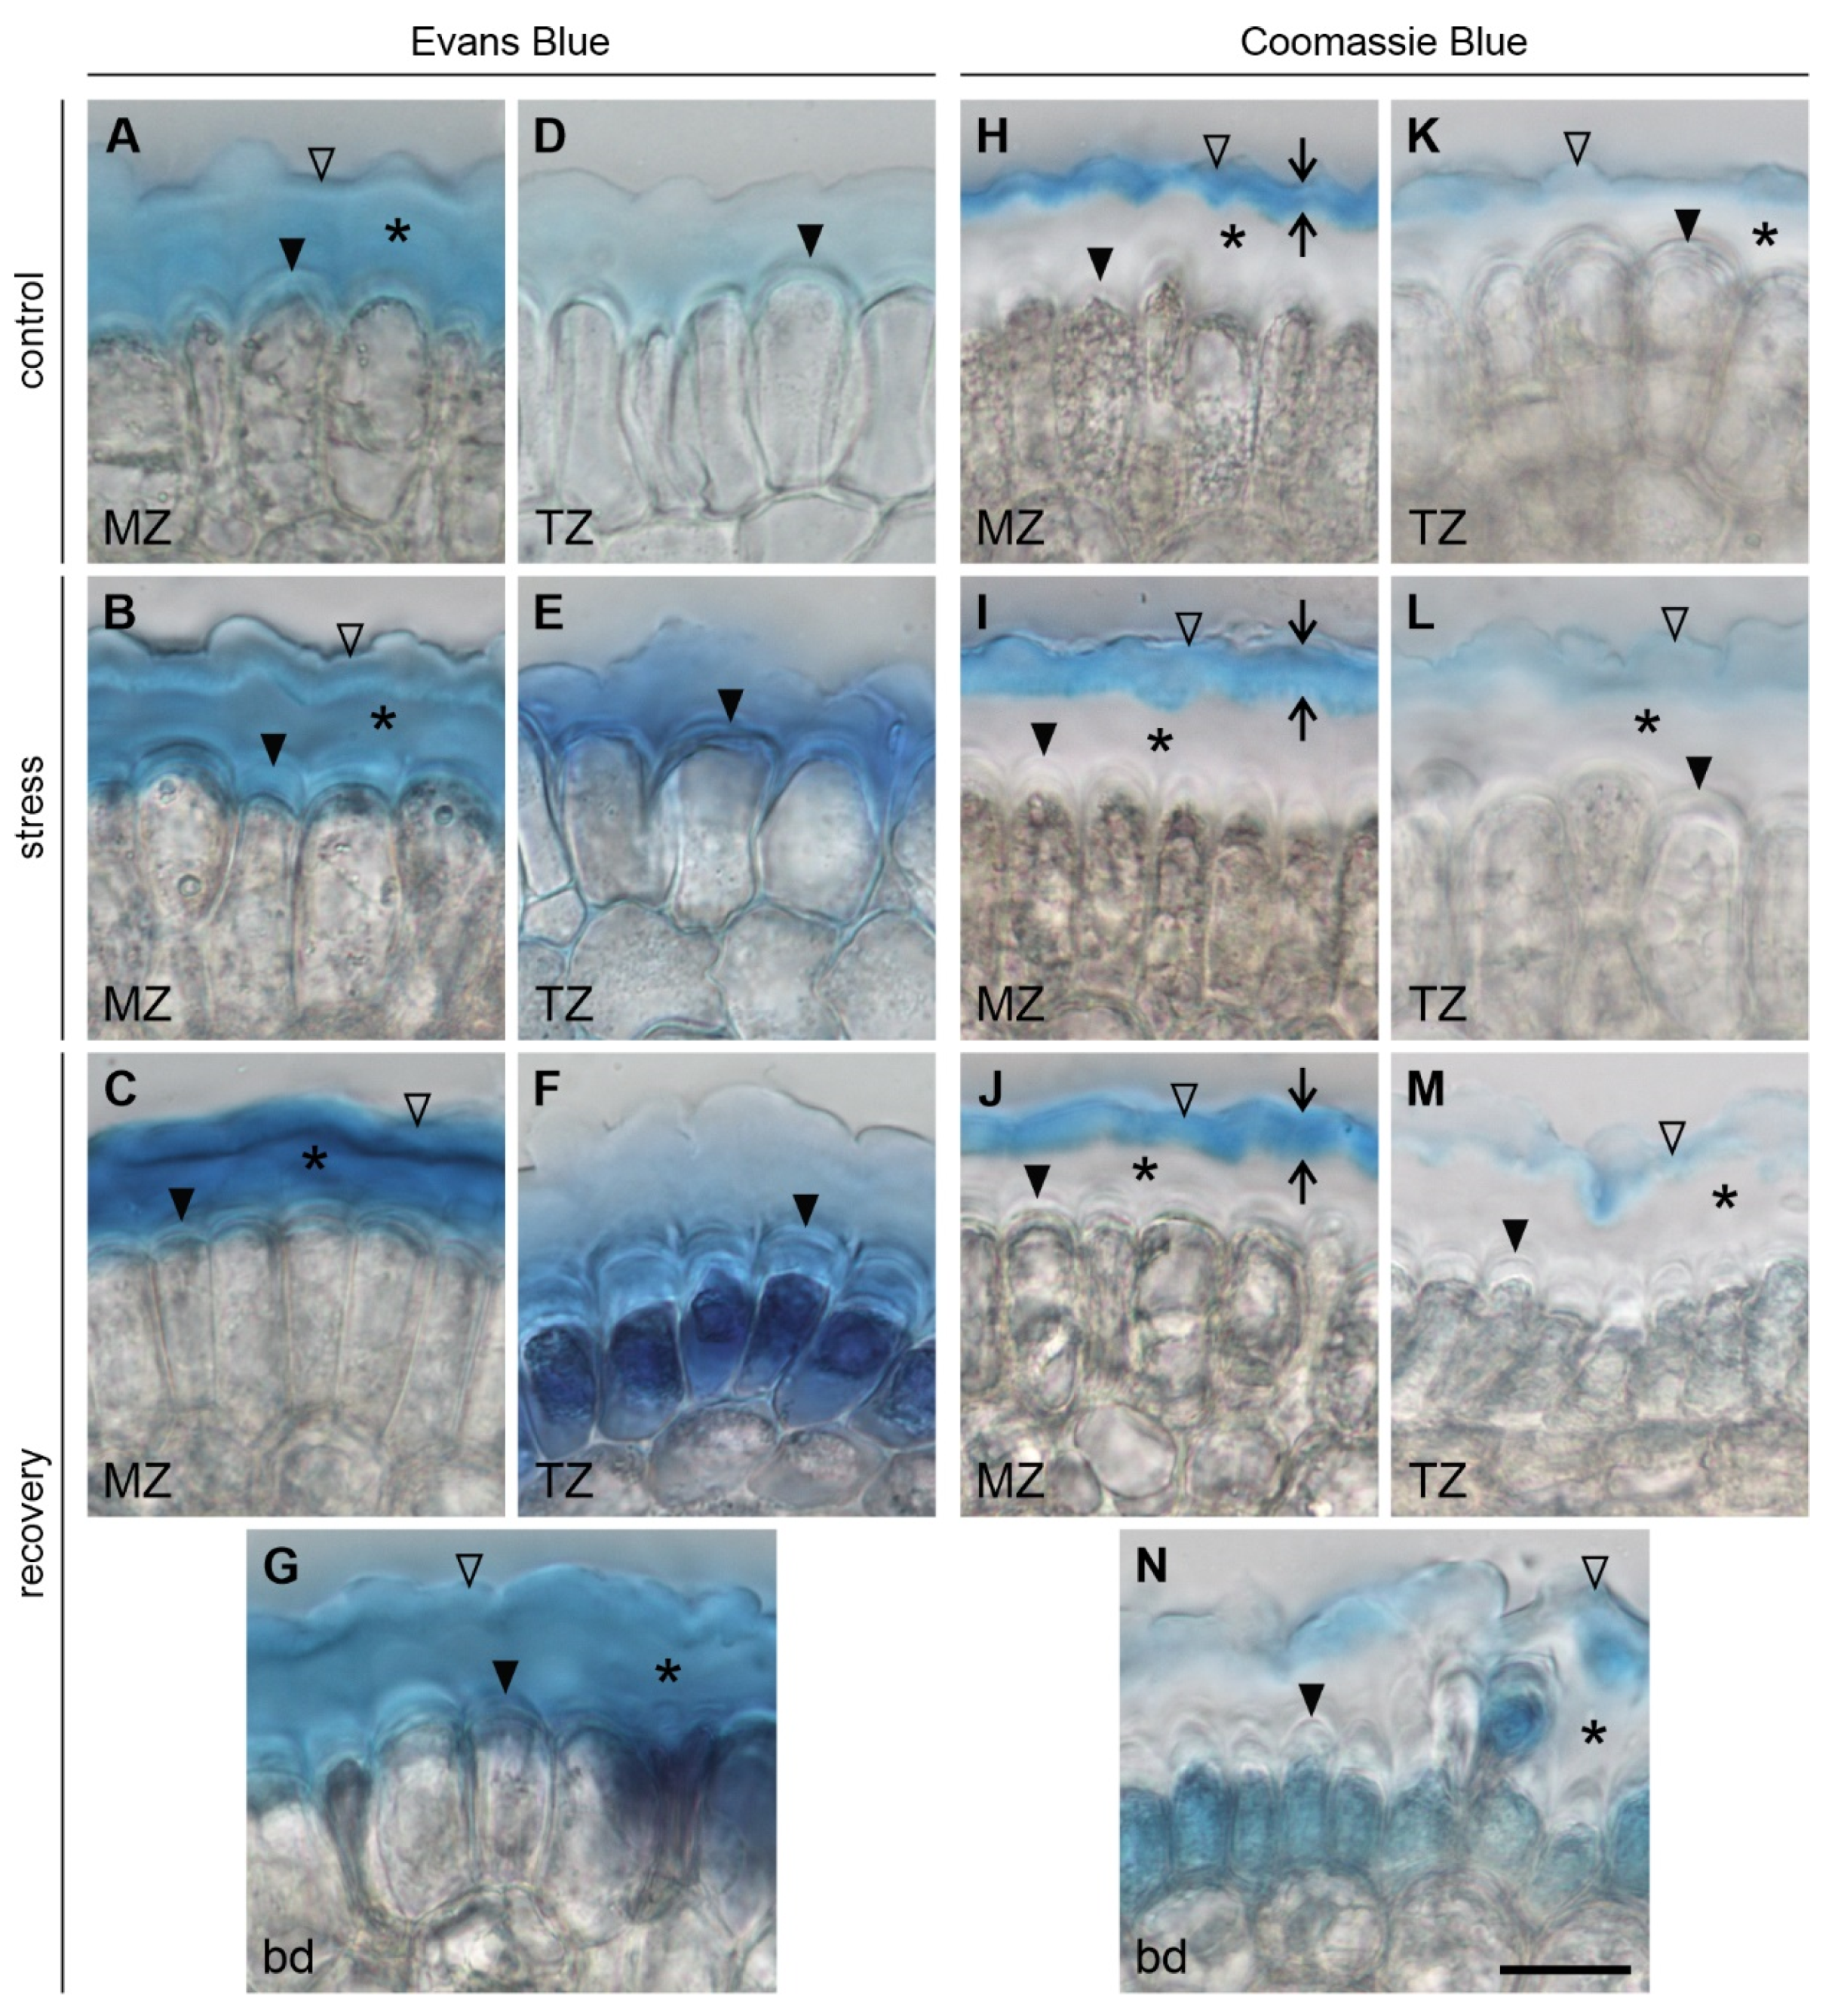
3.2. Viability of the Root Cells
3.3. Changes in the Structure of the Epidermal Surface under Mechanical Stress
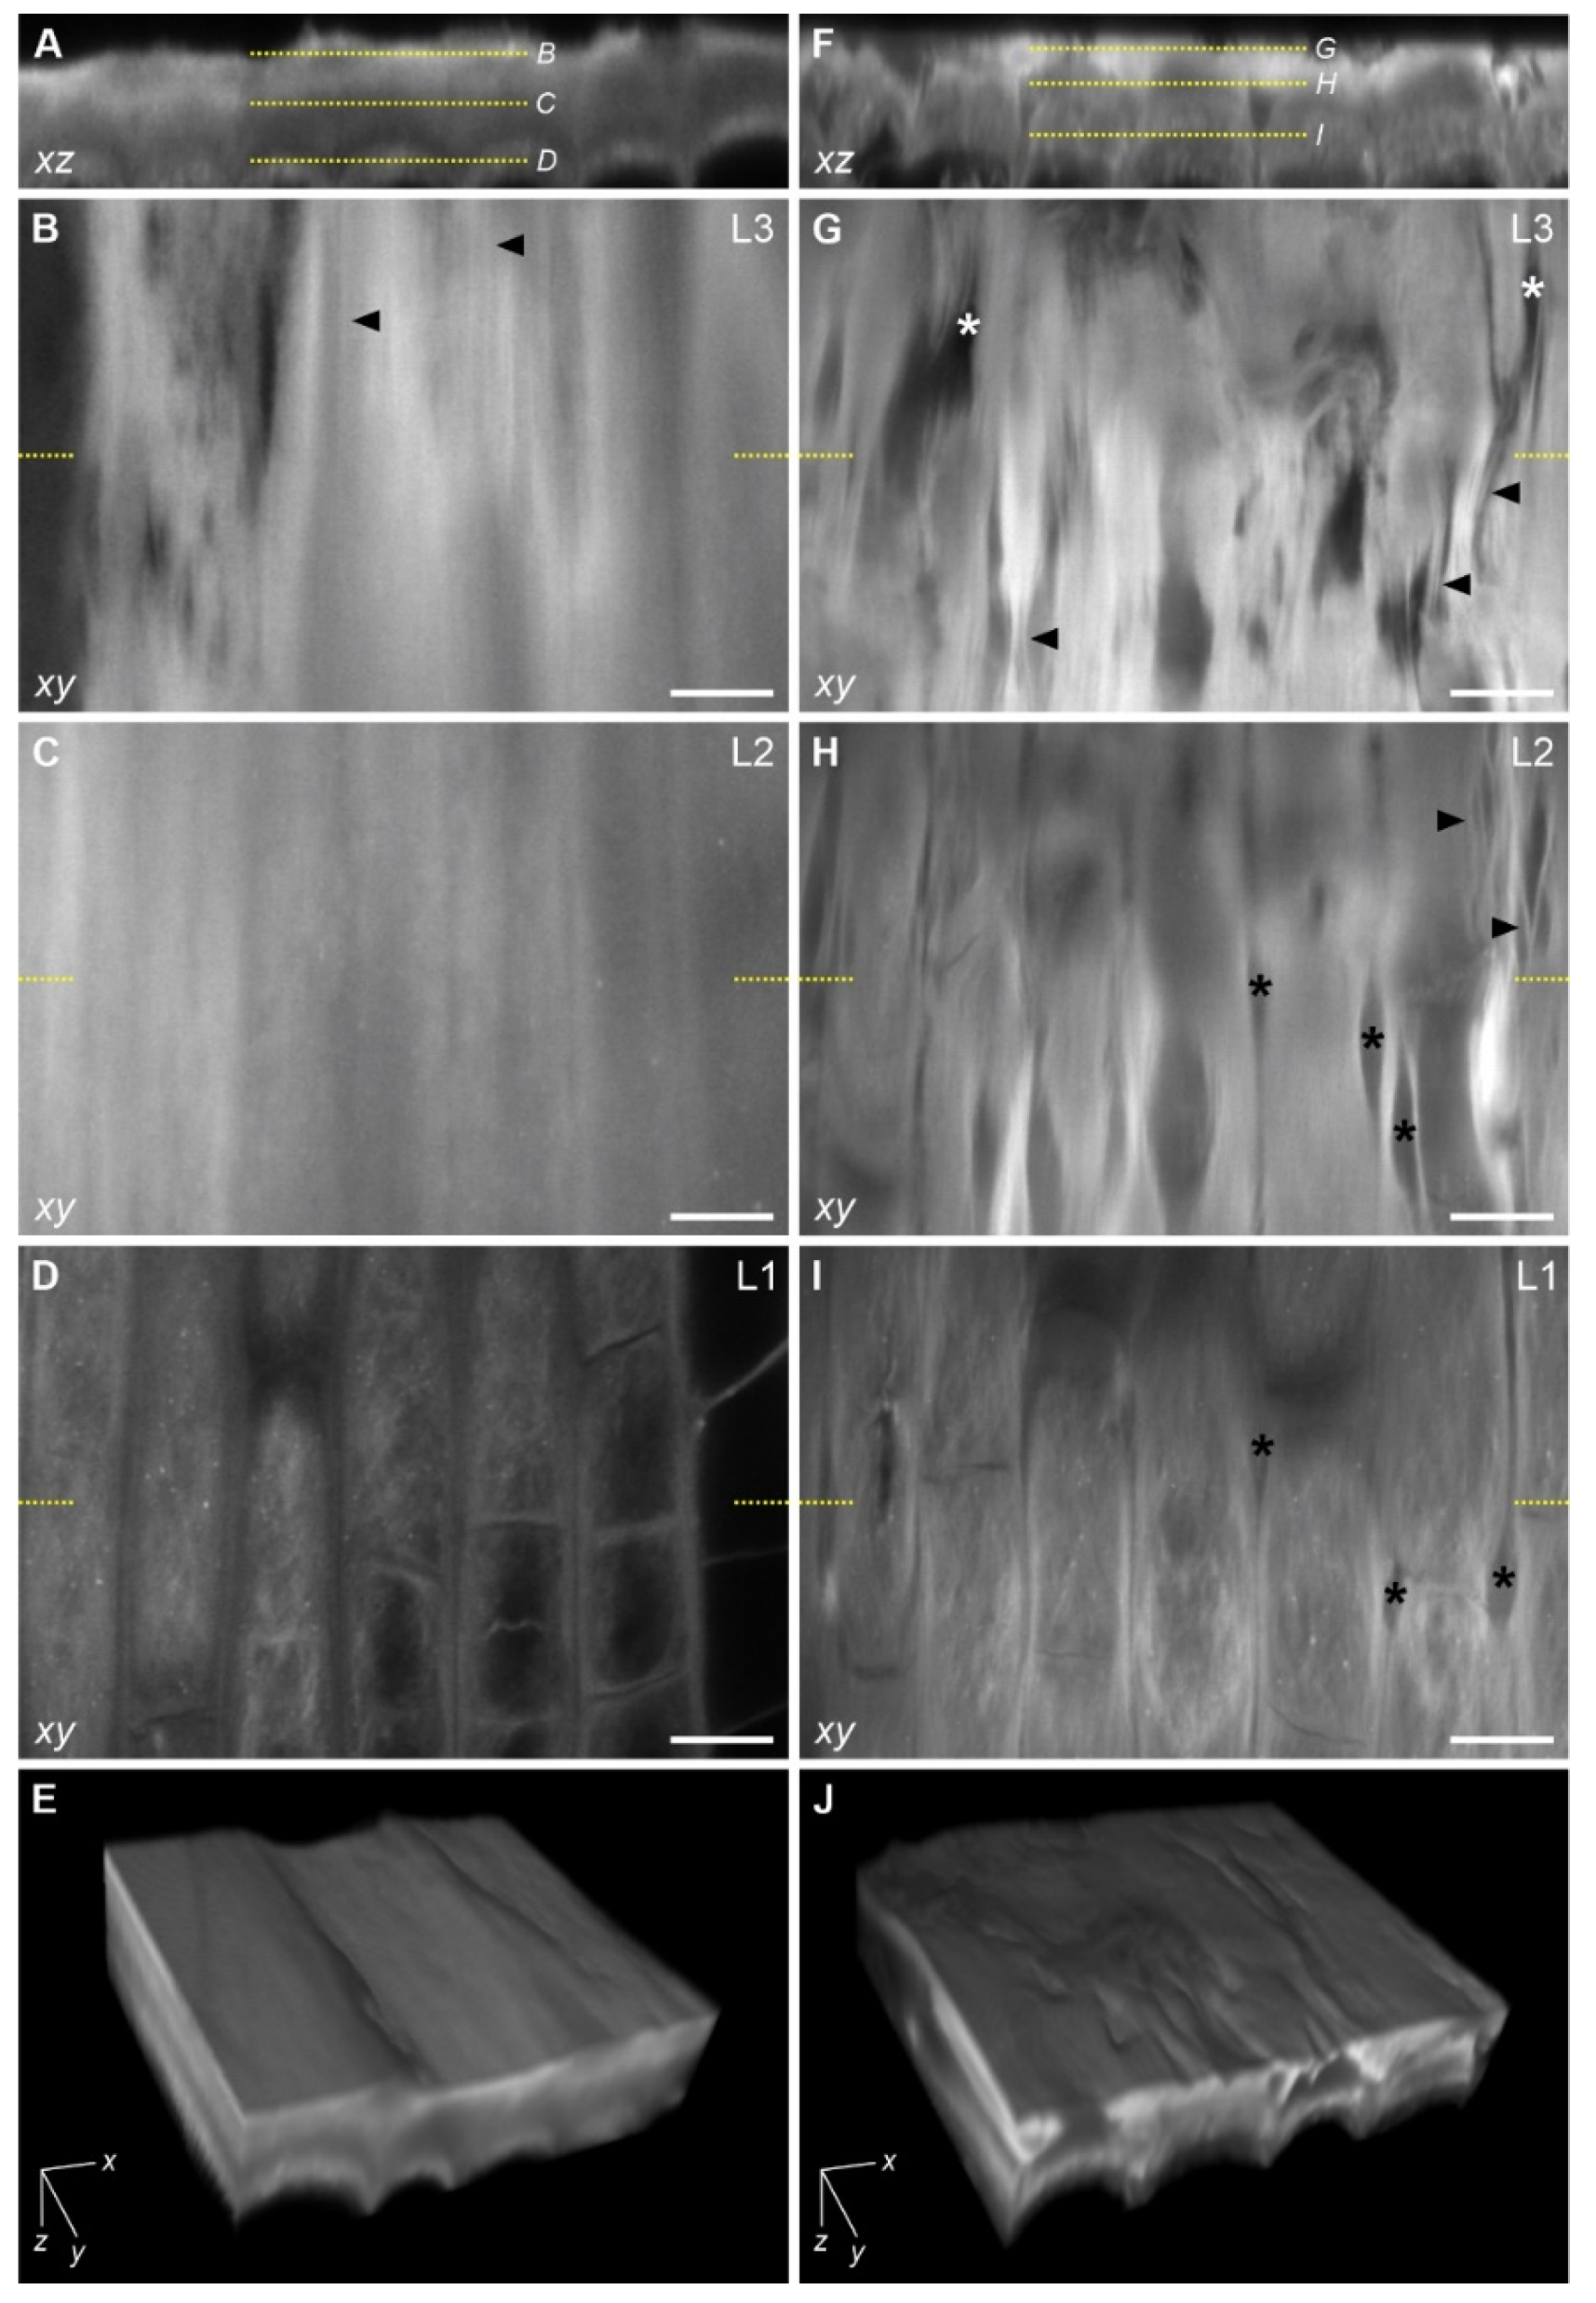
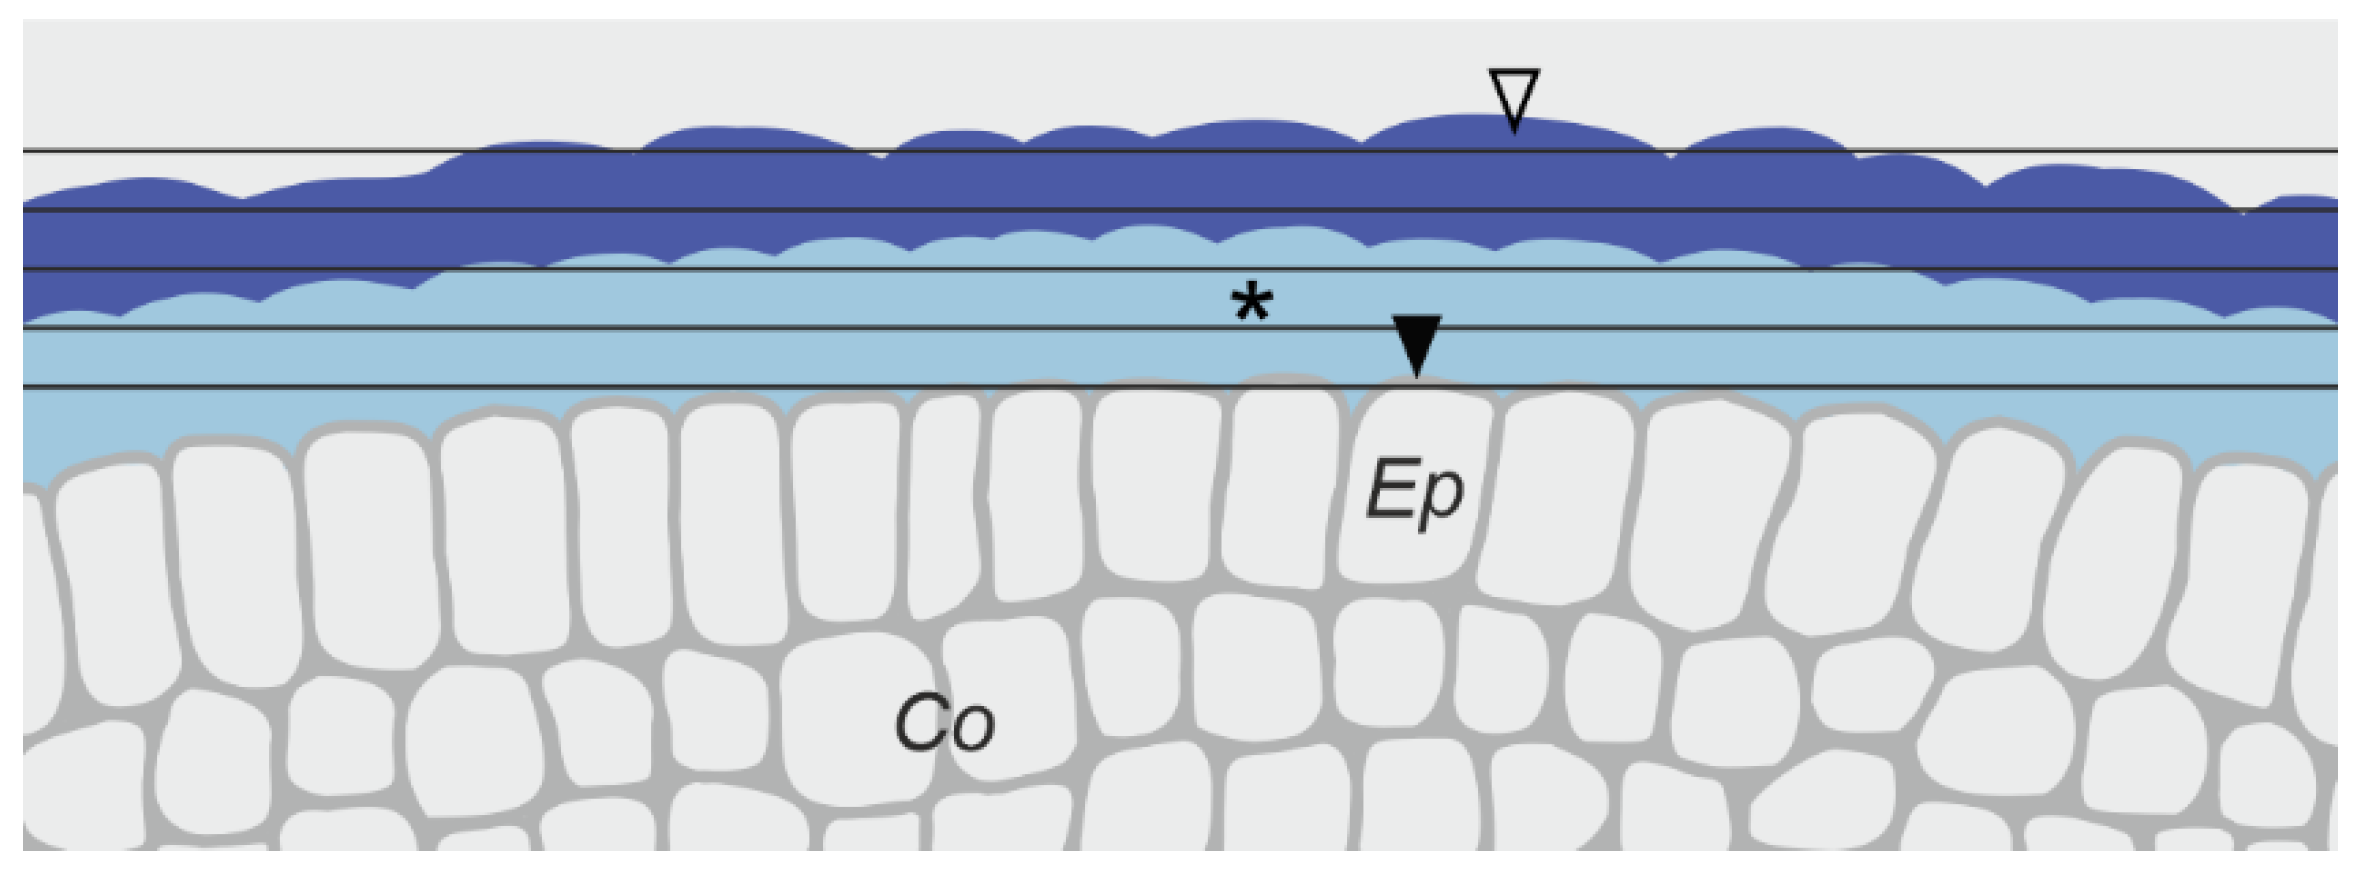
3.3.1. Changes in the Pellicle Layers
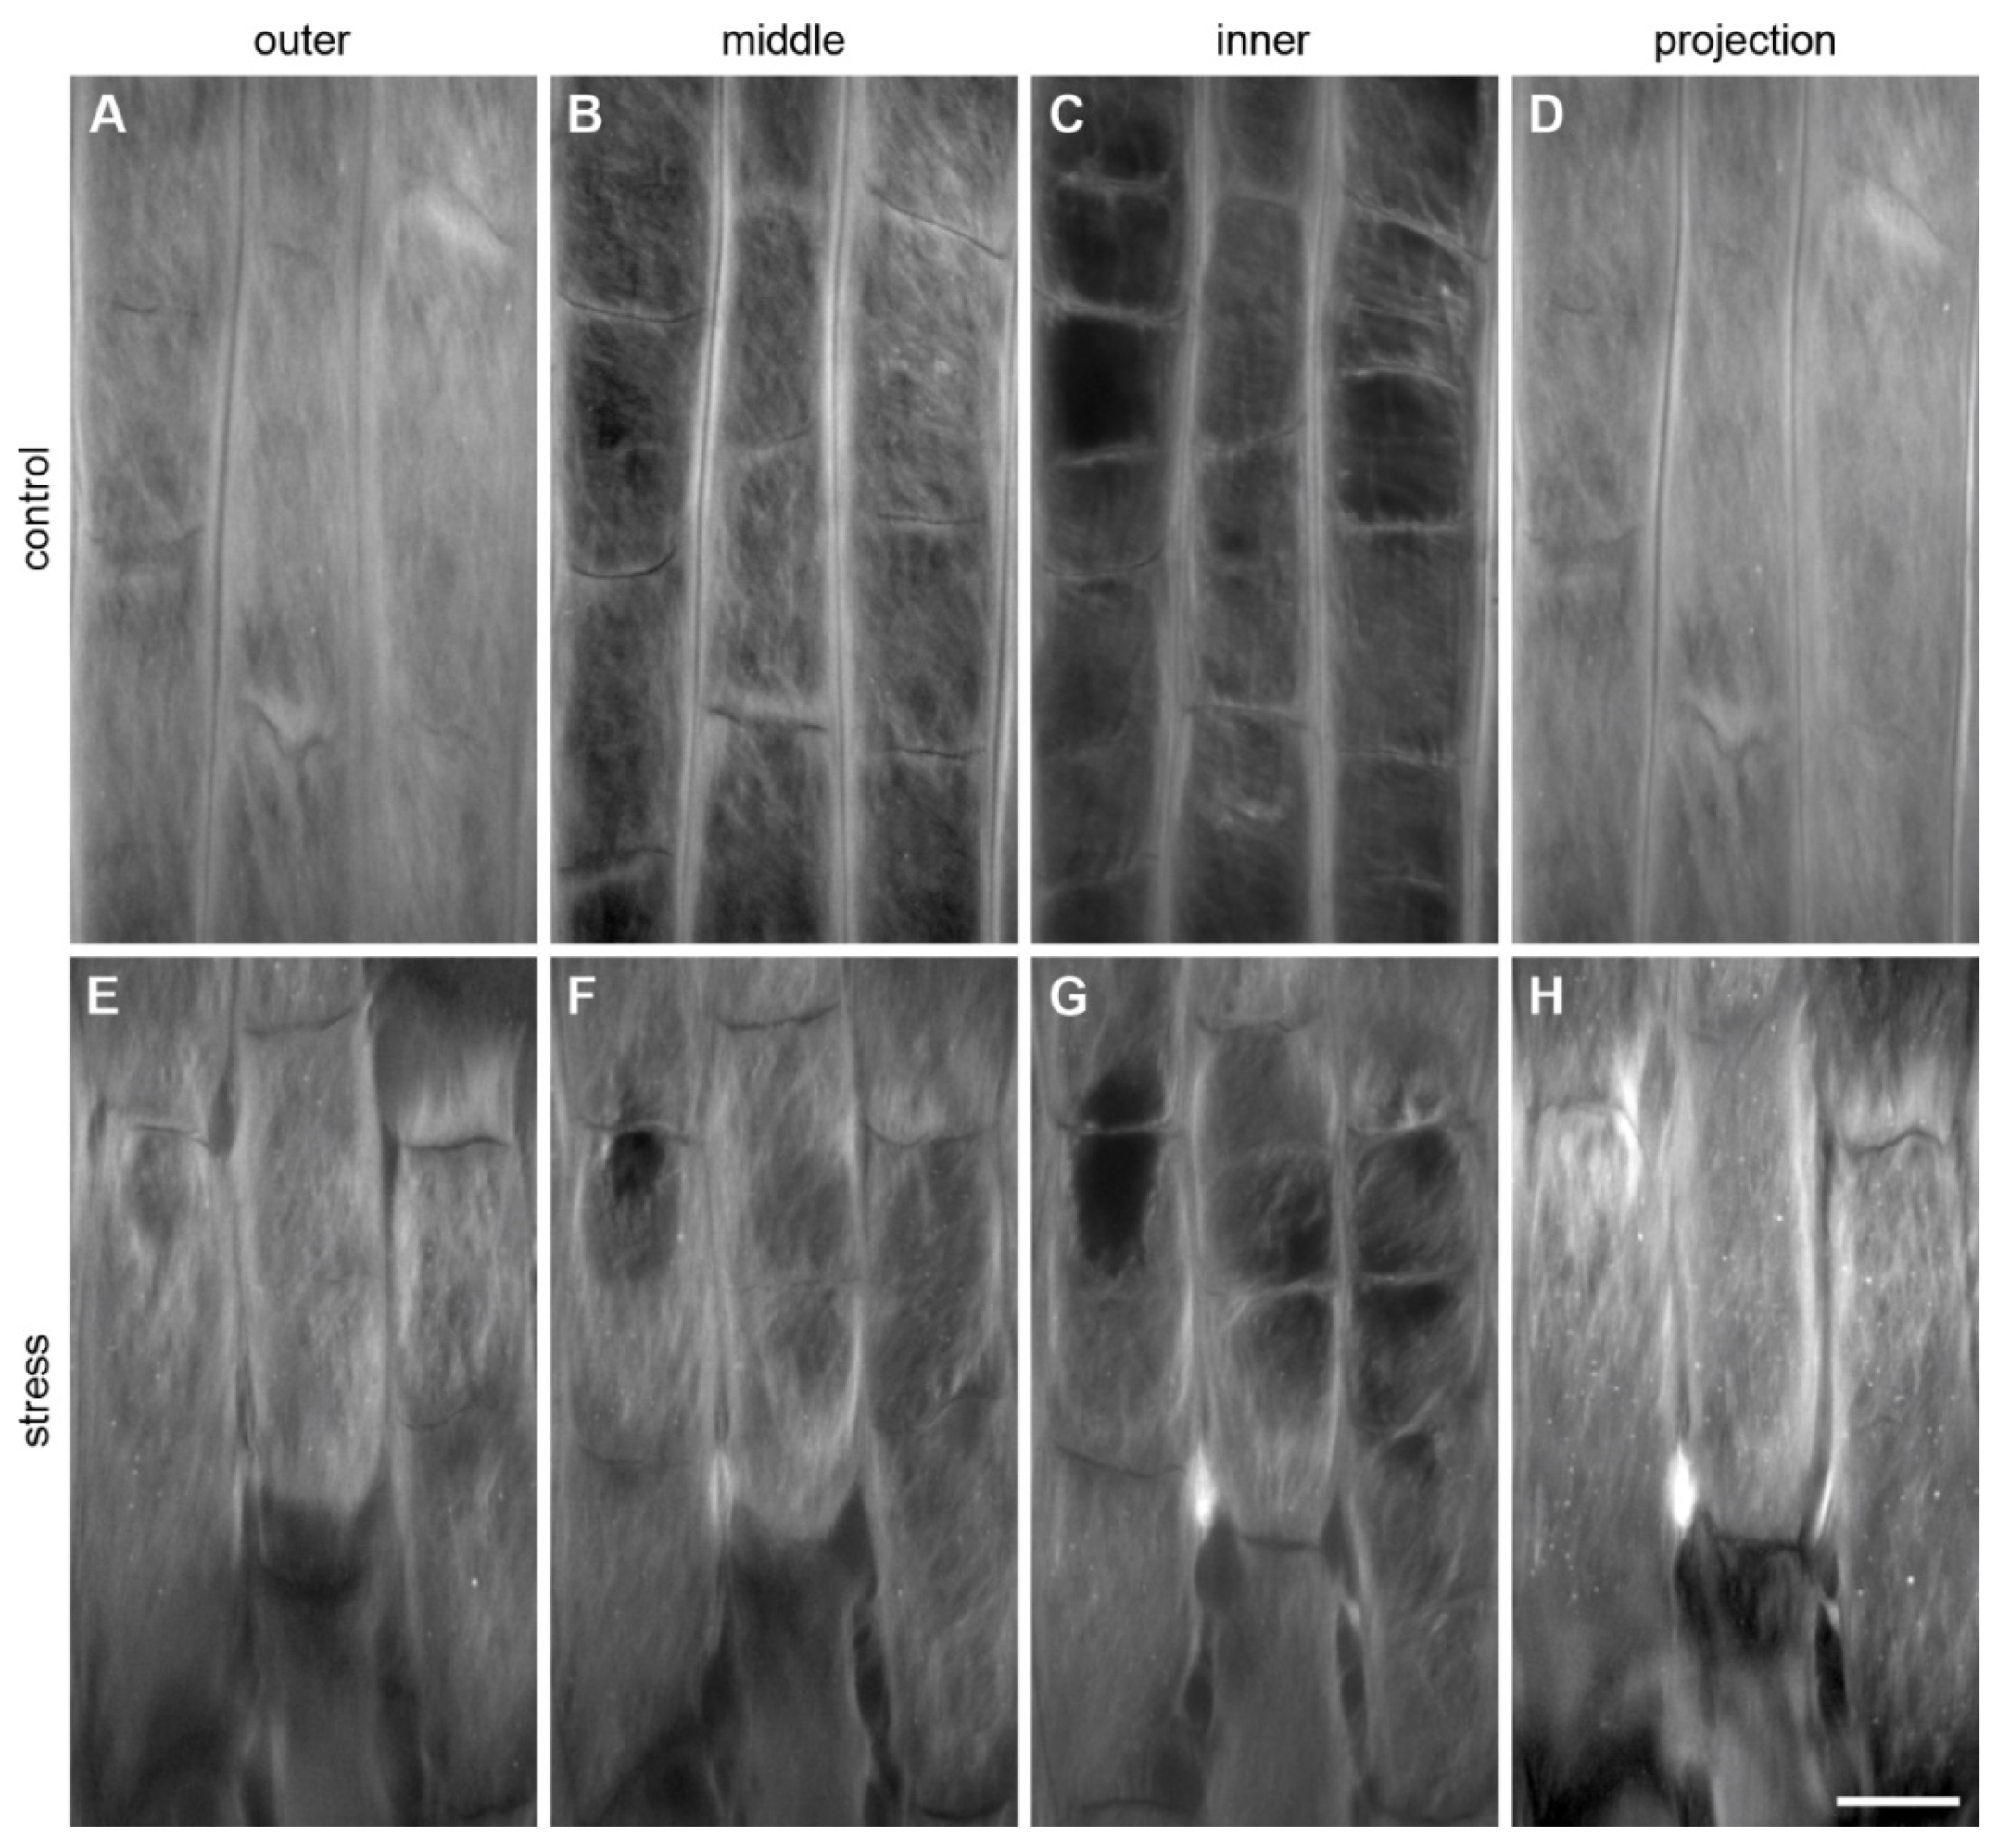
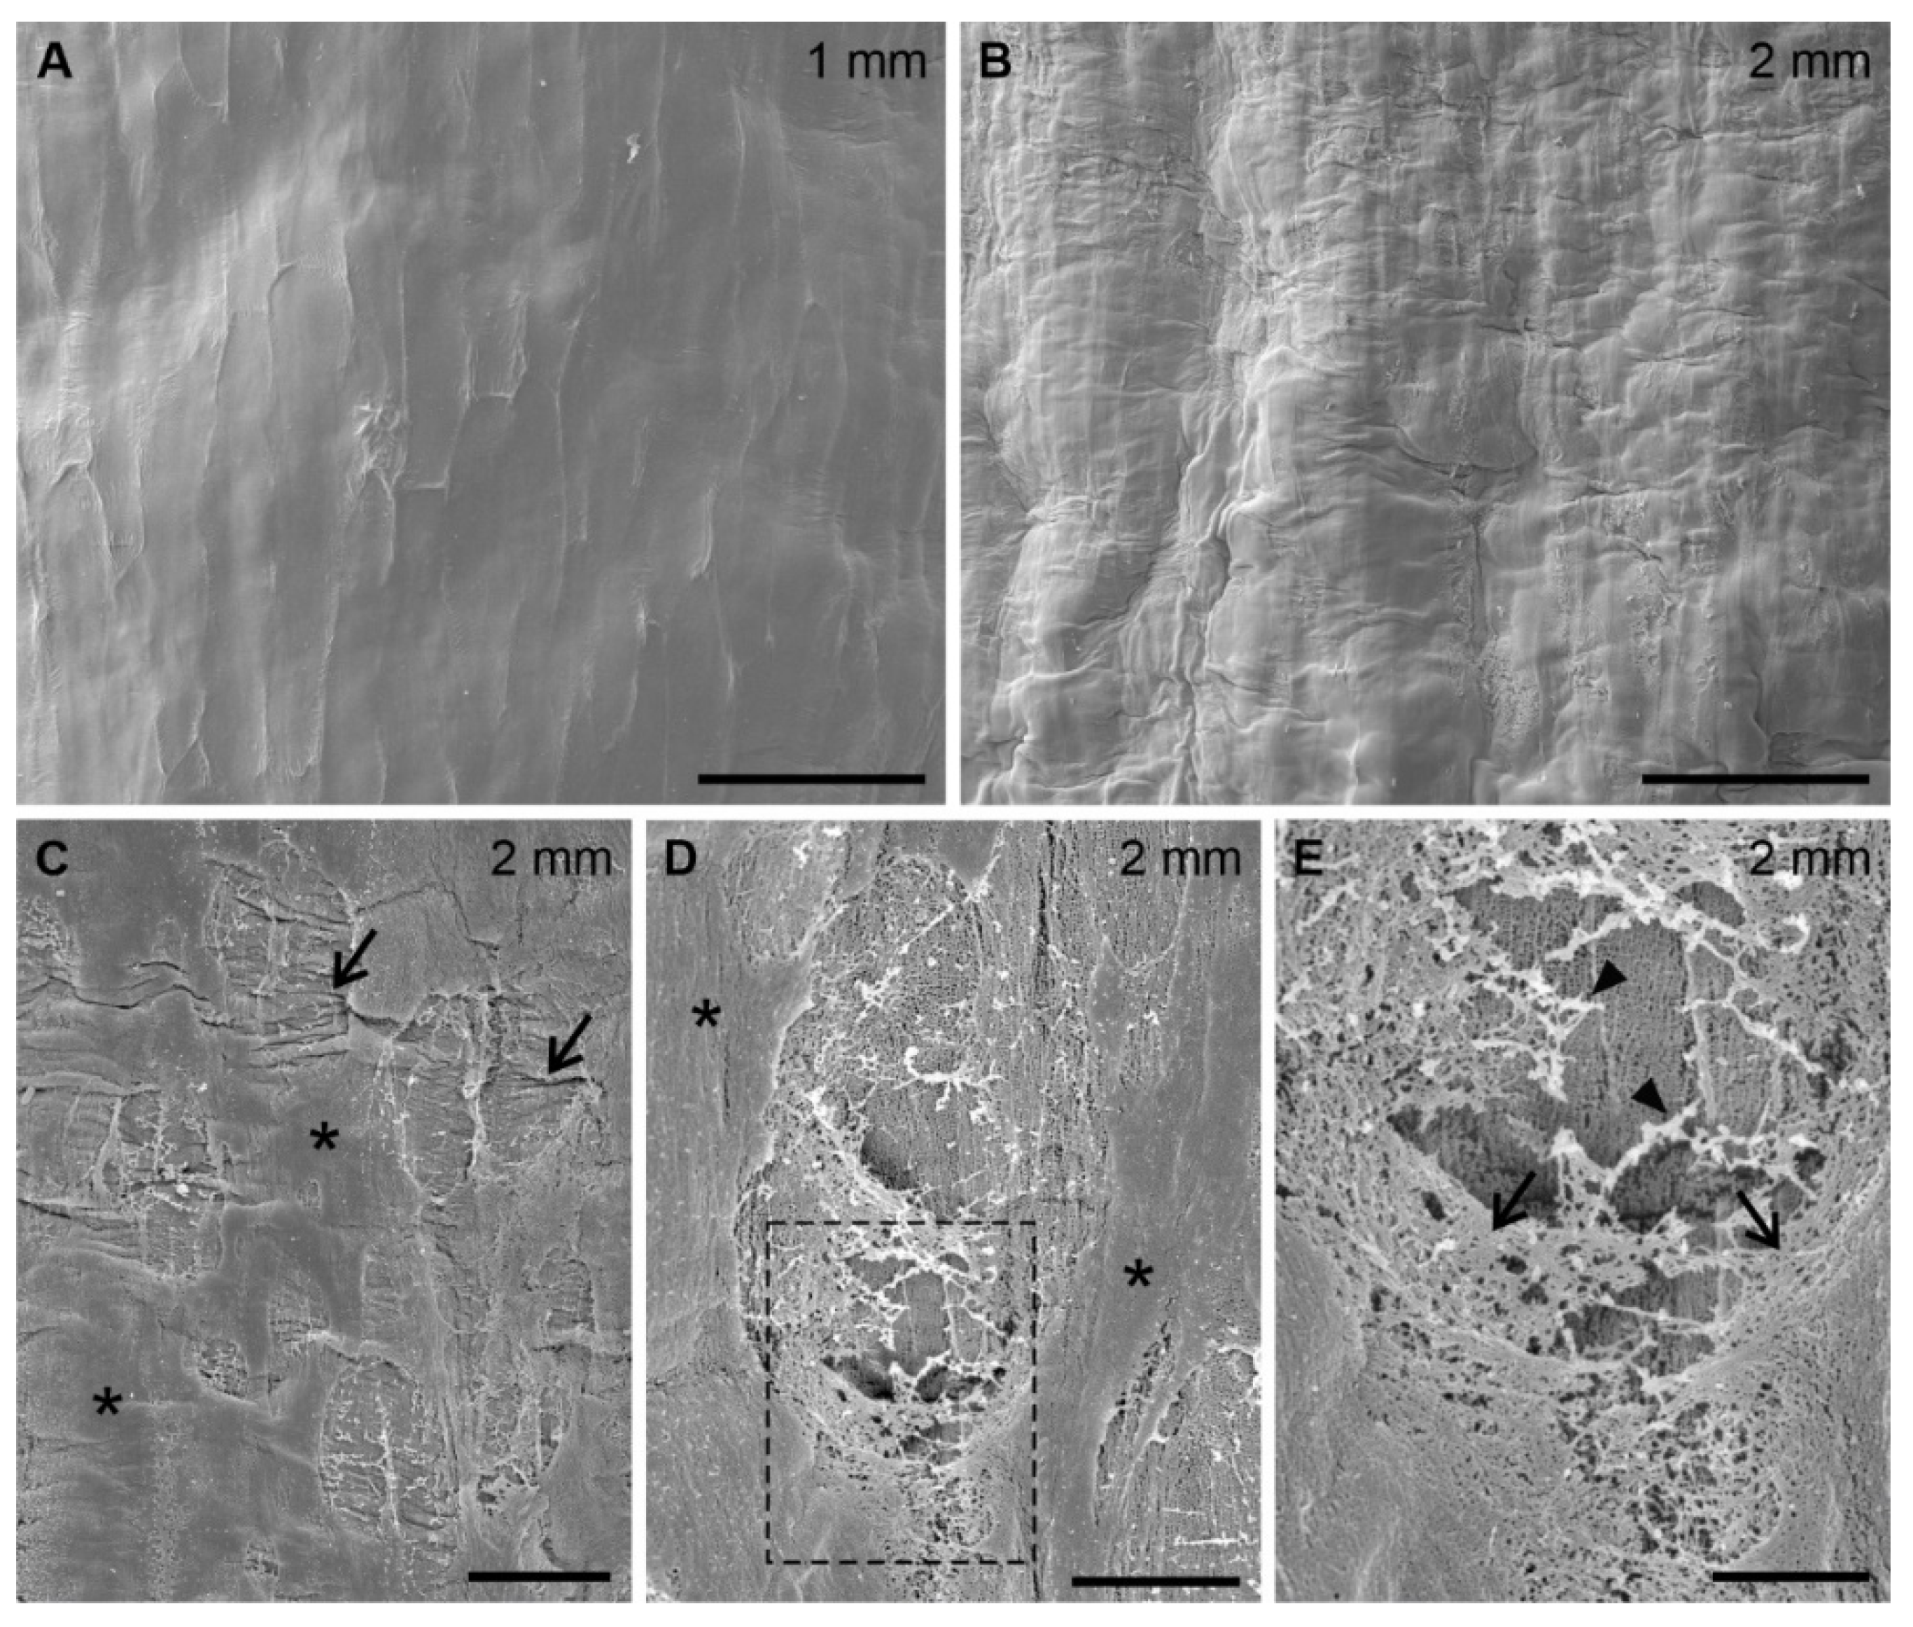
3.3.2. Changes in the Fibrillar Organization
3.3.3. Microdamage in the Root Superficial Layer
4. Discussion
4.1. On the Impact of Mechanical Stress on the Structure of the Epidermal Surface
4.2. On the Protective Role of the Pellicle
4.3. On the Boundary between the Regions of Living and Dead Cells
4.4. On the Root Surface Imaging
Author Contributions
Funding
Institutional Review Board Statement
Informed Consent Statement
Data Availability Statement
Acknowledgments
Conflicts of Interest
Appendix A. Orientation of Cellulose Fibrils in the Outer Periclinal Cell Wall of the Protoderm
Appendix B. Application Details of the Used Staining Techniques

| Stain | Specificity/Detection | References |
|---|---|---|
| Evans Blue | Cell viability | [52] |
| Proteins | [53] | |
| Propidium iodide | Cell viability/DNA (in dead cells) | [54,55] |
| Homogalacturonan | [56] | |
| Coomassie brilliant blue R-250 | Proteins | [57] |
| Calcofluor White | β-glucans (cellulose, xyloglucan, callose), chitin | [58,59] |
References
- Kolb, E.; Legué, V.; Bogeat-Triboulot, M.-B. Physical root-soil interactions. Phys. Biol. 2017, 14, 065004. [Google Scholar] [CrossRef]
- Dupuy, L.X.; Mimault, M.; Patko, D.; Ladmiral, V.; Ameduri, B.; MacDonald, M.P.; Ptashnyk, M. Micromechanics of root development in soil. Curr. Opin. Genet. Dev. 2018, 51, 18–25. [Google Scholar] [CrossRef] [PubMed] [Green Version]
- Abeysekera, R.M.; McCully, M.E. The epidermal surface of the maize root tip. I. Development in normal roots. New Phytol. 1993, 125, 413–429. [Google Scholar] [CrossRef] [PubMed]
- Abeysekera, R.M.; McCully, M.E. The epidermal surface of the maize root tip. II. Abnormalities in a mutant which grows crookedly through soil. New Phytol. 1993, 125, 801–811. [Google Scholar] [CrossRef]
- McCully, M.E.; Canny, M.J. Contributions of the surface of the root tip to the growth of Zea roots in soil. Plant Soil 1994, 165, 315–321. [Google Scholar] [CrossRef]
- Abeysekera, R.M.; McCully, M.E. The epidermal surface of the maize root tip. III. Isolation of the surface and characterization of some of its structural and mechanical properties. New Phytol. 1994, 127, 321–333. [Google Scholar] [CrossRef] [PubMed]
- Clarke, K.J.; McCully, M.E.; Miki, N.K. A developmental study of the epidermis of young roots of Zea mays L. Protoplasma 1979, 98, 283–309. [Google Scholar] [CrossRef]
- Miki, N.K.; Clarke, K.J.; McCully, M.E. A histological and histochemical comparison of the mucilages on the root tips of several grasses. Can. J. Bot. 1980, 58, 2581–2593. [Google Scholar] [CrossRef]
- Potocka, I.; Szymanowska-Pułka, J. Morphological responses of plant roots to mechanical stress. Ann. Bot. 2018, 122, 711–723. [Google Scholar] [CrossRef] [PubMed]
- Kuzeja, P.S.; Lintilhac, P.M.; Wei, C. Root elongation against a constant force: Experiment with a computerized feedback-controlled device. J. Plant Physiol. 2001, 158, 673–676. [Google Scholar] [CrossRef] [PubMed]
- Loades, K.W.; Bengough, A.G.; Bransby, M.F.; Hallett, P.D. Biomechanics of nodal, seminal and lateral roots of barley: Effects of diameter, waterlogging and mechanical impedance. Plant Soil 2013, 370, 407–418. [Google Scholar] [CrossRef]
- Lipiec, J.; Horn, R.; Pietrusiewicz, J.; Siczek, A. Effects of soil compaction on root elongation and anatomy of different cereal plant species. Soil Till. Res. 2012, 121, 74–81. [Google Scholar] [CrossRef]
- Veen, B.W. The influence of mechanical impedance on the growth of maize roots. Plant Soil 1982, 66, 101–109. [Google Scholar] [CrossRef]
- Atwell, B.J. Response of roots to mechanical impedance. Environ. Exp. Bot. 1993, 33, 27–40. [Google Scholar] [CrossRef]
- Hanbury, C.D.; Atwell, B.J. Growth dynamics of mechanically impeded lupin roots: Does altered morphology induce hypoxia? Ann. Bot. 2005, 96, 913–924. [Google Scholar] [CrossRef] [Green Version]
- De Zio, E.; Trupiano, D.; Montagnoli, A.; Terzaghi, M.; Chiatante, D.; Grosso, A.; Marra, M.; Scaloni, A.; Scippa, G.S. Poplar woody taproot under bending stress: The asymmetric response of the convex and concave sides. Ann. Bot. 2016, 118, 865–883. [Google Scholar] [CrossRef] [Green Version]
- Wilson, A.J.; Robards, A.W. Some observations of the effects of mechanical impedance upon the ultrastructure of the root caps of barley. Protoplasma 1979, 101, 61–72. [Google Scholar] [CrossRef]
- Potocka, I.; Szymanowska-Pułka, J.; Karczewski, J.; Nakielski, J. Effect of mechanical stress on Zea root apex. I. Mechanical stress leads to the switch from closed to open meristem organization. J. Exp. Bot. 2011, 62, 4583–4593. [Google Scholar] [CrossRef] [Green Version]
- Wilson, A.J.; Robards, A.W.; Goss, M.J. Effects of mechanical impedance on root growth in barley, Hordeum vulgare L. II. Effects on cell development in seminal roots. J. Exp. Bot. 1977, 28, 1216–1227. [Google Scholar] [CrossRef]
- Okamoto, T.; Tsurumi, S.; Shibasaki, K.; Obana, Y.; Takaji, H.; Oono, Y.; Rahman, A. Genetic dissection of hormonal responses in the roots of Arabidopsis grown under continuous mechanical impedance. Plant Physiol. 2008, 146, 1651–1662. [Google Scholar] [CrossRef] [Green Version]
- Šamaj, J.; Ensikat, H.-J.; Baluška, F.; Knox, J.P.; Barthlott, W.; Volkmann, D. Immunogold localization of plant surface arabinogalactan-proteins using glycerol liquid substitution and scanning electron microscopy. J. Microsc. 1999, 193, 150–157. [Google Scholar] [CrossRef] [PubMed] [Green Version]
- Chaboud, A.; Rougier, M. Ultrastructural study of the maize epidermal root surface. I. Preservation and extent of the mucilage layer. Protoplasma 1986, 130, 73–79. [Google Scholar] [CrossRef]
- Bacic, A.; Moody, S.F.; Clarke, A.E. Structural analysis of secreted root slime from maize (Zea mays L.). Plant Physiol. 1986, 80, 771–777. [Google Scholar] [CrossRef] [PubMed] [Green Version]
- Schildknecht, P.H.P.A.; de Castro, M.M.; Vidal, B.C. Histochemical analysis of the root epidermal mucilage in maize and wheat. Can. J. Bot. 2004, 82, 1419–1428. [Google Scholar] [CrossRef]
- Akiba, T.; Hibara, K.-I.; Kimura, F.; Tsuda, K.; Shibata, K.; Ishibashi, M.; Moriya, C.; Nakagawa, K.; Kurata, N.; Itoh, J.-I.; et al. Organ fusion and defective shoot development in oni3 mutants of rice. Plant Cell Physiol. 2014, 55, 42–51. [Google Scholar] [CrossRef] [PubMed] [Green Version]
- Baluška, F.; Kubica, Š.; Hauskrecht, M. Postmitotic ‘isodiametric’ cell growth in the maize root apex. Planta 1990, 181, 269–274. [Google Scholar] [CrossRef] [PubMed]
- Ishikawa, H.; Evans, M.L. The role of the distal elongation zone in the response of maize roots to auxin and gravity. Plant Physiol. 1993, 102, 1203–1210. [Google Scholar] [CrossRef] [Green Version]
- Talbot, M.J.; White, R.G. Methanol fixation of plant tissue for Scanning Electron Microscopy improves preservation of tissue morphology and dimensions. Plant Methods 2013, 9, 36. [Google Scholar] [CrossRef] [PubMed] [Green Version]
- Bengough, A.G.; McKenzie, B.M. Sloughing of root cap cells decreases the frictional resistance to maize (Zea mays L.) root growth. J. Exp. Bot. 1997, 48, 885–893. [Google Scholar] [CrossRef] [Green Version]
- Iijima, M.; Griffiths, B.; Bengough, A.G. Sloughing of cap cells and carbon exudation from maize seedling roots in compacted sand. New Phytol. 2000, 145, 477–482. [Google Scholar] [CrossRef]
- Beck, C.B. An Introduction to Plant Structure and Development: Plant Anatomy for the Twenty-First Century, 1st ed.; Cambridge University Press: Cambridge, UK, 2005; pp. 287–288. [Google Scholar]
- Mergemann, H.; Sauter, M. Ethylene induces epidermal cell death at the site of adventitious root emergence in rice. Plant Physiol. 2000, 124, 609–614. [Google Scholar] [CrossRef] [PubMed] [Green Version]
- Telewski, F.W. Mechanosensing and plant growth regulators elicited during the thigmomorphogenetic response. Front. For. Glob. Chang. 2021, 3, 574096. [Google Scholar] [CrossRef]
- Baluška, F.; Barlow, P.W.; Kubica, Š. Importance of the post-mitotic isodiametric growth (PIG) region for growth and development of roots. Plant Soil 1994, 167, 31–41. [Google Scholar] [CrossRef]
- Pritchard, J. The control of cell expansion in roots. New Phytol. 1994, 127, 3–26. [Google Scholar] [CrossRef]
- Goss, M.J.; Russell, R.S. Effects of mechanical impedance on root growth in barley (Hordeum vulgare L.). III. Observations on the mechanism of response. J. Exp. Bot. 1980, 31, 577–588. [Google Scholar] [CrossRef]
- Bengough, A.G.; Young, I.M. Root elongation of seedling peas through layered soil of different penetration resistances. Plant Soil 1993, 149, 129–139. [Google Scholar] [CrossRef]
- Croser, C.; Bengough, A.G.; Pritchard, J. The effect of mechanical impedance on root growth in pea (Pisum sativum). II. Cell expansion and wall rheology during recovery. Physiol. Plant. 2000, 109, 150–159. [Google Scholar] [CrossRef]
- Sadeghi, A.; Tonazzini, A.; Popova, L.; Mazzolai, B. A novel growing device inspired by plant root soil penetration behaviors. PLoS ONE 2014, 9, e90139. [Google Scholar] [CrossRef] [PubMed] [Green Version]
- Souty, N.; Rode, C. Aspect mécanique de la croissance des racines. I.-Mesure de la force de pénétration. Agronomie 1987, 7, 623–630. [Google Scholar] [CrossRef] [Green Version]
- Iijima, M.; Kono, Y. Development of Golgi apparatus in the root cap cells of maize (Zea mays L.) as affected by compacted soil. Ann. Bot. 1992, 70, 207–212. [Google Scholar] [CrossRef]
- Iijima, M.; Barlow, P.W.; Bengough, A.G. Root cap structure and cell production rates of maize (Zea mays) roots in compacted sand. New Phytol. 2003, 160, 127–134. [Google Scholar] [CrossRef] [PubMed]
- Roué, J.; Chauvet, H.; Brunel-Michac, N.; Bizet, F.; Moulia, B.; Badel, E.; Legué, V. Root cap size and shape influence responses to the physical strength of the growth medium in Arabidopsis thaliana primary roots. J. Exp. Bot. 2020, 71, 126–137. [Google Scholar] [CrossRef]
- Bengough, A.G.; Bransby, M.F.; Hans, J.; McKenna, S.J.; Roberts, T.J.; Valentine, T.A. Root responses to soil physical conditions; growth dynamics from field to cell. J. Exp. Bot. 2006, 57, 437–447. [Google Scholar] [CrossRef] [Green Version]
- Bennett, T.; van den Toorn, A.; Sanchez-Perez, G.F.; Campilho, A.; Willemsen, V.; Snel, B.; Scheres, B. SOMBRERO, BEARSKIN1, and BEARSKIN2 regulate root cap maturation in Arabidopsis. Plant Cell 2010, 22, 640–654. [Google Scholar] [CrossRef] [PubMed] [Green Version]
- Erickson, R.O. Symplastic growth and symplasmic transport. Plant Physiol. 1986, 82, 1153. [Google Scholar] [CrossRef] [PubMed] [Green Version]
- Clark, L.J.; Whalley, W.R.; Barraclough, P.B. How do roots penetrate strong soil? Plant Soil 2003, 255, 93–104. [Google Scholar] [CrossRef]
- Alarcón, M.V.; Salguero, J. Transition zone cells reach G2 phase before initiating elongation in maize root apex. Biol. Open 2017, 6, 909–913. [Google Scholar] [CrossRef] [Green Version]
- Wilson, B.F. Root growth around barriers. Bot. Gaz. 1967, 128, 79–82. [Google Scholar] [CrossRef]
- Jin, W.; Aufrecht, J.; Patino-Ramirez, F.; Cabral, H.; Arson, C.; Retterer, S.T. Modeling root system growth around obstacles. Sci. Rep. 2020, 10, 15868. [Google Scholar] [CrossRef]
- Kong, X.; Liu, G.; Liu, J.; Ding, Z. The root transition zone: A hot spot for signal crosstalk. Trends Plant Sci. 2018, 23, 403–409. [Google Scholar] [CrossRef]
- Gaff, D.F.; Okong’O-Ogola, O. The use of non-permeating pigments for testing the survival of cells. J. Exp. Bot. 1971, 22, 756–758. [Google Scholar] [CrossRef]
- Na, D.-S.; Hong, H.-Y.; Yoo, G.-S.; Choi, J.-K. Evans Blue staining method for detection of proteins on polyacrylamide gels with rhodamine B. Anal. Lett. 1994, 27, 1265–1275. [Google Scholar] [CrossRef]
- Deitch, A.D.; Law, H.; White, R.D. A stable propidium iodide staining procedure for flow cytometry. J. Histochem. Cytochem. 1982, 30, 967–972. [Google Scholar] [CrossRef] [Green Version]
- Jones, K.H.; Senft, J.A. An Improved method to determine cell viability by simultaneous staining with fluorescein diacetate-propidium iodide. J. Histochem. Cytochem. 1985, 33, 77–79. [Google Scholar] [CrossRef] [Green Version]
- Rounds, C.M.; Lubeck, E.; Hepler, P.K.; Winship, L.J. Propidium iodide competes with Ca2+ to label pectin in pollen tubes and Arabidopsis root hairs. Plant Physiol. 2011, 157, 175–187. [Google Scholar] [CrossRef] [Green Version]
- Fisher, D.B. Protein staining of ribboned epon sections for light microscopy. Histochemie 1968, 16, 92–96. [Google Scholar] [CrossRef] [PubMed]
- Hughes, J.; McCully, M.E. The use of an optical brightener in the study of plant structure. Stain Technol. 1975, 50, 319–329. [Google Scholar] [CrossRef]
- Bidhendi, A.J.; Chebli, Y.; Geitmann, A. Fluorescence visualization of cellulose and pectin in the primary plant cell wall. J. Microsc. 2020, 278, 164–181. [Google Scholar] [CrossRef] [PubMed]


| Control Root | Stressed Root | Recovering Root | |
|---|---|---|---|
| Meristematic zone (MZ) | |||
| Viability | all protodermal cells alive | all protodermal cells alive | all protodermal cells alive |
| Outer pellicle layer L3 | continuous | continuous, thicker compared to control | continuous, thicker compared to control |
| Surface microstructure | smooth and featureless | regularly arranged fusiform tears | smooth and featureless |
| Transition zone (TZ) | |||
| Viability | all young epidermal cells alive | single dead young epidermal cells | all young epidermal cells dead |
| Outer pellicle layer L3 | continuous, less pronounced than in MZ | continuous, thicker compared to control, less pronounced than in MZ | discontinuous and diffuse |
| Surface microstructure | smooth and featureless | regularly arranged fusiform tears | wrinkles, irregular damage/holes |
Publisher’s Note: MDPI stays neutral with regard to jurisdictional claims in published maps and institutional affiliations. |
© 2021 by the authors. Licensee MDPI, Basel, Switzerland. This article is an open access article distributed under the terms and conditions of the Creative Commons Attribution (CC BY) license (https://creativecommons.org/licenses/by/4.0/).
Share and Cite
Potocka, I.; Szymanowska-Pułka, J. The Pellicle–Another Strategy of the Root Apex Protection against Mechanical Stress? Int. J. Mol. Sci. 2021, 22, 12711. https://doi.org/10.3390/ijms222312711
Potocka I, Szymanowska-Pułka J. The Pellicle–Another Strategy of the Root Apex Protection against Mechanical Stress? International Journal of Molecular Sciences. 2021; 22(23):12711. https://doi.org/10.3390/ijms222312711
Chicago/Turabian StylePotocka, Izabela, and Joanna Szymanowska-Pułka. 2021. "The Pellicle–Another Strategy of the Root Apex Protection against Mechanical Stress?" International Journal of Molecular Sciences 22, no. 23: 12711. https://doi.org/10.3390/ijms222312711
APA StylePotocka, I., & Szymanowska-Pułka, J. (2021). The Pellicle–Another Strategy of the Root Apex Protection against Mechanical Stress? International Journal of Molecular Sciences, 22(23), 12711. https://doi.org/10.3390/ijms222312711