Abstract
The COVID-19 pandemic, the blocking of activity by the government and the restrictions imposed in Romania had detrimental effects on the activity of restaurants, imposing their adaptation to new situations and generating creative innovations that caused changes in the way restaurants deliver food to consumers through food order & delivery platforms. Exploring the nature and implications of such innovations on resilience, this study analyzes their impact on the attitude and intention to use food delivery platforms by restaurant managers in Romania during the COVID-19 pandemic. Through the proposed structural model, the authors integrate innovations in resilience by joining together the new components of the established TAM model. This research was conducted on a sample of 402 restaurant managers in Romania. The data was collected based on a questionnaire, and it was analyzed with the SmartPLS3 software. The results of the study show that the four variables of innovation, namely business strategy innovations, technological innovations, financial innovations and social innovations, exert different effects on behavioral intention and attitude towards using the order & delivery platforms. The results of the study can be key points in the more efficient management of material, financial and human resources, thus improving the commercial performance of restaurants.
1. Introduction
The hospitality industry in Romania, as in all countries, has been affected by an unprecedented crisis since 2020. The COVID-19 pandemic has had major effects on the global hospitality market [1,2]. By the end of June 2021, the incidence of COVID-19 remains very high at global level, the cumulative number of reported cases being higher than 180 million, with almost 4 million deaths [3]. As a result, in addition to the restrictions imposed on limiting the spread of the coronavirus infections, all governments around the world have decided that the economic operators engaged in the preparation, marketing and consumption of food and/or alcoholic and non-alcoholic beverages, such as restaurants and cafes, should temporarily suspend their activity inside buildings or other public spaces or should carry out such activity partially, without exceeding 30–50% of their maximum capacity of the space [4]. In this context, the global hospitality industry has faced many economic and social problems such as: layoffs, difficulties in paying the salaries, rents, taxes and duties to the state budget, significant reduction in sales revenue, loss of customers and others [2,5]. On the other hand, positive changes can be signaled, including the increase of the concerns of the companies in the field in the direction of extending the health security measures [1] and of the sustainable development [5].
The global restaurant delivery market recorded total revenues of 107.44 billion US dollars in 2019, with forecasts estimating an increase of more than 154 billion US dollars for 2023 [6]. In Europe, applications used for food and beverage deliveries recorded installation records in the last two quarters of 2020, with the total volume of installations at the end of 2020 being 386 million. The most downloaded food delivery applications on the European continent were: UberEats (with a market share of 22%), Just Eat Takeaway (with a market share of 18%), followed by Deliveroo (12%), Yemeksepeti (9%), De-livery Club (7%) and SberMarket (6%) [7]. In Romania, the most commonly used applications for food delivery are: Glovo, followed by FoodPanda, UberEats and TakeAway [8].
The COVID-19 pandemic triggered intense discussions about the vulnerability of public catering systems in Romania, about the uncertainty of food supply and distribution chains at national level, as well as about ensuring food security. The spread of the SARS-CoV-2 virus, the blocking of the restaurants’ activity by the Romanian government and the restrictions imposed in the last two years have had a number of negative effects and have triggered a variety of creative innovations that have changed the way in which restaurants deliver food to consumers, and the strategies of restaurant managers for the integration and use of the food order & delivery platforms, innovations necessary for the functional maintenance of this sector of activity [9]. The HoReCa industry in Romania faced numerous economic and social problems during this period, being forced to cease its activity, according to the government decision (GD 35/2021) [10]. At the end of 2020, the turnover in the hospitality industry decreased to 17.9 billion lei, by 38% less than in 2019. Also, 19% of employees in the restaurant industry were fired, leading to the loss of over 40,000 jobs and net losses of more than 2.3 billion lei [11]. The year 2020 brought the largest increase in net losses in the hospitality industry, respectively 220%, being considered the most unfavorable year of Romanian hospitality after the economic recession of 1989 [12].
In this pandemic context, it is fundamental to build an active resilience within the restaurant sector, and the development of the delivery segment is an essential component of this approach [13]. The delivery system is not new for restaurants, but the current conditions of epidemiological crisis have favored its massive expansion, generating many challenges related to the production, packaging, transport and delivery practices used to provide public catering services, all coupled with the adoption of unprecedented health security measures [13,14,15]. The implementation of the new processes was based on the adoption of innovative procedures, the recovery and consolidation of the restaurant sector being possible by attracting material, financial, human and informational resources that ensured the fulfillment of the goals of efficiency and profitability. In the future, in order to guide the responses of governmental and managerial policies, but also to facilitate the development of more resistant long-term food systems, it is necessary to understand two important aspects, namely: (1) how resilient were the economic operators in Romania who carry out public catering activities and (2) what were the resilience innovations introduced by restaurant managers, in response to the COVID-19 pandemic and government-imposed restrictions.
The study’s decision-making problem involves answering the questions: (a) what were the resilience innovations stimulated by the COVID-19 pandemic, (b) what is the behavior of restaurant managers related to the acceptance of technologies (food platforms) and (c) how do these measures influence attitude and intention related to the use of food order and delivery platforms so as to ensure the continuity and development of the activity of restaurants in Romania?
The main purpose of the research is to validate the conceptual model by assessing the impact of resilience innovations on the attitude and intention of using food order and delivery platforms in accordance with the influence of utility and ease of use perceived among restaurant managers in Romania, in the context of the COVID-19 pandemic.
The objectives of the research are: to identify the nature of the innovations in resilience and to evaluate their impact on the attitude and intention of managers regarding the use of food order and delivery platforms (O1); analysis of the influence of perceived usefulness and perceived ease of use by the Romanian managers of the food order and delivery platforms, based on an empirical model of acceptance of technology (TAM) (O2); identification of significant differences between the groups specific to the analyzed socio-demographic characteristics—gender, age, education, types of restaurant managers and frequency of orders received per day.
The reason for the choice of this theme by the authors derives from the desire to know how restaurant managers came to think of resilience innovations, to accept and use ordering and fast delivery platforms in the context of the Covid-19 pandemic. The huge impact that the COVID-19 virus has had on restaurants has led to the emergence of distinct needs related to digital infrastructure and, in particular, the use of delivery platforms and convinced managers that resilience innovations can contribute to the development of a business environment more intelligent (by integrating new products, technologies and applications), creating a more inclusive world and increasing the value of Romanian society, now and in the future.
The paper was structured as follows: Section 2 presents the most representative scientific works published on the topic of resilience in the industry of restaurants and the evolution of the market for food order and delivery platforms; Section 3 describes the research methodology; Section 4 presents the results obtained after applying the PLS–SEM algorithm and the multigroup analysis (PLS-MGA). The last section highlights the academic and managerial implications, the limits of the research, as well as the future directions of research.
2. Literature Review
2.1. COVID-19 and Resilience Innovations in the Restaurant Industry
The concept of resilience has different interpretations and definitions in the literature [13,16,17,18,19,20,21]. In the generally accepted sense, resilience is an attribute that expresses both the ability to overcome inconveniences and uncertainties and the ability to recover from an unpleasant experience [16]. Resilience is based on three key dimensions, namely: (a) the ability to prevent negative consequences, (b) the ability to prevent the worsening of negative consequences, and (c) the ability to recover from the negative consequences [18]. The concept of resilience emanated from different disciplines, which explains the various topics addressed: psychology, health, ecology, organization management, engineering, public policy, regional policy, etc. [17,19,20,21,22]. Also, previously published studies analyze other conceptual categories of resilience, namely those of economic resilience [20,23,24], social resilience [18,25,26], organizational resilience [18,20,22].
Economic resilience is manifested both at the macro level, by instant resilience (the ability to limit the number of immediate production losses for certain amounts of impaired assets) and dynamic resilience (the ability to rebuild and recover), and at the micro level by ensuring the efficient distribution of losses, the ability to mitigate shocks on household incomes over time through savings, loans and insurance, fiscal relaxation measures, strengthening the social protection system or developing risk-sharing mechanisms among the population [24]. Social resilience is a concept with extended applicability, reflecting the ability of a social unit, a group or a community to respond to stress or disturbances from the external environment [25]. Social resilience can be analyzed considering crises at the individual level, at the level of the family, the tribe/clan, a locality or community, at the level of an organization (including private companies) or at the level of systems such as the environmental or economic ones [26]. Organizational resilience focuses on identifying positive strategies to substantiate the changes that are required in times of crisis [18]. Organizational resilience is different from the concepts of adaptation, flexibility, improvisation, recovery, redundancy or robustness, as it represents the response to a destructive situation and therefore highlights the ability to recover under conditions of uncertainty and urgency [20]. The attribute of resilience is an essential coordinate line of companies, both for overcoming unfavorable moments and for maintaining the interest of stakeholders [21]. Equally, it is appreciated that knowledge management is the most important factor, with a positive and significant influence on organizational resilience which, in turn, is the foundation of organizational performance [27].
The resilience of small and medium-sized businesses in the hospitality industry has been the subject of extensive international research [28,29,30,31,32,33,34]. Most companies in the hospitality industry fall into the category of small and medium-sized enterprises, being more vulnerable in times of crisis, mainly due to limited organizational resources and capabilities [35]. Previous studies have focused on the organizational resilience manifested following the occurrence of crises and natural disasters [28,29], due to health crises (SARS, Ebola etc.) [31,32] or political instability/terrorism [33,34]. The COVID-19 pandemic has widened the scope of analyses on the organizational resilience of small and medium-sized businesses in the hospitality industry [13,36,37,38,39,40,41,42,43]. Emphasizing the value and importance of the resilience of tourism firms, Jiang, Ritchie and Verreynne (2019) analyze the need to use the capabilities and resources available to transform current operational routines into resilient actions [28]. Elements of capability refer to the possibility of innovation, the dynamic ability to withstand the shocks caused by the crisis (material, financial and human losses) for a long time, the ability to quickly and efficiently use new technologies, but also behavior (agile leadership) and knowledge (stock of financial, legislative, technological, environmental knowledge etc.) [44]. On the other hand, Neise, Verfürth and Franz (2021) highlight the dependence of restaurants’ resilient behavior on their positive economic and financial situation before the COVID-19 pandemic and emphasize the importance of managerial experience and knowledge in overcoming crisis situations [40]. At the same time, Li et al. (2021) note that the resilient behavior of restaurants is based on innovative processes that will contribute to achieving a new balance in this sector of activity [38].
So far, little systematic information has been identified as available on these entrepreneurial institutional responses and creative actions. A number of innovations could have significant importance and a major impact on the restaurant industry, in particular contributing to its support in the future. Several mutually sustaining types of resilience innovations have been identified:
1. Social Innovations (SI) refers to the set of actions for the design and implementation of new solutions that involve extensive conceptual, procedural or organizational changes, which are intended on the one hand to improve the well-being of individuals and the community, and on the other hand, to lead to the reorganization of work, to reduce the deficiencies of access to work and to increase the safety of workers. The practice of social innovation in restaurants has the role of uniting employees from different backgrounds, cultures and thinking, to align them around common business-specific objectives, to educate and improve them continuously through trainings, but also, in order to redesign and reconsider the working conditions, work safety [45]. Previous research has focused on understanding the characteristics of work in the virtual environment where individual tasks are combined with group tasks and time spent working on one’s own. The forced transition to virtual work, caused by the COVID-19 pandemic, has fundamentally transformed activities that require teamwork, facilitated or sabotaged team performance, and led restaurant staff to adapt and reflect on the use of digital technology in order to do business [46,47]. Along with the transition to virtual work, some studies show that the work process may involve other new tasks such as: taking orders over the phone, transporting and/or delivering the products to customers’ homes [48,49]. To create value, restaurant operators can integrate and use digital learning ecosystems [50], providing employees with new platforms meant to access the different types of content, data, and learning and development (L&D) applications that are needed in order to improve knowledge in the workplace and to ensure better connections, interactions and teamwork [51]. During the COVID-19 pandemic, restaurant hygiene and cleanliness and food and staff safety measures became important points in the resilience plan. A recent study explored the role of technology in ensuring hygiene and cleanliness as well as its contribution to improving operational efficiency in the context of hospitality [52]. In the restaurant sector, resilience efforts are meant to protect the health of those who consume food, but also of those who produce and deliver it [13]. Through the creative initiatives of employees, restaurants seek to build resilience during the pandemic by respecting the principles and general requirements of food laws and by establishing and applying procedures and practices in the field of food safety, maintaining productivity and efficiency in the market [53]. Prioritizing employees’ well-being in restaurants is another major coordinate of social innovations implemented during the COVID-19 pandemic, and the specific procedures identified in the profile literature focus on: flexibility in organizing work exchanges and establishing days off [49,54], employee training on the use of digital tools designed to facilitate the relationship with customers and collaboration in work teams [47,48,52] initiating open discussions with managers and co-workers to help reduce psychological stress among employees [47,49,54], encourage leisure activities, increase employees’ attention to healthy eating, and possibly even reducing the weekly working time in order to reduce the overload during this period [54].
2. Business strategy innovations (BI). Recent developments have changed the traditional balance and mode of communication between restaurant operators and customers [55]. The integration of new communication and computer technologies has prompted restaurant operators to focus more on customers and create value by providing new products and services that meet current needs. Business innovation strategies represent the commitment of the staff to a common innovation mission and to a set of activities meant to compete in the development of the organization in the future. Restaurants need clearly defined plans to achieve their growth and sustainable goals by identifying new consumer segments, by improving products, by identifying and adopting new strategies for presenting, promoting and delivering food [56]. Only by adopting well-developed business models will restaurants succeed in producing, delivering and capturing value from their innovations. Within hospitality companies, the application of the Business Continuity Management concept has gained momentum, especially in times of crisis, and innovative practices, among which the most relevant are the application of new technologies, especially in communication strategies, strengthening collaborations with external stakeholders or continuous training of employees, which are the prerogatives of survival [42,57,58]. During the COVID-19 pandemic, managers understood that innovation remains essential in order to ensure the continuity and success of their own restaurants. Therefore, they have adopted new innovative strategies regarding the acquisition of quality food ingredients, the expansion of recipes or services offered, the use of platforms necessary for delivering food to customers, so as to maintain a competitive advantage over the competition but also to generate additional revenue from the sale of independent ingredients or services [59]. Rethinking the product offering, mainly by simplifying the menu list, focusing on preparations that can be sold in the delivery system, reducing portions, purchasing smaller quantities of raw materials and reconsidering stock management [38,48,60], sale at reduced prices or donation of unsold preparations to various institutions, companies or employees [60], introduction into production of semi-finished products that can be marketed through the catering system [38], identification simple ways to support the identity of a restaurant through personalized take-away packaging and ensure the proper preservation of the temperature of the dishes [48] are measures that highlight the involvement of restaurants in finding innovative operating solutions during this period.
Coupling innovation strategies to the design of the business model involves making major changes such as identifying new market segments, creating value propositions for each segment, configuring the entire business in such a way to produce and deliver that value and identifying various issues which could affect the business model and strategy through the imitation of the competitors or through the disinterest shown by customers [61,62]. However, few managers use social networks strategically or creatively, in order to improve restaurant management or to monitor or use the information thus collected so as to develop future operations [63].
3. Technological innovations (TI). Technological innovation refers to the introduction of additional actions for the development of new products and/or processes as well as significant improvements in the characteristics of current technologies in a different way from the one practiced so far [64]. The implementation of product innovations involves radical innovation that aims to create new products with a different design, components and manufacturing methods and incremental innovation aims to improve the characteristics of existing products. On the other hand, process innovations involve the implementation of new or significantly improved production and delivery methods. In the case of restaurants, production methods involve techniques, equipment, software used to produce food, while delivery methods refer to supply systems, inventory management and the means of delivery of prepared food [65]. The restaurant industry needs to accelerate the integration of technological innovations in order to reinvent itself and to make progress. Most of these technological innovations have changed the way restaurants offer and promote their menus, the system of reservation of tables by the consumers, the ordering and payment procedures but also the way of managing food, beverages and the flow of payments [42,66].
Published studies examine the importance of product or service innovations for the restaurants’ success [67,68]. Online and Mobile Ordering have provided convenient solutions for most customers: the ability to view and navigate the online menu at will, ordering additional items, eliminating incorrect orders or the wasting of food, viewing the invoice value and framing in a predetermined budget. Thus, online or mobile orders are an element of differentiation, while also ensuring the certainty of orders placed [69]. The implementation of mobile applications in restaurants has contributed to increasing potential revenues and customer numbers, offering restaurant management multiple possibilities such as: location-based deals—transmission, through a small device of push notifications, of personalized offers to customers, from the physical proximity of the location, attracting customers for lunch or dinner; loyalty & referral programs—downloading the restaurant application in exchange for exclusive offers and agreements and/or loyalty promotions for friends, family, by allocating points or credits, depending on the number of people or the value of the invoice, increased sales amongst millennials—accessing menus and placing orders on people’s smartphone or tablet or online payment [70]. As the Voice user interface (VUI) grows in popularity, some studies have focused on investigating how voice-activated devices and state-of-the-art AI and ML technology help simplify ordering and provide fast, non-contact services from the restaurants to the customers [71,72]. In order to reduce human contact and strengthen food safety, restaurants have quickly integrated the Curbside pickup service. In this context, consumers’ risk perceptions of COVID-19 regarding the quality and packaging of food by the restaurant were explored [73]. Some restaurants, in order to withstand market conditions, have chosen the solution of “Virtual” restaurants and menus, giving up their own space and offering only menus online, from different platforms, and solely for home delivery [74].
Restrictions on the availability of food and alcohol during the COVID-19 pandemic have led to a shift from local consumption (in pubs, bars, restaurants and cafes) to off-premises consumption (take-away and home delivery). Some studies have looked at comparing food and beverage consumption before and after the restrictions imposed during the three waves of the COVID-19 pandemic in different countries [75]. A series of studies have explored the perceptions and behaviors of customers who have used orders over the phone, online and through chatbots, highlighting the advantages of the takeout solution especially for fast-service restaurants with simple menus [76]. Using digital programming, restaurant managers can ensure better staff scheduling through multiple actions such as keeping track of shifts, setting filters to ensure the optimal number of staff based on sales values, accessing time-off requests, shift-swaps and reduction of labor costs [77]. Technological innovations also include the use of food temperature monitoring equipment, maintaining food safety for longer periods, monitoring the working time for kitchen teams, and the positive effects of implementing these technologies consist in avoiding waste and foodborne illness [78]. Food and beverage-specific online inventory technologies allow restaurant managers to keep track of inventory in a safe, fast and reliable way, on mobile devices or by integrating platforms into the POS systems, streamlining their processes to better track any real-time stock fluctuation, as well as streamlining the raw materials procurement process and reducing shopping time [79,80]. These solutions contribute to the improvement of the daily production planning and prove to be useful in the direction of sensitizing customers and employees on the need to mitigate food waste [60,79].
Technologies along with staff, processes and data are part of an information system that restaurants use both to increase performance and to assess how employees interact with technologies in order to support the business process. At the level of each restaurant there is an information system that ensures the connection between the decisional and the operational system. Thus, the use of technologies has an overwhelming importance in the functioning of the information system, contributing to the development of numerous activities, among which we mention: the introduction in the operational system of the data regarding the acquisitions of raw materials and their processing regarding the assurance of food safety and security; taking orders and making deliveries respecting sanitary standards and maintaining food quality; obtaining information related to staff shortages, safety and the time needed to prepare food in order to adopt the best decisions that will be transmitted later to the operational system, performing control and monitoring compliance with all decisions taken by restaurant managers. However, the activities carried out by restaurants also involve computer systems consisting of electronic procedures and equipment that contribute to data processing and obtaining information, such as: stock management and sales price recording programs; food classification programs, recipe configuration and raw material requirements; programs for recording orders, invoices, payments and the situation of customers. [76,77,78,79,80].
4. Financial innovations (FI). The modern economy cannot exist without financial innovation, which is the act of creating new financial instruments, of designing distinct financial technologies, of preparing institutions and markets that did not exist before. Financial innovation is a complex process that involves the creation and development of new services and financial or investment processes, concomitant with the changing needs of people and organizations. It may include updating technological systems, ensuring adequate risk management, transferring risk, generating credit and expanding equity, and attracting new innovations [81]. The restaurant industry, like many other sectors of the economy, has evaluated the recovery strategies since the beginning of the COVID-19 crisis and with the intensification of home orders has adopted financial innovations designed to help it recover, discover new ways to bounce back or to accelerate existing trends [82]. The financial revival of restaurants is assessed in terms of liquidity, value of stocks or cash available [83]. For example, the Unilever Food Solutions network has focused its efforts on finding the best product solutions, collaborating with various e-commerce platforms so as to ensure more efficient online distribution of food and beverages, and has credited small restaurants in order to support their resilience during the COVID-19 pandemic [84]. The implementation of financial strategies so as to ensure the increase of restaurant revenues was the natural response during the COVID-19 pandemic, the measures taken in this regard consisting mainly in emphasizing the role of liquidity management, designing simplified menus and encouraging off-premises consumption, reducing significant increase in promotion expenditure during travel restrictions [85]. In this context, government regulations aimed at reducing financial pressure on restaurants during the crisis, such as lowering interest rates, suspending VAT or issuing coupons to increase consumption, are examples of beneficial measures that influence financial resilience [42].
2.2. The Food Ordering and Delivery Platform and an Extended TAM
Nowadays, online food ordering and delivery platforms offer the restaurant managers benefits such as increasing restaurant sales, increasing efficiency, attracting potential customers, especially among millennials and the Z generation, as well as gaining a competitive advantage over the competition [86]. Restaurant customers have the advantages of easily choosing the desired menu, selecting the restaurant from a wide range and launching the online order with a single touch of the mobile phone [87]. The COVID-19 pandemic made the use of Food Ordering and Delivery Platforms a necessity for the restaurants, making a substantial contribution to increasing sales and reducing financial pressures. A study by Brewer and Sebby (2021) demonstrated the existence of a positive relationship between the visual information provided by the platforms (menus and photos with the dishes, menu description) and the intention to order of the customers [88].
The Technology Acceptance Model is the result of an adaptation based on the Theory of Reasoned Action [89] and the Theory of Planned Behavior [90,91]. Devis (1989) created this model in order to explain the use of information technologies by developing causal relationships between users’ beliefs, perceptions, attitudes, intentions and their behavior [92]. Perceived utility, perceived ease of usage, attitude towards use and behavioral intention to use are the four major constructs of the model [93].
The previous studies that support but also develop the model by connecting some new variables are numerous. Preetha & Iswarya (2019) showed that factors such as system quality, information quality, service quality and food quality have a positive effect on the platform quality and customer satisfaction [94]. Troise et al. (2020) demonstrated that consumer readiness to adopt online food delivery is influenced by new variables such as: food choices, convenience, confidence and the effect of perceived risks associated with the SARS-COV-2 virus [95].
Perceived ease of use (PE). According to the TAM, Perceived ease of use (PE) is a factor that indicates the degree to which a person believes that the use of certain solutions or technologies would be effortless” [92]. According to Tan and Netessine (2019) the ease of learning and becoming skilled in the use of restaurant-specific technologies, especially websites and food delivery platforms, is a key factor that will help increase average sales, reduce the duration of the meal, improve staff performance and, finally, digitize this service industry [96]. Goods et al. (2019) argue that in order to have staff capable of working with restaurant-specific technologies, managers should conduct an in-depth analysis of the work process in order to identify the distinctive features needed for the human capital involved in the segment of food preparation and delivery through online platforms, but also to assess the workforce as a response to them [97]. Some studies have investigated customers’ intentions to use Online Food Delivery (OFD) services by assessing satisfaction, food quality, and the quality of the OFD services, while others have focused on knowing their intent to use smartphone applications as tools to promote healthy eating habits [98,99]. This is consistent with Kang et al. (2015) who argue that in the future, restaurants should consider creating websites, collaborating with various food delivery platforms, but also using social media applications in order to identify and educate active customers, for the development of marketing strategies that can generate the interest of new customer segments as well as increase the number of orders [100].
Perceived usefulness (PU). Another determining factor of the attitude to using technologies within the TAM model is represented by “Perceived usefulness”. It indicates the extent to which the user is convinced that the implementation of the technology will contribute to the business development and increase its performance [101]. Pigatto et al. (2017) suggest that collaborating with suppliers and using food ordering and delivery platforms have given restaurants multiple benefits such as: a greater presence on social networks, developing advertising campaigns, expanding customer interaction, increasing visibility and attracting new perspectives [102]. During the COVID-19 pandemic, consumers developed favorable attitudes towards the food ordering and delivery platforms, positively reflected by the desire to eat, the visual and informative attractiveness of the menu, by the convenience offered through launching the online order but also by the perception of hygiene-related risks and food safety [88]. Berezina (2019) argued that small restaurant managers began to follow the example of large chains that, benefiting from massive investments, managed to develop interconnected and interoperable smart service networks, in order to carry out personalized promotional actions, to increase customer interaction, to provide online culinary assistance and even to deliver some food through automated robotic technologies [103].
Attitude towards using the order & delivery platforms (AT). Davis (1989) sees the attitude towards the use of technologies as a physical tendency expressed by evaluating a certain entity based on a certain degree of favor or disfavor, and also as a factor that has a direct effect on the intention to use [101,104]. The attitudes of restaurant managers towards the diversity of food delivery platforms have changed with the advent of the online to offline (O2O) era, giving operators both quick access to more potential consumers and increased additional revenue [105]. Al Amin et al. (2021) argue that restaurant managers should focus on online sales through order & delivery platforms during the pandemic, taking into account both the social distancing as a key strategy for managing COVID-19 and the safety measures taken during the food delivery itself for customer protection [106]. This measure generates other opportunities such as: maintaining the taste, freshness and credibility of the brand, just like in the dining experiences, increasing the quality of delivery, packaging and hygiene due to the integration of the platforms, but also risks such as: decreased quality of the interaction between the restaurant staff and the customers or the loss of adult customers, who do not master the technology very well [95]. In addition, the items used to assess managers’ attitudes towards order & delivery were grouped by the criteria of experience and training in using the platforms [52,107,108,109].
Behavioral intention (BU). According to the theory of planned behavior (TPB), intention is the desire of the individual to take action that could change his/her behavior at some point. Behavioral intent is the key component of the model, being influenced by the attitude with regard to behavioral change based on the outcome of circumstances, assessment of risks and/or perceived benefits [91]. If, in the beginning, restaurant managers were convinced that they were going through a health crisis, as time went by, it turned into an economic crisis. This unfavorable situation, for the restaurant operators and not only for them, culminated with the modification of the demand in equal measure with the offer from the specific industry, generating various intentions and behavioral actions among the restaurant managers [110]. In the context of new situations created by the COVID-19 pandemic, some restaurant managers have become aware of the degree of limitation in taking telephone orders and in customer relations. Depending on their personal beliefs and professional experience and after evaluating the financial results, some of them have implemented delivery systems, extending the services of their own restaurants in the online environment, in a very short time, so that they can be able to remain on the market. Others opted for temporary suspension or permanent closure of the activity. According to Liao and Landry (2000), individuals’ attitudes towards accepting innovations affect the intention to adopt new inventions in the future [111]. Some studies have shown that intention influences use behavior and its effect is often positive and significant [112,113]. In accordance with Elvandari et al. (2018), many restaurants have manifested their intention to collaborate with platform providers so as to adapt their business strategy to the new requirements of the market, their managers being prone to a behavior generated by this positive intention [114]. Consequently, the intention to adopt resilience innovations is the result of the aggregate action of individual, social and organizational factors [115]. Romanian state institutions and professional organizations have encouraged managers to adopt and use resilience innovations, arguing that this favorable intention can have a long-term positive impact on both the restaurant industry and the business field [110].
2.3. Proposed Structural Model and Research Hypotheses
Integrating the innovations in the theoretical background of the TAM model, we propose an extended structural model that can identify new variables as predictors of the attitude of the users related to the food ordering and delivery platforms. The relationships between these constructs are integrated into the structural model described in Figure 1. In order to achieve economic modeling based on the proposed conceptual model and so as to meet the research objectives, the following hypotheses were formulated:
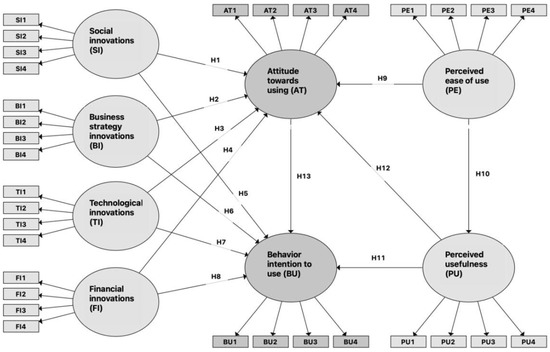
Figure 1.
Description of the proposed structural model.
Hypothesis 1 (H1).
Social innovations (SI) has a positive and significant effect on Attitude towards using the order & delivery platforms (AT).
Hypothesis 2 (H2).
Business strategy innovation (BI) has a positive and significant effect on Attitude towards using the order & delivery platforms (AT).
Hypothesis 3 (H3).
Technological innovations (TI) have a positive and significant effect on Attitude towards using the order & delivery platforms (AT).
Hypothesis 4 (H4).
Financial innovations (FI) have a positive and significant effect on Attitude towards using the order & delivery platforms (AT).
Hypothesis 5 (H5).
Social innovations (SI) has a positive and significant effect on Behavioral intention (BU).
Hypothesis 6 (H6).
Business strategy innovation (BI) has a positive and significant effect on Behavioral intention (BU).
Hypothesis 7 (H7).
Technological innovations (TI) have a positive and significant effect on Behavioral intention (BU).
Hypothesis 8 (H8).
Financial innovations (FI) have a positive and significant effect on Behavioral intention (BU).
Hypothesis 9 (H9).
Perceived ease of use (PE) has a positive and significant effect on Attitude towards using the order & delivery platforms (AT).
Hypothesis 10 (H10).
Perceived ease of use (PE) has a positive and significant effect on Perceived usefulness (PU).
Hypothesis 11 (H11).
Perceived usefulness (PU) has a positive and significant effect on Behavioral intention (BU).
Hypothesis 12 (H12).
Perceived usefulness (PU) has a positive and significant effect on Attitude towards using the order & delivery platforms (AT).
Hypothesis 13 (H13).
Attitude towards using the order & delivery platforms (AT) has a positive and significant effect on Behavioral intention (BU).
In order to perform the PLS-MGA analysis, five other statistical hypotheses were issued:
Hypothesis 14 (H14).
There are no significant differences between the groups “Male” and “Female”, specific to the criterion of “Gender”.
Hypothesis 15 (H15).
There are no significant differences between the groups “Less than 30 years”, “Between 31–40 years”, “Between 41–50 years” and “More than 51 years”, specific to the criterion of “Age”.
Hypothesis 16 (H16).
There are no significant differences between the groups “High school and lower”, “Bachelor’s or college”, “Master’s and PhD and above” and “Other”, specific to the criterion of “education”.
Hypothesis 17 (H17).
There are no significant differences between the groups “General Manager”, “Kitchen Manager”, “Front of the House Manager” and “Assistant Manager”, specific to the criterion of “Types of Restaurant Managers”.
Hypothesis 18 (H18).
There are no significant differences between the groups “At least 10 orders a day”, “Between 11 and 30 orders a day”, “Between 31 and 50 orders a day”, “Over 51 orders a day” and “Never used during the pandemic Covid 19”, specific to the criterion of “Frequency of orders received per day”.
In compliance with the previously presented literature and with the proposed hypotheses, the research model integrates a multitude of new variables, along with those established by the TAM model, presenting the ways of the hypotheses and the links between the latent variables in Figure 1.
The acronyms used to describe the items and the latent variables pertaining to the structural model can be found in Table A1, Appendix A.
3. Research Methodology
In line with the aim and objectives pursued, a descriptive, cross-sectional research was conducted, which was based on an online survey. The data collection took place between 1 June 2020–31 May 2021, in the Bucharest—Ilfov region, during the COVID-19 pandemic, after the application of the first measures meant to relax the restrictions on the activity of restaurant operators, given that the phenomenon of “delivery” had already become largely used in Romania, and managers had by then accumulated at least four months of experience in managing the activity of restaurants, given the restriction of occupancy in enclosed spaces with increasing incidence of disease, namely over 3/1000 inhabitants.
The sample was constituted by the quota method. The sampling base included the units of the investigated community, provided by the Romanian Ministry of Tourism. The sample of restaurant managers was representative of the national market in terms of age, sex and level of education. From the 1097 questionnaires distributed to the respondents, 439 questionnaires were collected, out of which 402 were valid and the remaining 37 were incomplete or incorrectly filled in, resulting in a response rate of 36.64%. Restaurant managers agreed in advance to answer all the closed questions, with fixed answers, included in the questionnaire. Previous studies have shown that, for a confidence level of 0.05 (corresponding to a 95% probability of guaranteeing the results of the research) and a maximum margin of error of 5%, the size of a representative sample must be of at least 385 respondents [116,117,118].
As it can be seen in Table 1 the sample included 63.93% male managers and 36.07% female managers. More than half of the restaurant managers (66.91%) are between 31 and 50 years old, while about 90.55% have completed high school and university studies. Approximately 72.64% of the respondents hold “General Manager” positions in restaurants that have on average between 6–49 employees. During the COVID-19 pandemic, about 25.62% of the restaurant managers chose not to use the existing food ordering and delivery platforms on the domestic market. At the same time, 54.73% of the managers received up to 30 orders per day and only 4.98% of them responded over 51 orders per day.

Table 1.
Distribution of the respondents in the sample.
Data collection was achieved through an online questionnaire. This important research tool offers the users multiple advantages, among which we can mention that: it converts the research objectives and hypotheses into appropriate questions, allows the collection of truthful information from respondents and offers the opportunity to create a database large enough to allow testing and validation of research hypotheses [119,120]. The questionnaire was distributed via e-mail, WhatsApp and several social networks after all respondents were contacted online so that they may participate in the research.
The socio-demographic characteristics of the respondents were included in the first part of the questionnaire, while in the second part, all the measurement elements specific to the items and latent variables pertaining to the proposed structural model were converted into content questions (Table A1, Appendix A). Depending on the objectives pursued, the measuring instruments used in the questionnaire included nominal and Likert scales, frequently used by specialists in the spectrum of marketing research [121,122]. The answers to the content questions, included in the questionnaire, were coded according to the Likert scale with numbers from 1 to 7 (where 1 = strongly disagree and 7 = strongly agree). The questionnaire was analyzed by several specialists in the field of restaurant management, which enjoys extensive experience and recognition on the domestic market. Subsequently, it was pre-tested through interviews with potential research subjects, several times, up to the review and elimination of problematic elements related to the format, repetitive or unnecessary aspects and the ordering of questions. The final form of the questionnaire is the result of a pre-testing which contributed to its improvement in terms of content and structure. The items and latent variables used are presented in Appendix A, Table A1.
The collected data were processed using the SPSS application in order to verify the correctness of the information provided by the interviewed restaurant managers and to eliminate errors, ensuring the interactive validation of the data provided and implicitly of the questionnaire. The testing of research hypotheses and the validation of the structural model were performed using the Partial Least Square method-Structural Equation Modeling (PLS-SEM) whereas the differences between groups were tested by multigroup analysis (PLS-MGA), the SPSS and Smart PLS software 3 supporting the processing of collected data [123].
4. Results
4.1. The PLS-SEM Model
The PLS-SEM model is a pathway model in which certain latent variables can be effects of some and causes of others, later, in hypothesized causal sequences. Unlike modeling covariance-based structural equations [124,125], the PLS-SEM model uses a type of principle component analysis in order to construct latent variables. Focused on components, the PLS-SEM model demonstrates the effect of the exogenous variables on the endogenous ones, in order the of the causal hypotheses sequence [126]. Figure 2 shows the results obtained using the PLS-SEM model.

Figure 2.
The structural model.
4.2. Total Path Coefficients
Figure 2 shows the path coefficients (β) for the proposed structural model (arrows linking latent variables). For example, the pathways from Social innovations (SI) and Financial innovations (FI) to Attitude towards using the order & delivery platforms (AT) have positive, lower coefficients of 0.033 and 0.013, respectively. The paths from Perceived ease of use (PE) and Perceived usefulness (PU) to Attitude towards using (AT) indicate higher positive coefficients (PE→AT, β = 0.419; PU→AT, β = 0.271). Taking into account the standardization, the weights of the path coefficients (β) can vary from −1 to +1 [127,128]. Because they are closer to 0, the weights of the correlations Social innovations (SI→AT, β = 0.033) and Financial innovations (FI→AT, β = 0.013) reflect the weakest paths. Above, the weights of 0.271 (PU→AT) and 0.231 (PU→BU) show that Perceived usefulness (PU) has a high positive effect on the variables Attitude towards (AT) and Behavior intention to use (BU), whereas the path of 0.419 (PE→AT) has a strong positive effect. Since path coefficients are standardized, it can be said that the absolute magnitude of the PE→AT effect is about twice as large as PU→AT. All weights of the standardized path coefficients are presented above, in Figure 3.
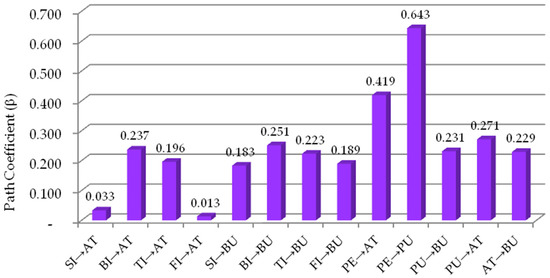
Figure 3.
Path Coefficients (β) for the structural model.
The proposed structural model presents three endogenous latent variables (with input arrows) namely: Attitude towards (AT), Behavior intention to use (BU) and Perceived usefulness (PU). R-square (R2), also called the coefficient of determination is the measure of the overall effect size for the structural model [129] or the measure of the effect size in the path models, having an interpretation similar to that of multiple regression [130,131]. In order to penalize the tendency of predictors added to the regression model of increasing the size of the R square coefficient (R2), in PLS-SEM adjusted R2 is used, which has a size close to unadjusted R2 [132]. The value R2 in the case of endogenous variables Attitude towards (AT), was 0.610 and the value R2 Adjusted was 0.603, indicating a substantial effect. Thus, approximately 61% of the Attitude towards using the order & delivery platforms (AT) variance was explained by the joint action of the six variables: Social innovations (SI), Business strategy innovation (BI), Technological innovations (TI), Financial innovations (FI), Perceived usefulness (PU) and Perceived ease of use (PE). The measure of the effect size of the endogenous latent variable Behavior intention to use (BU) was slightly higher (R2 = 0.667; R2 Adjusted = 0.661), 66.7% of its variance being explained by the cumulative action of exogenous latent factors of innovation in resilience (SI, BI, TI, FI), as well as Attitude towards using (AT) and Perceived usefulness (PU). A slightly more moderate resistance or effect can be observed in the case of the endogenous latent variable Perceived usefulness (PU), where the exogenous variable Perceived ease of use (PE) alone explains approximately 41.3% of its variance. (R2 = 0.413; R2 Adjused = 0.412).
4.3. Measurement Fit for Reflective Models
The adequacy of the structural “model quality” in the PLS-SEM was determined based on the matching of the measurements for the reflective (exterior) models because the factors were modeled reflectively and based on the structural adjustment, following the adaptability of the structural model (interior) [133].
4.3.1. Convergent Validity
In the case of the reflective structural model, the arrows go from the factor to the indicator variables, which mean that the construct becomes one-dimensional underlying if the measures of these indicator variables are representative. Convergence validity testing was performed by measuring the Composite reliability (CR) and Cronbach’s alpha indicators, appropriate matching measures for reflective models [134]. Also called the measure of internal consistency in scale elements (Netemeyer, 2003), Composite reliability (CR) can be considered perfect if its size varies from 0 to 1 [135,136]. The proposed structural model has a very good composite reliability. As can be seen in Table 2, the composite reliability value calculated for each latent variable of the model is in the range 0.823–0.894, being higher than 0.80, the admissible limit for exploratory researches [137,138] and the confirming ones [139,140].
Table 2.
Construct Reliability and Validity.
Cronbach’s alpha (CA) is often considered a measure of internal consistency, indicating the measure of binding (tighter or weaker) in the case of a set of variables in a group. However, it should not be overlooked that Cronbach’s alpha (CA) remains a conservative measure that tends to underestimate reliability [141]. In the case of our model, the Cronbach’s alpha (CA) indicator, calculated for each latent variable, displays convergent validity and therefore confirms the measure of reliability. The latent factors Social innovations (SI) (CA = 0.812) and Behavior intention to use (BU) (CA = 0.841) are measured as being at a very good level, exceeding the usually allowed limit (>0.80) in the case of confirmatory research [142]. At the same time, the rest of the latent variables recorded good values, between 0.713 and 0.789, measures above the limit of 0.60 that is accepted for exploratory research [143].
Average variance extracted (AVE), which measures the amount of variance captured by a construct relative to the amount of variance due to measurement error, can be used as a test of both convergent and divergent validity, reflecting the average community for each latent variable within the reflective model [144]. Although the latent Technological innovation (TI) factor recorded the lowest AVE value (0.539), this measure remains above the minimum allowable limit of 0.50 [127,137]. In this context, we can say that the proposed structural model is adequate, therefore all latent factors of the model explain at least half of the variance of their indicators [145]. The value of the rho_A reliability indices for each construct must be greater than 0.60. [146]. In Table 2, the results of the rho_A function calculated for each latent variable of the model show values between 0.730–0.843.
4.3.2. Discriminant Validity
In order to demonstrate the discriminant validity of the proposed structural model, the Fornell—Larcker criterion and implicitly the AVE indicator was taken into account. According to this criterion, there is discriminant validity if the square root AVE calculated for each latent factor is superior to its correlation with any other latent variable [145]. In Table 3, the AVE square roots of the eight latent variables of the construct model and their correlations below them can be observed in the diagonal cells. For the first endogenous latent variable Attitude towards using the order & delivery platforms (AT), an AVE of 0.582 (from Table 2) was calculated, which resulted in a square root AVE of 0.763 (from Table 3). The latter measure is superior to each number (correlation) below it (0.763 > 0.677, 0.674, 0.670, 0.719, 0.676, 0.608, 0.696). The situation is similar in the case of the other latent variables therefore, according to the results in Table 3, the condition of discriminant validity for the proposed structural model is met.
Table 3.
Results after use Fornell-Larcker Criterion.
The standardized root mean square residual (SRMR) reflects the mean magnitude of the difference between the observed correlation matrix and the implicit correlation matrix. A good fit measure of the construct model occurs when the SRMR is less than 0.08 [147] or 0.10 [141]. As the relevant criterion for evaluating the fit of the model remains the common factor model SRMR and its value was 0.062 (<0.08), it turns out that the structural model proposed by the authors is well suited. The discriminant validity of the proposed structural model is confirmed once again by the values obtained in the Heterotrait-Monotrait Ratio (HTMT) which are below 1.0 [133], as can be seen in Table 4.
Table 4.
The values obtained in the Heterotrait-Monotrait Ratio (HTMT).
The multicollinearity of the reflective model is very important; therefore, the variance inflation factor (VIF) must vary between a minimum of 0.25 and a maximum of 4.00 [148]. In Figure 4, by evaluating the relative importance of one independent variable compared to another, it is observed that all the calculated inflation factors (VIF) record values between 1.096 and 2.343. Within the proposed structural model, each latent variable is modeled as a unique predictor of the values of each of the indicator variables, namely the dependent variables [149]. Therefore, we can say that the proposed construct model is adequate and meets the condition of multicollinearity, given that the highest calculated structural VIF coefficient ( = 2.343) does not exceed the maximum allowable limit of 4.0.
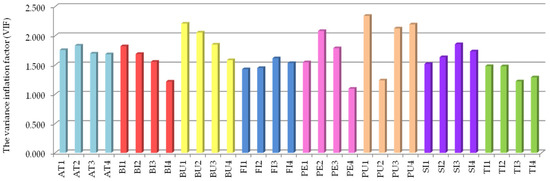
Figure 4.
The variance inflation factor (VIF).
In order to see how well the sample data fit the normal distribution of the researched population, the Goodness of fit (GoF) test was applied [150]. GoF represents the geometric mean of the average community for the exterior model and the mean R square for the interior model and can range from 0 to 1 [133,151]. The proposed construct model had a good overall fit, indicating a GoF = 0.582 value.
4.4. Structural Model
Predictive relevance (O2), also known as Stone-Gleisser (O2), calculated only for the endogenous variables of the reflective structural model Stone-Gleisser (O2) must record values greater than 0 [127,152]. In Table 5, it can be seen that reflectively modeled endogenous factors record Stone-Gleisser (O2) values higher than the minimum allowed limit (AT, O2 = 0.346; BU, O2 = 0.440 and PE, O2 = 0.251). In this context, the proposed model has a high degree of predictive relevance for all three endogenous variables given under control [153]. All values of the t-significance tests (t-Value) and respectively the probability levels (p-value) for the paths of the proposed structural model were generated by running the “blindfolding” option, in the SmartPLS3 software. In order to be significant, the paths of the construct model must have values higher than 1.96 for t-Value and lower than 0.05 [126] or 0.001 for the p-Value [154]. The results of the “blindfolding” report indicate that the proposed reflective model presents two insignificant paths for the correlations between the variables SI→AT (t-Value = 0.528 < 1.96) and FI→AT (t-Value = 0.269 < 1.96).
Table 5.
Results.
Among the eleven significant correlation pathways of the reflective model whose t values are greater than 1.96, four record p-Values lower than 0.05 (TI→AT, p-Value = 0.005 < 0.05; TI→BU, p-Value = 0.019 < 0.05; PU→BU, p-Value = 0.024 < 0.05; PU→AT, p-Value = 0.017 < 0.05), while the rest of them are set to probability levels below the minimum limit allowed, of 0.001 (SI→BU, BI→AT, BI→BU, FI→BU, PE→AT, PE→PU, AT→BU p-Value = 0.000).
4.5. PLS-MGA Analysis
The PLS-MGA analysis, also called non-parametric multigroup analysis, was used to highlight the significant differences between the analyzed groups regarding the latent variables of the proposed structural model. Using independent samples of t tests (t-Value > 1.96), this analysis allows comparisons to be made between the pathways between the analyzed groups [155]. Moreover, if the significance of the p-values is less than 0.05 or greater than 0.95, a significant difference between group-specific path coefficients results [133,156]. In order to support the results obtained, two tests were performed in parallel, parametric (PaT) and Welch-Satterthwait (WST), so as to identify equal and unequal variances between the groups [130,157]. The bootstrapping report reveals a first significant difference depending on gender for the PU→BU path coefficients, where p-Value new = 0.046 < 0.05, (PLS-MGA); p-Value new = 0.049 < 0.05, t-Value = 1.964 (PaT) and p-Value new = 0.0.48 < 0.05; t-Value = 1.977 (WST).
In the case of age groups, after the resumption of the three tests, four other significant differences were observed (Table 6). Thus, between the groups “31–40 years” and “41–50 years” there were highlighted three differences for the BI→AT pathways (PLS-MGA, p-Value new = 0.026 < 0.05; PaT, p-Value new = 0.033 < 0.05; WST, p-Value new = 0.026 < 0.05), FI→BU and TI→BU. At the same time, between the age categories “41–50 years” and “50 years” another difference is visible between the path coefficients FI→AT (PLS-MGA, p-Value new = 0.047 < 0.05; PaT, p-Value new = 0.042 < 0.05; WST, p-Value new = 0.036 < 0.05).
Table 6.
“Age” groups test report.
For the data in the proposed structural model, there is no significant difference depending on education in any of these coefficients. However, most significant differences occur between path coefficients, being identified, in particular, between groups established according to the criterion “types of restaurant managers”. The results of the tests performed indicate the first three differences between the “General Manager” and “Kitchen Manager” groups among the BI→AT correlation paths (PLS-MGA, p-Value new = 0.018 <0.05; PaT, p-Value new = 0.013 < 0.05; WST, p-Value new = 0.017 < 0.05), SI→AT (PLS-MGA, p-Value new = 0.033 < 0.05; PaT, p-Value new = 0.015 < 0.05; WST, p-Value new = 0.040 < 0.05) and SI→BU, respectively (PLS-MGA, p-Value new = 0.992 > 0.95; PaT, p-Value new = 0.956 > 0.95; WST, p-Value new = 0.967 > 0.95). The fourth difference was identified between the PE→AT pathways (PLS-MGA, p-Value new = 0.032 < 0.05; PaT, p-Value new = 0.030 < 0.05; WST, p-Value new = 0.031 < 0.05) between the categories “Kitchen Manager”and “ Front of the House Manager ”(Table 7).
Table 7.
“Types of Restaurant Managers” groups test report.
Two other path differences were identified between the “Front of the House Manager” and “Assistant Manager” groups for the correlations PE→AT (PLS-MGA, p-Value new = 0.014 < 0.05; PaT, p-Value new = 0.003 < 0.05; WST, p-Value new = 0.007 < 0.05) și respectiv PE→PU (PLS-MGA, p-Value new = 0.985 > 0.95; PaT, p-Value new = 0.974 > 0.95; WST, p-Value new = 0.966 > 0.95).
In the case of the frequency of orders received per day, based on the use of food ordering and delivery platforms as a market, during the COVID-19 pandemic, four significant differences were identified, according to the tests performed. In Table 5 you can see a first difference between the groups “At least 10 orders a day” and “Between 11 and 30 orders a day” for the correlation PE→AT (PLS-MGA, p-Value new = 0.958 > 0.95; PaT, p-Value new = 0.978 > 0.95; WST, p-Value new = 0.980 > 0.95).
For the correlation PU→AT (PLS-MGA, p-Value new = 0.039 < 0.05; PaT, p-Value new = 0.033 < 0.05; WST, p-Value new = 0.035 < 0.05) a significant difference was observed between the groups “Between 11 and 30 orders a day” and “Between 31 and 50 orders a day”. The third significant difference was found in the case of PE→AT specific to the analyzed criterion, between the groups “Between 31 and 50 orders a day” and “Over 51 orders a day”. The last one appears between the categories “Over 51 orders a day” and “Never used during the Covid-19 pandemic” for the correlation PU→BU (PLS-MGA, p-Value new = 0.953 > 0.95; PaT, p-Value new = 0.958 > 0.95; WST, p-Value new = 0.975 > 0.95) (Table 8).
Table 8.
“Frequency of orders received per day” groups test report.
5. Discussion and Conclusions
Starting with economic modeling meant to determine the influence of social, business, technological and financial strategies on restaurant activity, in the context of the COVID-19 pandemic, using the structural equations SEM-PLS, this study identifies innovations in resilience and evaluates the impact of social innovations, strategy innovations business, technological innovations and financial innovations, the influence of usefulness and perceived ease of use on the attitude and intention of using food ordering and delivery platforms among the restaurant managers in Romania. Compared to the main purpose of the research and the research objectives, the results of the study show that the four variables of innovation have a positive effect on the behavioral intention and attitude towards using order and delivery platforms. However, business strategy innovations have the greatest effect, followed by technological and financial innovations, while social innovations have a positive but weaker effect. The results of the study should benefit restaurant managers who, by integrating these variables, will be able to develop new products and services, will manage material, financial and human resources more efficiently, will attract potential customers and will increase economic performance.
Moreover, using the PLS-MGA multigroup analysis, the research also allows the identification of significant differences between socio-demographic groups in the analyzed sample (gender, age, education, types of restaurant managers and frequency of orders received per day). The results indicate the validity and robustness of the proposed structural model and the fact that a significant proportion of the variability of the endogenous (dependent) variables was explained by exogenous (independent) factors. Thus, six exogenous variables of the model (SI, BI, TI, FI, PU and PE) together explain 61% of the variance of the factor “Attitude towards using the order & delivery platforms (AT)” whereas 66.7% of the variance of the variable “Behavior intention to use (BU)” is demonstrated by the action of the variables (SI, BI, TI, FI, AT and PU). Given the uniqueness of the proposed structural model, the results obtained were discussed only from the perspective of working hypotheses and tests performed.
5.1. Theoretical Implications
Analyzing the PLS-SEM results, we will find that two of the 13 hypotheses of the structural model are not valid (H1 and H4). The exogenous variables SI and FI showed a positive, weak impact on AT (SI→AT; β = 0.033; t-Value = 0.528 < 1.96; p-Value = 0.598 > 0.05 respectively FI→AT; β = 0.013; t-Value = 0.269 < 1.96; p-Value = 0.788 > 0.05). On the other hand, the null Hypotheses H2, H3, H5, H6, H7, H8, H9, H10, H11, H12 and H13 were valid, demonstrating positive and significant correlation pathways between the analyzed latent variables, for t-Value levels > 1.96 and p-Value < 0.05.
However, the results of the PLS-MGA analysis indicate only one valid Hypothesis H16, for the rest of the hypotheses (H14, H15, H17 and H18) significant differences being identified between the specific groups for some correlation pathways of the proposed model.
The first PLS-MGA analysis, performed between the “Male” and “Female” groups, within the proposed structural model, indicated a significant difference for the PU→BU pathway (p-Value new = 0.046 < 0.05), therefore we accept the alternative Hypothesis H14 according to which there are significant differences between the two groups. Four other significant differences were confirmed between the age-specific groups for the BI→AT pathways (p-Value new = 0.026 < 0.05), FI→BU (p-Value new = 0.035 < 0.05), TI→BU (p-Value new = 0.049 < 0.05) and FI→BU (p-Value new = 0.047 < 0.05), leading to the rejection of the null Hypothesis H15. The situation is different in the case of the “education” criterion, where there are no significant differences between the “High school and lower”, “Bachelor’s or college”, “Master’s and PhD” and “Other” groups, the null Hypothesis H16 (valid hypothesis) being accepted. For the correlation paths BI→AT (p-Value new = 0.018 < 0.05), SI→AT (p-Value new = 0.033 < 0.05), SI→BU (p-Value new = 0.992 > 0.95), PE→AT (p-Value new = 0.032 < 0.05, respectively p-Value new = 0.014 < 0.05) and PE→PU (p-Value new = 0.985 > 0.95) established according to “types of restaurant managers” clear, significant differences were identified, which led to the acceptance of the alternative Hypothesis H17. In the case of Hypothesis H18, other significant differences were proved between the groups of the criterion “frequency of orders received per day”, in the end, the null hypothesis was rejected and the alternative one was accepted. This time, the significant differences were explained by the PE→AT correlation pathways (p-Value new = 0.958 > 0.95, respectively p-Value new = 0.957 > 0.95), PU→AT (p-Value new = 0.039 < 0.05) și PU→BU (p-Value new = 0.952 > 0.95).
5.2. Managerial Implications
The exogenous variables Social innovations (SI) and Financial innovations (FI) had a positive but insignificant effect on the variable Attitude towards using the order & delivery platforms (AT). Managers acknowledge that they have encountered difficulties in supplying, synchronizing the workforce and moving it towards the home delivery area. However, on the endogenous factor Behavioral intention (BU) positive and significant effects were exerted from the four specific variables of innovation in resilience (SI, BI, Ti and FI). The strongest impact was that of the independent variable Business Strategy Innovation (BI), with managers having to adopt innovative solutions and strategies in order to expand into other target markets, reconfigure recipes and change ingredients so as to survive or maintain their competitive advantage during the COVID-19 pandemic. Another strongly significant influence on the same variable is demonstrated by the Technological innovations (TI) factor. Respondents acknowledge that they have had to adopt, in addition to food ordering and delivery platforms, new solutions for customers (for example: mobile apps, curbside pickup, off-premises dining, drive-thru) but also technologies for temperature monitoring or for the nutriment supplying of the restaurant.
Positive, significant associations were highlighted between the factors Perceived ease of use (PE) and Perceived usefulness (PU) and the latent variable Attitude towards using the order & delivery platforms (AT). Managers began to learn, to discover new skills on the use of food ordering and delivery platforms, they understood their usefulness in maintaining and attracting customers, but also the degree of their contribution to increasing economic performance. They developed favorable attitudes towards the use of platforms that they believe offer them the opportunity to gain new experiences and knowledge and are a viable solution in the context of a shrinking activity caused by the effects of the COVID-19 crisis. Changing consumer behavior has led restaurant managers to focus their energy on planning their own financial and human resources, entering into partnerships with suppliers and ensuring continuity in the use of food ordering & delivery platforms.
The novelty element which could contribute to the enrichment of the specialty literature is given by the integration of variables specific to innovations in resilience within the structural model presented. The practical contribution lies in understanding the problems faced by restaurant managers in Romania, in the conditions of the temporary suspension of activity caused by the SARS-COV-2 virus, correlated with the need to implement resilience innovations and integration of food ordering and delivery platforms in order to support future business.
Given the results of the research, a first proposal for restaurant managers is the careful planning and management of online orders and deliveries to customers through these platforms. A good functioning of the deliveries depends to a large extent on the performance of the information and logistics systems, but also on the quality and clarity of the internal procedures and rules.
A second proposal aims to keep food deliveries at home as an optional alternative to supplementing income. In the future, each restaurant should have a website, which may integrate its own online ordering systems that will allow for optimization with other platforms or mobile devices so as to attract potential customers and increase profitability.
Some previous research confirms a number of positive and significant correlations between Perceived ease of use, Perceived usefulness and Attitude towards using platforms [94,95]. In addition, our study indicates, through the high size of the coefficients obtained from modeling, a positive, direct and strong impact exerted by the two latent variables Perceived ease of use and Perceived usefulness on Attitude towards using the order & delivery platforms.
The novelty that could contribute to the enrichment of the specialty literature is given by the integration of specific variables of the resilience-related innovation in the presented structural model. The practical contribution is represented by the understanding of the problems faced by the restaurant managers in Romania, in the conditions of their temporary suspension of activity caused by the SARS-COV-2 virus, correlated with the need to implement innovations in resilience and the integration of food ordering and delivery platforms meant to support future businesses.
However, the study presents a number of limiting conditions. The first limit considers the type of information, the administered questionnaire including closed questions with simple and multiple choices. The second limit involves the types of scales reduced in variety. The third limitation is related to the reluctance to provide information that is usually easier to obtain in a face-to-face interview. All these limitations, however, are intended to be removed in future research, by including the use of qualitative methods, which may identify other factors that have contributed to increasing the intention to use food ordering and delivery platforms.
Future research will look at issues related to the impact of capital (e.g., economic, social, human and symbolic) on organizational resilience and the behavior of restaurant industry managers, including qualitative methods, meant to identify other factors that have contributed to increasing the intention to use food ordering and delivery platforms.
Author Contributions
Author Contributions: Conceptualization, M.C.T. and A.F.S.; methodology, M.C.T. and R.-C.M.; validation, M.C.T., A.F.S., C.A.B. and R.-C.M.; formal analysis, M.C.T., A.F.S. and C.A.B.; writing—original draft preparation, M.C.T., C.A.B., A.F.S. and R.-C.M.; writing—review and editing, M.C.T. All authors have read and agreed to the published version of the manuscript.
Funding
This research received no external funding.
Institutional Review Board Statement
Not applicable.
Informed Consent Statement
Not applicable.
Data Availability Statement
Not applicable.
Conflicts of Interest
The authors declare no conflict of interest.
Appendix A
Table A1.
Questionnaire.
Table A1.
Questionnaire.
| Variables | Items |
|---|---|
| Social Innovations (SI) | (SI1) In my restaurant there is increased flexibility in terms of supply and timing of workforce (division of teams, shift work, etc.) and worker safety; |
| (SI2) In my restaurant there is an increased flexibility in terms of facilitating the movement of labor in the home delivery area with their own means of transport; | |
| (SI3) In my restaurant there is increased flexibility in terms of training the workforce for better interaction with customers through digital ecosystems (mobile applications, payment methods, personalized experiences based on consumer behavior, etc.); | |
| (SI4) In my restaurant there is increased flexibility in adopting optimal safety and accountability measures for staff, couriers and customers; | |
| Business strategy innovations (BI) | (BI1) In my restaurant I have adopted solutions and innovation strategies with extension to new segments (vouchers for future parties, special menus for children, doctors, hospitals, government institutions, etc.), in order to survive or maintain our competitive advantage during COVID-19 pandemic; |
| (BI2) In my restaurant, I have adopted an innovation strategy on all of the food ingredients and recipes used in order to survive or maintain our competitive advantage during the COVID-19 pandemic; | |
| (BI3) In my restaurant I have adopted solutions and innovation strategies regarding the delivery of products through appropriate channels, so that they can reach customers (delivery of products at home, delivery of products through food ordering & delivery platforms (FoodPanda, Glovo, etc.), acceptance of new payment methods (SMS payment, bank transfer or Revolut), to maintain our competitive advantage during the COVID-19 pandemic; | |
| (BI4) In my restaurant I have adopted solutions and innovation strategies regarding the promotion of products through my own sites, other sites (FoodPanda, Glovo, etc.) and/or social media help (Facebook, Linkedln, etc.), in order to maintain our competitive advantage during the COVID-19 pandemic; | |
| Technological innovations (TI) | (TI1) In my restaurant I have adopted new solutions for customers, with direct contact, such as: online ordering and delivery, mobile apps, curbside pickup, “virtual” restaurants and menus, contactless payment or payment without direct physical contact: off-premises dining, drive-thru, using delivery more often, takeout, increasing the safety of all the involved customers, couriers and business partners; |
| (TI2) In my restaurant I have adopted new solutions for customers, without direct physical contact, such as: off-premises dining, drive-thru, using delivery more often, takeout, increasing the safety of all involved customers, couriers and business partners. | |
| (TI3) In my restaurant, I have adopted food temperature monitoring technologies and I have developed the highest sanitary standards for food deliveries, ensuring the hygiene and safety of all persons involved in the process of food processing and delivery; | |
| (TI4) In my restaurant, I have adopted digital personnel planning solutions and online inventory and supply technologies in order to increase the efficiency and effectiveness of the activity. | |
| Financial innovations (FI) | (FI1) We developed a financial plan with multiple objectives (maintaining a short-term emergency savings fund, keeping the debt-to-income ratio low, etc.) during the COVID-19 pandemic; |
| (FI2) We have entered into partnerships with specialized NGOs, which have platforms for ordering and fast delivery or e-commerce, in order to have quick access to capital, to increase market visibility or to maintain turnover, during the COVID-19 pandemic; | |
| (FI3)We requested financial support from the state and/or local credit institutions during the COVID-19 pandemic, as the activity was severely affected; | |
| (FI4) I improved my financial knowledge (use of available resources, setting up emergency funds, avoiding investment fraud, etc.) during the COVID-19 pandemic; | |
| Perceived ease of use (PE) | (PE1) Learning to work with food ordering & delivery platforms was an easy thing for me and my staff; |
| (PE2) Becoming skilled at using food ordering & delivery platforms was an easy thing for me and my staff; | |
| (PE3) My intention to use food ordering & delivery platforms was clear and easy to understand; | |
| (PE4)The use of food ordering & delivery platforms has been easy and has expanded both my digital skills and those of my staff; | |
| Perceived usefulness (PU) | (PU1) If other restaurants are already using them, I feel obligated to use the food ordering & delivery platforms; |
| (PU2) If I have easy access and the situation requires it, I will use more than two food ordering & delivery platforms; | |
| (PU3) Rather than home delivery, I prefer to use food ordering & delivery platforms; | |
| (PU4) In the future I intend to use food ordering & delivery platforms; | |
| Attitude towards using the order & delivery platforms (AT) | (AT1) Using the food ordering & delivery platforms was a good idea/experience for my restaurant; |
| (AT2) I feel confident when using the food ordering & delivery platforms; | |
| (AT3) I think that using the food ordering & delivery platforms gives me the opportunity to acquire new knowledge; | |
| (AT4) I think the use of food ordering & delivery platforms improves my learning experience. | |
| Behavioral intention (BU) | (BU1) We have planned our own financial and human resources for the use of food ordering & delivery platforms; |
| (BU2) We have planned in advance the conclusion of partnerships for the use of the services offered by the food ordering & delivery platforms; | |
| (BU3) We will continue to use food ordering & delivery platforms in the post-pandemic period; | |
| (BU4) I plan to use other food ordering & delivery platforms in the future, if necessary; |
References
- Gursoy, D.; Chi, C.G. Effects of COVID-19 pandemic on hospitality industry: Review of the current situations and a research agenda. J. Hosp. Mark. Manag. 2020, 29, 527–529. [Google Scholar] [CrossRef]
- Gössling, S.; Scott, D.; Hall, C.M. Pandemics, tourism and global change: A rapid assessment of COVID-19. J. Sustain. Tour. 2021, 29, 48–52. [Google Scholar] [CrossRef]
- World Health Organization. Weekly Epidemiological Update on COVID-19—29 June 2021. Available online: https://www.who.int/publications/m/item/weekly-epidemiological-update-on-covid-19---29-june-2021 (accessed on 18 May 2021).
- Law 55/2020 on Some Measures to Prevent and Combat the Effects of the COVID-19 Pandemic. Available online: https://www.mai.gov.ro/wp-content/uploads/2020/05/LEGE-nr.-55-din-15-mai-2020.pdf (accessed on 20 May 2021).
- Jones, P.; Comfort, D. The COVID-19 crisis and sustainability in the hospitality industry. Int. J. Contemp. Hosp. Manag. 2020, 32, 3037–3050. [Google Scholar] [CrossRef]
- Statista. Year-over-Year Daily Change in Seated Restaurant Diners due to the Coronavirus (COVID-19) Pandemic Worldwide from February 24, 2020 to August 24, 2021. Available online: https://www.statista.com/statistics/1103928/coronavirus-restaurant-visitation-impact/ (accessed on 2 September 2021).
- Sensor Tower. The State of Food Delivery Apps 2021. Available online: https://go.sensortower.com/rs/351-RWH-315/images/the-state-of-food-delivery-apps-2021-condensed-final.pdf (accessed on 30 August 2021).
- Statista. Most Used Food Delivery Apps in Bucharest during the Coronavirus (COVID-19) Pandemic in Romania in 2020. Available online: https://www.statista.com/statistics/1172190/romania-most-used-food-delivery-apps-during-covid-19/ (accessed on 30 August 2021).
- The Government of Romania. National Investment and Economic Recovery Plan. July 2020. Available online: https://gov.ro/fisiere/programe_fisiere/Planul_Na%C8%9Bional_de_Investi%C8%9Bii_%C8%99i_Relansare_Economic%C4%83.pdf (accessed on 20 May 2021).
- The Government of Romania. DECISION no. 35 of February 10, 2021 on the Extension of the Alert Status on the Romanian Territory Starting with February 12, 2021, as well as the Establishment of the Measures Applied during It to Prevent and Combat the Effects of the COVID-19 Pandemic. Available online: http://legislatie.just.ro/Public/DetaliiDocument/237338 (accessed on 21 May 2021).
- Forbes Romania, the Turnover in the HoReCa Industry Decreased in 2020 by 35% Compared to 2019. Available online: https://www.forbes.ro/cifra-de-afaceri-din-industria-horeca-scazut-2020-cu-35-fata-de-2019-218133 (accessed on 20 July 2021).
- European Commission. Communication from the Commission to the European Parliament, the Council, The European Economic and Social Committee and Committee Regions. Tourism and Transport in 2020 and beyond. Available online: https://eur-lex.europa.eu/legal-content/EN/TXT/PDF/?uri=CELEX:52020DC0550&from=EN (accessed on 21 May 2021).
- De Freitas, R.S.G.; Stedefeldt, E. COVID-19 pandemic underlines the need to build resilience in commercial restaurants’ food safety. Food Res. Int. 2020, 136, 109472. [Google Scholar] [CrossRef] [PubMed]
- Kim, J.; Kim, J.; Wang, Y. Uncertainty risks and strategic reaction of restaurant firms amid COVID-19: Evidence from China. Int. J. Hosp. Manag. 2021, 92, 102752. [Google Scholar] [CrossRef] [PubMed]
- Chitrakar, B.; Zhang, M.; Bhandari, B. Improvement strategies of food supply chain through novel food processing technologies during COVID-19 pandemic. Food Control 2021, 125, 108010. [Google Scholar] [CrossRef] [PubMed]
- Conz, E.; Magnani, G. A dynamic perspective on the resilience of firms: A systematic literature review and a framework for future research. Eur. Manag. J. 2020, 38, 400–412. [Google Scholar] [CrossRef]
- Seville, E. Resilience: Great Concept but What Does It Mean? Wilmington, USA: Council on Competitiveness—Risk Intelligence and Resilience Workshop, November 2008. Available online: https://ir.canterbury.ac.nz/bitstream/handle/10092/2966/12618148_Compete%20Briefing%20Bite.pdf?sequence=1&isAllowed=y (accessed on 20 May 2021).
- McManus, S. Organisational Resilience in New Zealand. Ph.D. Thesis, University of Canterbury, Christchurch, New Zealand, 2008. Available online: https://ir.canterbury.ac.nz/bitstream/handle/10092/1574/thesis_fulltext.pdf?sequence=1 (accessed on 22 May 2021).
- Luthar, S.S.; Cicchetti, D.; Becker, B. The Construct of Resilience: A Critical Evaluation and Guidelines for Future Work. Child. Dev. 2000, 71, 543–562. [Google Scholar] [CrossRef]
- Xiao, L.; Cao, H. Organizational Resilience: The Theoretical Model and Research Implication. ITM Web of Conferences, 12; In Proceedings of the 4th Annual International Conference on Information Technology and Applications, Guangzhou, China, 26–28 May 2017; Long, L., Li, Y., Li, X., Dai, Y., Yang, H., Eds.; EDP Sciences: Les Ulis, France, 2017; p. 04021. [Google Scholar] [CrossRef]
- Romão, J. Tourism, smart specialisation, growth, and resilience. Ann. Tour. Res. 2020, 84, 102995. [Google Scholar] [CrossRef]
- Cheema-Fox, A.; La Perla, B.R.; Serafeim, G.; Wang, H. Corporate Resilience and Response during COVID-19; Harvard Business School Accounting & Management Unit Working Paper; Harvard Business School Press: Cambridge, MA, USA, 2020; pp. 20–108. Available online: https://papers.ssrn.com/sol3/papers.cfm?abstract_id=3578167 (accessed on 25 May 2021).
- Briguglio, L.; Cordina, G.; Farrugia, N.; Vella, S. Economic Vulnerability and Resilience: Concepts and Measurements. Oxf. Dev. Stud. 2009, 37, 229–247. [Google Scholar] [CrossRef]
- Hallegatte, S. Economic Resilience: Definition and Measurement; World Bank Policy Research Working Paper; World Bank: Washington, DC, USA, 2014; p. 6852. Available online: https://openknowledge.worldbank.org/bitstream/handle/10986/18341/WPS6852.pdf?sequence=1&isAllowed=y (accessed on 12 June 2021).
- Adger, W.N. Social and ecological resilience: Are they related? Prog. Hum. Geogr. 2000, 24, 347–364. [Google Scholar] [CrossRef]
- Kwok, A.H.; Doyle, E.E.H.; Becker, J.; Johnston, D.; Paton, D. What is ‘social resilience’? Perspectives of disaster researchers, emergency management practitioners, and policy makers in New Zealand. Int. J. Disaster Risk Reduct. 2016, 19, 197–211. [Google Scholar] [CrossRef]
- Alharty, A.; Sohaib, O.; Hawryszkiewycz, I. The impact of Knowledge Creation on Organizational Resilience towards Organizational Performance. In Designing Digitalization, Proceedings of the 27th International Conference on Information Systems Development (ISD2018), Lund, Sweden, 22–24 August 2018; Andersson, B., Johansson, B., Carlsson, S., Barry, C., Lang, M., Linger, H., Schneider, C., Eds.; Lund University: Lund, Sweden, 2018. [Google Scholar]
- Jiang, Y.; Ritchie, B.; Verreynne, M. Building tourism organizational resilience to crises and disasters: A dynamic capabilities view. Int. J. Tour. Res. 2019, 21, 882–900. [Google Scholar] [CrossRef]
- Ritchie, B.W.; Jiang, Y. A review of research on tourism risk, crisis and disaster management: Launching the annals of tourism research curated collection on tourism risk, crisis and disaster management. Ann. Tour. Res. 2019, 79, 102812. [Google Scholar] [CrossRef]
- Ngin, C.; Chhom, C.; Neef, A. Climate change impacts and disaster resilience among micro businesses in the tourism and hospitality sector: The case of Kratie, Cambodia. Environ. Res. 2020, 186, 109557. [Google Scholar] [CrossRef]
- Tew, P.; Lu, Z.; Tolomiczenko, G.; Gellatly, J. SARS: Lessons in strategic planning for hoteliers and destination marketers. Int. J. Contemp. Hosp. Manag. 2008, 20, 332–346. [Google Scholar] [CrossRef]
- Chen, M.-H.; Jang, S.C.; Kim, W.G. The impact of the SARS outbreak on Taiwanese hotel stock performance: An event-study approach. Int. J. Hosp. Manag. 2007, 26, 200–212. [Google Scholar] [CrossRef]
- Burnett, M.; Johnston, T. Brexit anticipated economic shock on Ireland’s planning for hospitality and tourism: Resilience, volatility and exposure. Tour. Rev. 2020, 75, 595–606. [Google Scholar] [CrossRef]
- Buultjens, J.W.; Ratnayake, I.; Gnanapala, W.K.A.C. Post-Conflict tourism development in Sri Lanka: Implications for building resilience. Curr. Issues Tour. 2015, 19, 355–372. [Google Scholar] [CrossRef]
- Burnard, K.; Bhamra, R. Organisational resilience: Development of a conceptual framework for organisational responses. Int. J. Prod. Res. 2011, 49, 5581–5599. [Google Scholar] [CrossRef]
- Sobaih, A.E.E.; Elshaer, I.; Hasanein, A.M.; Abdelaziz, A.S. The role of performance in the relationship between small hospitality enterprises’ resilience and sustainable tourism development. Int. J. Hosp. Manag. 2021, 94, 102824. [Google Scholar] [CrossRef]
- Wut, T.M.; Xu, J.; Wong, S.-M. Crisis management research (1985–2020) in the hospitality and tourism industry: A review and research agenda. Tour. Manag. 2021, 85, 104307. [Google Scholar] [CrossRef]
- Li, B.; Zhong, Y.Y.; Zhang, T.; Hua, N. Transcending the COVID-19 crisis: Business resilience and innovation of the restaurant industry in China. J. Hosp. Tour. Manag. 2021, 49, 44–53. [Google Scholar] [CrossRef]
- Alonso, A.D.; Kok, S.K.; Bressan, A.; O’Shea, M.; Sakellarios, N.; Koresis, A.; Solis, M.A.B.; Santoni, L.J. COVID-19, aftermath, impacts, and hospitality firms: An international perspective. Int. J. Hosp. Manag. 2020, 91, 102654. [Google Scholar] [CrossRef] [PubMed]
- Neise, T.; Verfürth, P.; Martin, F. Rapid responding to the COVID-19 crisis: Assessing the resilience in the German restaurant and bar industry. Int. J. Hosp. Manag. 2021, 96, 102960. [Google Scholar] [CrossRef]
- Jiang, Y.; Ritchie, B.W.; Vereynne, M.-L. Developing disaster resilience: A processual and reflective approach. Tour. Manag. 2021, 87, 104374. [Google Scholar] [CrossRef]
- Burhan, M.; Salam, M.T.; Hamdan, O.A.; Tariq, H. Crisis management in the hospitality sector SMEs in Pakistan during COVID-19. Int. J. Hosp. Manag. 2021, 98, 103037. [Google Scholar] [CrossRef]
- Sharma, G.D.; Thomas, A.; Paul, J. Reviving tourism industry post-COVID-19: A resilience-based framework. Tour. Manag. Perspect. 2021, 37, 100786. [Google Scholar] [CrossRef]
- Aldianto, L.; Anggadwita, G.; Permatasari, A.; Mirzanti, I.R.; Williamson, I.O. Toward a Business Resilience Framework for Startups. Sustainability 2021, 13, 3132. [Google Scholar] [CrossRef]
- Organisation for Economic Co-Operation and Development (OECD). Social Innovation. Available online: https://www.oecd.org/regional/leed/social-innovation.htm. (accessed on 18 June 2021).
- Aday, S.; Aday, M.S. Impact of COVID-19 on the food supply chain. Food Qual. Saf. 2020, 4, 67–180. [Google Scholar] [CrossRef]
- Whillans, A.; Perlow, L.; Turek, A. Experimenting during the shift to virtual team work: Learnings from how teams adapted their activities during the COVID-19 pandemic. Inf. Organ. 2021, 3, 100343. [Google Scholar] [CrossRef]
- Lai, H.B.J.; Abidin, M.R.Z.; Hasni, M.Z.; Ab Karim, M.S.; Ishak, F.A.C. Key adaptations of SME restaurants in Malaysia amidst the COVID-19 Pandemic. Int. J. Res. Bus. Soc. Sci. 2020, 9, 12–23. [Google Scholar] [CrossRef]
- Motoc, A. Crisis Management and Resilience for Restaurants in Romania during the COVID-19 Pandemic. Manag. Dyn. Knowl. Econ. 2020, 8, 435–449. [Google Scholar] [CrossRef]
- Kopalle, P.K.; Kumar, V.; Subramaniam, M. How legacy firms can embrace the digital ecosystem via digital customer orientation. J. Acad. Mark. Sci. 2020, 48, 114–131. [Google Scholar] [CrossRef]
- Reeves, M.; Chittaro, C. Getting Physical: The Rise of Hybrid Ecosystems. In Winning the ’20s; Reeves, M., Whitaker, K., Eds.; De Gruyter: Berlin, Germany, 2021; pp. 21–30. [Google Scholar] [CrossRef]
- Pillai, S.G.; Haldorai, K.; Seo, W.S.; Kim, W.G. COVID-19 and hospitality 5.0: Redefining hospitality operations. Int. J. Hosp. Manag. 2021, 94, 102869. [Google Scholar] [CrossRef]
- Clark, J.; Crandall, P.; Reynolds, J. Exploring the influence of food safety climate indicators on handwashing practices of restaurant food handlers, Int. J. Hosp. Manag. 2019, 77, 187–194. [Google Scholar] [CrossRef]
- Bufquin, D.; Park, J.-Y.; Back, R.M.; de Souza Meira, J.V.; Hight, S.K. Employee work status, mental health, substance use, and career turnover intentions: An examination of restaurant employees during COVID-19. Int. J. Hosp. Manag. 2021, 93, 102764. [Google Scholar] [CrossRef]
- Ganapathi, P.; Abu-Shanab, E.A. Customer Satisfaction with Online Food Ordering Portals in Qatar. Int. J. E-Serv. Mob. Appl. 2020, 12, 57–79. [Google Scholar] [CrossRef]
- Dossena, C.; Mochi, F.; Bissola, R.; Imperatori, B. Restaurants and social media: Rethinking organizational capabilities and individual competencies. J. Tour. Futures 2021, 7, 20–39. [Google Scholar] [CrossRef]
- Leung, R.; Loo, P.T. Co-creating interactive dining experiences via interconnected and interoperable smart technology. Asian J. Technol. Innov. 2020, 1–23. [Google Scholar] [CrossRef]
- Raj, M.; Sundararajan, A.; You, C. COVID-19 and Digital Resilience: Evidence from Uber Eats. arXiv 2020, arXiv:2006.07204. [Google Scholar] [CrossRef]
- Yang, Y.; Liu, H.; Chen, X. COVID-19 and restaurant demand: Early effects of the pandemic and stay-at-home orders. Int. J. Contemp. Hosp. Manag. 2020, 32, 3809–3834. [Google Scholar] [CrossRef]
- Strotmann, C.; Baur, V.; Börnert, N.; Gerwin, P. Generation and prevention of food waste in the German food service sector in the COVID-19 pandemic—Digital approaches to encounter the pandemic related crisis. Socio-Econ. Plan. Sci. 2021, 101104, Article in Press. [Google Scholar] [CrossRef]
- Teece, D.J. Business models, business strategy and innovation. Long Range Plan. 2010, 43, 172–194. [Google Scholar] [CrossRef]
- Spieth, P.; Schneckenberg, D.; Ricart, J.E. Business model innovation: State of the art and future challenges for the field. R&D Manag. 2014, 44, 237–247. [Google Scholar] [CrossRef]
- Li, C.; Mirosa, M.; Bremer, P. Review of Online Food Delivery Platforms and their Impacts on Sustainability. Sustainability 2020, 12, 5528. [Google Scholar] [CrossRef]
- Di Vaio, A.; Boccia, F.; Landriani, L.; Palladino, R. Artificial Intelligence in the Agri-Food System: Rethinking Sustainable Business Models in the COVID-19 Scenario. Sustainability 2020, 12, 4851. [Google Scholar] [CrossRef]
- Carrillo-Hermosilla, J.; Del Río, P.; Könnölȁ, T. Diversity of eco-innovations: Reflections from selected case studies. J. Clean. Prod. 2010, 18, 1073–1083. [Google Scholar] [CrossRef]
- Yun, J.H.J.; Park, K.B.; Gaudio, G.D.; Corte, V.D. Open innovation ecosystems of restaurants: Geographical economics of successful restaurants from three cities. Eur. Plan. Stud. 2020, 28, 2348–2367. [Google Scholar] [CrossRef]
- Ciftci, O.; Choi, E.K.; Berezina, K. Let’s face it: Are customers ready for facial recognition technology at quick-service restaurants? Int. J. Hosp. Manag. 2021, 95, 102–139. [Google Scholar] [CrossRef]
- Dirsehan, T.; Cankat, E. Role of mobile food-ordering applications in developing restaurants brand satisfaction and loyalty in the pandemic period. J. Retail. Cons. Serv. 2021, 62, 102608. [Google Scholar] [CrossRef]
- Kapoor, A.P.; Vij, M. Technology at the dinner table: Ordering food online through mobile apps. J. Retail. Cons. Serv. 2018, 43, 342–351. [Google Scholar] [CrossRef]
- Jeetesh, K.; Konar, R.; Balasubramanian, K. The impact of Social Media on Consumers’ purchasing behaviour in Malaysian Restaurants. J. Spat. Organ. Dyn. 2020, 8, 197–216. [Google Scholar]
- Jung, H.; Kim, H.; Ha, J.W. Understanding Differences between Heavy Users and Light Users in Difficulties with Voice User Interfaces, CUI ’20. In Proceedings of the 2nd Conference on Conversational User Interfaces, Bilbao, Spain, 22–24 July 2020; Article 51. pp. 1–4. [Google Scholar] [CrossRef]
- Chen, W.K.; Riantama, D.; Chen, L.S. Using a Text Mining Approach to Hear Voices of Customers from Social Media toward the Fast-Food Restaurant Industry. Sustainability 2021, 13, 268. [Google Scholar] [CrossRef]
- Byrd, K.; Her, E.H.; Fan, A.; Almanza, B.; Liu, Y.; Leitch, S. Restaurants and COVID-19: What are consumers risk perceptions about restaurant food and its packaging during the pandemic. Int. J. Hosp. Manag. 2021, 94, 102821. [Google Scholar] [CrossRef]
- Marty, L.; Jones, A.; Robinson, E. Socioeconomic position and the impact of increasing availability of lower energy meals vs. menu energy labelling on food choice: Two randomized controlled trials in a virtual fast-food restaurant. Int. J. Behav. Nutr. Phys. Act. 2020, 17, 10. [Google Scholar] [CrossRef]
- Vandenberg, B.; Livingston, M.; O’Brien, K. When the pubs closed: Beer consumption before and after the first and second waves of COVID-19 in Australia. Addiction 2020, 117, 1709–1715. [Google Scholar] [CrossRef]
- Cicco, R.D.; Silva, S.C.L.C.; Alparone, F.R. It’s on its way: Chatbots applied for online food delivery services, social or task-oriented interaction style? J. Foodserv. Bus. Res. 2021, 24, 140–164. [Google Scholar] [CrossRef]
- Ernst, A.T.; Jiang, H.; Krishnamoorthy, M.; Sier, D. Staff scheduling and rostering: A review of applications, methods and models. Eur. J. Oper. Res. 2004, 153, 3–27. [Google Scholar] [CrossRef]
- Zeng, Z.; Chen, P.J.; Lew, A.A. From high-touch to high-tech: COVID-19 drives robotics adoption. Tour. Geogr. 2020, 22, 724–734. [Google Scholar] [CrossRef]
- Martin-Rios, C.; Demen-Meier, C.; Gossling, S.; Cornuz, C. Food waste management innovations in the foodservice industry. Waste Manag. 2018, 79, 196–206. [Google Scholar] [CrossRef]
- Tanpure, S.S.; Shidankar, P.R.; Joshi, M.M. Automated Food Ordering System with Real-Time Customer Feedback. Int. J. Adv. Res. Comput. Sci. Softw. Eng. 2013, 3, 220–225. [Google Scholar]
- Divisekera, S.; Nguyen, V.K. Drivers of innovation in tourism: An econometric study. Tour. Econ. 2018, 24, 998–1014. [Google Scholar] [CrossRef]
- Bărbulescu, O.; Tecău, A.S.; Munteanu, D.; Constantin, C.P. Innovation of Startups, the Key to Unlocking Post-Crisis Sustainable Growth in Romanian Entrepreneurial Ecosystem. Sustainability 2021, 13, 671. [Google Scholar] [CrossRef]
- Kim, S.Y.; Upneja, A. Predicting restaurant financial distress using decision tree and AdaBoosted decision tree models. Econ. Model. 2014, 36, 354–362. [Google Scholar] [CrossRef]
- Charlebois, S.; Juhasz, M.; Music, J. Supply Chain Responsiveness to a (Post)-Pandemic Grocery and Food Service E-Commerce Economy: An Exploratory Canadian Case Study. Businesses 2021, 1, 72–90. [Google Scholar] [CrossRef]
- Yost, E.; Kizildag, M.; Ridderstaat, J. Financial recovery strategies for restaurants during COVID-19: Evidence from the US restaurant industry. J. Hosp. Tour. Manag. 2021, 47, 408–412. [Google Scholar] [CrossRef]
- Niu, B.; Li, Q.; Mu, Z.; Chen, L.; Ji, P. Platform logistics or self-logistics? Restaurants cooperation with online food-delivery platform considering profitability and sustainability. Int. J. Prod. Econ. 2021, 234, 108064. [Google Scholar] [CrossRef]
- Ali, S.; Khalid, N.; Javed, H.M.U.; Islam, D.M.Z. Consumer Adoption of Online Food Delivery Ordering (OFDO) Services in Pakistan: The Impact of the COVID-19 Pandemic Situation. J. Open Innov. Technol. Mark. Complex. 2021, 7, 10. [Google Scholar] [CrossRef]
- Brewer, P.; Sebby, A.G. The effect of online restaurant menus on consumers’ purchase intentions during the COVID-19 pandemic. Int. J. Hosp. Manag. 2021, 94, 102777. [Google Scholar] [CrossRef]
- Ajzen, I.; Fishbein, M. Understanding Attitudes and Predicting Social Behavior, 1st ed.; Prentice-Hall: Englewood Cliffs, NJ, USA, 1980; pp. 122–145. [Google Scholar]
- Ajzen, I. From intentions to actions: A theory of planned behavior. In Action Control: From Cognition to Behavior; Kuhl, J., Beckmann, J., Eds.; Springer: New York, NY, USA, 1985; pp. 11–39. [Google Scholar]
- Ajzen, I. The Theory of Planned Behavior. Organ. Behav. Hum. Decis. Process. 1991, 50, 179–212. [Google Scholar] [CrossRef]
- Davis, F.D. Perceived usefulness, perceived ease of use, and user acceptance of information technology. MIS Q. 1989, 13, 319–340. [Google Scholar] [CrossRef]
- Venkatesh, V.; Davis, F.D. A theoretical extension of the technology acceptance model: Four longitudinal field studies. Manag. Sci. 2000, 45, 186–204. [Google Scholar] [CrossRef]
- Preetha, S.; Iswarya, S. Factors Influencing the Intension to Use Food Online Order and Delivery Appvia Platforms-Using Tam (Technology Acceptance Model). Int. J. Recent Technol. Eng. 2019, 7, 1141–1147. [Google Scholar]
- Troise, C.; O’Driscoll, A.; Tani, M.; Prisco, A. Online food delivery services and behavioural intention—A test of an integrated TAM and TPB framework. Br. Food J. 2021, 123, 664–683. [Google Scholar] [CrossRef]
- Tan, T.F.; Netessine, S. At Your Service on the Table: Impact of Tabletop Technology on Restaurant Performance. Manag. Sci. 2019, 66, 4496–4515. [Google Scholar] [CrossRef]
- Goods, C.; Veen, A.; Barratt, T. Is your gig any good? Analysing job quality in the Australian platform-based food-delivery sector. J. Ind. Relat. 2019, 61, 502–527. [Google Scholar] [CrossRef]
- Annaraud, K.; Berezina, K. Predicting satisfaction and intentions to use online food delivery: What really makes a difference? J. Foodserv. Bus. Res. 2020, 23, 305–323. [Google Scholar] [CrossRef]
- Okumus, B.; Bilgihan, A. Proposing a model to test smartphone users’ intention to use smart applications when ordering food in restaurants. J. Hosp. Tour. Technol. 2014, 5, 31–49. [Google Scholar] [CrossRef]
- Kang, J.; Tang, L.R.; Fiore, A.M. Restaurant brand pages on Facebook: Do active member participation and monetary sales promotions matter? Int. J. Contemp. Hosp. Manag. 2015, 27, 1662–1684. [Google Scholar] [CrossRef]
- Davis, F.D.; Bagozzi, R.P.; Warshaw, P.R. User acceptance of computer technology: A comparison of two theoretical models. Manag. Sci. 1989, 35, 982–1003. [Google Scholar] [CrossRef]
- Pigatto, G.; Machado, J.G.D.C.F.; Negreti, A.D.S.; Machado, L.M. Have you chosen your request? Analysis of online food delivery companies in Brazil. Br. Food J. 2017, 119, 639–657. [Google Scholar] [CrossRef]
- Berezina, K.; Ciftci, O.; Cobanoglu, C. Robots, Artificial Intelligence, and Service Automation in Restaurants. In Robots, Artificial Intelligence, and Service Automation in Travel, Tourism and Hospitality; Ivanov, S., Webster, C., Eds.; Emerald Publishing Limited: Bingley, UK, 2019; pp. 185–219. [Google Scholar] [CrossRef]
- Gupta, V.; Duggal, S. How the consumer’s attitude and behavioural intentions are influenced: A case of online food delivery applications in India. Int. J. Cult. Tour. Hosp. Res. 2021, 15, 77–93. [Google Scholar] [CrossRef]
- Chen, H.S.; Liang, C.H.; Liao, S.Y.; Kuo, H.Y. Consumer Attitudes and Purchase Intentions toward Food Delivery Platform Services. Sustainability 2020, 12, 10177. [Google Scholar] [CrossRef]
- Al Amin, M.; Arefin, M.S.; Sultana, N.; Islam, M.R.; Jahan, I.; Akhtar, A. Evaluating the customers’ dining attitudes, e-satisfaction and continuance intention toward mobile food ordering apps (MFOAs): Evidence from Bangladesh. Eur. J. Manag. Bus. Econ. 2021, 30, 211–229. [Google Scholar] [CrossRef]
- He, Z.; Han, G.; Cheng, T.C.E.; Fan, B.; Dong, J. Evolutionary food quality and location strategies for restaurants in competitive online-to-offline food ordering and delivery markets: An agent-based approach. Int. J. Prod. Econ. 2019, 215, 61–72. [Google Scholar] [CrossRef]
- Karamshetty, V.; Freeman, M.; Hasija, S. An Unintended Consequence of Platform Dependence: Empirical Evidence from Food-Delivery Platforms (August 5, 2020). INSEAD Working Paper No. 2020/35/TOM. Available online: https://ssrn.com/abstract=3667539 (accessed on 30 August 2021).
- Saad, A.T. Factors affecting online food delivery service in Bangladesh: An empirical study. Br. Food J. 2021, 123, 535–550. [Google Scholar] [CrossRef]
- Forbes Romania. A Restaurant Operations Expert Shares Industry Insights & Predictions in Light of The Pandemic. Available online: Forbes.com/sites/cindybrzostowski/2020/10/23/a-restaurant-operations-expert-shares-industry-insights--predictions-in-light-of-the-pandemic/?sh=42a2b80c60ea (accessed on 27 June 2021).
- Liao, Z.; Landry, R. An empirical study on organizational acceptance of new information systems in a commercial bank environment. In Proceedings of the 33rd Annual Hawaii International Conference on System Sciences, Maui, HI, USA, 7 January 2000; IEEE: Piscataway, NJ, USA, 2000. [Google Scholar] [CrossRef]
- Yeo, V.C.S.; Goh, S.-K.; Rezaei, S. Consumer experiences, attitude and behavioral intention toward online food delivery (OFD) services. J. Retail. Consum. Serv. 2017, 35, 150–162. [Google Scholar] [CrossRef]
- Muangmee, C.; Kot, S.; Meekaewkunchorn, N.; Kassakorn, N.; Khalid, B. Factors Determining the Behavioral Intention of Using Food Delivery Apps during COVID-19 Pandemics. J. Theor. Appl. Electron. Commer. Res. 2021, 16, 1297–1310. [Google Scholar] [CrossRef]
- Elvandari, C.D.R.; Sukartiko, A.C.; Nugrahini, A.D. Identification of Technical Requirement for Improving Quality of Local Online Food Delivery Service in Yogyakarta. J. Ind. Inf. Technol. Agric. 2018, 1-7. [Google Scholar] [CrossRef]
- Ober, J. Innovation Adoption: Empirical Analysis on the Example of Selected Factors of Organizational Culture in the IT Industry in Poland. Sustainability 2020, 12, 8630. [Google Scholar] [CrossRef]
- Kadam, P.; Bhalerao, S. Sample Size Calculation. Int. J. Ayurveda Res. 2010, 1, 55–57. [Google Scholar] [CrossRef] [PubMed]
- Busu, M.; Gyorgy, A. Modelling the Impact of Heavy Work Investments on Employee’s Satisfaction. Amfiteatru Econ. 2020, 22, 1068–1084. [Google Scholar]
- Tecău, A.S.; Constantin, C.P.; Lixăndroiu, R.C.; Chitu, I.B.; Brătucu, G. Impact of the COVID-19 Crisis on Heavy Work Investment in Romania. Amfiteatru Econ. 2020, 22, 1049–1067. [Google Scholar] [CrossRef]
- Brace, I. Questionnaire Design: How to Plan, Structure and Write Survey Material for Effective Market Research. Psycology 2018, 9–15. [Google Scholar] [CrossRef]
- Yeo, A.C.M.; Carter, S.; Chezulhaimee, N.A. Corporate social responsibility intervention: A catalyst to small-medium enterprise employee engagement. Hum. Resour. Manag. 2018, 6, 38–62. [Google Scholar] [CrossRef][Green Version]
- Tuncer, I.; Unusan, C.; Cobanoglu, C. Service Quality, Perceived Value and Customer Satisfaction on Behavioral Intention in Restaurants: An Integrated Structural Model. J. Qual. Assur. Hosp. Tour. 2021, 22, 447–475. [Google Scholar] [CrossRef]
- Aureliano-Silva, L.; Leung, X.; Spers, E.E. The effect of online reviews on restaurant visit intentions: Applying signaling and involvement theories. J. Hosp. Tour. Technol. 2021, 1–15. [Google Scholar] [CrossRef]
- Ringle, C.M.; Sarstedt, M.; Schlittgen, R.; Taylor, C.R. PLS path modeling and evolutionary segmentation. J. Bus. Res. 2013, 66, 1318–1324. [Google Scholar] [CrossRef]
- Hair, J.F.; Risher, J.J.; Sarstedt, M.; Ringle, C.M. When to use and how to report the results of PLS-SEM. Eur. Bus. Rev. 2019, 31, 2–24. [Google Scholar] [CrossRef]
- Ali, F.; Rasoolimanesh, S.M.; Sarstedt, M.; Ringle, C.M.; Ryu, K. An assessment of the use of partial least squares structural equation modeling (PLS-SEM) in hospitality research. Int. J. Contemp. Hosp. Manag. 2018, 30, 514–538. [Google Scholar] [CrossRef]
- Hair, F., Jr.; Sarstedt, J.M.; Hopkins, L.G.; Kuppelwieser, V. Partial least squares structural equation modeling (PLS-SEM): An emerging tool in business research. Eur. Bus. Rev. 2014, 26, 106–121. [Google Scholar] [CrossRef]
- Chin, W.W. How to write up and report PLS analyses. In Handbook of Partial Least Squares: Concepts, Methods, and Applications; Esposito, V.V., Chin, W.W., Henseler, J., Wang, H., Eds.; Springer: New York, NY, USA, 2010; pp. 655–690. [Google Scholar]
- Becker, J.M.; Ringle, C.M.; Sarstedt, M.; Völckner, F. How collinearity affects mixture regression results. Mark. Lett. 2015, 26, 643–659. [Google Scholar] [CrossRef]
- Cheah, J.H.; Sarstedt, M.; Ringle, C.M.; Ramayah, T.; Ting, H. Convergent validity assessment of formatively measured constructs in PLS-SEM: On using single-item versus multi-item measures in redundancy analyses. Int. J. Contemp. Hosp. Manag. 2018, 30, 3192–3210. [Google Scholar] [CrossRef]
- Ringle, C.M.; Wende, S.; Becker, J.M. SmartPLS 3. SmartPLS GmbH, Boenningstedt. 2015. Available online: http://www.smartpls.com (accessed on 20 June 2021).
- Hair, J.F.; Hult, G.T.M.; Ringle, C.M.; Sarstedt, M. A Primer on Partial Least Squares Structural Equation Modeling (PLS-SEM); Sage: Thousand Oaks, CA, USA, 2017; pp. 290–348. [Google Scholar]
- Hair, J.F.; Hult, G.T.M.; Ringle, C.M.; Sarstedt, M.; Thiele, K.O. Mirror, Mirror on the wall: A comparative evaluation of composite-based structural equation modeling methods. J. Acad. Mark. Sci. 2017, 45, 616–632. [Google Scholar] [CrossRef]
- Henseler, J.; Ringle, C.M.; Sarstedt, M. Using partial least squares path modeling in international advertising research: Basic concepts and recent issues. In Handbook of Partial Least Squares: Concepts, Methods and Applications in Marketing and Related Fields; Okzaki, S., Ed.; Springer: Berlin/Heidelberg, Germany, 2021; pp. 252–276. [Google Scholar]
- Khan, G.F.; Sarstedt, M.; Shiau, W.L.; Hair, J.F.; Ringle, C.M.; Fritze, M. Methodological research on partial least squares structural equation modeling (PLS-SEM): An analysis based on social network approaches. Internet Res. 2019, 29, 407–429. [Google Scholar] [CrossRef]
- Chin, W.W. The partial least squares approach to structural equation modeling. In Modern Methods for Business Research; Marcoulides, G.A., Ed.; Lawrence Erlbaum Associates: Mahwah, NJ, USA, 1998; pp. 295–336. [Google Scholar]
- Sarstedt, M.; Ringle, C.M.; Cheah, J.H.; Ting, H.; Moisescu, O.I.; Radomir, L. Structural model robustness checks in PLS-SEM. Tour. Econ. 2019, 26, 531–554. [Google Scholar] [CrossRef]
- Höck, M.; Ringle, C.M. Strategic networks in the software industry: An empirical analysis of the value continuum. In Proceedings of the IFSAM 8th World Congress, Berlin, Germany, 28–30 September 2006. [Google Scholar]
- Tian, J.; Qi, D.; Wan, C.; Liu, S.; Wu, D.; Qin, W.; Dong, H.; Zhang, Q. Quality assessment of frying oil using short-chain fatty acid profile and infrared spectrum coupled with partial least squares. Food Meas. 2020, 14, 2289–2299. [Google Scholar] [CrossRef]
- Daskalakis, S.; Mantas, J. Evaluating the impact of a service-oriented framework for healthcare interoperability. Stud. Health Technol. Inform. 2008, 136, 285–290. [Google Scholar] [CrossRef]
- Kawalla, C.; Ullmann, M.; Hoeck, M. Procedure to Analyze the Formation of Segregations Using the PLS-SEM Approach. Key Eng. Mater. 2017, 746, 75–83. [Google Scholar] [CrossRef]
- Henseler, J.; Dijkstra, T.K.; Sarstedt, M.; Ringle, C.M.; Diamantopoulos, A.; Straub, D.W.; Ketchen, D.J.; Hair, J.F.; Hult, G.T.M.; Calantone, R.J. Common beliefs and reality about partial least squares. Organ. Res. Meth. 2014, 17, 182–209. [Google Scholar] [CrossRef]
- Akter, S.; Fosso-Wamba, S.; Dewan, S. Why PLS-SEM is suitable for complex modelling? An empirical illustration in big data analytics quality. Prod. Plan. Control. 2017, 28, 1011–1021. [Google Scholar] [CrossRef]
- Franke, G.; Sarstedt, M. Heuristics versus statistics in discriminant validity testing: A comparison of four procedures. Internet Res. 2019, 29, 430–447. [Google Scholar] [CrossRef]
- Hair, J.F.; Ringle, C.M.; Sarstedt, M. Partial least squares structural equation modeling: Rigorous applications, better results and higher acceptance. Long Range Plan. 2013, 46, 1–12. [Google Scholar] [CrossRef]
- Fornell, C.G.; Larcker, D.F. Evaluating structural equation models with unobservable variables and measurement error. J. Mark. Res. 1981, 18, 39–50. [Google Scholar] [CrossRef]
- Dijkstra, T.; Henseler, J. Consistent Partial Least Squares Path Modeling. MIS Q. 2015, 39, 297–316. [Google Scholar] [CrossRef]
- Hu, L.T.; Bentler, P.M. Fit indices in covariance structure modeling: Sensitivity to under parameterized model misspecification. Psychol. Methods 1998, 3, 424–453. [Google Scholar] [CrossRef]
- Akinwande, M.; Dikko, H.; Samson, A. Variance Inflation Factor: As a Condition for the Inclusion of Suppressor Variable(s) in Regression Analysis. Open J. Stat. 2015, 5, 754–767. [Google Scholar] [CrossRef]
- Vörösmarty, G.; Dobos, I. Green purchasing frameworks considering firm size: A multicollinearity analysis using variance inflation factor. Supply Chain. Forum Int. J. 2020, 21, 290–301. [Google Scholar] [CrossRef]
- Tenenhaus, M.; Vinzi, V.E.; Chatelin, Y.M.; Lauro, C. PLS path modeling. Comput. Stat. Data Anal. 2005, 48, 159–205. [Google Scholar] [CrossRef]
- Awang, Z.; Afthanorhan, A.; Asri, M.A.M. Parametric and non parametric approach in structural equation modeling (SEM): The application of bootstrapping. Mod. Appl. Sci. 2015, 9, 58–67. [Google Scholar] [CrossRef]
- Goodhue, D.L.; Lewis, W.; Thompson, R.L. Comparing PLS to regression and LISREL: A response to Marcoulides, Chin, and Saunders. MIS Q. 2012, 36, 703–716. [Google Scholar] [CrossRef]
- Cohen, J. Statistical Power Analysis for the Behavioral Sciences, 2nd ed.; Lawrence Erlbaum Associates: Mahwah, NJ, USA, 1988; pp. 273–403. [Google Scholar]
- Höck, C.; Ringle, C.M.; Sarstedt, M. Management of multi-purpose stadiums: Importance and performance measurement of service interfaces. Int. J. Serv. Technol. Manag. 2010, 14, 188–207. [Google Scholar] [CrossRef]
- Keil, M.; Tan, B.C.; Wei, K.-K.; Saarinen, T.; Tuunainen, V.; Wassenaar, A. A cross-cultural study on escalation of commitment behavior in software projects. Manag. Inf. Syst. Q. 2000, 24, 299–325. [Google Scholar] [CrossRef]
- Sarstedt, M.; Ringle, C.M.; Henseler, J.; Hair, J.F. On the emancipation of PLS-SEM: A commentary on Rigdon (2012). Long Range Plan. 2014, 47, 154–160. [Google Scholar] [CrossRef]
- Jacobs, N.; Hagger, M.S.; Streukens, S.; De Bourdeaudhuij, I.; Claes, N. Testing an integrated model of the theory of planned behaviour and self-determination theory for different energy balance-related behaviours and intervention intensities. Br. J. Health Psychol. 2011, 16, 113–134. [Google Scholar] [CrossRef]
Publisher’s Note: MDPI stays neutral with regard to jurisdictional claims in published maps and institutional affiliations. |
© 2021 by the authors. Licensee MDPI, Basel, Switzerland. This article is an open access article distributed under the terms and conditions of the Creative Commons Attribution (CC BY) license (https://creativecommons.org/licenses/by/4.0/).