Article

The Protective Effect of Digital Financial Inclusion on Agricultural Supply Chain during the COVID-19 Pandemic: Evidence from China

School of Economics, Peking University, Beijing 100871, China
*
Author to whom correspondence should be addressed.
J. Theor. Appl. Electron. Commer. Res. 2021, 16(7), 3202-3217; https://doi.org/10.3390/jtaer16070174
Submission received: 9 October 2021 / Revised: 14 November 2021 / Accepted: 16 November 2021 / Published: 21 November 2021

Abstract

:
Financial inclusion plays a positive role in protecting agriculture during or after disaster. This paper focuses on the protective effect of digital financial inclusion on the agricultural supply chain and analyzes three mechanisms of the protective effect: financial widening, financial deepening, and financial services digitization. Based on the Gravity Equation, we conduct an empirical study using agricultural logistics and digital financial inclusion data from China. The regression results indicate that a 1% increase in the digital financial inclusion, measured by the Peking University Digital Inclusion Index, increases agricultural trade during the COVID-19 pandemic by approximately 1.6%. Furthermore, heterogeneous protective effects exist between regions in China. Digital financial inclusion is more effective in the Eastern regions in protecting the ASC than in other regions. This paper enriches the understanding of financial inclusion in helping agriculture supply chain recovery.

1. Introduction

The agricultural supply chain (ASC) is essential for the economy and society. The COVID-19 pandemic has posed many challenges for the global ASC [1,2,3,4]. The uncertainty caused by the COVID-19 pandemic resulted in panic buying, soaring food prices, and food supply disruptions [5,6,7,8], which negatively impacted global food security. ASC disruption risks can also lead to farmers’ poverty, massive food wastages and social conflict [9,10]. The ASC in developing economies such as China also faces difficulties related to the shortage of food imports, uncertainty in agricultural production, and higher agricultural logistics costs [11,12]. Therefore, while care must be taken to control COVID-19, minimizing its impacts on the ASC must also be addressed.
Promoting the recovery of the ASC from the COVID-19 pandemic requires effective financial support [13,14]. However, traditional financial services do not cover all rural areas, especially in developing countries, and it is difficult for farmers to obtain sufficient credit [15,16,17]. Inclusive finance is probably a better alternative solution for obtaining financial support for agriculture [18,19,20].
At the same time, with the development of digital technology (e.g., AI, block chain, big data), the use of digital technology in agricultural production, trade and consumption is attracting the attention of researchers [2,21,22,23]. One World Bank report shows that the use of digital technology has opened up new opportunities for rural areas through financial inclusion [24]. Compared to offline finance, digital finance is regarded as a low-cost and convenient financial service access for farmers [25,26,27,28]. Before the coronavirus outbreak, studies had already analyzed the role of digital financial inclusion in promoting the ASC development, rural e-commerce and agriculture trade. During the COVID-19 pandemic, digital inclusive financial services have provided farmers with access to loans and insurance online to maintain the ASC. However, no study has examined the protective effect of digital financial inclusion on agricultural supply chain during the COVID-19 pandemic.
This paper attempts to fill that gap by exploring the protective effect of digital financial inclusion on ASC during the COVID-19 pandemic based on big data. More specifically, this paper addresses the following two questions: (1) does financial inclusion play a role in protecting the ASC during the COVID-19 pandemic? (2) what are the mechanisms by which financial inclusion plays a protective role in the ASC? An empirical study using unique logistics data from China will quantify the protection effects more accurately. COVID-19 has heavily disrupted the world economy and many rural areas are struggling to reverse the negative shock. Our study enriches the understanding of financial inclusion in helping economic recovery, and also contributes to research on rural recovery, agricultural supply chain and financial inclusion policy in the post-COVID-19 context.
The present study is organized as follows. Section 2 is a review of the literature on the ASC during the COVID-19 and digital financial inclusion used in the ASC. Section 3 displays the method and data we used to analyze the protective impact of digital inclusive finance on the ASC during the COVID-19. Section 4 in the following reports the empirical results and discusses the heterogeneity between regions in China. Section 5 summarizes the main conclusions and limitations of this paper.

2. Literature Review

In this part, we have focused on two areas of relevant research: (1) the challenges and risks faced by the ASC that agricultural supply chains faced during and after the pandemic. (2) the role of digital inclusive finance in the ASC. We summarize previous literature and show how they connect to this study.

2.1. ASC and the COVID-19

Although no universal definition exists, agricultural supply chain usually refers to activities including farming, transportation, marketing and consumption [29,30]. Unlike manufactured products’ supply chain, the ASC faces unique vulnerability due to the seasonality of agricultural production, natural disasters, the difficulty of standardizing and storing products [31,32,33]. Therefore, understanding the unique vulnerability of the ASC will help food industry managers and agricultural policy makers manage risks effectively to ensure food security.
The COVID-19 pandemic has created significant issues for the agricultural production, trading, and distribution systems [2]. First, the ongoing pandemic has a negative impact on agricultural production. The ongoing pandemic has caused a sharp increase in the price of ASC-related means of production, such as seeds, fertilizer, energy, and fuel, making small farm production unsustainable [34,35,36]. Capital-intensive farming operations have also been affected by fluctuations in interest rates and exchange rates [37]. Second, transportation restrictions during the COVID-19 have shocked the ASC system. Policies to prevent the spread of the virus, such as domestic lockdowns, international border closures, and community social distancing, have also interrupted the transport of agricultural products in some areas, creating supply shortages between regions [3,8,9,10,11,12,13,14,15,16,17,18,19,20,21,22,23,24,25,26,27,28,29,30,31,32,33,34,35,36,37,38,39,40]. Third, stakeholders on the distribution side of the ASC have suffered tremendously due to the demand-side shocks, such as panic buying, stocking, unemployment, and income instability [34,35,38,39].
As the pandemic unfolds, the ASC needs strategies for recovering and enhancing its long-term resilience. While existing research has made some policy recommendations on how to promote ASC in the post-COVID-19 era, more research is still needed on the effectiveness of specific strategies. We chose to investigate how the strategy of digital financial inclusion protects the ASC to gain more insights into ASC recovery strategies in the post-COVID-19 era.

2.2. Digital Finance Inclusion in ASC

As early as the Great Recession of 2008, research has already focused on the role of finance in responding to the ASC crisis [41]. Financial actors play an increasingly active role in food marketing [42], agricultural production transportation [43] and agricultural inputs provisioning during the time of crisis [44,45,46]. With the widespread use of digital technology in agriculture, digital financial inclusion has become an important tool for improving ASC performance, especially in developing countries. Evidence from developing countries, such as China and India, shows that digital financial inclusion can promote rural e-commerce [47,48,49], address financial instability [50,51] and increase the income of small peasants [52,53,54].
Given the huge potential of digital technology, research has suggested that digital finance (e.g., mobile finance, blockchain finance) could be adopted to address the ASC crisis caused by the pandemic [2,3,55,56]; however, these suggestions remain conceptual and lack evidence on its effectiveness. This paper will fill in the gap to provide that evidence o by examining the protective effect of digital financial inclusion on ASC.

3. Method and Data

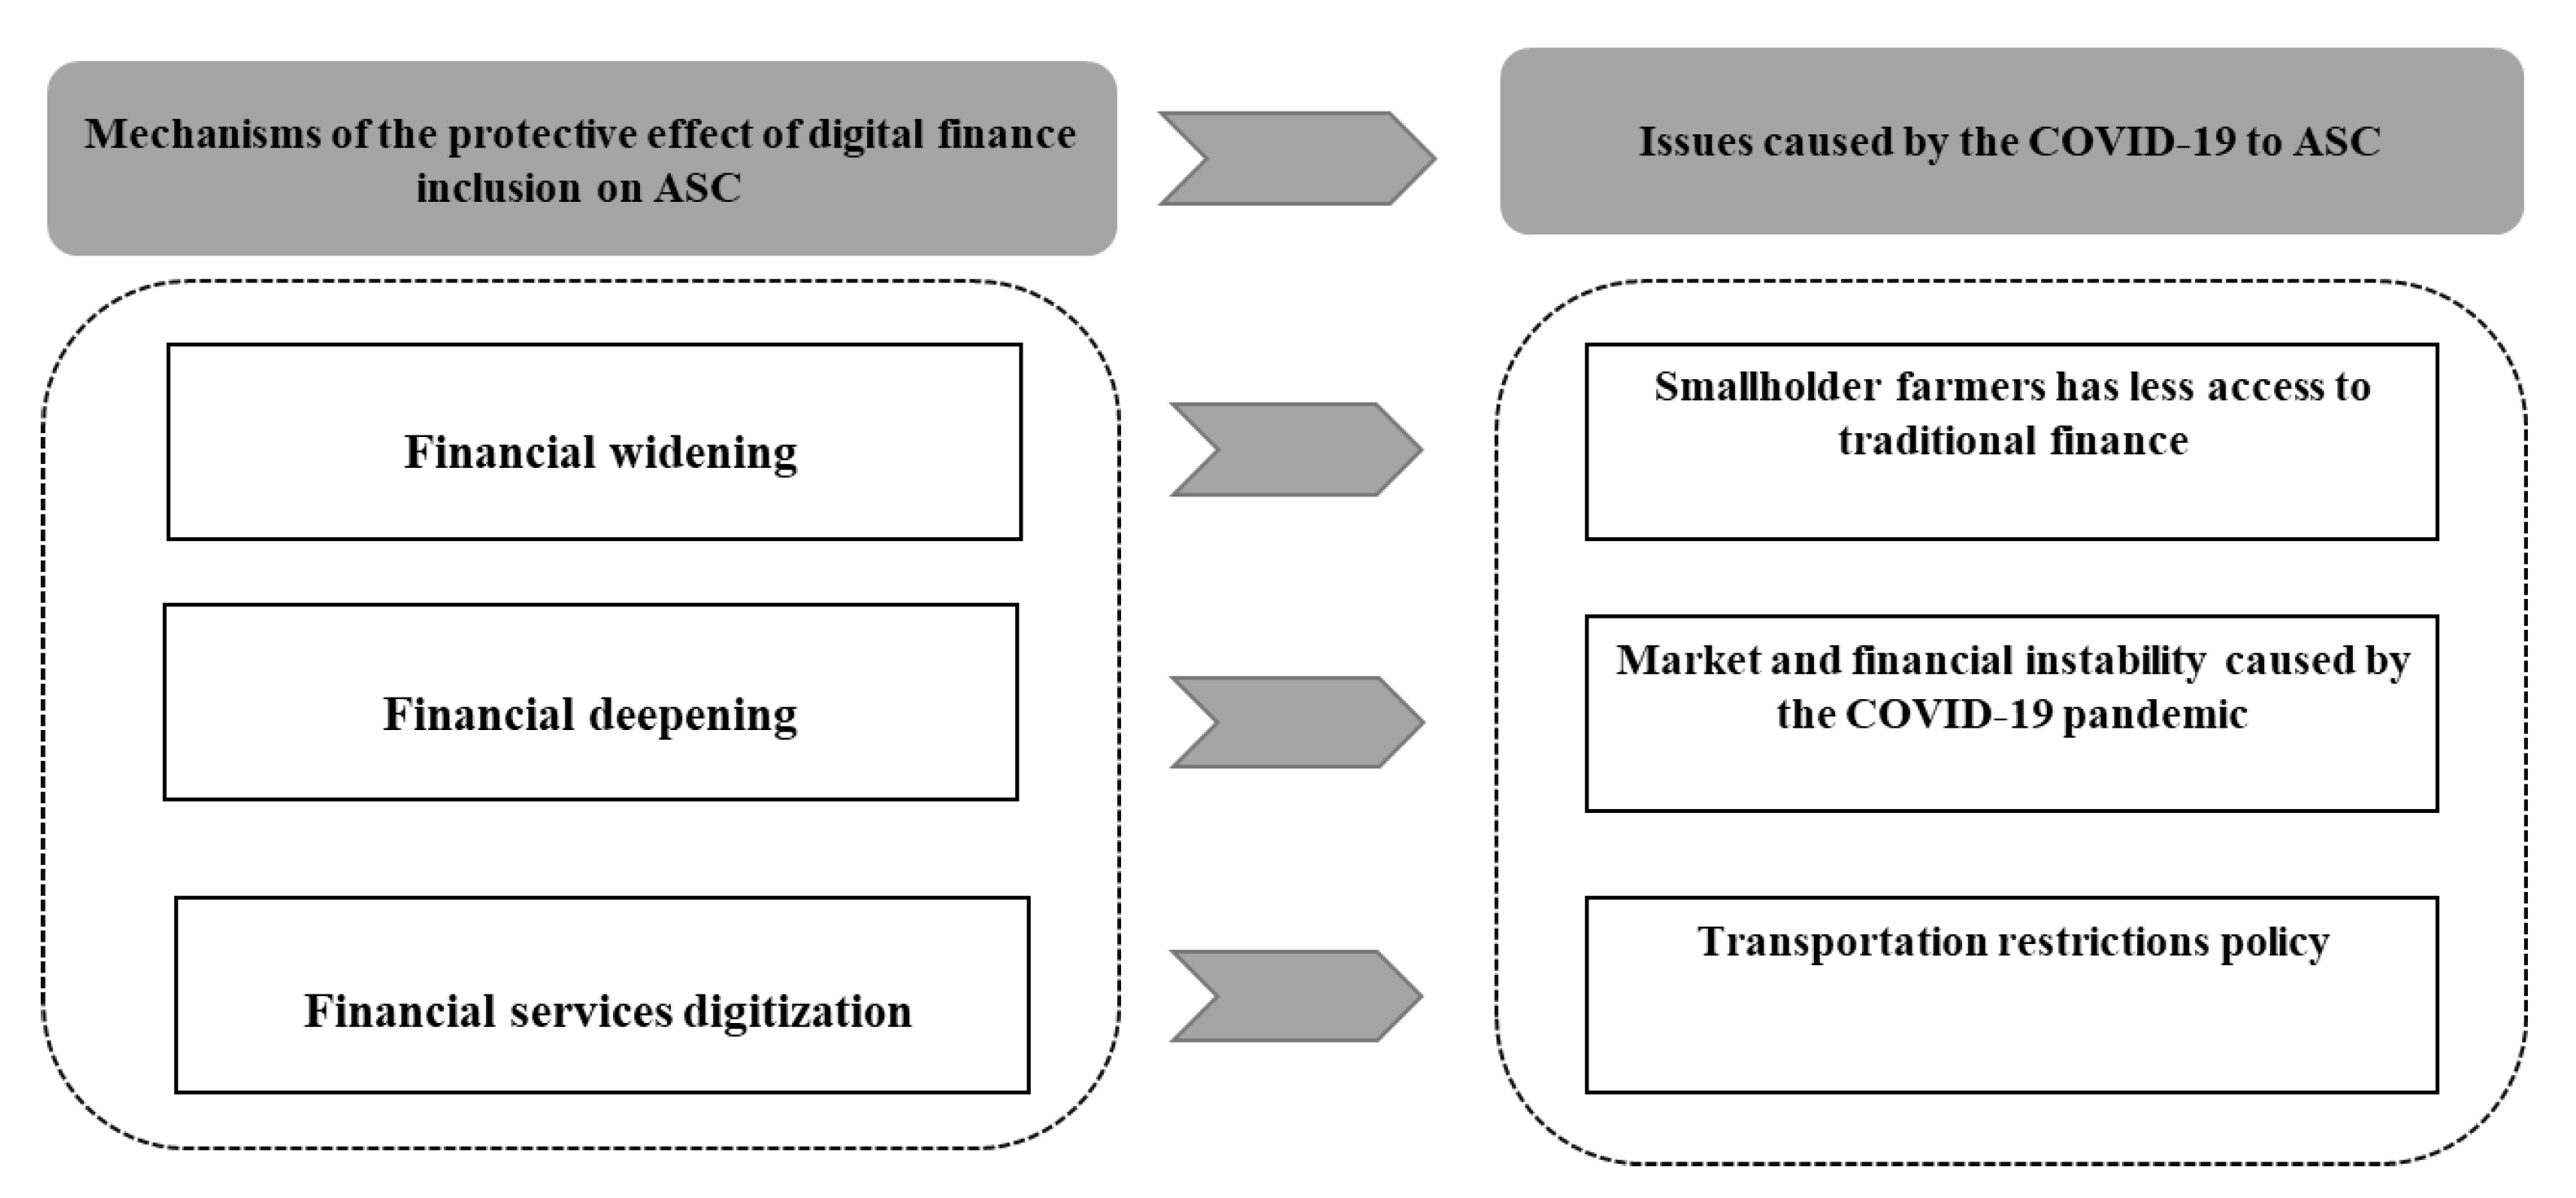
3.1. Theoretical Framework

In Section 2, we summarized the main issues faced by the ASC during the COVID-19 pandemic. Digital financial inclusion provides three types of mechanisms to protect the ASC (see Figure 1).
The first is the financial widening—expanding financial services to reach more people without access to traditional finance. Traditional financial institutions rarely serve the needs of low-income smallholders and the economic recession caused by the epidemic has made them more cautious about lending, which reduces credit access for small farmers. Digital inclusive finance helped these smallholders access to loans during the COVID-19 pandemic; for example, smallholders in Shandong, Sichuan, and Chongqing have been able to obtain low-interest unsecured loans based on their online payment history and farmer identification (Some polices and cases can be found here: https://baijiahao.baidu.com/s?id=1661417712570368806&wfr=spider&for=pc (accessed on 17 March 2020); https://www.sohu.com/a/383027426_667445 (accessed on 25 March 2020); https://new.qq.com/omn/20200317/20200317A0N49Y00.html (accessed on 17 March 2020)).
The second is financial deepening—giving farmers access to multi-categories of financial products and services. Given the market and financial instability caused by the pandemic, more complex financial products, such as loans, insurance and futures, are needed to cope with these challenges in the ASC. Digital technology makes these complex services available through mobile phone applications (APPs). For example, Alipay, one of the largest mobile payment APPs in China, provides rural people with access to financial inclusion services during the pandemic, such as small unsecured loans for farmers, e-commerce subsidies for low-income rural areas, and special online health insurance for rural women [57].
The third is financial services digitization—conducting financial inclusion processes online. Traffic restriction policies not only affect the transportation of agricultural products, but also create difficulties in credit access, marketing, payment, and other processes in ASC. Traditional financial inclusion development is limited by geographical factors and the services cannot cover all villages in China. During the COVID-19 pandemic, farmers in some rural areas were unable to receive offline financial services. Digital financial inclusion services can cover more rural areas by extending that access online through computer or mobile phone apps, enabling farmers to obtain financial services despite lockdown restrictions. One report by the Central Bank of China showed that in 2020, the mobile payment use in rural China increased by 41.41% compared to 2019 [58]. Online financial inclusion lessened the negative impact of traffic restriction policies on the ASC.

3.2. Methods

Section 3.1 described three theoretical mechanisms for how digital inclusion helps protect ASCs. This section builds an empirical model to test the theoretical hypothesis based on the Gravity Equation.
Trade volume is an important indicator of supply chain activities. The Gravity Equation has been widely used in empirical studies to measure trade volumes and study supply chain [59,60]. The basic Gravity Equation can be expressed as Equation (1), where the volume of trade ( Y i j ) between two regions is positively related to the economic factors of the two regions ( X i , X j ) and negatively related to the distance between the two regions ( D i j ). Economic factors have variable indicators (e.g., GDP, per-capita GDP, scale of production, population, income, industrial structure, etc.), and distance can be measured by geographical distance, national border or even social network [61,62,63,64].
Y i j = coef × X i X j D i j
We use the two methods to estimate the Gravity Equation: the Log-Log regression model with fixed effects and Poisson pseudo-maximum likelihood with fixed effects.

3.2.1. Log-Log Regression Model with Fixed Effects (LL-FE)

This paper focuses on the protective effect of digital financial inclusion on the ASC. Estimating the Gravity Equation requires controlling the characteristics of a city. Referring to methods of Anderson and Wincoop (2003) [61], Silva and Tenreyro [65], and Chaney [66,67], we set up the basic empirical model as in Equation (2). In Equation (2), t r a d e i , j and d i s i , j are the volume of agricultural trade and geographical distance between regions i and j, respectively; i n d e x i , j is a series of indices measuring digital financial inclusion, which will be discussed in more details in the Data section. μi, μj are the fixed effects of region i and region j, respectively, and α , ε i , j are the intercepts of the error term. β describes parameters that need to be estimated. Although the LL model faces some problems in the Gravity Equation [68,69], most studies have used it as a benchmark model for empirical regression because of its intuitive economic implications (elasticity) [61,63,65,66,67]. Thus, this paper also used the LL-FE model for the basic estimation.
l n t r a d e i , j = α + β 1 l n i n d e x i , j + β 2 l n d i s i , j + μ i + μ j + ε i , j

3.2.2. Poisson Pseudo-Maximum Likelihood with Fixed Effects (PPML-FE)

The linear estimate will be biased if the high-order moments of the error term are not zero in the Gravity Model, making Poisson pseudo-maximum likelihood a more suitable method [68]. Martínez-Zarzoso [69] proved that PPML has the smallest estimation bias when there is heteroskedasticity and a “zero trade problem” that generally leads to an underestimation of the coefficient in the Gravity Equation. In our sample, there are 200 cities with 0 bilateral trade, so we also meet a “zero trade problem”, suggesting that PPML might be a more accurate method. According to the latest estimation method proposed by Sergio et al. [70], we constructed Poisson pseudo-maximum likelihood with the fixed effects model as shown in Equation (3). θ are parameters that need to be estimated and the meaning of other variables is the same as in Section 3.2.1.
E ( t r a d e i , j | i n d e x i , j , d i s i , j , θ , μ i , μ j ) ~ Poisson   f ( i n d e x i , j θ 1 , d i s i , j θ 2 , μ i , μ j )

3.3. Data

3.3.1. Dependent Variable on Trade

So far, there has been no authoritative data reflecting the volume of domestic agricultural trade in China. Most of the previous studies use research data from a single or only a few villages [47,48,49] Thus, there is a lack of data on inter-regional agricultural production trade volume.
Our research selected data on inter-regional agricultural products less-than-truckload (LTL) as a proxy variable reflecting the activity of ASC in China. The unique logistic data comes from a leading company engaged in logistics information services in China (The Business Privacy and Data Use Agreement prevents us from releasing the company’s name. Readers interested in the data are welcomed to contact the authors). By 2020, more than 80% of the top 100 logistics enterprises in China have already used this company as a technology provider and their services cover approximately 17% of the trucks in China. Big data analysis has shown that the data are highly significantly correlated with China’s economic activities [71]. To illustrate the representativeness of the data, we show the volume of truck flow of agricultural products during the COVID-19 pandemic in Figure 2. We found that agricultural product trade declined significantly from mid-to-late January 2020 due to the combined impact of the epidemic and the Chinese New Year. The volume of agricultural product trading was almost zero in January and February 2020, which illustrates the serious negative impact of the epidemic on the ASC. Once China established procedures controlling the epidemic, production activities resumed, and the truck flow volume gradually recovered since March 2020, approaching pre-pandemic levels by April 2020. This might be explained by the gradual recovery of agricultural production and food consumption.
Since this study focused on the dynamics of the ASC during the COVID-19 pandemic, we collected the number of agricultural product waybills and freight market prices from 273 regions in mainland China from 1 January 2020 to 18 May 2020, and multiplied them as a proxy variable to reflect the ASC activity. Due to the short time span, we treat this data in cross-sectional form.

3.3.2. Independent Variable on Digital Financial Inclusion

We used the Peking University Digital Inclusion Index (PKU-IFDI) as a proxy variable for the state of digital financial inclusion. The PKU-IFDI was established by the Institute of Digital Finance, Peking University, in 2011. The PKU-IFDI includes sub-indexes for financial inclusion widening, financial inclusion deepening, and financial inclusion digitalization, which are the mechanisms in our theoretical framework. Studies have described the calculation methodology and scientific nature of this index [72,73,74]. To illustrate the representativeness of the data, firstly we showed the correlation between prefecture-level PKU-IFDI and prefecture-level GDP in 2018 in Figure 3, where we found a significant positive relationship between the two (0.82). This correlation confirms that the PKU-IFDI fits the economic activity. Additionally, Figure 4 maps the region-level PKU-IFDI in 2018. We saw that the PKU-IFDI is consistent with the spatial characteristics of China’s economic activities.
Because the impact of digital financial inclusion and inter-regional trade is closely related to the scale of the population it reached [61,65], we calculated the weighted average of the PKU-IFDI with prefecture-level population as the weight (Equation (4)). Our independent variables used the aggregate index, the digital financial inclusion widening sub-index, the digital financial deepening sub-index and the digitalization of financial inclusion sub-index from the PKU-IFDI in 2018.
i n d e p e n d e n t   v a r i a b l e s i , j = ( p o p u l a t i o n i × P K U I F D I i + p o p u l a t i o n j × P K U I F D I j ) p o p u l a t i o n i + p o p u l a t i o n j

3.3.3. Other Variable

Since data in our study were cross-sectional, our fixed effects model controlled for all characteristics of the city and did not need any other control variable. In further discussion, however, we included variables that reflect differences between regions in China. We introduced a dummy variable for whether the origin or the destination of trade is in China’s Eastern provinces (The “Eastern provinces” designation is based on the China Statistics Bureau’s divisions for China’s economic regions, including the ten developed provinces. For more details, see http://www.stats.gov.cn/tjfw/tjzx/tjzxbd/201811/t20181110_1632622.html (accessed on 10 October 2021)). Table 1 shows the definitions and descriptive statistics (means and standard deviations) of variables.
We presented the correlation coefficients between the variables in Table 2. The correlation coefficients provide a preliminary idea of the protective effect of digital financial inclusion on the ASC. For example, Trade has a correlation coefficient of 0.4297 (Aggregate), 0.4903 (Width), and 0.6470 (Depth), indicating significant positive correlations. However, the mechanism of digitization might be insignificant because the correlation is approximately zero (−0.0550). Of course, the correlation coefficients only provide rough evidence, and the effect requires additional rigorous empirical testing.

4. Results

4.1. Baseline Model

We deleted observations with missing values. Table 3 reports the LL-FE model results. According to Table 3, we had three key findings. Firstly, we observed that the Aggregate coefficient is positive and statistically significant at 5% level in Model-1, indicating that digital financial inclusion protects the ASC in China during the COVID-19 pandemic. The results showed that a 1% increase in digital financial inclusion (measured by PKU-IFDI) improved agricultural trade during the COVID-19 pandemic by approximately 0.84%.
Secondly, we tested the three types of mechanisms described (Section 3.1) in Models 2 to 5. We found that digital financial widening and digital financial deepening both played a positive role in protecting China’s ASC at the total sample level, but the impact of financial services digitization was insignificant. Of the three mechanisms, financial deepening had the greatest effect.
Thirdly, we found that the reason for the insignificant of the Digitalization coefficient might be the differences between the rural information infrastructure in China’s different regions. For instance, in the most Eastern regions of China, rural household information, such as health insurance and real estate certificates, has already been stored in an online database, which facilitates their access to credit without the need for offline applications. While residents in less developed rural areas, such as some villages in Xinjiang, Qinghai, and some parts of Sichuan province, do not have any internet-related infrastructure. We further discuss the regional heterogeneity in the next section.
Table 4 reports the results of PPML-FE. The coefficients of the PPML model did not directly explain the economic meaning, thus we did further calculations based on the coefficients. For example, we calculated the elasticity between Trade and Aggregate to be 1.6311 based on the regression results of Model 6. We found that a 1% increase in digital financial inclusion (measured by PKU-IFDI) increased agricultural trade during the COVID-19 pandemic by approximately 1.6311% when we controlled for the “zero trade problem”. In summary, the significance and direction of all the PPML-FE coefficients were consistent with the LL-FE regression, which indicates the strong robustness of the empirical results.

4.2. Further Discussion

We further discussed regional heterogeneity in this section. We introduced an interaction term between the region dummy variable and the core dependent variable to explore the impact of regional heterogeneity on the protective effect. Table 5 shows the regional heterogeneity estimated by the LL-FE model, which produced two interesting findings: (1) The protective effect of digital financial inclusion on China’s ASC is stronger in the Eastern regions than elsewhere. For example, in Model-11, the marginal effect of lnAggregatei,j was 0.2256 (2.1601 − 1.9345 = 0.2256) when east = 1, which means that the total protective effect of digital financial inclusion in the Eastern regions is 0.2256% higher than elsewhere. We observed a similar phenomenon in Models 12–14. (2) In Model-15 and Model-16, the coefficient of lnDigitalizationi,j was significant, and showed a positive marginal effect in the Eastern regions and an insignificant effect in other regions. This suggested that digital financial inclusion protected China’s ASC in the Eastern regions through the digital services mechanism during the COVID-19 pandemic. Most of the conclusions remained robust when using PPML-FE (Table 6).
What might explain the differences between the Eastern and other regions in China? One reason might be rural households’ differing experiences of participating in financial inclusion. Research has shown that farmers who have experienced financial inclusion are more likely to use such services again [27,72,73,74]. Farmers’ experience with inclusive finance can expand digital financial widening and deepening, which in turn increases the effect of digital financial inclusion. For example, rural households with experience in financial inclusion readily rely on financial inclusion when they suffer from a shortage of funds. Benefiting from a well-developed rural cooperative financial system, rural households in Eastern China have more experience of using financial inclusion than elsewhere in China. To understand this, we compared the average usage level of rural mutual insurance and rural cooperative finance between Eastern provinces and other regions in 2018 in Figure 5. It illustrates that rural people in the Eastern regions are more likely to have experience of participating in financial inclusion.
Another reason might be the differences in the degree of market-oriented development between rural regions. The effectiveness of financial inclusion depends on the marketization level. In China, the more market-oriented the rural region, the more efficient the financial inclusion [72,73]. We compared two aspects of the marketization level: the product market related to rural e-commerce and the rural factor market.
In Figure 6, we showed the gap in two types of marketization development between the Eastern and other regions. On the one hand, the number of rural organizations related to e-commerce can reflect the level of product marketization development in rural areas. A survey conducted in 2018 by the Chinese Ministry of Agriculture on the number of farmer cooperatives that launched e-commerce businesses in each province reported that the Eastern region had an average of 984.13 farmer cooperatives related to e-commerce, which is approximately 64% higher than other regions. On the other hand, since 2015, when China implemented a new round of rural land reform, China’s government has eased restrictions on trading rural land. The agricultural land-use right can be traded in various forms, including mortgages, which provides rural households with more efficient access to inclusive financial credit. The rural factor market development in Eastern regions, reflected by the proportion of agricultural land transactions, was approximately 13% higher than elsewhere. Thus, digital financial inclusion in Eastern regions might have been more effective at protecting rural e-commerce more effectively.
Finally, infrastructure is related to digital technology. The mechanism of financial services digitization acts effectively only in the Eastern rural regions because there is a high level of digital infrastructure. For example, farmers could apply for loans online if their land ownership record are accessible on the internet, which could be beneficial. However, not all farmers’ land ownership information is recorded in the online database in China due to the differences in the development of digital technology infrastructure, such as signal base stations, broadband networks, and power stations. In 2018, about 37% of rural land ownership was recorded in the online database with electronic files all over the country, with 51% in the Eastern regions and 29% in other regions. Of course, some other important factors influence the use of digital technologies in rural areas, such as digital literacy and accessibility, which also influence the effectiveness of financial services digitization mechanism.

5. Conclusions

Digital financial inclusion, an emerging economic phenomenon in rural areas, offers a suitable method for trading and accessing inclusive financial services online during the COVID-19 pandemic. However, it remains unclear whether and how digital financial inclusion protects the ASC. This study discussed the protective effect of digital financial inclusion on China’s ASC; we reached the following three conclusions.
First, digital financial inclusion played a positive role in protecting China’s ASC during the COVID-19 pandemic. The empirical results based on the Gravity Equation showed that the level of digital financial inclusion had a significant positive impact on agricultural product trade. The regression results indicated that a 1% increase in digital financial inclusion (measured by PKU-IFDI) increased agricultural trade during the COVID-19 pandemic by approximately 1.6%.
Second, digital financial inclusion protected China’s ASC through three mechanisms: financial widening, financial deepening, and financial services digitization. Overall, financial widening and financial deepening have both been effective, with the mechanism of financial deepening working more significantly. However, the digital service mechanism had an insignificant effect.
Third, the protective effect varied among regions in China. In China’s Eastern regions, digital financial inclusion played a more effective role in protecting the ASC than elsewhere, and the digital financial service mechanism was also more effective in the Eastern regions. Three factors might lead to the regional heterogeneity: rural households’ experience with financial inclusion, market-oriented development in rural areas, and infrastructure related to digital technology.

6. Limitations and Implications

Due to data limitations, our study suffered from two limitations. Firstly, we could only test the short-term effects of digital financial inclusion on China’s ASC because our ASC-data were limited to a few months in 2020. With more data, the long-term effects of digital financial inclusion on China’s ASC could be tested. Secondly, there were policy disruptions during the pandemic, such as the agricultural production stimulus policy and the monetary QE policy, which might have affected the accuracy of our estimation results. Causal identification methods (such as Regression Discontinuity (RD) model and Difference-in-Difference (DID) model) might be more desirable under this circumstance. However, since the shock of the epidemic has been global, it is difficult to find control groups that satisfy causal identification conditions. Nevertheless, the consistency of the LL-FE and PPML-FE estimates suggested that our hypothesis was correct, at least at the qualitative level.
The global economy is still shrouded in uncertainty because of the continuous mutation of the virus. A review and a quantitative assessment of financial inclusion policies could help reduce shock in rural areas. The study may also provide some implications for financial inclusion policymakers, inclusive financial institutions, and agribusiness operators on how to respond to disasters such as the ongoing COVID-19 pandemic.

Author Contributions

Conceptualization, D.F.; Methodology, D.F. and X.Z.; Writing—original draft preparation, D.F. and X.Z.; Writing—review and editing, D.F. and X.Z. All authors have read and agreed to the published version of the manuscript.

Funding

This research received no external funding.

Institutional Review Board Statement

Not applicable.

Informed Consent Statement

Not applicable.

Data Availability Statement

Data is contained within the article.

Conflicts of Interest

The authors declare no conflict of interest.

References

  1. Food and Agriculture Organization. Novel Coronavirus (COVID-19). 2020. Available online: http://www.fao.org/2019-ncov/q-and-a/impact-on-food-and-agriculture/en (accessed on 30 July 2021).
  2. Nayal, K.; Raut, R.D.; Queiroz, M.M.; Yadav, V.S.; Narkhede, B.E. Are artificial intelligence and machine learning suitable to tackle the COVID-19 impacts? An agriculture supply chain perspective. Int. J. Logist. Manag. 2021, in press. [Google Scholar] [CrossRef]
  3. Sharma, R.; Shishodia, A.; Kamble, S.; Gunasekaran, A.; Belhadi, A. Agriculture supply chain risks and COVID-19: Mitigation strategies and implications for the practitioners. Int. J. Logist. Res. Appl. 2020, in press. [Google Scholar] [CrossRef]
  4. Altieri, M.A.; Clara, I.N. Agroecology and the reconstruction of a post-COVID-19 agriculture. J. Peasant Stud. 2020, 47, 881–898. [Google Scholar] [CrossRef]
  5. William, A.K. The COVID-19 pandemic and agriculture: Short- and long-run implications for international trade relations. Can. J. Agric. Econ.-Rev. Can. Agroecon. 2020, 68, 225–229. [Google Scholar] [CrossRef]
  6. Viliamu, I.; Morgan, W.; Gordon, M.H.; David, U.; Diana, H.S. Impacts of COVID-19 on agriculture and food systems in Pacific Island countries (PICs): Evidence from communities in Fiji and Solomon. Agric. Syst. 2021, 190, 103099. [Google Scholar] [CrossRef]
  7. Davila, F.; Crimp, S.; Wilkey, B. A systemic assessment of COVID-19 impacts on pacific islands’ food systems. Hum. Ecol. Rev. 2020, 26, 5–17. [Google Scholar] [CrossRef]
  8. Ruth, R. Bending the arc of COVID-19 through a principled food systems approach. Agric. Human Values 2020, 37, 653–654. [Google Scholar] [CrossRef]
  9. McEwan, K.; Marchand, L.; Shang, M.; Bucknell, D. Potential implications of COVID-19 on the Canadian pork industry. Can. J. Agric. Econ. 2020, 68, 201–206. [Google Scholar] [CrossRef] [Green Version]
  10. Kumar, A.; Mangla, S.K.; Kumar, P.; Song, M. Mitigate risks in perishable food supply chains: Learning from COVID-19. Technol. Forecast. Soc. Chang. 2021, 166, 120643. [Google Scholar] [CrossRef]
  11. Huang, J.K. Impacts of COVID-19 on agriculture and rural poverty in China. J. Integr. Agric. 2020, 19, 2849–2853. [Google Scholar] [CrossRef]
  12. Xie, Y.; Sarkar, A.; Hossain, M.S.; Hasan, A.K.; Xia, X. Determinants of Farmers’ Confidence in Agricultural Production Recovery during the Early Phases of the COVID-19 Pandemic in China. Agriculture 2021, 11, 1075. [Google Scholar] [CrossRef]
  13. Komarek, A.M.; Pinto, A.D.; Smith, V.H. A Review of Types of Risks in Agriculture: What we Know and What we Need to Know. Agric. Syst. 2020, 178, 102738. [Google Scholar] [CrossRef]
  14. Zhang, Y.; Khan, S.A.R. Evolutionary game analysis of green agricultural product supply chain financing system: COVID-19 pandemic. Int. J. Logist. Res. Appl. 2021, in press. [Google Scholar] [CrossRef]
  15. Dercon, S. Growth and shocks: Evidence from rural Ethiopia. J. Dev. Econ. 2004, 74, 309–329. [Google Scholar] [CrossRef]
  16. Boucher, S.; Carter, M.; Guirkinger, C. Risk rationing and wealth effects in credit markets: Theory and implications for agricultural development. Am. J. Agric. Econ. 2008, 90, 409–423. [Google Scholar] [CrossRef]
  17. Miranda, M.; Gonzalez-Vega, C. Systemic risk, index insurance, and optimal management of agricultural loan portfolios in developing countries. Am. J. Agric. Econ. 2011, 93, 399–406. [Google Scholar] [CrossRef]
  18. Collier, B.L. “Financial Inclusion and Natural Disasters.” PhD Dissertation, University of Kentucky. Outstanding Doctoral Dissertation. Am. J. Agric. Econ. 2015, 97, 656–657. [Google Scholar] [CrossRef]
  19. Bauchet, J.; Mahul, O. Weather index insurance for agriculture and rural areas in lower income countries. Am. J. Agric. Econ. 2007, 89, 1241–1247. [Google Scholar] [CrossRef]
  20. Kifayat, U.; Abdul, Q.M.; Abdul, S.; Saranjam, B. Financial Inclusion, Socioeconomic Disaster Risks and Sustainable Mountain Development: Empirical Evidence from the Karakoram Valleys of Pakistan. Sustainability 2020, 12, 9737. [Google Scholar] [CrossRef]
  21. Babenko, V.; Zomchak, L.; Nehrey, M.; Salem, A.B.M.; Nakisko, O. Agritech Startup Ecosystem in Ukraine: Ideas and Realization. In Digital Transformation Technology. Lecture Notes in Networks and Systems; Magdi, D.A., Helmy, Y.K., Mamdouh, M., Joshi, A., Eds.; Springer: Singapore, 2022; p. 224. [Google Scholar] [CrossRef]
  22. Babenko, V.O. Modeling of factors influencing innovation activities of agricultural enterprises of Ukraine. Sci. Bull. Polissia 2017, 1, 115–121. [Google Scholar] [CrossRef]
  23. Lezoche, M.; Hernandez, J.E.; Alemany, D.; Maria, E.; Panetto, H.; Kacprzyk, J. Agri-food 4.0: A survey of the supply chains and technologies for the future agriculture. Comput. Ind. 2020, 117, 103187. [Google Scholar] [CrossRef]
  24. World Bank Report. ICT for Greater Development Impact: World Bank Group Strategy for Information and Communication Technology; World Bank: Washington, DC, USA, 2012; Available online: https://openknowledge.worldbank.org/bitstream/handle/10986/27411/%20715400WP0WBG0I0sclosed0July02502012.pdf?sequence=1&isAllowed%20=%20y (accessed on 25 July 2012).
  25. Bruhn, M.; Love, I. The Real Impact of Improved Access to Finance: Evidence from Mexico. J. Financ. 2014, 69, 1347–1376. [Google Scholar] [CrossRef]
  26. Agwu, M.E. Can technology bridge the gap between rural development and financial inclusions? Technol. Anal. Strateg. Manag. 2021, 33, 123–133. [Google Scholar] [CrossRef]
  27. Turvey, C.G.; Xiong, X.P. Financial inclusion, financial education and e-commerce in rural China. Agribusiness 2017, 33, 279–285. [Google Scholar] [CrossRef]
  28. Liu, M.; Zhang, Q.; Gao, S.; Huang, J.K. The spatial aggregation of rural e-commerce in China: An empirical investigation into Taobao Villages. J. Rural Stud. 2020, 80, 403–417. [Google Scholar] [CrossRef]
  29. Tsolakis, N.K.; Keramydas, C.A.; Toka, A.K.; Aidonis, D.A.; Iakovou, E.T. Agrifood Supply Chain Management: A Comprehensive Hierarchical Decision making Framework and a Critical Taxonomy. Biosyst. Eng. 2014, 120, 47–64. [Google Scholar] [CrossRef]
  30. Khandelwal, C.; Singhal, M.; Gaurav, G.; Dangayach, G.S.; Meena, M.L. Agriculture Supply Chain Management: A Review (2010–2020). Mater. Today Proc. 2021, 47, 3144–3153. [Google Scholar] [CrossRef]
  31. Yazdani, M.; Gonzalez, E.D.; Chatterjee, P. A multi-criteria decision-making framework for agriculture supply chain risk management under a circular economy context. Manag. Decis. 2019, 59, 1801–1826. [Google Scholar] [CrossRef]
  32. Glowacz, M.; Rees, D. Using jasmonates and salicylates to reduce losses within the fruit supply chain. Eur. Food Res. Technol. 2016, 242, 143–156. [Google Scholar] [CrossRef]
  33. Zirham, M.; Palomba, R. Female Agriculture in the Short Food Supply Chain: A New Path towards the Sustainability Empowerment. Agric. Agric. Sci. Procedia 2016, 8, 372–377. [Google Scholar] [CrossRef] [Green Version]
  34. Haley, E.; Caxaj, S.; George, G.; Hennebry, J.; Martell, E.; McLaughlin, J. Migrant Farmworkers Face Heightened Vulnerabilities During COVID-19. J. Agric. Food Syst. Community Dev. 2020, 9, 35–39. [Google Scholar] [CrossRef]
  35. Hobbs, J.E. Food Supply Chains During the COVID-19 Pandemic. Can. J. Agric. Econ. 2020, 68, 171–176. [Google Scholar] [CrossRef] [Green Version]
  36. de Paulo, F.D.; dos Santos, G.; Mayara, G. COVID-19 Outbreak: What Should be Done to Avoid Food Shortages? Trends Food Sci. Technol. 2020, 102, 291–292. [Google Scholar] [CrossRef] [PubMed]
  37. International Monetary Fund (IMF). Policy Responses to COVID-19. 2020. Available online: https://www.imf.org/en/Topics/imf-and-covid19/Policy-Responses-to-COVID-19#I (accessed on 30 July 2021).
  38. Stephens, E.C.; Martin, G.; van Wijk, M.; Timsina, J.; Snow, V. Impacts of COVID-19 on Agricultural and Food Systems Worldwide and on Progress to the Sustainable Development Goals. Agric. Syst. 2020, 183, 102873. [Google Scholar] [CrossRef] [PubMed]
  39. Hailu, G. Economic Thoughts on COVID-19 for Canadian Food Processors. Can. J. Agric. Econ. 2020, 68, 163–169. [Google Scholar] [CrossRef]
  40. Xu, D.; Long, Y. The Role of Supply Chain Integration in the Transformation of Food Manufacturers: A Case Study from China. Int. J. Logist. Res. Appl. 2021, 24, 198–212. [Google Scholar] [CrossRef]
  41. Isakson, S.R. Food and finance: The financial transformation of agro-food supply chains. J. Peasant Stud. 2014, 41, 749–775. [Google Scholar] [CrossRef]
  42. Magnan, A. New avenues of farm corporatization in the prairie grains sector: Farm family entrepreneurs and the case of One Earth Farms. Agric. Hum. Values 2011, 29, 161–175. [Google Scholar] [CrossRef]
  43. Burch, D.; Lawrence, G. Financialization in agri-food supply chains: Private equity and the transformation of the retail sector. Agric. Hum. Values 2013, 30, 247–258. [Google Scholar] [CrossRef]
  44. Ghosh, J. The unnatural coupling: Food and global finance. J. Agrar. Chang. 2010, 10, 72–86. [Google Scholar] [CrossRef]
  45. Burch, D.; Lawrence, G. Towards a third food regime: Behind the transformation. Agric. Hum. Value 2009, 26, 267–279. [Google Scholar] [CrossRef]
  46. Fairbairn, M. “Like gold with yield”: Evolving intersections between farmland and finance. J. Peasant Stud. 2014, 41, 777–795. [Google Scholar] [CrossRef] [Green Version]
  47. Qi, J.; Zheng, X.; Guo, H. The formation of Taobao villages in China. China Econ. Rev. 2019, 53, 106–127. [Google Scholar] [CrossRef]
  48. Tang, W.C.; Zhu, J. Informality and rural industry: Rethinking the impacts of E-commerce on rural development in China. J. Rural Stud. 2020, 75, 20–29. [Google Scholar] [CrossRef]
  49. Ma, W.L.; Zhou, X.S.; Liu, M. What drives farmer’s willingness to adopt e-commerce in rural China? The role of Internet use. Agribusiness 2020, 36, 159–163. [Google Scholar] [CrossRef]
  50. Chai, S.J.; Chen, Y.; Huang, B.H.; Ye, D.Z. Social networks and informal finance inclusion in China. Asia Pac. J. Manag. 2019, 36, 529–563. [Google Scholar] [CrossRef]
  51. Liu, T.; He, G.W.; Turvey, G.C. Inclusive Finance, Farm Households Entrepreneurship, and Inclusive Rural Transformation in Rural Poverty-stricken Areas in China. Emerg. Mark. Financ. Trade 2021, 57, 1929–1958. [Google Scholar] [CrossRef]
  52. Goedecke, J.; Guérin, I.; D’Espallier, B.; Venkatasubramanian, G. Why do financial inclusion policies fail in mobilizing savings from the poor? Lessons from rural south India. Dev. Policy Rev. 2016, 36, 201–219. [Google Scholar] [CrossRef] [Green Version]
  53. Cnaan, R.A.; Moodithaya, M.S.; Handy, F. Financial Inclusion: Lessons from Rural South India. J. Soc. Policy 2012, 41, 183–205. [Google Scholar] [CrossRef] [Green Version]
  54. Wang, X.; He, G.W. Digital Financial Inclusion and Farmers’ Vulnerability to Poverty: Evidence from Rural China. Sustainability 2020, 12, 1668. [Google Scholar] [CrossRef] [Green Version]
  55. Di Vaio, A.; Boccia, F.; Landriani, L.; Palladino, R. Artificial Intelligence in the Agri-Food System: Rethinking Sustainable Business Models in the COVID-19 Scenario. Sustainability 2020, 12, 4851. [Google Scholar] [CrossRef]
  56. Apostolopoulos, N.; Ratten, V.; Petropoulos, D.; Liargovas, P.; Anastasopoulou, E. Agri-food sector and entrepreneurship during the COVID-19 crisis: A systematic literature review and research agenda. Strateg. Chang. 2021, 30, 159–167. [Google Scholar] [CrossRef]
  57. Alibaba Group. Alibaba Corporate Social Responsibility Report 2020–2021. Available online: http://www.alijijinhui.org/Uploads/file/20210804/6109ad3032390.pdf (accessed on 4 August 2021).
  58. People’s Bank of China (PBOC). China Inclusive Finance Indicators Analysis Report. 2020. Available online: http://www.pbc.gov.cn/goutongjiaoliu/113456/113469/4335821/2021090816343161697.pdf (accessed on 8 September 2021).
  59. Baldwin, R.E.; Taglioni, D. Gravity Chains: Estimating bilateral trade flows when parts and components trade is important. J. Bank. Financ. Econ. 2014, 2, 61. [Google Scholar] [CrossRef] [Green Version]
  60. Kohl, T. The Belt and Road Initiative’s effect on supply-chain trade: Evidence from structural gravity equations. Camb. J. Reg. Econ. Soc. 2019, 12, 77–104. [Google Scholar] [CrossRef] [Green Version]
  61. Anderson, J.E.; Wincoop, E.V. Gravity with Gravitas: A Solution to the Border Puzzle. Am. Econ. Rev. 2003, 93, 170–192. [Google Scholar] [CrossRef] [Green Version]
  62. Bergstrand, J.H.; Egger, P.; Larch, M. Gravity Redux: Estimation of Gravity-equation Coefficients, Elasticties of Substitution and General Equilibrium Comparative statics under asymmertric bilateral trade costs. J. Int. Econ. 2013, 89, 110–121. [Google Scholar] [CrossRef]
  63. Novy, D. Internation trade without CES: Estimating translog gravity. J. Int. Econ. 2013, 89, 271–282. [Google Scholar] [CrossRef] [Green Version]
  64. Chaney, T. Distorted gravity: The intensive and extensive margins of international trade. Am. Econ. Rev. 2008, 98, 1707–1721. [Google Scholar] [CrossRef] [Green Version]
  65. Silva, J.M.C.S.; Tenreyro, S. Further simulation evidence on the performance of the Poisson pseudo-maximum likelihood estimator. Econ. Lett. 2011, 112, 220–222. [Google Scholar] [CrossRef] [Green Version]
  66. Chaney, T. The network structure of international trade. Am. Econ. Rev. 2014, 104, 3600–3634. [Google Scholar] [CrossRef] [Green Version]
  67. Chaney, T. The Gravity Equation in international trade: An explanation. J. Political Econ. 2018, 126, 150–177. [Google Scholar] [CrossRef] [Green Version]
  68. Helpman, E.; Melitz, M.; Rubinstein, Y. Estimating Trade Flows: Trading Partners and Trading Volumes. Q. J. Econ. 2013, 123, 441–487. [Google Scholar] [CrossRef] [Green Version]
  69. Martínez-Zarzoso, I. The Log of Gravity Revisited. Appl. Econ. 2013, 45, 311–327. [Google Scholar] [CrossRef] [Green Version]
  70. Sergio, C.; Guimarães, P.; Tom, Z. Fast Poisson estimation with high-dimensional fixed effects. Stata J. 2020, 20, 95–115. [Google Scholar] [CrossRef]
  71. Chen, J.; Chen, W.; Liu, E.; Luo, J.; Song, Z.M. The Economic Impact of COVID-19 in China: Evidence from City-to-City Truck Flows. 2020, Working Paper. Available online: https://scholar.princeton.edu/sites/default/files/ernestliu/files/covid_truckflow_0.pdf (accessed on 14 December 2020).
  72. Guo, F.; Kong, S.T.; Wang, J.Y. General patterns and regional disparity of internet finance development in China: Evidence from the Peking University Internet Finance Development Index. China Econ. J. 2016, 9, 253–271. [Google Scholar] [CrossRef]
  73. Guo, F.; Wang, J.Y.; Wang, F.; Kong, S.T.; Zhang, X.; Cheng, Z.Y. Measuring China’s Digital Financial Inclusion: Index Compilation and Spatial Characteristics. China Econ. Q. 2020, 19, 1401–1418. (In Chinese) [Google Scholar] [CrossRef]
  74. Liu, Y.; Liu, C.; Zhou, M. Does digital inclusive finance promote agricultural production for rural households in China? Research based on the Chinese family database (CFD). China Agric. Econ. Rev. 2021, 13, 475–494. [Google Scholar] [CrossRef]
Figure 1. Mechanisms of the protective effect of digital finance inclusion on ASC.
Jtaer 16 00174 g001
Figure 2. The truck flow of agriculture products during the COVID-19 pandemic (Unit: amount of truck).
Jtaer 16 00174 g002
Figure 3. Prefecture-level PKU-IFDI and GDP in 2018.
Jtaer 16 00174 g003
Figure 4. Prefecture-level PKU-IFDI in 2018.
Jtaer 16 00174 g004
Figure 5. Average usage level of rural mutual insurance and rural cooperative finance in 2018 (Data source: Ministry of Agriculture and Rural Affairs of China. China Agricultural Management Statistical Annual Report (2018). Beijing, P. R. China http://zdscxx.moa.gov.cn:8080/nyb/pc/messageList.jsp (accessed on 10 October 2020)).
Jtaer 16 00174 g005
Figure 6. Average market-oriented development level of rural products and factors in 2018 (Data source: Ministry of Agriculture and Rural Affairs of China. China Agricultural Management Statistical Annual Report (2018). Beijing, P. R. China http://zdscxx.moa.gov.cn:8080/nyb/pc/messageList.jsp (accessed on 10 October 2020)).
Jtaer 16 00174 g006
Table 1. Variables’ definitions and descriptive statistics.
VariableDefinitionObsMeanStd. Dev.
Tradei,jAgricultural products logistics data between region i and region j definited by Section 3.3.110,300137.94129.98
Aggregatei,jAggregate index from PKU-IFDI and calculated according to Equation (4)10,554256.8317.09
Widthi,jDigital financial inclusion widening sub-index from PKU-IFDI and calculated according to Equation (4)10,554248.0320.05
Depthi,jDigital financial inclusion deepening sub-index from PKU-IFDI and calculated according to Equation (4)10,554254.9218.06
Digitalizationi,jFinancial services digitization sub-index from PKU-IFDI and calculated according to Equation (4)10,554289.4010.87
Distancei,jGeographical distance between region i and region j (Unit: km)10,3001170.35605.44
Easti,j1 = Origin or destination in the Eastern Province, 0 = others10,6820.600.49
Note: Std. Dev., standard deviation.
Table 2. The correlation coefficients between variables.
VariableTradeAggregateWidthDepthDigitalizationDistanceEast
Trade1.0000
Aggregate0.42971.0000
Width0.49030.97301.0000
Depth0.64700.93020.82431.0000
Digitalization−0.05500.87770.77370.90131.0000
Distance−0.19160.00800.0367−0.0392−0.02821.0000
East0.02310.0379−0.02900.12710.1553−0.04201.0000
Table 3. Results of Log-Log regression model with fixed effects (LL-FE).
Dependent Variable: lnTradei,jModel-1Model-2Model-3Model-4Model-5
lnAggregatei,j0.8404 **
(2.23)
lnWidthi,j 0.6967 ** 0.5398 ***
(2.25) (3.66)
lnDepthi,j 0.7321 ** 2.513 ***
(2.20) (3.27)
lnDigitalizationi,j 0.1490−4.8552
(0.24)(−1.13)
lnDistancei,j−0.5702 ***−0.5698 ***−0.5704 ***−0.5683 ***0.5698 ***
(−38.28)(−38.28)(−38.28)(−38.14)(−38.26)
Constant3.9632 *4.7821 ***4.5706 **7.7687 **19.0293 ***
(1.90)(2.80)(2.49)(2.18)(4.24)
Regioni Fixed effectyesyesyesyesyes
Regionj Fixed effectyesyesyesyesyes
Adj R-squared0.49880.49880.49880.49860.4994
F-value732.74 ***732.79 ***732.68 ***729.93 ***370.29 ***
obs10,29510,29510,29510,29510,295
Note: t-values appear in parentheses; *, **, and *** indicate significance at the 10%, 5%, and 1% levels, respectively.
Table 4. Results of Poisson pseudo-maximum likelihood with fixed effects (PPML-FE).
Dependent Variable: Tradei,jModel-6Elasticity Calculated by Model-6 1Model-7Model-8Model-9Model-10
Aggregatei,j0.0063 *1.6311
(1.95)
Widthi,j 0.0049 * 0.0002 **
(1.72) (2.11)
Depthi,j 0.0065 *** 0.0170 ***
(2.68) (2.88)
Digitalizationi,j 0.0045−0.0183
(1.17)(0.05)
Distancei,j−0.0005 ***−0.6159−0.0005 ***−0.0005 ***−0.0006 ***−0.0005 ***
(−21.61) (−21.53)(−21.70)(−21.23)(−21.91)
Constant3.9773 *** 4.3923 ***3.9442 ***4.3087 ***6.5240 ***
(4.77) (5.86)(6.36)(3.89)(4.61)
Regioni Fixed effectyes yesyesyesyes
Regionj Fixed effectyes yesyesyesyes
Pseudo R-squared0.4287 0.42860.42890.42830.4295
Wald test471.82 *** 468.81 ***480.69 ***450.79 ***513.82 ***
obs10,611 10,61110,61110,61110,611
Note: z-values appear in parentheses; *, **, and *** indicate significance at the 10%, 5%, and 1% levels, respectively. 1 Considering the brevity of the article, we will report only one elasticity as an example.
Table 5. Results of regional heterogeneity estimated by the LL-FE model.
Dependent Variable: lnTradei,jModel-11Model-12Model-13Model-14Model-15
East = 1
Model-16
East = 0
lnAggregatei,j2.1601 ***
(4.78)
lnWidthi,j 1.1404 ***
(2.98)
lnDepthi,j 1.9708 **
(5.51)
lnDigitalizationi,j 3.2856 ***2.3340 ***−0.6922
(4.34)(3.09)(−0.49)
east10.7849 ***3.0403 *16.2590 ***29.1555 ***
(5.14)(1.82)(9.32)(7.33)
east*lnindexi,j−1.9345 ***−0.3026 *−2.9329 ***−1.1433 ***
(−5.13)(−1.80)(−9.31)(−7.33)
lnDistancei,j−0.5755 ***−0.5752 ***−0.5623 ***−0.5752 ***−0.6140 ***−0.5871 ***
(−37.90)(−37.83)(−36.99)(−37.92)(−24.92)(−20.72)
Constant−3.35302.3443−2.3407−9.9495 **22.2242 ***12.5714
(−1.34)(1.11)(1.18)(−2.32)(5.19)(1.57)
Regioni Fixed effectyesyesyesyesyesyes
Regionj Fixed effectyesyesyesyesyesyes
Adj R-squared0.50010.49900.50310.50120.51370.5700
F-value374.34 ***367.71 ***391.63 ***380.58 ***320.90 ***249.90 ***
obs10,29510,29510,29510,29564043891
Note: t-values appear in parentheses; *, **, and *** indicate significance at the 10%, 5%, and 1% levels, respectively.
Table 6. Results of regional heterogeneity estimated by the PPLM-FE model.
Dependent Variable: Tradei,jModel-16Model-17Model-18Model-19Model-20
East = 1
Model-21
East = 0
Aggregatei,j0.0072 *
(1.72)
Widthi,j 0.0040
(0.98)
Depthi,j 0.0083 ***
(3.04)
Digitalizationi,j 0.0074 *0.0078 **−0.2993
(1.75)(2.04)(−0.81)
east0.5585−0.21071.3161 **2.1438 *
(0.82)(−0.36)(2.43)(1.90)
east*indexi,j−0.00250.0003−0.0056 ***−0.0039 **
(−0.99)(0.16)(−2.66)(−2.00)
Distancei,j−0.0005 ***−0.0005 ***−0.0005 ***−0.0005 ***−0.0008 ***−0.0006 ***
(−21.35)(−21.22)(−21.14)(−20.93)(−24.92)(−8.88)
Constant−3.828 ***4.6743 ***−3.5828 ***3.5297 ***8.1093 ***4.1406 **
(−3.57)(4.59)(5.18)(2.87)(7.28)(1.98)
Regioni Fixed effectyesyesyesyesyesyes
Regionj Fixed effectyesyesyesyesyesyes
Pseudo R-squared0.42960.42940.43040.42960.47890.4857
Wald test477.29 ***468.08 ***510.20 ***457.60 ***372.39 ***80.45 ***
obs10,61110,61110,61110,61166264349
Note: z-values appear in parentheses; *, **, and *** indicate significance at the 10%, 5%, and 1% levels, respectively.
Publisher’s Note: MDPI stays neutral with regard to jurisdictional claims in published maps and institutional affiliations.

