Article

Evaluating the Diversity of Ecotypes of Red Clover (Trifolium pratense L.) from Northwestern Spain by Phenotypic Traits and Microsatellites

by
Cristina Isabel Fernández-Otero
1,
Ana María Ramos-Cabrer
2,*,
Julio Enrique López-Díaz
1 and
Santiago Pereira-Lorenzo
2
1
Department of Crop Production, Centro de Investigaciones Agrarias de Mabegondo, AGACAL, 15080 La Coruña, Spain
2
Department of Crop Production and Engineering Projects, Universidade de Santiago de Compostela, Campus de Lugo, 27002 Lugo, Spain
*
Author to whom correspondence should be addressed.
Agronomy 2021, 11(11), 2275; https://doi.org/10.3390/agronomy11112275
Submission received: 7 October 2021 / Revised: 4 November 2021 / Accepted: 9 November 2021 / Published: 10 November 2021

Abstract

:
For more than 50 years, the CIAM-AGACAL (Agricultural Research Centre of Mabegondo, Xunta de Galicia, A Coruña, Spain) has been carrying out the important task of conserving the phytogenetic resources of ecotypes and natural populations of grassland species from northwestern Spain. The CIAM-AGACAL’s germplasm bank has 57 populations of red clover (Trifolium pratense Lam.), one of the most cultivated forage legumes in the world. The goal of the present study was to evaluate the diversity among cultivars and natural clover populations at morphological and molecular level. Twelve polymorphic SSR loci revealed 241 microsatellite alleles with an average of 20.08 alleles per locus. Two main groups were detected by the Structure software, one of them including local populations and the second clustering cultivars and related populations. Intra-specific variability was found among cultivars and natural populations. A moderate genetic differentiation of Spanish red clover cultivars was observed (Fst = 0.08) between the two main clusters. Finally, a certain relationship between phenotypic and genotypic variation was detected.

1. Introduction

Red clover (Trifolium pratense Lam.) is native to southeastern Europe, appears spontaneously in almost all the Iberian Peninsula and is cultivated as a forage species, firstly in northern Europe and later worldwide as one of the most used mowing legumes in temperate climates [1]. Galicia (northwestern Spain) is a region where the agrifarming industry is an important pillar in the economy, production and transformation of local products. In Galicia, the main use of red clover is by mowing and it can be supplied green or preserved as silage or hay. It can also be grazed even though trampling by cattle can damage the crown and affect its persistence. Hence, there is interest in characterizing the natural populations of clovers preserved in the germplasm bank of CIAM for their possible use for the creation of commercial varieties with a native genetic base that is better adapted to Galician edaphoclimatic conditions.
The germplasm bank of prairie grasses of the CIAM-AGACAL (Agricultural Research Centre of Mabegondo, Xunta de Galicia) preserves a unique reference collection of prairie species cultivated mainly in the northwest of the Iberian Peninsula; a summary of these works of collection, multiplication and characterization can be found in López et al. [2]. This collection has been expanded with various surveys in recent years with accessions of this species; today a total of 57 natural populations of red clover are preserved, half of which come from Galicia, but most are not evaluated. An ecotype from this germplasm bank, a local cultivar, is already registered as “Maragato” (Registration number 191500112), but not commercialized yet. Local ecotypes can be used to obtain cultivars that are better adapted to specific climatic conditions, and are more resilient to a changing environment.
To date, great efforts have been made in the collection, multiplication and characterization of germplasm collections for the possible supply of seeds to develop new varieties providing ecotypes adapted to our soil and climatic conditions. There is currently a need to promote its use to obtain varieties for low-input agriculture, reducing production costs and in line with what the market demands, and at the same time improving the possibilities for crop diversification (greening) to encourage good environmental practices in crop production, as well as the maintenance of areas that are beneficial for mitigating climate change and for the benefit of the environment (https://ec.europa.eu/info/food-farming-fisheries/key-policies/common-agricultural-policy/income-support/greening_en, accessed on 16 April 2019).
The aim of this study project was to evaluate the phenotypic and molecular diversity of ecotypes of red clover from CIAM-AGACAL, which can play an important role in the development of commercial varieties with an autochthonous genetic basis and for the improvement of sustainable agricultural systems according to the challenges of the Common Agricultural Policy (CAP) and to contribute to the mitigation of climate change.

2. Material and Methods

Thirteen local populations (1803, 1804, 1805, 1806, 1807, 1808, 1809, 1811, 1847, 2751, 2752, 2760, 2762) and four commercial cultivars (“Karim”, “Suez”, “Maragato”, “Marino”) were included in the study (Table 1). Twenty seedlings for each ecotype and ten for a commercial cultivar were evaluated independently by sampling their leaves. A total of 300 plant DNA samples were tested.

2.1. Phenotypic Traits

A test field was established at Centro de Investigacións Agrarias de Mabegondo (CIAM, Xunta de Galicia) in Mabegondo, A Coruña in northwestern Spain. The initial preparation of the ground consisted of typical tasks of ploughing, milling and the installation of anti-grass mesh and with no compost or soil with any type of fertilizer or liming added. In the month of July 2018, the populations (13) and commercial varieties (4) were sown in Alveoli trays in a greenhouse. In September the plants were transplanted to a test field in plots of 40 × 40 cm with a design of random complete blocks with four repetitions (Figure 1).
For characterization, the recommendations of the International Board for Plant Genetic Resources [3] and the International Union for the Protection of New Varieties of Plants [4] were followed. For each population and commercial cultivar, the following descriptors were evaluated: FLO: number of days from 1 January 2019, when three heads per plant were flowering per plot; CRE: Growth in flowering, on a visual scale from 1 to 9, 1 being a little and 9 much (after taking the annotation of flowering date); CRF: Growth in the year of sowing, on a visual scale from 1 to 9, 1 being a little and 9 much (in the year of sowing, at the end of winter); HAB: Growth habit in early spring before flowering, on a visual scale from 1 to 9, with 1 = prostrate to 9 = erect; ENF: Tolerance to pests and diseases on a visual scale from 1 to 9, with 1 = sensitive to 9 = resistant. Additionally, altitude (ALTIT) was recorded for the origin of the samples (Table 1).
For statistical analyses, a fixed-effects ANOVA was performed for each variable according to the following model Xmjk = μ + Cm + Rj + (CR) mj + mjk; where Xi(m)jk is the observation of the cultivar i (i = 1 to 17) in the repetition j (j = 1, 2, 3, 4) and the sample k (k = 1 to 30); μ is the mean of all the observations; Cm, Rj, (CR) mj and mjk are the effects of the cultivar m, the repetition j, the interaction cultivar repetition, and the error associated to the sample k in the observation mjk, respectively.

2.2. Microsatellites

DNA extraction was carried out using 0.5–0.75 g of young leaves and using the “E.Z.N.A.®Plant DNA Kit” (OMEGA Bio-Tek Inc., Norcross, GA, USA) and “DNeasy® Plant Mini Kit” (Qiagen, Hilden, Germany). Genomic DNA was quantified by NanodropTM ND-1000 Spectrophotometer (Thermo Scientific, Wilmington, DE, USA) and diluted to 20 ng/μL.
Fourteen SSRs were selected from previous studies [5,6,7,8] for these analyses (Table S1). The fourteen SSRs, were amplified in three multiplexed PCR using one of the FAM, NED, PET, VIC fluorophore-labelled primers (PE Applied Biosystems, Warrington, UK).
The amplification conditions were 94 °C for 5 min, followed by 35 cycles at 95 °C for 30 s, annealing at a specific temperature depending on the multiplex set, for 90 s, and 1 min at 72 °C, and final extension at 60 °C for 30 min.
Amplification products were diluted with water, and 2 µL of the diluted amplification product was added to 0.12 µL of 600LIZ size standard (Applied Biosystems, Foster City, CA, USA) and 9.88 µL of formamide. The allele sizes were detected using Peak Scanner TM software (Applied Biosystems).
A Bayesian analysis was performed with the Structure software [9,10] by using the admixture model with unlinked loci and correlated allele frequencies, as defined in Pereira-Lorenzo et al. [11] and Porras-Hurtado et al. [12], recommending a minimum of 20 iterations (30 in this study) to estimate the ancestry membership proportions of a population. We computed K = 1 to 15 unknown reconstructed panmictic populations (RPPs) of genotypes, with the options use popinfo = 0, popflag = 0, which considers that the sampled genotypes were of unidentified origin, assigning them probabilistically to RPPs based on a qI (probability of membership) of 80%, while a lower probability meant an admixed genotype. The second order change of the likelihood function, divided by the SD of the likelihood (ΔK), was also estimated to find the best K value supported by the data [13] by using Structure Harvester [14]. The inbreeding coefficient (Fis) [15] was calculated in the program GenoDive [16].
Similarity relationships among the samples were studied using multivariate analysis techniques. For each ecotype (20 samples) and commercial cv. (10 samples) the frequency of each allele was assigned to a variable, with values 1, and 0 for presence and absence of the allele, respectively. Principal components (PCs) were estimated on the variance–covariance matrix of the allele frequencies [17,18,19] using SPSS V.22.

3. Results

3.1. Phenotypic Variation

Genetic variation was as follows (average and range): FLO, 132.5 days from 1 January (94.0–148.2); CRE, 4.4 of growth in flowering after taking the annotation of flowering date (3.1–6.2); CRF, 5.9 of growth (visual scale from 1 to 9) at the end of winter in the year of sowing (3.6–8.2); HAB, 5.8 of growth habit (visual scale from 1 to 9) in early spring before flowering erect (3.4–8.2); ENF, 6.3 of tolerance (visual scale from 1 to 9) to pests and diseases (4.7–8.1) (Table 1).

3.2. Diversity by SSRs

All SSRs used were polymorphic and 273 alleles were detected, RCS0031 being the most polymorphic with 57 alleles and RCS0685 the lowest with 5 alleles, out of these 198 were rare (p < 0.05), 72.5%. The average number of alleles per locus was 20 (Table S2). We counted 61 genotypes (20%) with three alleles (triploids), 50 with four alleles (17%, tetraploids), whereas the remaining 189 were diploids (63%).

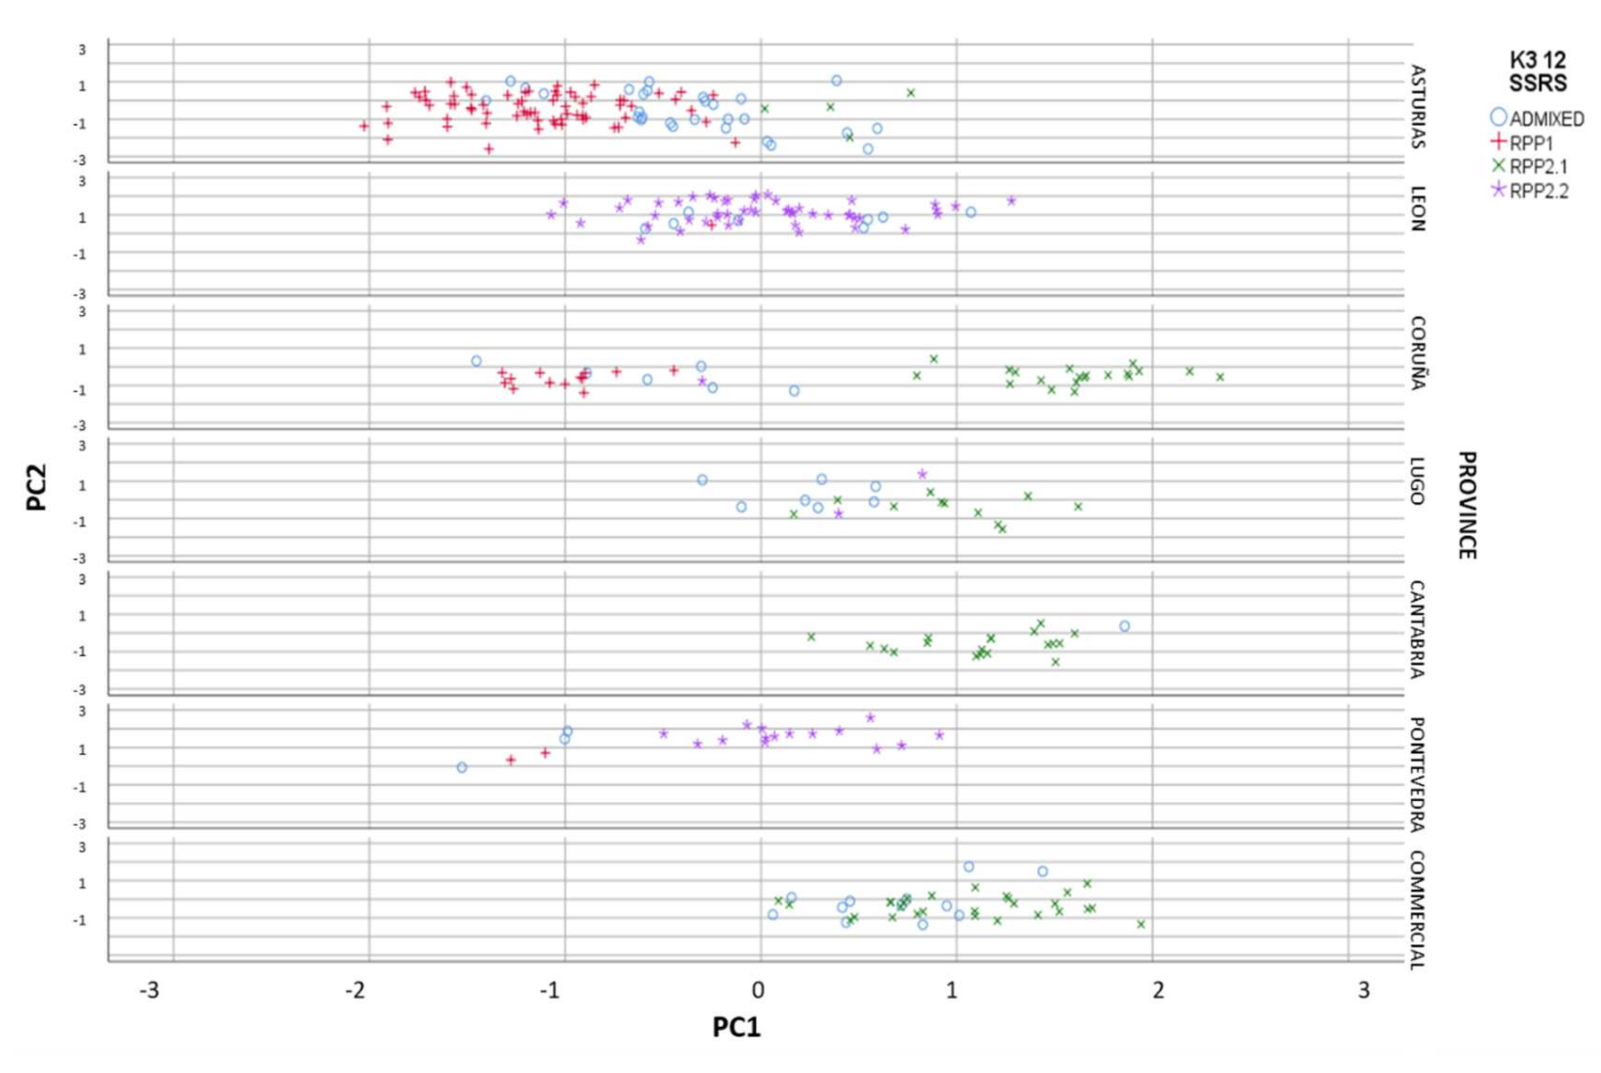
3.2.1. Genetic and Geographic Structure

A Bayesian analysis using the Structure software [9] was conducted using 12 SSRs to determine the genetic structure among 300 unique genotypes. Two loci harbouring null alleles were not included in this analysis. The ΔK criterion values increased until K = 2 (Figure S1) estimated by using Structure Harvester [14] in a group of 231 genotypes out of 300, with a qI > 80% (77% of all genotypes). This corresponded to a strong differentiation in two main groups of genotypes (RPP, reconstructed populations), one with 91 genotypes (RPP1, 31.33% of the total number of genotypes) including only natural populations (2762, 1806, 1803, 1808, 1809 and 1811) and a second one with 140 genotypes (RPP2, 46.67% of the total number of genotypes) including commercial cvs. and natural populations (Table S3). Number of alleles were 152 and 199 for RPP1 and RPP2, of which 98 and 134 were rare (p < 0.05), respectively.
The second highest value was obtained for K = 3, with 235 genotypes out of 300, with a qI > 80% (78.33% of all genotypes). When K = 3, two groups were distinguished in RPP2, RPP2.1 including 82 genotypes and RPP2.2 with 69. The four commercial cultivars and the natural population 2752 were clustered in RPP2.1. In RPP2.2 were clustered 1804, 1805, 1807 and 2760.

3.2.2. Intra-Specific Variability

Intra-specific variability was found among cultivars and natural populations. Two out of the four commercial cultivars were fully grouped in RPP2 when K2, “Karim” and “Suez”. “Marino” and “Maragato” clustered one and two accessions as admixed. Accessions of the natural populations 1847 and 2752 were fully grouped in RPP2. All the other natural populations presented accessions classified as admixed less 1809. Moreover, natural populations 2760, 1807 and 1804 mainly classified in RPP2, showed 3, 1 and 1 accessions classified in RPP1, respectively; and 1803 and 1809 clustered in RPP1 had 2 and 1 accessions in RPP2, respectively.
When K3, the four commercial cvs. classified as RPP2.1, with some accessions classified as admixed in all of them. Accessions of the natural populations 1847 and 2752 were fully grouped in RPP2.1 less one accessions from 2752 now classified as admixed. Natural populations classified in RPP2, 2760, 1807 classified in RPP2.2, again showed accessions classified in RPP1, respectively; but not now 1804.
Fst was 0.086 (p < 0.001) when K = 2. When K = 3, Fst was 0.107 (p < 0.001) between RPP1 and RPP2.1, and 0.076 with RPP2.2 (p < 0.001). Fst between RPP2.1 and RPP2.2 was 0.057 (p < 0.001). Values of Fst among RPPs with admixed varied from 0.021 to 0.031 (p < 0.001) (Table S4).

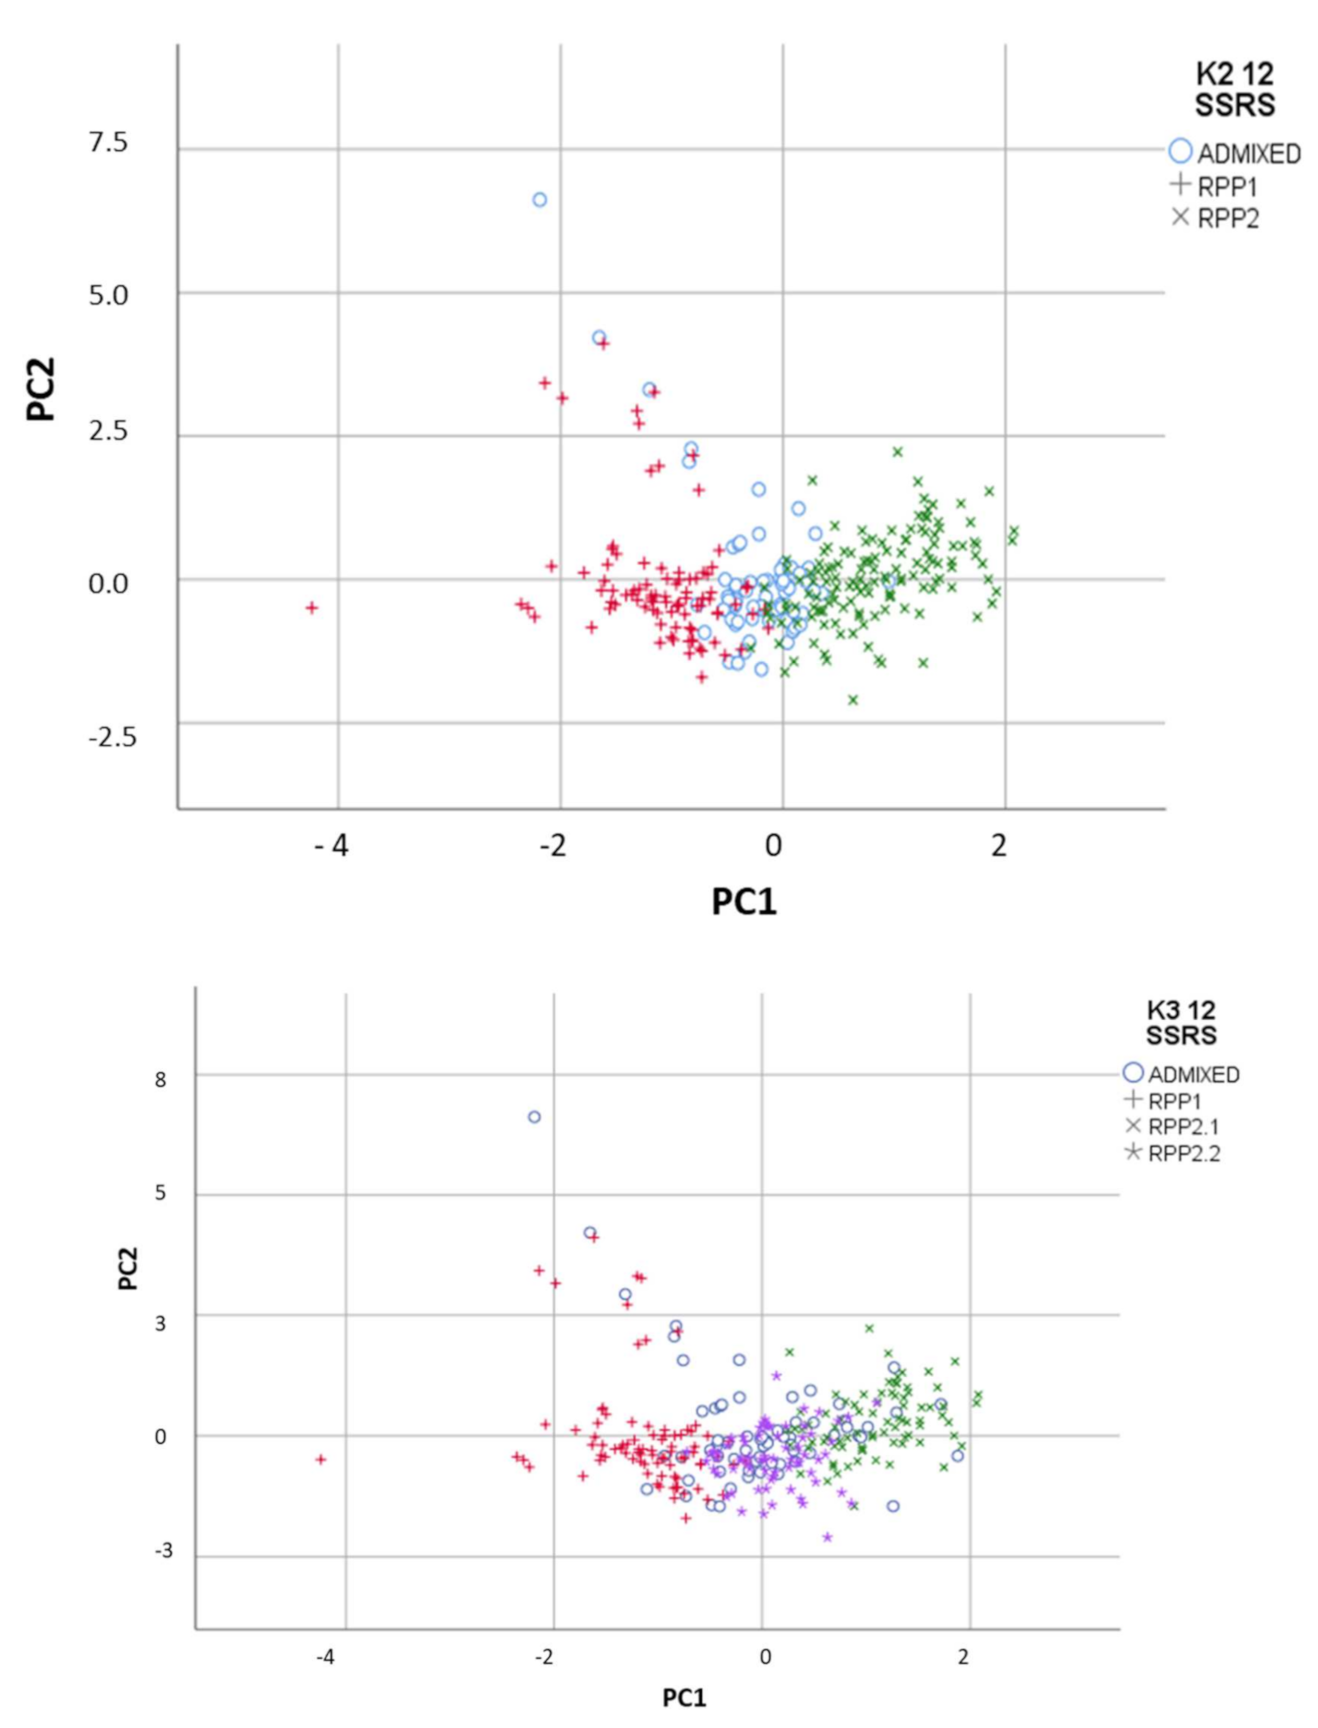
3.2.3. Factorial Component Analysis (FCA)

FCA showed congruent results with the Bayesian method, with the differentiation of the 2 RPPs in the first axis, RRP1 in the negative PC1 and RPP2 in the positive PC1 with the admixed accessions in between (Figure 2). Fst between RPP1 and RPP2 was 0.086 (p < 0.001).
Moreover, FCA separated natural populations in RPP2.2 from commercial cvs. in RPP2.1 (Figure 2). Fst between RPP1 and RPP2.1 (with commercial cvs.) was 0.107 (p< 0.001) and 0.076 with RPP2.2 (p < 0.001). Fst between RPP2.1 and RPP2.2 was 0.057 (p < 0.001).

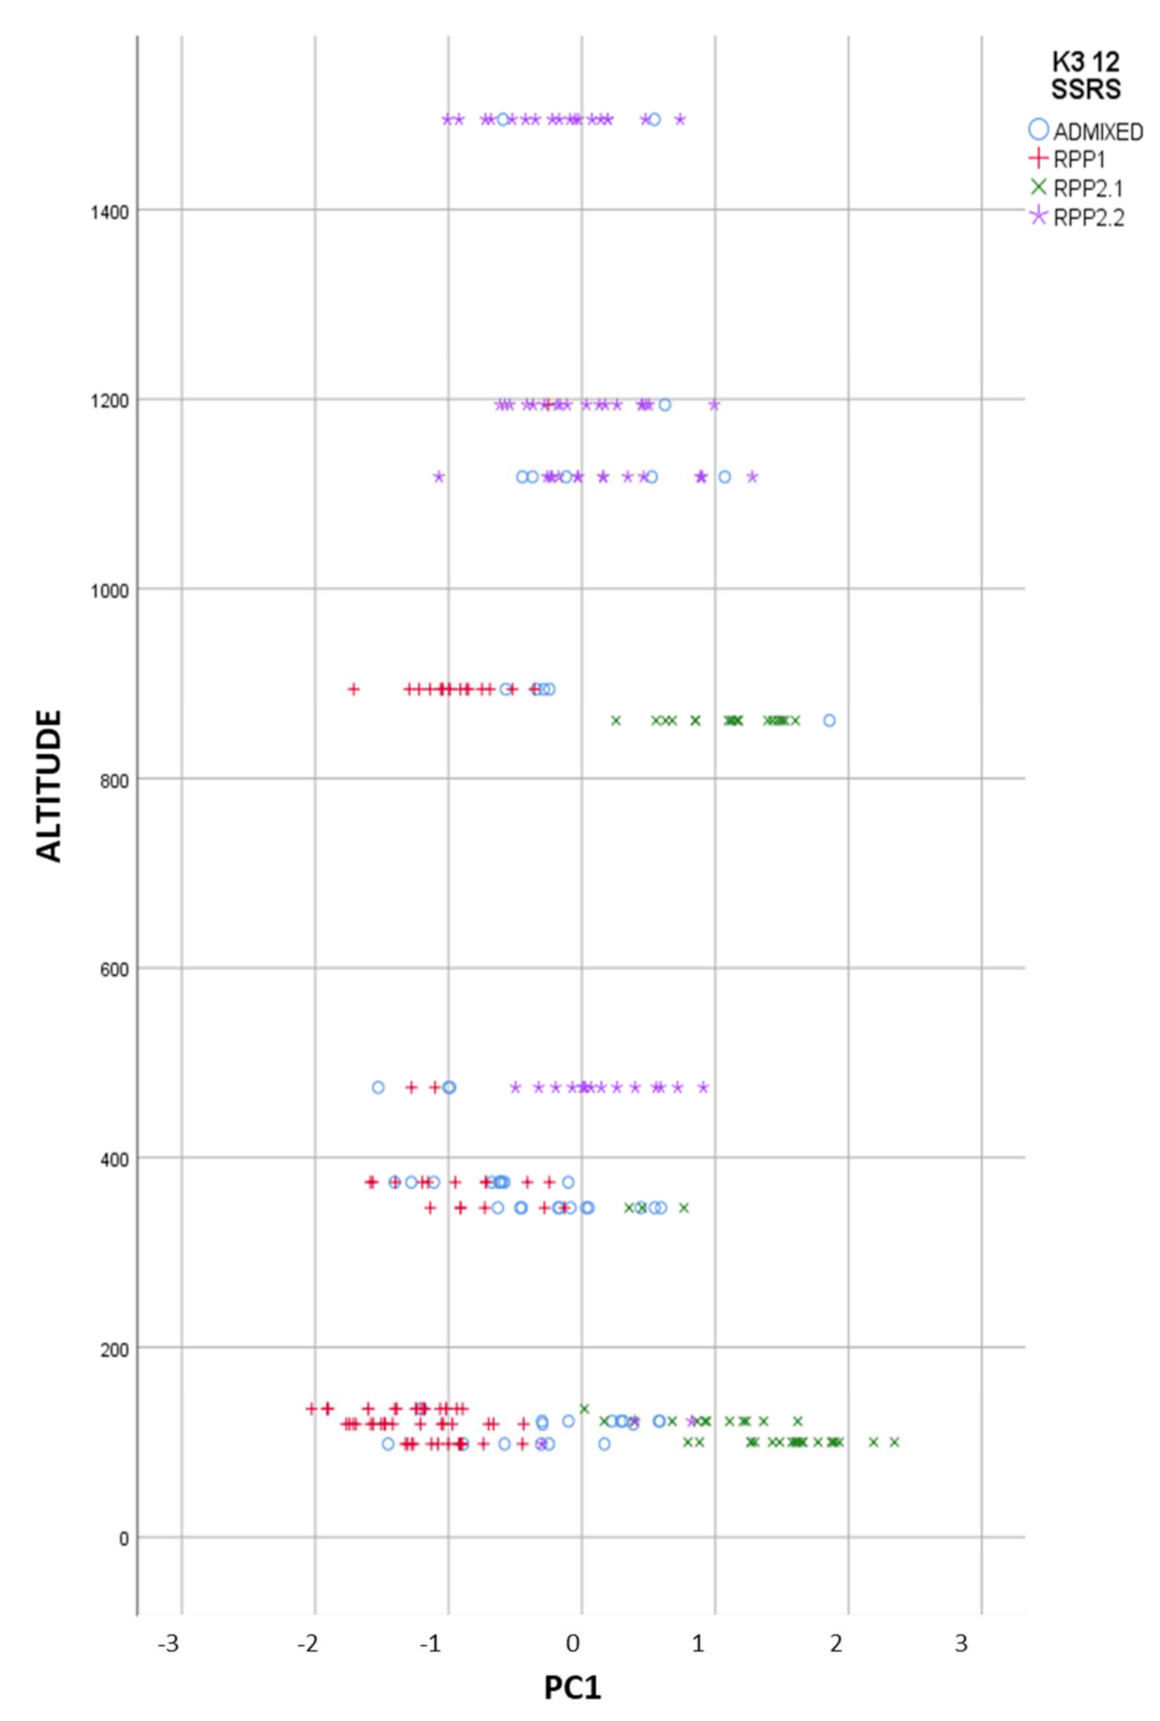
3.2.4. Genetic and Geographical Origin

When we represent the different populations in the FCA analysis, we clearly observed the introgressants into the natural populations, and the different level of purity in the samples (Figure 3). The most differentiated populations (RPP1) from commercial cvs. (RPP2.1) were from Asturias and Galicia, at altitudes lower than 1000 masl (Figure 4), meanwhile natural populations from RPP2.2 were found at altitudes between 400 and 1500 masl.

3.3. Genetic and Phenotypic Variation

Overlapping information obtained by genotypic variation (K = 2 and 3) with the phenotypic traits (Table 1), FLO and ENF showed significant variation (p < 0.05) when K = 2; and CRF (p < 0.01), HAB (p < 0.01) and ENF (p < 0.05) when K = 3 was considered. RPP1 showed the lowest FLO but 1803 in respect to RRP2. RPP1 and RPP2.2 had lower CRF and HAB and higher ENF than RPP2.1. Finally, RRP2.2 showed higher significant (p < 0.05) ALTIT than RPP1 and RPP2.1. When we represented the three main significant origins of phenotypic variation by K = 3, we can differentiate two main groups, those cultivars related with commercial cultivars (RRP2.1) with higher CRF and HAB and lower ENF, from those local cultivars with the opposite phenotypic characteristics (RPP1 and RPP2.2) (Figure 5).

4. Discussion

SSRs used in this study showed higher genetic variation than other studies on red clover, with double the average number of alleles per locus than in red clover in the Ukraine [20] and red clover populations from the NPGS-USDA core collection [21]. Genetic differentiation between RPP1 and 2 was higher (Fst = 0.08) than that found in the Ukraine with Fst = 0.07 of the variation between the two main populations detected by the Structure software [20].
Bayesian method, FCA and FST values indicated that some natural populations derived from commercial cultivars, those clustering in RPP2, while those from RPP1 had an independent origin. Genetic differentiation between the two main clusters, over 10%, were of the same order as those found in some other crops, such as Brassica rapa subsp. rapa L. (0.100) [22], wheat (0.132) [23], and lower than those of the lupine (0.179) [24].
Genetic differentiation between clusters was reflected in some phenotypic traits such as FLO, ENF, CRF, HAB and ENF as is found in other crops such as pear [25] and cowpea [26].
RRP2 showed a higher diversity, surely due to the different origins of the commercial cultivars, with 19.5% more alleles than RPP1 and higher than the NPGS-USDA core collection [21].
Our results differentiated those populations related to commercial cultivars from others probably derived from the wild, a different situation from what happened in the Ukraine [20] where no geographical differentiation was detected due to the genetic relationships between the genotypes and the original populations used in the breeding programmes promoting free trans-pollination.

5. Conclusions

We found a group of natural populations not related to commercial cultivars that can provide local cultivars with specific agronomic traits for production and plant breeding. Genetic and phenotypic variation was in general related, with the most differentiated group having lower CRF and HAB and higher ENF, which can make selection for agronomical traits difficult. However, 1803 showed phenotypic traits like the commercial group but with a different genetic background. SSRs indicated that most of the natural populations evaluated need recurrent selection to reduce the number of admixed accessions indicating natural hybridisation with other closer relatives. Moreover, SSRs can be used as a fast tool to remove introgressants to homogenize the natural populations found in northern Spain.

Supplementary Materials

The following are available online at https://www.mdpi.com/article/10.3390/agronomy11112275/s1, Table S1. Microsatellites (SSRs) included in the study. Table S2. Allelic Frequency and rare alleles (p < 0.05, in bold). Table S3. genetic structure (K2 and K3) with 12 SSRs. Table S4. FST and p-values when K = 2 and K = 3. Figure S1. DeltaK resulting of a Bayesian analysis with the Structure software (Pritchard et al. 2000) on 12 SSRs applied on violet clover.

Author Contributions

Methodology, C.I.F.-O., A.M.R.-C., J.E.L.-D. and S.P.-L.; Software, A.M.R.-C. and S.P.-L.; Resources, C.I.F.-O. and J.E.L.-D.; Data Curation, C.I.F.-O., A.M.R.-C., J.E.L.-D. and S.P.-L.; Writing—Original Draft Preparation, C.I.F.-O., A.M.R.-C. and S.P.-L.; Writing—Review & Editing, C.I.F.-O., A.M.R.-C. and S.P.-L.; Supervision, C.I.F.-O., A.M.R.-C., J.E.L.-D. and S.P.-L.; Project Administration, C.I.F.-O. and J.E.L.-D.; Funding Acquisition, C.I.F.-O. and J.E.L.-D. All authors have read and agreed to the published version of the manuscript.

Funding

This research was funded by FEADER-Xunta de Galicia grant number AC2018-06 (SFXIA). And The APC was funded by FEADER-Xunta de Galicia.

Institutional Review Board Statement

Not applicable.

Informed Consent Statement

Not applicable.

Data Availability Statement

Not applicable.

Acknowledgments

This work was supported by AC2018-06 (SFXIA) FEADER—Xunta de Galicia. C.I.F.-O is the beneficiary of a DOC-INIA-CCAA contract co-financed by the European Social Fund (CONV. 2015). J.E.L.-D is hired through a collaboration agreement between the Fundación Juana de Vega and AGACAL (Xunta de Galicia).

Conflicts of Interest

The authors declare no conflict of interest.

References

  1. Bowley, S.R.; Taylor, N.L.; Dougherty, C.T. Physiology and morphology of red clover. Adv. Agron. 1984, 37, 317–347. [Google Scholar] [CrossRef]
  2. López, J.E.; González, E.; Oliveira, J.A.; Vázquez, O.P. Caracterización agronómica y cianogénica de poblaciones naturales de trébol blanco y trébol violeta recolectadas en la Cordillera Cantábrica. In Soberanía Alimentaria e Agricultura Ecolóxica: Propostas de Acción; II Congreso de Agroecoloxía e Agricultura Ecolóxica en Galiza; Universidade de Vigo: Vigo, Spain, 2010; pp. 865–883. [Google Scholar]
  3. IBPGR. Forage Legume Descriptors; International Board for Plant Genetic Resources: Rome, Italy, 1984. [Google Scholar]
  4. UPOV. Guidelines for the Conduct of Tests for Distinctness, Homogeneity and Stability; Red Clover; TG/5/4; International Union for the Protection of New varieties of Plants: Geneve, Swisse, 1985. [Google Scholar]
  5. Isobe, S.; Kölliker, R.; Hisano, H.; Sasamoto, S.; Wada, T.; Klimenko, I.; Okumura, K.; Tabata, S. Construction of a consensus linkage map for red clover (Trifolium pratense L). BMC Plant Biol. 2009, 9, 57. [Google Scholar] [CrossRef] [Green Version]
  6. Radinovic, I.; Vasiljevic, S.; Brankovic, G.; Ahsyee, R.S.; Momirovic, U.; Perovic, D.; Surlan-Momirovic, G. Molecular characterization of red clover genotypes utilizing microsatellite markers. Chil. J. Agric. Res. 2017, 77, 41–47. [Google Scholar] [CrossRef] [Green Version]
  7. Sato, S.; Isobe, S.; Asamizu, E.; Ohmido, N.; Kataoka, R.; Nakamura, Y.; Kaneko, T.; Sakurai, N.; Okumura, K.; Klimenko, I.; et al. Comprehensive structural analysis of the genome of red clover (Trifolium pratense L.). DNA Res. 2005, 12, 301–364. [Google Scholar] [CrossRef] [Green Version]
  8. Red Clover Marker Database. Available online: http://marker.kazusa.or.jp/Red_clover (accessed on 18 April 2019).
  9. Pritchard, J.K.; Stephens, M.; Donnelly, P. Inference of population structure using multilocus genotype data. Genetics 2000, 155, 945–959. [Google Scholar] [CrossRef]
  10. Pritchard, J.K.; Stephens, M.; Rosenberg, N.A.; Donnelly, P. Association mapping in structured populations. Am. J. Hum. Genet. 2000, 67, 170–181. [Google Scholar] [CrossRef] [Green Version]
  11. Pereira-Lorenzo, S.; Ramos-Cabrer, A.M.; Barreneche, T.; Mattioni, C.; Villani, F.; Díaz-Hernández, B.; Martín, L.M.; Robles-Loma, A.; Cáceres, Y.; Martín, A. Instant domestication process of European chestnut cultivars. Ann. Appl. Biol 2019, 174, 74–85. [Google Scholar] [CrossRef] [Green Version]
  12. Porras-Hurtado, L.; Ruiz, Y.; Santos, C.; Phillips, C.; Carracedo, Á.; Lareu, M. An overview of STRUCTURE: Applications, parameter settings, and supporting software. Front. Genet. 2013, 4, 98. [Google Scholar] [CrossRef] [PubMed] [Green Version]
  13. Evanno, G.; Regnaut, S.; Goudet, J. Detecting the number of clusters of individuals using the software structure: A simulation study. Mol. Ecol. 2005, 14, 2611–2620. [Google Scholar] [CrossRef] [Green Version]
  14. Earl, D.A.; von Holdt, B.M. STRUCTURE HARVESTER: A website and program for visualizing STRUCTURE output and implementing the Evanno method. Conserv. Genet. Resour. 2012, 4, 359–361. [Google Scholar] [CrossRef]
  15. Weir, B.S.; Cockerham, C.C. Estimating F-Statistics for the analysis of population structure. Evolution 1984, 38, 1358–1370. [Google Scholar] [CrossRef] [PubMed]
  16. Meirmans, P.G.; Van Tienderen, P.H. genotype and genodive: Two programs for the analysis of genetic diversity of asexual organisms. Mol. Ecol. Notes 2004, 4, 792–794. [Google Scholar] [CrossRef]
  17. Goodman, L.A. The analysis of multidimensional contingency tables when some variables are posterior to others: A modified path analysis approach. Biometrika 1973, 60, 179–192. [Google Scholar] [CrossRef]
  18. Llauradó, M.; Moreno-Gonzalez, J. Classification of Northern Spanish populations of maize by methods of numerical taxonomy. I. Morphological traits. Maydica 1993, 38, 15–21. [Google Scholar]
  19. Pereira-Lorenzo, S.; Fernández-Loópez, J.; Moreno-Gonzaález, J. Variability and grouping of northwestern Spanish chestnut cultivars. I. morphological traits. J. Am. Soc. Hort. Sci. 1996, 121, 183–189. [Google Scholar] [CrossRef] [Green Version]
  20. Dugar, Y.N.; Popov, V.N. Genetic structure and diversity of Ukrainian red clover cultivars revealed by microsatellite markers. Open J. Genet. 2013, 3, 235–242. [Google Scholar] [CrossRef] [Green Version]
  21. Dias, P.M.B.; Julier, B.; Sampoux, J.-P.; Barre, P.; Dall’Agnol, M. Genetic diversity in red clover (Trifolium pratense L.) revealed by morphological and microsatellite (SSR) markers. Euphytica 2008, 160, 189–205. [Google Scholar] [CrossRef]
  22. Soengas, P.; Cartea, M.E.; Francisco, M.; Lema, M.; Velasco, P. Genetic structure and diversity of a collection of Brassica rapa subsp. rapa L. revealed by simple sequence repeat markers. J. Agric. Sci. 2011, 149, 617–624. [Google Scholar] [CrossRef] [Green Version]
  23. Joukhadar, R.; Daetwyler, H.D.; Bansal, U.K.; Gendall, A.R.; Hayden, M.J. Genetic Diversity, population structure and ancestral origin of Australian wheat. Front. Plant Sci. 2017, 8, 2115. [Google Scholar] [CrossRef] [Green Version]
  24. Atnaf, M.; Yao, N.; Martina, K.; Dagne, K.; Wegary, D.; Tesfaye, K. Molecular genetic diversity and population structure of Ethiopian white lupin landraces: Implications for breeding and conservation. PLoS ONE 2017, 12, e0188696. [Google Scholar] [CrossRef] [Green Version]
  25. Pereira-Lorenzo, S.; Dos Santos, A.; Ramos-Cabrer, A.M.; Sau, F.; Díaz-Hernández, M.B. Morphological variation in local pears from north-western Spain. Sci. Hortic. 2012, 138, 176–182. [Google Scholar] [CrossRef]
  26. Xiong, H.; Qin, J.; Shi, A.; Mou, B.; Wu, D.; Sun, J.; Shu, X.; Wang, Z.; Lu, W.; Ma, J.; et al. Genetic differentiation and diversity upon genotype and phenotype in cowpea (Vigna unguiculata L. Walp.). Euphytica 2018, 214, 4. [Google Scholar] [CrossRef]
Figure 1. Red clover growing in the greenhouse and the test field with plots of 40 × 40 cm with a design of random complete blocks with four repetitions (CIAM, Xunta de Galicia).
Agronomy 11 02275 g001
Figure 2. Reconstructed populations (RPP1, RPP2 and RPP2.2) obtained by the Structure software when K = 2 and 3 differentiated by Factorial Component Analysis, and admixed genotypes (qI < 80%).
Agronomy 11 02275 g002
Figure 3. Reconstructed populations (RPP1, RPP2.1 and RPP2.2), obtained by the Structure software when K = 3, by province and commercial cvs. included in the study, and admixed genotypes (qI < 80%).
Agronomy 11 02275 g003
Figure 4. Reconstructed populations (RPP1, RPP2.1 and RPP2.2), obtained by the Structure software when K = 3, by altitude, and admixed genotypes (qI < 80%).
Agronomy 11 02275 g004
Figure 5. Reconstructed populations (RPP1, RPP2.1 and RPP2.2), and admixed genotypes (qI < 80%), obtained by the Structure software when K = 3, by CERF (growth in the year of sowing), HAB (growth habit in early spring before flowering) and ENF (tolerance to pests and diseases).
Agronomy 11 02275 g005
Table 1. Populations and commercial cultivars studied (POP), location, reconstructed population obtained by the Structure software for K = 2 (1 and 2) and K = 3 (1, 2.1 and 2.2), province, altitude and phenotypic traits: FLO, number of days from 1 January 2019 when three heads per plant were flowering per plot; CRE, Growth in flowering (visual scale from 1 to 9, 1 being a little and 9 much); CRF, Growth in the year of sowing (visual scale from 1 to 9, 1 being a little and 9 much); HAB, Growth habit in early spring before flowering (1 = prostrate to 9 = erect); ENF, Tolerance to pests and diseases (1 = sensitive to 9 = resistant).
PopK2K3FLOCRECRFHABENFPROVINCE
(Origin)
ALTITUDE
180311120.604.925.896.625.62Asturias347
1804222140.084.023.583.457.05Leon1495
1805222142.143.754.313.565.44Leon1118
180611147.754.264.213.885.87Asturias894
1807222138.153.743.763.756.13Leon1194
18081198.834.806.536.527.46Asturias374
180911101.503.974.934.758.10Asturias135
18111193.974.185.004.297.31Asturias119
1847221142.534.438.147.924.73A Coruña100
2751221111.665.587.177.155.62Lugo122
2752221146.054.607.617.525.36Cantabria861
2760222146.976.235.595.885.13Pontevedra474
276211136.924.365.143.407.55A Coruña98
KARIM221147.434.457.667.385.25France
MARAGATO221145.094.338.188.197.74Spain
MARINO221143.794.126.226.176.12Germany
SUEZ221148.183.116.937.496.32France
Publisher’s Note: MDPI stays neutral with regard to jurisdictional claims in published maps and institutional affiliations.

